aspen bermuda limited - bermuda monetary authority full filings class 4/aspen bermuda... · 1 aspen...
TRANSCRIPT
Aspen Bermuda Limited
Financial Statements
(With Independent Auditor’s Report Thereon)
December 31, 2012 and 2011
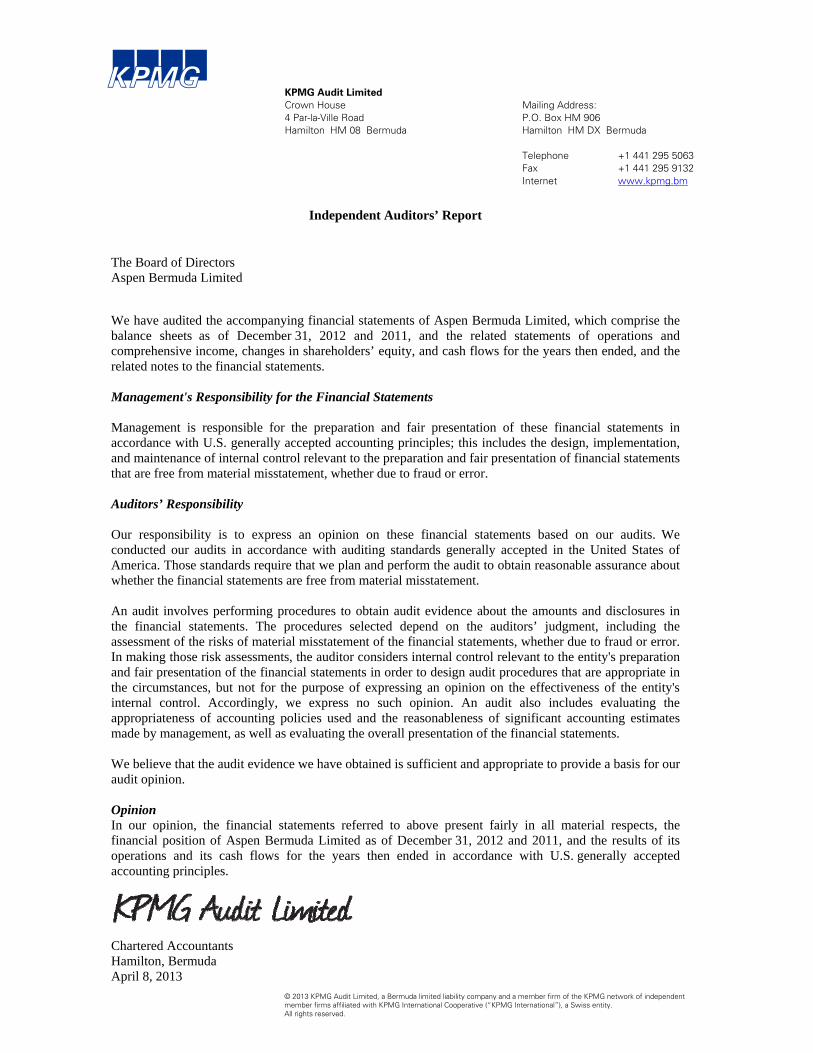
KPMG Audit Limited Crown House 4 Par-la-Ville Road Hamilton HM 08 Bermuda
Mailing Address: P.O. Box HM 906 Hamilton HM DX Bermuda Telephone +1 441 295 5063 Fax +1 441 295 9132 Internet www.kpmg.bm
ABCD
© 2013 KPMG Audit Limited, a Bermuda limited liability company and a member firm of the KPMG network of independent member firms affiliated with KPMG International Cooperative (“KPMG International”), a Swiss entity. All rights reserved.
Independent Auditors’ Report
The Board of Directors Aspen Bermuda Limited
We have audited the accompanying financial statements of Aspen Bermuda Limited, which comprise the balance sheets as of December 31, 2012 and 2011, and the related statements of operations and comprehensive income, changes in shareholders’ equity, and cash flows for the years then ended, and the related notes to the financial statements. Management's Responsibility for the Financial Statements Management is responsible for the preparation and fair presentation of these financial statements in accordance with U.S. generally accepted accounting principles; this includes the design, implementation, and maintenance of internal control relevant to the preparation and fair presentation of financial statements that are free from material misstatement, whether due to fraud or error. Auditors’ Responsibility Our responsibility is to express an opinion on these financial statements based on our audits. We conducted our audits in accordance with auditing standards generally accepted in the United States of America. Those standards require that we plan and perform the audit to obtain reasonable assurance about whether the financial statements are free from material misstatement. An audit involves performing procedures to obtain audit evidence about the amounts and disclosures in the financial statements. The procedures selected depend on the auditors’ judgment, including the assessment of the risks of material misstatement of the financial statements, whether due to fraud or error. In making those risk assessments, the auditor considers internal control relevant to the entity's preparation and fair presentation of the financial statements in order to design audit procedures that are appropriate in the circumstances, but not for the purpose of expressing an opinion on the effectiveness of the entity's internal control. Accordingly, we express no such opinion. An audit also includes evaluating the appropriateness of accounting policies used and the reasonableness of significant accounting estimates made by management, as well as evaluating the overall presentation of the financial statements. We believe that the audit evidence we have obtained is sufficient and appropriate to provide a basis for our audit opinion. Opinion In our opinion, the financial statements referred to above present fairly in all material respects, the financial position of Aspen Bermuda Limited as of December 31, 2012 and 2011, and the results of its operations and its cash flows for the years then ended in accordance with U.S. generally accepted accounting principles.
Chartered Accountants Hamilton, Bermuda April 8, 2013
1
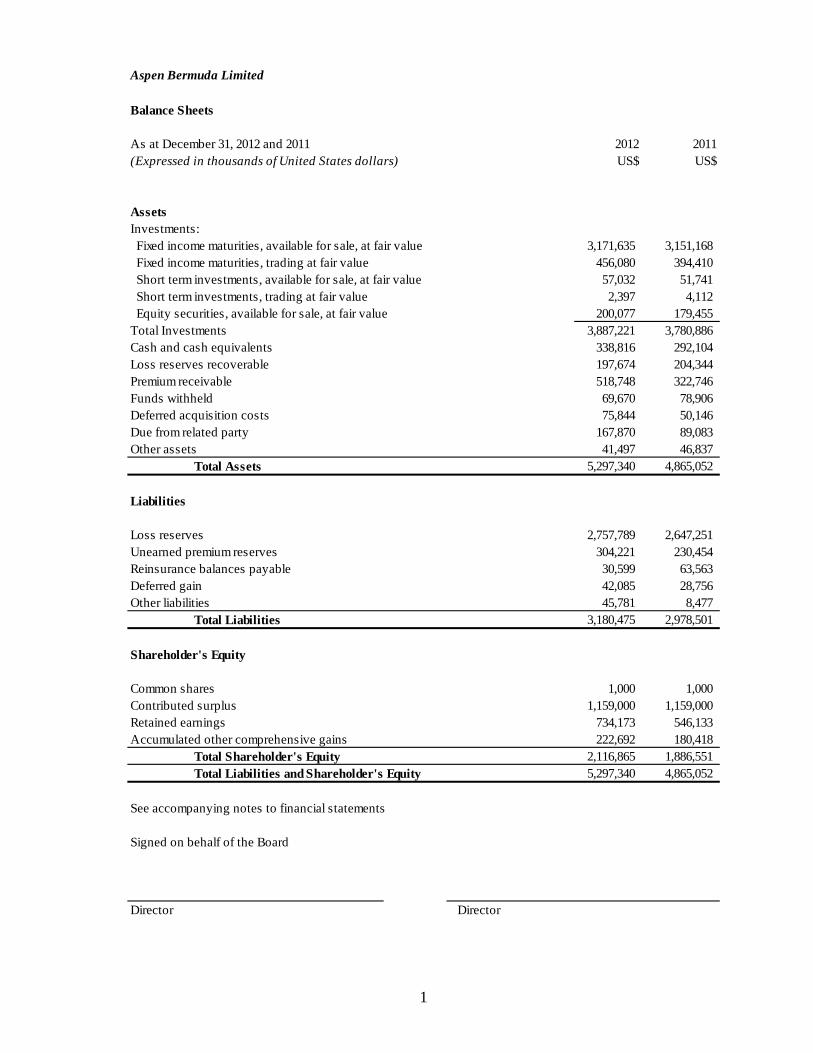
Aspen Bermuda Limited
Balance Sheets
As at December 31, 2012 and 2011 2012 2011(Expressed in thousands of United States dollars) US$ US$
AssetsInvestments: Fixed income maturities, available for sale, at fair value 3,171,635 3,151,168 Fixed income maturities, trading at fair value 456,080 394,410 Short term investments, available for sale, at fair value 57,032 51,741 Short term investments, trading at fair value 2,397 4,112 Equity securities, available for sale, at fair value 200,077 179,455 Total Investments 3,887,221 3,780,886 Cash and cash equivalents 338,816 292,104 Loss reserves recoverable 197,674 204,344 Premium receivable 518,748 322,746 Funds withheld 69,670 78,906 Deferred acquisition costs 75,844 50,146 Due from related party 167,870 89,083 Other assets 41,497 46,837
Total Assets 5,297,340 4,865,052
Liabilities
Loss reserves 2,757,789 2,647,251 Unearned premium reserves 304,221 230,454 Reinsurance balances payable 30,599 63,563 Deferred gain 42,085 28,756 Other liabilities 45,781 8,477
Total Liabilities 3,180,475 2,978,501
Shareholder's Equity
Common shares 1,000 1,000 Contributed surplus 1,159,000 1,159,000 Retained earnings 734,173 546,133 Accumulated other comprehensive gains 222,692 180,418
Total Shareholder's Equity 2,116,865 1,886,551 Total Liabilities and Shareholder's Equity 5,297,340 4,865,052
See accompanying notes to financial statements
Signed on behalf of the Board
Director Director
2
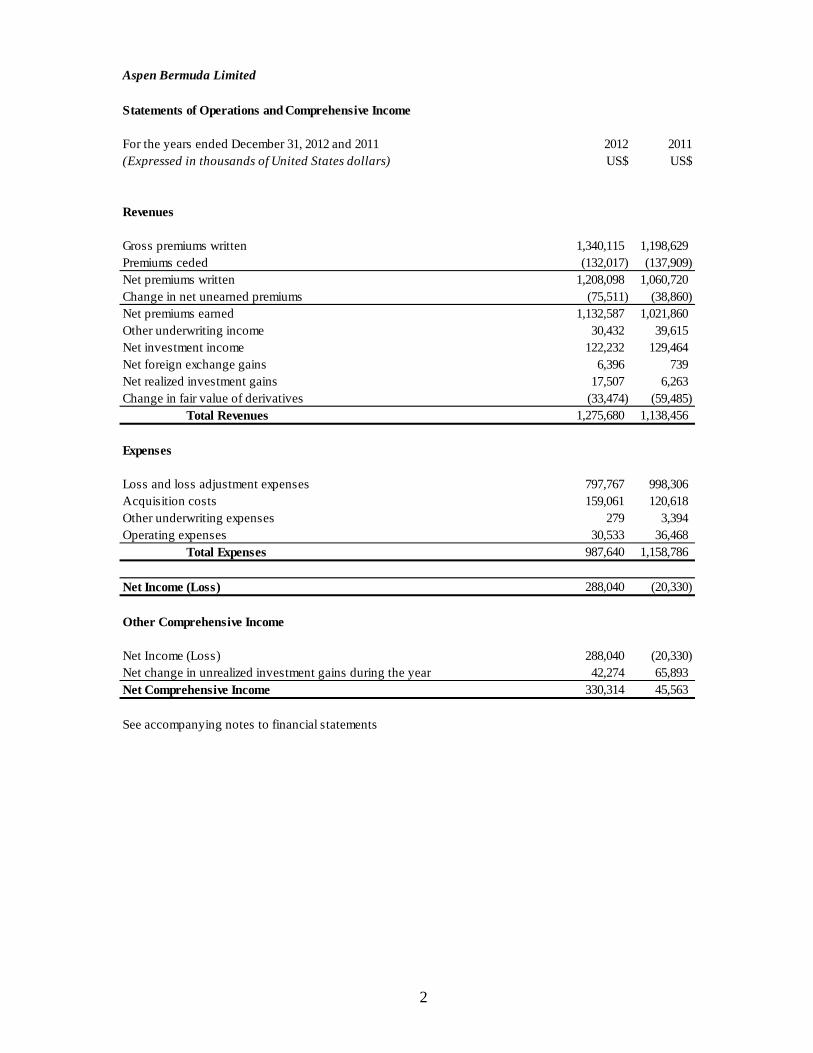
Aspen Bermuda Limited
Statements of Operations and Comprehensive Income
For the years ended December 31, 2012 and 2011 2012 2011(Expressed in thousands of United States dollars) US$ US$
Revenues
Gross premiums written 1,340,115 1,198,629 Premiums ceded (132,017) (137,909) Net premiums written 1,208,098 1,060,720 Change in net unearned premiums (75,511) (38,860) Net premiums earned 1,132,587 1,021,860 Other underwriting income 30,432 39,615 Net investment income 122,232 129,464 Net foreign exchange gains 6,396 739 Net realized investment gains 17,507 6,263 Change in fair value of derivatives (33,474) (59,485)
Total Revenues 1,275,680 1,138,456
Expenses
Loss and loss adjustment expenses 797,767 998,306 Acquisition costs 159,061 120,618 Other underwriting expenses 279 3,394 Operating expenses 30,533 36,468
Total Expenses 987,640 1,158,786
Net Income (Loss) 288,040 (20,330)
Other Comprehensive Income
Net Income (Loss) 288,040 (20,330) Net change in unrealized investment gains during the year 42,274 65,893 Net Comprehensive Income 330,314 45,563
See accompanying notes to financial statements
3
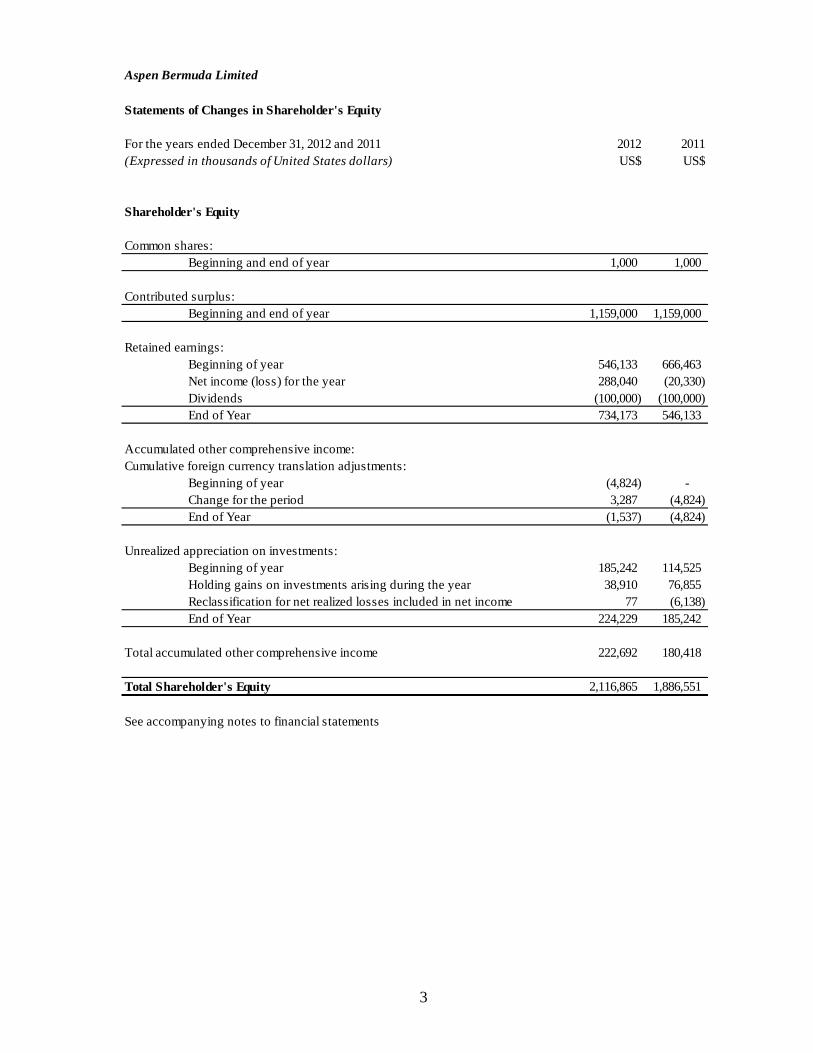
Aspen Bermuda Limited
Statements of Changes in Shareholder's Equity
For the years ended December 31, 2012 and 2011 2012 2011(Expressed in thousands of United States dollars) US$ US$
Shareholder's Equity
Common shares:Beginning and end of year 1,000 1,000
Contributed surplus:Beginning and end of year 1,159,000 1,159,000
Retained earnings:Beginning of year 546,133 666,463 Net income (loss) for the year 288,040 (20,330) Dividends (100,000) (100,000) End of Year 734,173 546,133
Accumulated other comprehensive income:Cumulative foreign currency translation adjustments:
Beginning of year (4,824) - Change for the period 3,287 (4,824) End of Year (1,537) (4,824)
Unrealized appreciation on investments:Beginning of year 185,242 114,525 Holding gains on investments arising during the year 38,910 76,855 Reclassification for net realized losses included in net income 77 (6,138) End of Year 224,229 185,242
Total accumulated other comprehensive income 222,692 180,418
Total Shareholder's Equity 2,116,865 1,886,551
See accompanying notes to financial statements
4
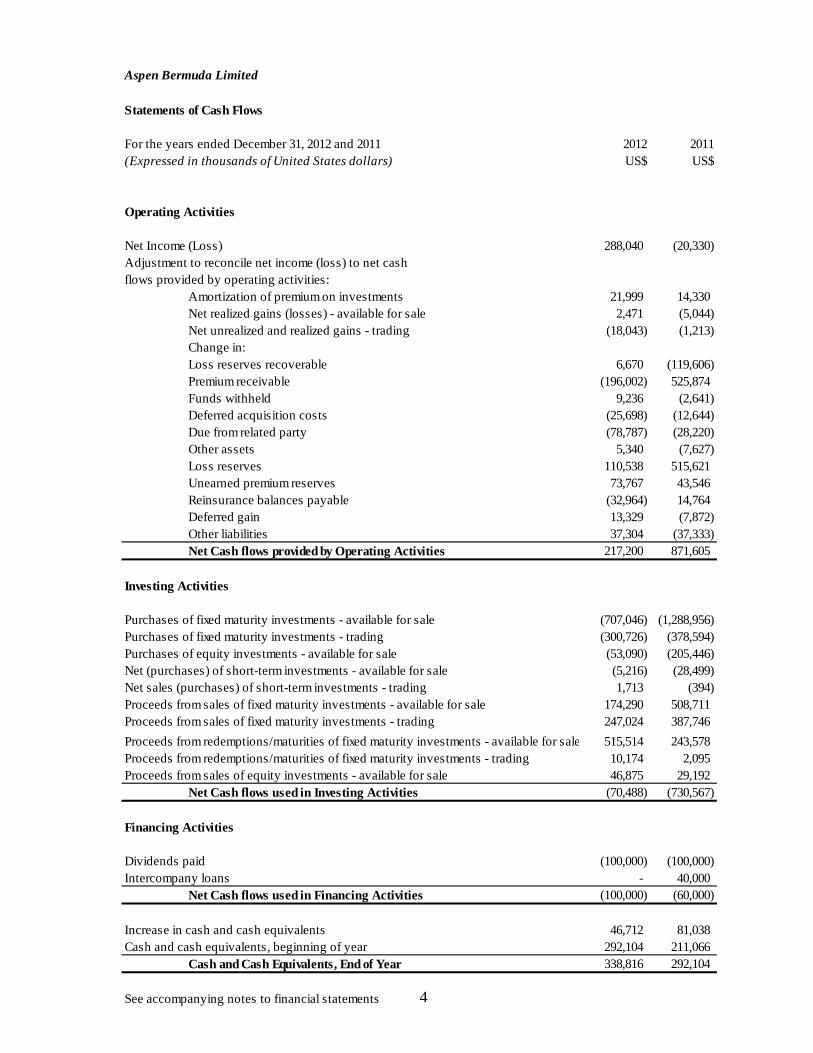
Aspen Bermuda Limited
Statements of Cash Flows
For the years ended December 31, 2012 and 2011 2012 2011(Expressed in thousands of United States dollars) US$ US$
Operating Activities
Net Income (Loss) 288,040 (20,330)
Amortization of premium on investments 21,999 14,330 Net realized gains (losses) - available for sale 2,471 (5,044) Net unrealized and realized gains - trading (18,043) (1,213) Change in:Loss reserves recoverable 6,670 (119,606) Premium receivable (196,002) 525,874 Funds withheld 9,236 (2,641) Deferred acquisition costs (25,698) (12,644) Due from related party (78,787) (28,220) Other assets 5,340 (7,627) Loss reserves 110,538 515,621 Unearned premium reserves 73,767 43,546 Reinsurance balances payable (32,964) 14,764 Deferred gain 13,329 (7,872) Other liabilities 37,304 (37,333) Net Cash flows provided by Operating Activities 217,200 871,605
Investing Activities
Purchases of fixed maturity investments - available for sale (707,046) (1,288,956) Purchases of fixed maturity investments - trading (300,726) (378,594) Purchases of equity investments - available for sale (53,090) (205,446) Net (purchases) of short-term investments - available for sale (5,216) (28,499) Net sales (purchases) of short-term investments - trading 1,713 (394) Proceeds from sales of fixed maturity investments - available for sale 174,290 508,711 Proceeds from sales of fixed maturity investments - trading 247,024 387,746
Proceeds from redemptions/maturities of fixed maturity investments - available for sale 515,514 243,578 Proceeds from redemptions/maturities of fixed maturity investments - trading 10,174 2,095 Proceeds from sales of equity investments - available for sale 46,875 29,192
Net Cash flows used in Investing Activities (70,488) (730,567)
Financing Activities
Dividends paid (100,000) (100,000) Intercompany loans - 40,000
Net Cash flows used in Financing Activities (100,000) (60,000)
Increase in cash and cash equivalents 46,712 81,038 Cash and cash equivalents, beginning of year 292,104 211,066
Cash and Cash Equivalents, End of Year 338,816 292,104
See accompanying notes to financial statements
Adjustment to reconcile net income (loss) to net cash flows provided by operating activities:
Aspen Bermuda Limited Notes to Financial Statements December 31, 2012 and 2011 (All amounts expressed in United States dollars – amounts in tables expressed in thousands of United States dollars)
5
1. History and organization Aspen Bermuda Limited (“the Company”), formerly Aspen Insurance Limited, was incorporated under the laws of Bermuda, and is a wholly owned subsidiary of Aspen Insurance Holdings Limited (“Holdings”). Aspen Insurance Limited was renamed Aspen Bermuda Limited with effect from January 1, 2012. The Company is licensed under the Insurance Act 1978, amendments thereto and related regulations to write general business as a Class 4 insurer with effect from December 9, 2002. The Company writes various shares of excess of loss reinsurance contracts and pro rata treaties. The excess of loss contracts are mainly property risk excess and catastrophe policies reinsuring non-affiliated insurers located mainly in the United States of America, Europe and Japan. The pro rata treaties cover mainly property risks reinsuring non-affiliated insurers located in the United States of America and Japan. The Company also writes direct excess casualty insurance and management liability insurance. The Company assumes certain risks of Aspen Insurance UK Limited (“Aspen UK”), a UK corporation, Aspen Specialty Insurance Company (“ASIC”), a North Dakota corporation, Aspen American Insurance Company (“AAIC”), a Texas corporation, Aspen Underwriting Limited (“AUL”), a UK corporation and Aspen Syndicate 4711 at Lloyds, , all of which are wholly-owned subsidiaries of Holdings. The Company also participates in a reciprocal quota share arrangement with Aspen UK in relation to property reinsurance business. In addition to the quota share arrangements the Company entered into a loss portfolio transfer agreement (“LPT”) with Aspen UK. Under the terms of the LPT the Company provides coverage to Aspen UK for a proportionate share of Aspen UK’s existing liabilities on their international casualty reinsurance, US casualty reinsurance, UK employers liability insurance and casualty facultative lines of business for 2006 and prior accident years. The effective date of the transfer was October 1, 2009. During 2012 the Company continued to participate in two 2009 incepting agreements which provide coverage for the adverse development of existing loss reserves within ASIC and Aspen Syndicate 4711 at December 31, 2008. The Company also provided a Deed of Guarantee to ASIC and AAIC in relation to their third-party reinsurance balances recoverable. 2. Basis of preparation and significant accounting policies The accompanying financial statements are prepared in accordance with United States Generally Accepted Accounting Principles (“U.S. GAAP”).
(a) Use of estimates Assumptions and estimates made by Management have a significant effect on the amounts reported within the financial statements. The most significant of these relate to the loss reserves, loss reserves recoverable, gross written premiums and commissions which have not been reported to the Company such as those relating to proportional treaty reinsurance contracts, and the fair value of derivative financial instruments. All material assumptions and estimates are regularly reviewed and adjustments made as necessary, but actual results could differ significantly from estimates.
(b) Accounting for Reinsurance Operations Premiums written and ceded. Premiums written and ceded are recorded at inception of the policy and are earned and expensed, respectively, over the terms of the risk period. For excess of loss contracts, written premiums are estimated based on the deposit premium and any exposure based adjustment premiums that may be applicable as defined in the contract. As these contracts are generally written on a losses occurring basis, the risk period is typically the same as the term of the contract. For contracts
Aspen Bermuda Limited Notes to Financial Statements December 31, 2012 and 2011 (All amounts expressed in United States dollars – amounts in tables expressed in thousands of United States dollars)
6
written on a risk attaching basis, the risk period follows the terms of the underlying policies. Written premiums on contracts that have adjustable provisions also include adjustment premiums that are based on the projected experience of such contracts. Premium adjustments are recognized in the period in which they are determined. Premiums on proportional treaty contracts are generally not reported to the Company until after the reinsurance coverage is in force. As a result, an estimate of these ‘‘pipeline’’ premiums is recorded. The Company estimates pipeline premiums based on estimates of ultimate premium, calculated unearned premium and premiums reported from ceding companies. The Company estimates commissions, losses and loss adjustment expenses related to these premiums. Adjustments to these estimates are recognized in the period in which they are determined. The portion of the premiums written and ceded relating to the unexpired risk period is reflected as unearned premium reserves and deferred reinsurance premiums, respectively, on the balance sheet. Reinstatement premiums are the premiums charged for the restoration of the reinsurance limit of an excess of loss contract to its full amount after payment by the reinsurer of losses as a result of an occurrence. Reinstatement premiums are recognized at the time losses are recorded and are earned immediately. Premiums receivable are recorded net of any provision for doubtful accounts and are recorded as premium receivable. Loss Portfolio Transfers and Adverse Development Contracts. From time to time the Company may underwrite retroactive loss portfolio transfer (“LPT”) contracts. The Company also underwrites contracts which provide coverage for the adverse development of existing reserves. These contracts provide cover for past insured events and are therefore accounted for as retroactive reinsurance. These contracts are evaluated to determine whether they meet the established criteria for reinsurance accounting. Where these criteria are met a reinsurance liability is established equal to any loss reserves assumed. Consideration in respect of retroactive reinsurance is reported as premium receivable. Where the consideration is in excess of the recorded liability, the resulting gain is deferred and amortized to other underwriting income over the estimated remaining settlement period using the recovery method. Any subsequent change in the estimate of the reinsurance liability recorded results in an adjustment to the deferred gain with an offsetting charge or credit to other underwriting expenses or income, respectively. Where recorded liabilities exceed the consideration received the excess is charged to income as loss and loss adjustment expenses. Acquisition costs. The costs directly related to writing an insurance policy are referred to as policy acquisition expenses and consist of commissions, premium taxes and profit commissions. With the exception of profit commission, these expenses are incurred when a policy is issued and are deferred and amortized over the same period as the corresponding premiums are recorded as revenues. Profit commissions are accrued to the balance sheet date and are calculated as a percentage of underwriting profit. On a regular basis a recoverability analysis is performed of the deferred policy acquisition costs in relation to the expected recognition of revenues, including anticipated investment income, and adjustments, if any, are reflected as period costs. Should the analysis indicate that the acquisition costs are unrecoverable, further analyses are performed to determine if a reserve is required to provide for losses which may exceed the related unearned premium.
Other underwriting income and expense. Income and expenses in relation to contracts which are accounted for as retroactive reinsurance or deposits and contracts which generate fees or other income are included as other underwriting income and expense and recognized when earned. Losses and Loss Adjustment Expenses. Losses represent the amount paid or expected to be paid to claimants in respect of events that have occurred on or before the balance sheet date. The costs of investigating, resolving and processing these claims are known as loss adjustment expenses (‘‘LAE’’). The statement of operations records
Aspen Bermuda Limited Notes to Financial Statements December 31, 2012 and 2011 (All amounts expressed in United States dollars – amounts in tables expressed in thousands of United States dollars)
7
losses net of reinsurance, meaning that gross losses and loss adjustment expenses incurred are reduced by the amounts recovered or expected to be recovered under reinsurance contracts. Insurance reserves are established for the total unpaid cost of claims and LAE, which cover events that have occurred by the balance sheet date. These reserves also reflect the Company’s estimates of the total cost of claims incurred but not yet reported to it (‘‘IBNR’’). Claim reserves are reduced for estimated amounts of salvage and subrogation recoveries. Estimated amounts recoverable from reinsurers on unpaid losses and LAE are reflected as assets. For reported claims, reserves are established on a case-by-case basis within the parameters of coverage provided in the insurance policy or reinsurance agreement. For IBNR claims, reserves are estimated using established actuarial methods. Both case and IBNR reserve estimates consider such variables as past loss experience, changes in legislative conditions, changes in judicial interpretation of legal liability policy coverages and inflation. Because many of the coverages underwritten involve claims that may not be ultimately settled for many years after they are incurred, subjective judgments as to the ultimate exposure to losses are an integral and necessary component of the loss reserving process. Reserves are established by the selection of a ‘best estimate’ from within a range of estimates. The Company regularly reviews its reserves, using a variety of statistical and actuarial techniques to analyse current claims costs, frequency and severity data, and prevailing economic, social and legal factors. Reserves established in prior periods are adjusted as claim experience develops and new information becomes available. Adjustments to previously estimated reserves are reflected in the financial results of the period in which the adjustments are made. Whilst the reported reserves make a reasonable provision for unpaid claims and LAE obligations, it should be noted that the process of estimating required reserves does, by its very nature, involve considerable uncertainty. The level of uncertainty can be influenced by factors such as the existence of coverage with long duration payment patterns and changes in claims handling practices, as well as the factors noted above. Ultimate actual payments for claims and LAE could turn out to be significantly different from the estimates.
(c) Investments The Company’s investments are managed following prudent standards of diversification. Specific provisions limit the allowable holdings of a single issue and issuers. Fixed Maturity Investments. Investments in fixed maturities are classified as available for sale or trading and are reported at estimated fair value. Investment transactions are recorded on the trade date with balances pending settlement reflected in the balance sheet as other assets or other liabilities. Fair values are determined based on quoted market prices and other data provided by internationally recognized independent pricing sources through the Company’s third-party pricing service. Where multiple quotes or prices are obtained, a price source hierarchy is maintained in order to determine which price source provides the fair value (i.e., a price obtained from a pricing service with more seniority in the hierarchy will be used over a less senior one in all cases). The hierarchy prioritizes pricing services based on availability and reliability and assigns the highest priority to index providers. For mortgage-backed and other asset-backed debt securities, fair value includes estimates regarding prepayment assumptions, which are based on current market conditions. Equity securities. Equity securities comprise U.S. and foreign equity securities and are classified as available for sale and carried on the balance sheet at estimated fair value. The fair values are based on quoted market prices from independent pricing sources. Short-term Investments. Short-term investments are classified as available for sale or trading and are reported at estimated fair value. Short-term investments primarily comprise highly liquid debt securities with a maturity greater than three months but less than one year from the date of purchase.
Aspen Bermuda Limited Notes to Financial Statements December 31, 2012 and 2011 (All amounts expressed in United States dollars – amounts in tables expressed in thousands of United States dollars)
8
Gains and Losses. Realized gains and losses from the available for sale and trading portfolios are the result of sales of securities and are determined using the first in first out cost method. For the available for sale portfolio realized gains and losses will include adjustments to the cost basis as a result of other-than-temporary impairment charges. Unrealized gains and losses represent the difference between the cost/amortized cost of the security and its market value at the reporting date and are included in net change in unrealized investment gains during the year in other comprehensive income for securities classified as available for sale and in net realized investment gains in the statement of operations for securities classified as trading. Cash and Cash Equivalents. Cash and cash equivalents are carried at fair value. Cash and cash equivalents comprise cash on hand, deposits held on call with banks and other short-term highly liquid investments due to mature within three months and which are subject to insignificant risk of change in fair value. Other-than-temporary Impairment of Investments (“OTTI”). A security is impaired when its fair value is below its cost or amortized cost. The Company reviews its investment portfolio each quarter on an individual security basis for potential other-than-temporary impairment (“OTTI”) based on criteria including issuer-specific circumstances, credit ratings actions and general macro-economic conditions. Other-than-temporary impairment on fixed income securities is deemed to occur when there is no objective evidence to support recovery in value of a security and a) the Company intends to sell the security or more likely than not will be required to sell the security before recovery of its cost or adjusted amortized cost basis or b) it is deemed probable that the Company will be unable to collect all amounts due according to the contractual terms of the individual security. In the first case, the entire unrealized loss position is taken as an OTTI charge to realized losses in earnings. In the second case, the unrealized loss is separated into the amount related to credit loss and the amount related to all other factors. The OTTI charge related to credit loss is recognized in realized losses in earnings and the amount related to all other factors is recognized in other comprehensive income. The cost basis of the investment is reduced accordingly and no adjustments to the cost basis are made for subsequent recoveries in value. Equity securities do not have a maturity date and therefore the Company’s review of these securities utilizes a higher degree of judgment. In its review, the Company considers its ability and intent to hold an impaired equity security for a reasonable period of time to allow for a full recovery. Where an equity security is considered to be other-than-temporarily impaired, the entire charge is recognized in realized losses in earnings. The cost basis of the investment is reduced accordingly and no adjustments to the cost basis are made for subsequent recoveries in value. Although the Company reviews each security on a case by case basis, it has also established parameters focusing on the extent and duration of impairment to help identify securities in an unrealized loss position which are other-than-temporarily impaired. For fixed maturities, the Company considers securities which have been in an unrealized loss position for 12 months or more which currently have a market value of more than 20% below cost to be other-than-temporarily impaired. For equities, the Company considers declines in value to a level of 20% or more below cost for 12 consecutive months to indicate the security to be other-than-temporarily impaired. Investment Income. Investment income is recognized when earned and includes amounts received and accrued in respect of periodic interest (“coupons”) payable to the Company by the issuer of fixed income securities, equity dividends and interest credited on cash and cash equivalents. It also includes amortization of premium and accretion of discount in respect of fixed income securities. Investment management fees and custody fees are charged against net investment income reported in the statement of operations.
(d) Accounting for Derivative Financial Instruments The Company enters into derivative financial instruments such as swaps and forward contracts in order to manage certain investment portfolio risk and exposures, foreign currency exposures and credit exposures in relation to our reinsurance counterparties. The Company accounts for its derivatives in accordance with FASB ASC Topic 815,
Aspen Bermuda Limited Notes to Financial Statements December 31, 2012 and 2011 (All amounts expressed in United States dollars – amounts in tables expressed in thousands of United States dollars)
9
Derivatives and Hedging, which requires all derivatives to be recorded at fair value on the Company’s balance sheet as either assets or liabilities, depending on their rights and obligations. Changes in fair value are reported as change in fair value of derivatives in the statement of operations as they occur. The Company does not apply hedge accounting.
(e) Foreign Currency Translation The functional currency of the Company is the United States dollar. Monetary assets and liabilities denominated in foreign currencies are translated at exchange rates in effect at the balance sheet date, whilst non-monetary assets and liabilities are translated at historical rates. Revenues and expenses are translated at the transaction date exchange rates. Foreign exchange gains and losses are included in the statement of operations, except where they relate to the movement in fair value of available for sale securities when they are recorded as a component of other comprehensive income.
(f) Fair Value of Financial Instruments
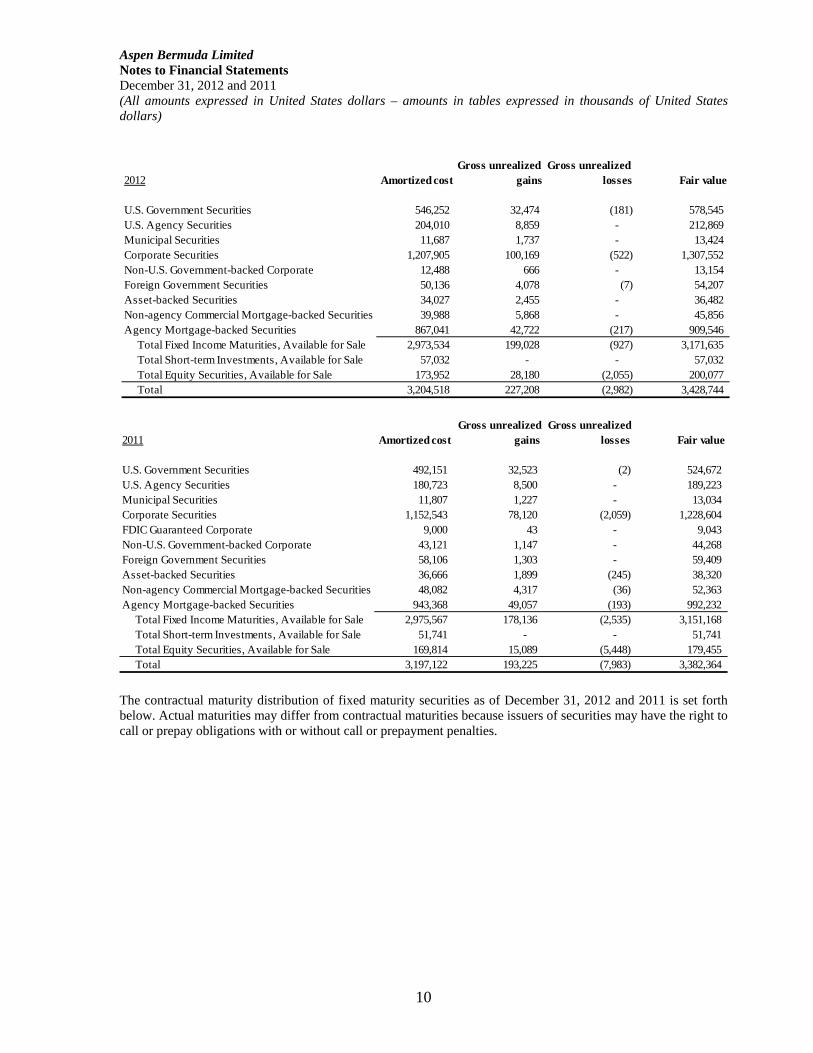
The carrying values of cash and cash equivalents, premium receivable, funds withheld, due from related party, other assets, reinsurance balances payable and other liabilities approximate their respective market values due to their short-term nature. The estimates of fair values presented herein are subjective in nature and are not necessarily indicative of the amounts that the Company would actually realize in a current market exchange. However, any differences would not be expected to be material. Certain balances such as loss reserves recoverable, deferred acquisition costs, loss reserves and unearned premium reserves are excluded from fair value disclosure. Thus the total fair value amounts cannot be aggregated to determine the underlying economic value of the Company. 3. Investments The Company’s Board of Directors establishes investment guidelines in accordance with the Investment Committee of the Board of Directors of Holdings and supervises the Company’s investment activity. The investment guidelines specify minimum criteria on the overall credit quality and liquidity characteristics of the portfolio. They include limitations on the size of certain holdings as well as restrictions on purchasing certain types of securities. Management and the Investment Committee review the Company’s investment performance, its compliance with investment objectives and guidelines, and assess credit and market risk concentrations and exposures to issuers. Fixed Income Maturities, Short-Term Investments and Equities - Available for Sale. The following presents the cost or amortized cost, gross unrealized gains and losses, and fair market value of available for sale investments in fixed income maturities, short-term investments and equities as at December 31, 2012 and 2011:
Aspen Bermuda Limited Notes to Financial Statements December 31, 2012 and 2011 (All amounts expressed in United States dollars – amounts in tables expressed in thousands of United States dollars)
10
The contractual maturity distribution of fixed maturity securities as of December 31, 2012 and 2011 is set forth below. Actual maturities may differ from contractual maturities because issuers of securities may have the right to call or prepay obligations with or without call or prepayment penalties.
2012 Amortized costGross unrealized
gainsGross unrealized
losses Fair value
U.S. Government Securities 546,252 32,474 (181) 578,545 U.S. Agency Securities 204,010 8,859 - 212,869 Municipal Securities 11,687 1,737 - 13,424 Corporate Securities 1,207,905 100,169 (522) 1,307,552 Non-U.S. Government-backed Corporate 12,488 666 - 13,154 Foreign Government Securities 50,136 4,078 (7) 54,207 Asset-backed Securities 34,027 2,455 - 36,482 Non-agency Commercial Mortgage-backed Securities 39,988 5,868 - 45,856 Agency Mortgage-backed Securities 867,041 42,722 (217) 909,546 Total Fixed Income Maturities, Available for Sale 2,973,534 199,028 (927) 3,171,635 Total Short-term Investments, Available for Sale 57,032 - - 57,032 Total Equity Securities, Available for Sale 173,952 28,180 (2,055) 200,077 Total 3,204,518 227,208 (2,982) 3,428,744
2011 Amortized costGross unrealized
gainsGross unrealized
losses Fair value
U.S. Government Securities 492,151 32,523 (2) 524,672 U.S. Agency Securities 180,723 8,500 - 189,223 Municipal Securities 11,807 1,227 - 13,034 Corporate Securities 1,152,543 78,120 (2,059) 1,228,604 FDIC Guaranteed Corporate 9,000 43 - 9,043 Non-U.S. Government-backed Corporate 43,121 1,147 - 44,268 Foreign Government Securities 58,106 1,303 - 59,409 Asset-backed Securities 36,666 1,899 (245) 38,320 Non-agency Commercial Mortgage-backed Securities 48,082 4,317 (36) 52,363 Agency Mortgage-backed Securities 943,368 49,057 (193) 992,232 Total Fixed Income Maturities, Available for Sale 2,975,567 178,136 (2,535) 3,151,168 Total Short-term Investments, Available for Sale 51,741 - - 51,741 Total Equity Securities, Available for Sale 169,814 15,089 (5,448) 179,455 Total 3,197,122 193,225 (7,983) 3,382,364
Aspen Bermuda Limited Notes to Financial Statements December 31, 2012 and 2011 (All amounts expressed in United States dollars – amounts in tables expressed in thousands of United States dollars)
11
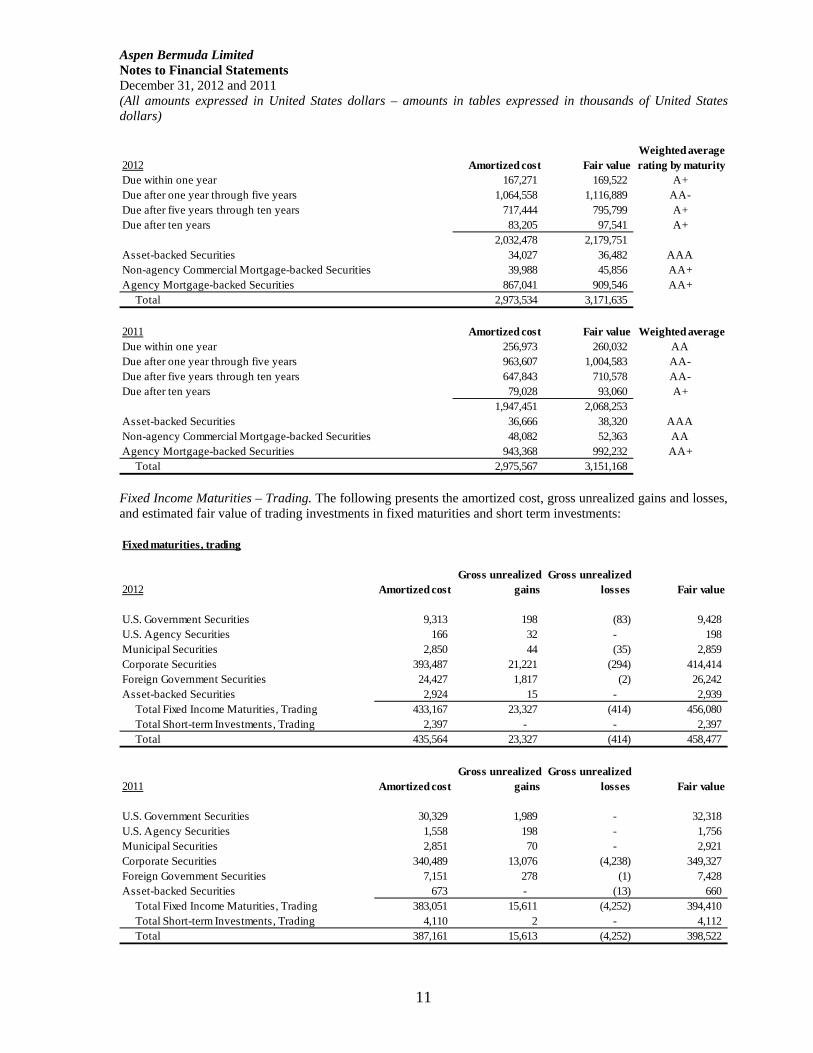
Fixed Income Maturities – Trading. The following presents the amortized cost, gross unrealized gains and losses, and estimated fair value of trading investments in fixed maturities and short term investments:
2012 Amortized cost Fair valueWeighted average rating by maturity
Due within one year 167,271 169,522 A+Due after one year through five years 1,064,558 1,116,889 AA-Due after five years through ten years 717,444 795,799 A+Due after ten years 83,205 97,541 A+
2,032,478 2,179,751 Asset-backed Securities 34,027 36,482 AAANon-agency Commercial Mortgage-backed Securities 39,988 45,856 AA+Agency Mortgage-backed Securities 867,041 909,546 AA+ Total 2,973,534 3,171,635
2011 Amortized cost Fair value Weighted average Due within one year 256,973 260,032 AA Due after one year through five years 963,607 1,004,583 AA- Due after five years through ten years 647,843 710,578 AA- Due after ten years 79,028 93,060 A+
1,947,451 2,068,253 Asset-backed Securities 36,666 38,320 AAA Non-agency Commercial Mortgage-backed Securities 48,082 52,363 AA Agency Mortgage-backed Securities 943,368 992,232 AA+ Total 2,975,567 3,151,168
Fixed maturities, trading
2012 Amortized costGross unrealized
gainsGross unrealized
losses Fair value
U.S. Government Securities 9,313 198 (83) 9,428 U.S. Agency Securities 166 32 - 198 Municipal Securities 2,850 44 (35) 2,859 Corporate Securities 393,487 21,221 (294) 414,414 Foreign Government Securities 24,427 1,817 (2) 26,242 Asset-backed Securities 2,924 15 - 2,939 Total Fixed Income Maturities, Trading 433,167 23,327 (414) 456,080 Total Short-term Investments, Trading 2,397 - - 2,397 Total 435,564 23,327 (414) 458,477
2011 Amortized costGross unrealized
gainsGross unrealized
losses Fair value
U.S. Government Securities 30,329 1,989 - 32,318 U.S. Agency Securities 1,558 198 - 1,756 Municipal Securities 2,851 70 - 2,921 Corporate Securities 340,489 13,076 (4,238) 349,327 Foreign Government Securities 7,151 278 (1) 7,428 Asset-backed Securities 673 - (13) 660 Total Fixed Income Maturities, Trading 383,051 15,611 (4,252) 394,410 Total Short-term Investments, Trading 4,110 2 - 4,112 Total 387,161 15,613 (4,252) 398,522
Aspen Bermuda Limited Notes to Financial Statements December 31, 2012 and 2011 (All amounts expressed in United States dollars – amounts in tables expressed in thousands of United States dollars)
12
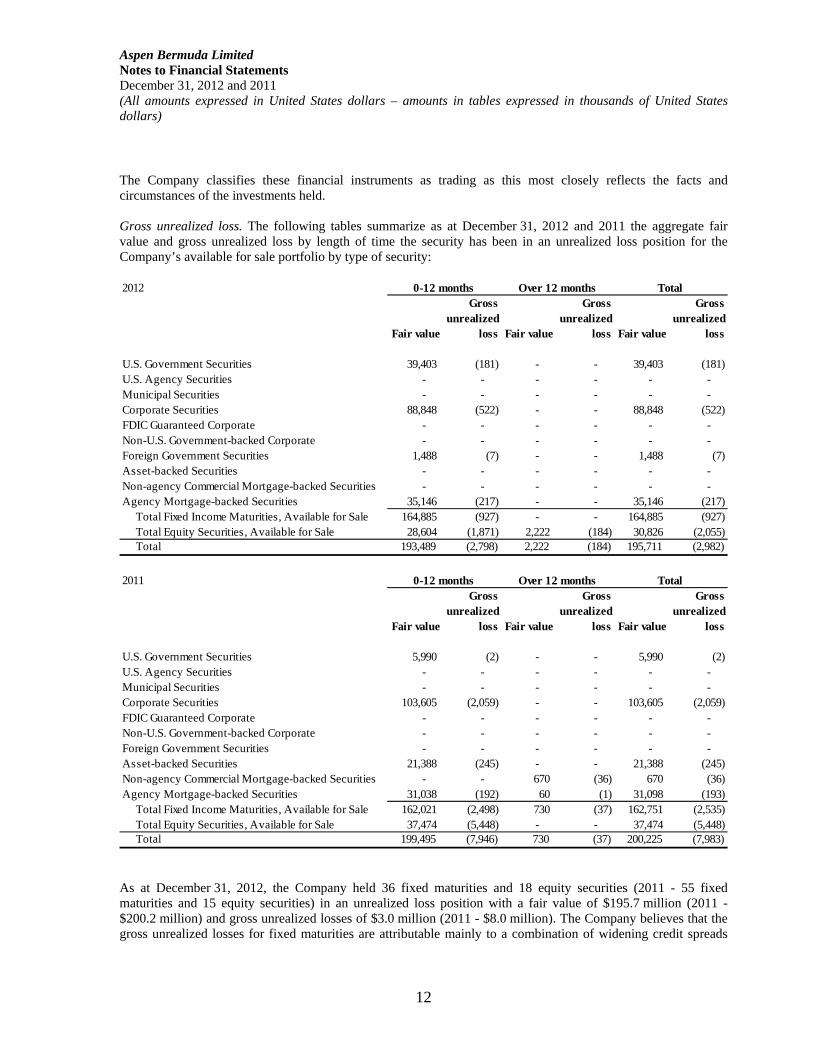
The Company classifies these financial instruments as trading as this most closely reflects the facts and circumstances of the investments held. Gross unrealized loss. The following tables summarize as at December 31, 2012 and 2011 the aggregate fair value and gross unrealized loss by length of time the security has been in an unrealized loss position for the Company’s available for sale portfolio by type of security:
As at December 31, 2012, the Company held 36 fixed maturities and 18 equity securities (2011 - 55 fixed maturities and 15 equity securities) in an unrealized loss position with a fair value of $195.7 million (2011 - $200.2 million) and gross unrealized losses of $3.0 million (2011 - $8.0 million). The Company believes that the gross unrealized losses for fixed maturities are attributable mainly to a combination of widening credit spreads
2012
Fair value
Gross unrealized
loss Fair value
Gross unrealized
loss Fair value
Gross unrealized
loss
U.S. Government Securities 39,403 (181) - - 39,403 (181) U.S. Agency Securities - - - - - - Municipal Securities - - - - - - Corporate Securities 88,848 (522) - - 88,848 (522) FDIC Guaranteed Corporate - - - - - - Non-U.S. Government-backed Corporate - - - - - - Foreign Government Securities 1,488 (7) - - 1,488 (7) Asset-backed Securities - - - - - - Non-agency Commercial Mortgage-backed Securities - - - - - - Agency Mortgage-backed Securities 35,146 (217) - - 35,146 (217) Total Fixed Income Maturities, Available for Sale 164,885 (927) - - 164,885 (927) Total Equity Securities, Available for Sale 28,604 (1,871) 2,222 (184) 30,826 (2,055) Total 193,489 (2,798) 2,222 (184) 195,711 (2,982)
0-12 months Over 12 months Total
2011
Fair value
Gross unrealized
loss Fair value
Gross unrealized
loss Fair value
Gross unrealized
loss
U.S. Government Securities 5,990 (2) - - 5,990 (2) U.S. Agency Securities - - - - - - Municipal Securities - - - - - - Corporate Securities 103,605 (2,059) - - 103,605 (2,059) FDIC Guaranteed Corporate - - - - - - Non-U.S. Government-backed Corporate - - - - - - Foreign Government Securities - - - - - - Asset-backed Securities 21,388 (245) - - 21,388 (245) Non-agency Commercial Mortgage-backed Securities - - 670 (36) 670 (36) Agency Mortgage-backed Securities 31,038 (192) 60 (1) 31,098 (193) Total Fixed Income Maturities, Available for Sale 162,021 (2,498) 730 (37) 162,751 (2,535) Total Equity Securities, Available for Sale 37,474 (5,448) - - 37,474 (5,448) Total 199,495 (7,946) 730 (37) 200,225 (7,983)
0-12 months Over 12 months Total
Aspen Bermuda Limited Notes to Financial Statements December 31, 2012 and 2011 (All amounts expressed in United States dollars – amounts in tables expressed in thousands of United States dollars)
13
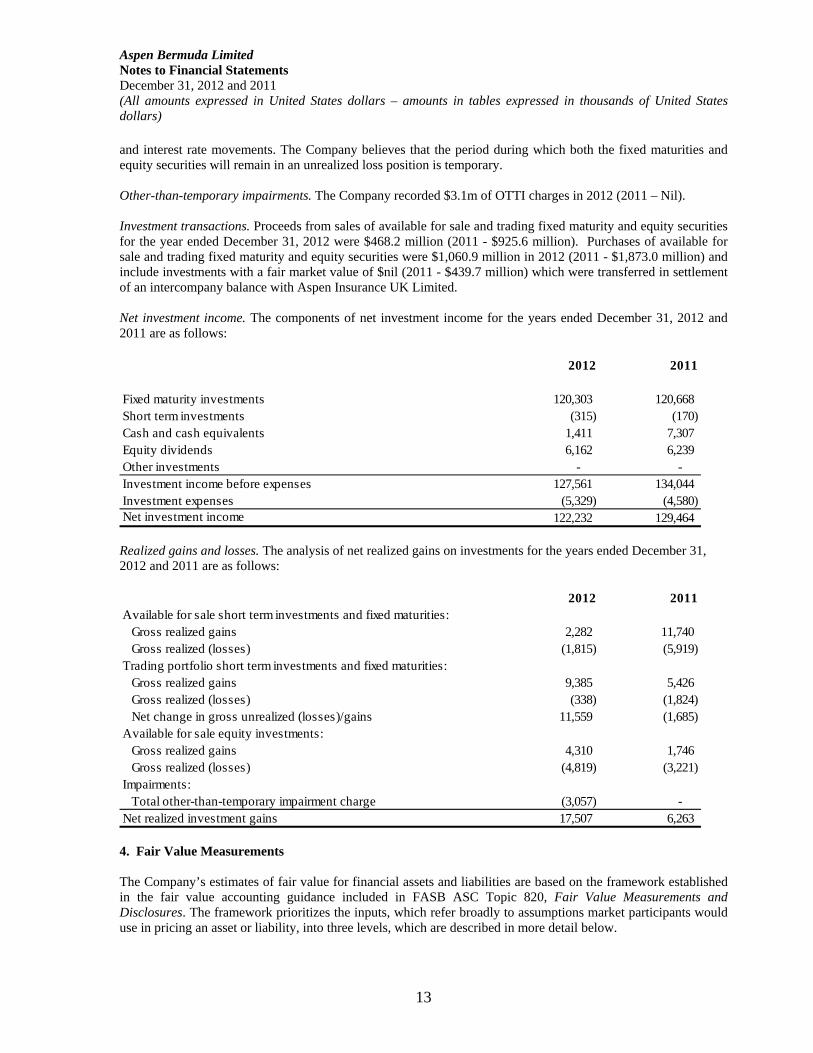
and interest rate movements. The Company believes that the period during which both the fixed maturities and equity securities will remain in an unrealized loss position is temporary. Other-than-temporary impairments. The Company recorded $3.1m of OTTI charges in 2012 (2011 – Nil). Investment transactions. Proceeds from sales of available for sale and trading fixed maturity and equity securities for the year ended December 31, 2012 were $468.2 million (2011 - $925.6 million). Purchases of available for sale and trading fixed maturity and equity securities were $1,060.9 million in 2012 (2011 - $1,873.0 million) and include investments with a fair market value of $nil (2011 - $439.7 million) which were transferred in settlement of an intercompany balance with Aspen Insurance UK Limited. Net investment income. The components of net investment income for the years ended December 31, 2012 and 2011 are as follows:
Realized gains and losses. The analysis of net realized gains on investments for the years ended December 31, 2012 and 2011 are as follows:
4. Fair Value Measurements The Company’s estimates of fair value for financial assets and liabilities are based on the framework established in the fair value accounting guidance included in FASB ASC Topic 820, Fair Value Measurements and Disclosures. The framework prioritizes the inputs, which refer broadly to assumptions market participants would use in pricing an asset or liability, into three levels, which are described in more detail below.
2012 2011
Fixed maturity investments 120,303 120,668 Short term investments (315) (170) Cash and cash equivalents 1,411 7,307 Equity dividends 6,162 6,239 Other investments - - Investment income before expenses 127,561 134,044 Investment expenses (5,329) (4,580) Net investment income 122,232 129,464
2012 2011Available for sale short term investments and fixed maturities: Gross realized gains 2,282 11,740 Gross realized (losses) (1,815) (5,919) Trading portfolio short term investments and fixed maturities: Gross realized gains 9,385 5,426 Gross realized (losses) (338) (1,824) Net change in gross unrealized (losses)/gains 11,559 (1,685) Available for sale equity investments: Gross realized gains 4,310 1,746 Gross realized (losses) (4,819) (3,221) Impairments: Total other-than-temporary impairment charge (3,057) - Net realized investment gains 17,507 6,263
Aspen Bermuda Limited Notes to Financial Statements December 31, 2012 and 2011 (All amounts expressed in United States dollars – amounts in tables expressed in thousands of United States dollars)
14
• Level 1 — Valuations based on unadjusted quoted prices in active markets, to which the Company has access, for identical assets or liabilities.
• Level 2 — Valuations based on inputs other than unadjusted quoted prices in active markets for identical assets or liabilities. Inputs include quoted prices for similar assets or liabilities in markets that are active, quoted prices for identical or similar assets or liabilities in inactive markets, and inputs other than quoted prices which are directly or indirectly observable for the asset or liability (for example interest rates, yield curves, prepayment speeds, default rates, loss severities).
• Level 3 — Valuations based on inputs that are unobservable and significant to the overall fair value
measurement. Unobservable inputs reflect the Company’s own views about the assumptions that market participants would use in pricing the asset or liability.
The Company considers prices for actively traded securities to be derived based on quoted prices in an active market for identical assets, which are Level 1 inputs in the fair value hierarchy. The majority of securities are valued using prices supplied by index providers. The Company considers prices for other securities that may not be as actively traded which are priced via pricing services, index providers, vendors and broker-dealers, or with reference to interest rates and yield curves, to be derived based on inputs that are observable for the asset, either directly or indirectly, which are Level 2 inputs in the fair value hierarchy. These securities are also valued using prices supplied by index providers. The Company considers securities, other financial instruments and derivative insurance contracts subject to fair value measurement whose valuation is derived by internal valuation models to be based largely on unobservable inputs, which are Level 3 inputs in the fair value hierarchy. Where inputs to the valuation of an asset or liability fall into more than one level of the fair value hierarchy, the classification of the asset or liability will be within the lowest level identified as significant to the valuation. U.S. Government and Agencies. U.S. government and agency securities consist primarily of bonds issued by the U.S. Treasury and corporate debt issued by agencies such as the Government National Mortgage Association, the Federal National Mortgage Association and the Federal Home Loan Mortgage Corporation. As the fair values of U.S. Treasury securities are based on unadjusted market prices in active markets, they are classified within Level 1. The fair values of U.S. government agency securities are priced using the spread above the risk-free yield curve. As the yields for the risk-free yield curve and the spreads for these securities are observable market inputs, the fair values of U.S. government agency securities are classified within Level 2. Foreign Government. The issuers for securities in this category are non-U.S. governments and their agencies. The fair values of non-U.S. government bonds, primarily sourced from international indices, are based on unadjusted market prices in active markets and are therefore classified within Level 1. The fair values of the non-U.S. agency securities, again primarily sourced from international indices, are priced using the spread above the risk-free yield curve. As the yields for the risk-free yield curve and the spreads for these securities are observable market inputs, the fair values of non-U.S. agency securities are classified within Level 2. Municipals. Our municipal portfolio comprises bonds issued by U.S. domiciled state and municipality entities. The fair value of these securities is determined using spreads obtained from broker-dealers, trade prices and the new issue market which are Level 2 inputs in the fair value hierarchy. Consequently, these securities are classified within Level 2. Corporate. Corporate securities consist primarily of U.S. and foreign corporations covering a variety of industries and are for the most part priced by index providers and pricing vendors. Some issuers may participate in the Federal Deposit Insurance Corporation (“FDIC”) program or other similar non-U.S. government programs which guarantee timely payment of principal and interest in the event of a default. The fair values of these securities are
Aspen Bermuda Limited Notes to Financial Statements December 31, 2012 and 2011 (All amounts expressed in United States dollars – amounts in tables expressed in thousands of United States dollars)
15
generally determined using the spread above the risk-free yield curve. Inputs used in the evaluation of these securities include credit data, interest rate data, market observations and sector news, broker-dealer quotes and trade volumes. The Company classifies these securities within Level 2. Mortgage-backed. Our residential and commercial mortgage-backed securities consist of bonds issued by the Federal National Mortgage Association, the Federal Home Loan Mortgage Corporation, as well as private, non-agency issuers. The fair values of these securities are determined through the use of a pricing model (including Option Adjusted Spread) which uses prepayment speeds and spreads to determine the appropriate average life of the mortgage-backed security. These spreads are generally obtained from broker-dealers, trade prices and the new issue market. As the significant inputs used to price mortgage-backed securities are observable market inputs these securities are classified within Level 2. Asset-backed. The underlying collateral for the Company's asset-backed securities consists mainly of student loans, automobile loans and credit card receivables. These securities are primarily priced by index providers and pricing vendors. Inputs to the valuation process include broker-dealer quotes and other available trade information, prepayment speeds, interest rate data and credit spreads. The Company classifies these securities within Level 2. Short-term investments. Short-term investments comprise highly liquid debt securities with a maturity greater than three months but less than one year from the date of purchase and are classified as either trading or available for sale and carried at estimated fair value. Short-term investments are valued in a manner similar to the Company's fixed maturity investments and are classified within Level 1 and 2. Equity Securities. Equity securities include U.S. and foreign common stocks and are classified as either trading or available for sale and carried at fair value. These securities are classified within Level 1 as their fair values are based on quoted market prices in active markets from independent pricing sources. Foreign Currency Forward Contracts. The foreign currency forward contracts which we use to mitigate currency risk are characterized as over-the-counter ("OTC") due to their customized nature and the fact that they do not trade on a major exchange. These instruments trade in a very deep liquid market, providing substantial price transparency and accordingly are classified as Level 2. Interest-Rate Swaps. The interest-rate swaps which we use to mitigate interest rate risk are also characterized as OTC and are valued by the counterparties using quantitative models with multiple market inputs. The market inputs, such as interest rates and yield curves, are observable and the valuation can be compared for reasonableness with third party pricing services. Consequently, these instruments are classified as Level 2. The Company’s fixed income securities are traded on the over-the-counter market based on prices provided by one or more market makers in each security. Securities such as U.S. Government, U.S. Agency, Foreign Government and investment grade corporate bonds have multiple market makers in addition to readily observable market value indicators such as expected credit spread, except for Treasury securities, over the yield curve. The Company’s fixed income securities were valued by internationally recognized independent pricing services, index providers or broker-dealers, using standard market conventions. The market conventions utilize market quotations, market transactions in comparable instruments and various relationships between instruments including, but not limited to, yield to maturity, dollar prices and spread prices in determining value. The fair value estimates for the investment grade securities in the Company’s portfolio do not use significant unobservable inputs or modeling techniques. Independent Pricing Services and Index Providers. The underlying methodology used to determine the fair value of securities in the Company's available for sale and trading portfolios by the pricing services and index providers the Company uses is very similar. Pricing services will gather observable pricing inputs from multiple external sources, including buy and sell-side contacts and broker-dealers, in order to develop their internal prices. Index providers are those firms which provide prices for a range of securities within one or more asset classes, typically
Aspen Bermuda Limited Notes to Financial Statements December 31, 2012 and 2011 (All amounts expressed in United States dollars – amounts in tables expressed in thousands of United States dollars)
16
using their own in-house market makers (traders) as the primary pricing source for the indices, although ultimate valuations may also rely on other observable data inputs to derive a dollar price for all index-eligible securities. Index providers without in-house trading desks will function similarly to a pricing service in that they will gather their observable pricing inputs from multiple external sources. All prices for the Company's securities attributed to index providers are for an individual security within the respective indices. Pricing services and index providers, provide pricing for less complex, liquid securities based on market quotations in active markets. Pricing services and index providers supply prices for a broad range of securities including those for actively traded securities, such as Treasury and other Government securities, in addition to those that trade less frequently or where valuation includes reference to credit spreads, pay down and pre-pay features and other observable inputs. These securities include Government Agency, Municipals, Corporate and Asset-Backed Securities. For securities that may trade less frequently or do not trade on a listed exchange, these pricing services and index providers may use matrix pricing consisting of observable market inputs to estimate the fair value of a security. These observable market inputs include: reported trades, benchmark yields, broker-dealer quotes, issuer spreads, two-sided markets, benchmark securities, bids, offers, reference data, and industry and economic factors. Additionally, pricing services and index providers may use a valuation model such as an option adjusted spread model commonly used for estimating fair values of mortgage-backed and asset-backed securities. Neither the Company, nor its index providers, derives dollar prices using an index as a pricing input for any individual security. Broker-Dealers. We obtain quotes from broker-dealers who are active in the corresponding markets when prices are unavailable from independent pricing services or index providers. Generally, broker-dealers value securities through their trading desks based on observable market inputs. Their pricing methodologies include mapping securities based on trade data, bids or offers, observed spreads and performance on newly issued securities. They may also establish pricing through observing secondary trading of similar securities. Quotes from broker-dealers are non-binding. The Company obtains prices for all of its fixed income investment securities via its third-party accounting service provider, in the majority of cases receiving a number of quotes so as to obtain the most comprehensive information available to determine a security's fair value. A single valuation is applied to each security based on the vendor hierarchy maintained by our third-party accounting service provider. The Company, in conjunction with its third-party accounting service provider, obtains an understanding of the methods, models and inputs used by the third-party pricing service and index provider to assess the on-going appropriateness of vendors' prices. The Company and its third party accounting service provider also have controls in place to validate that amounts provided represent fair values. Processes to validate and review pricing include, but are not limited to:
• quantitative analysis (e.g. comparing the quarterly return for each managed portfolio to its target benchmark, with significant differences identified and investigated);
• comparison of market values obtained from pricing services, index providers and broker-dealers against investment manager pricing where further investigation is completed when significant differences exist for pricing of individual securities between pricing sources;
• initial and ongoing evaluation of methodologies used by outside parties to calculate fair value; and • comparison of the fair value estimates to our knowledge of the current market and on a sample basis
against alternative internationally recognized independent pricing sources. Prices obtained from pricing services, index providers and broker-dealers are not adjusted by the Company, however, prices provided by a pricing service, index provider or broker-dealer in certain instances may be challenged based on market or information available from internal sources, including those available to our third-
Aspen Bermuda Limited Notes to Financial Statements December 31, 2012 and 2011 (All amounts expressed in United States dollars – amounts in tables expressed in thousands of United States dollars)
17
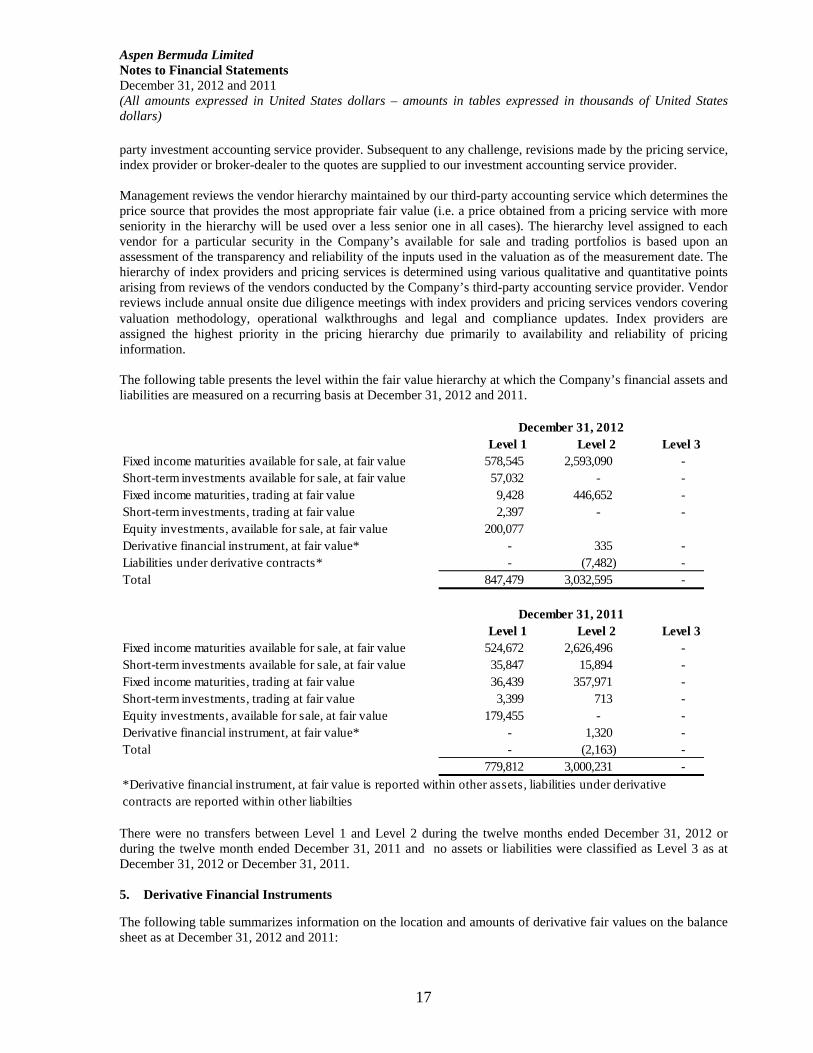
party investment accounting service provider. Subsequent to any challenge, revisions made by the pricing service, index provider or broker-dealer to the quotes are supplied to our investment accounting service provider. Management reviews the vendor hierarchy maintained by our third-party accounting service which determines the price source that provides the most appropriate fair value (i.e. a price obtained from a pricing service with more seniority in the hierarchy will be used over a less senior one in all cases). The hierarchy level assigned to each vendor for a particular security in the Company’s available for sale and trading portfolios is based upon an assessment of the transparency and reliability of the inputs used in the valuation as of the measurement date. The hierarchy of index providers and pricing services is determined using various qualitative and quantitative points arising from reviews of the vendors conducted by the Company’s third-party accounting service provider. Vendor reviews include annual onsite due diligence meetings with index providers and pricing services vendors covering valuation methodology, operational walkthroughs and legal and compliance updates. Index providers are assigned the highest priority in the pricing hierarchy due primarily to availability and reliability of pricing information. The following table presents the level within the fair value hierarchy at which the Company’s financial assets and liabilities are measured on a recurring basis at December 31, 2012 and 2011.
There were no transfers between Level 1 and Level 2 during the twelve months ended December 31, 2012 or during the twelve month ended December 31, 2011 and no assets or liabilities were classified as Level 3 as at December 31, 2012 or December 31, 2011. 5. Derivative Financial Instruments
The following table summarizes information on the location and amounts of derivative fair values on the balance sheet as at December 31, 2012 and 2011:
Level 1 Level 2 Level 3Fixed income maturities available for sale, at fair value 578,545 2,593,090 - Short-term investments available for sale, at fair value 57,032 - - Fixed income maturities, trading at fair value 9,428 446,652 - Short-term investments, trading at fair value 2,397 - - Equity investments, available for sale, at fair value 200,077 Derivative financial instrument, at fair value* - 335 - Liabilities under derivative contracts* - (7,482) - Total 847,479 3,032,595 -
December 31, 2012
Level 1 Level 2 Level 3Fixed income maturities available for sale, at fair value 524,672 2,626,496 - Short-term investments available for sale, at fair value 35,847 15,894 - Fixed income maturities, trading at fair value 36,439 357,971 - Short-term investments, trading at fair value 3,399 713 - Equity investments, available for sale, at fair value 179,455 - - Derivative financial instrument, at fair value* - 1,320 - Total - (2,163) -
779,812 3,000,231 -
December 31, 2011
*Derivative financial instrument, at fair value is reported within other assets, liabilities under derivative contracts are reported within other liabilties
Aspen Bermuda Limited Notes to Financial Statements December 31, 2012 and 2011 (All amounts expressed in United States dollars – amounts in tables expressed in thousands of United States dollars)
18
The following table provides the total unrealized and realized gains (losses) recorded in earnings for the twelve months ended December 31, 2012 and 2011:
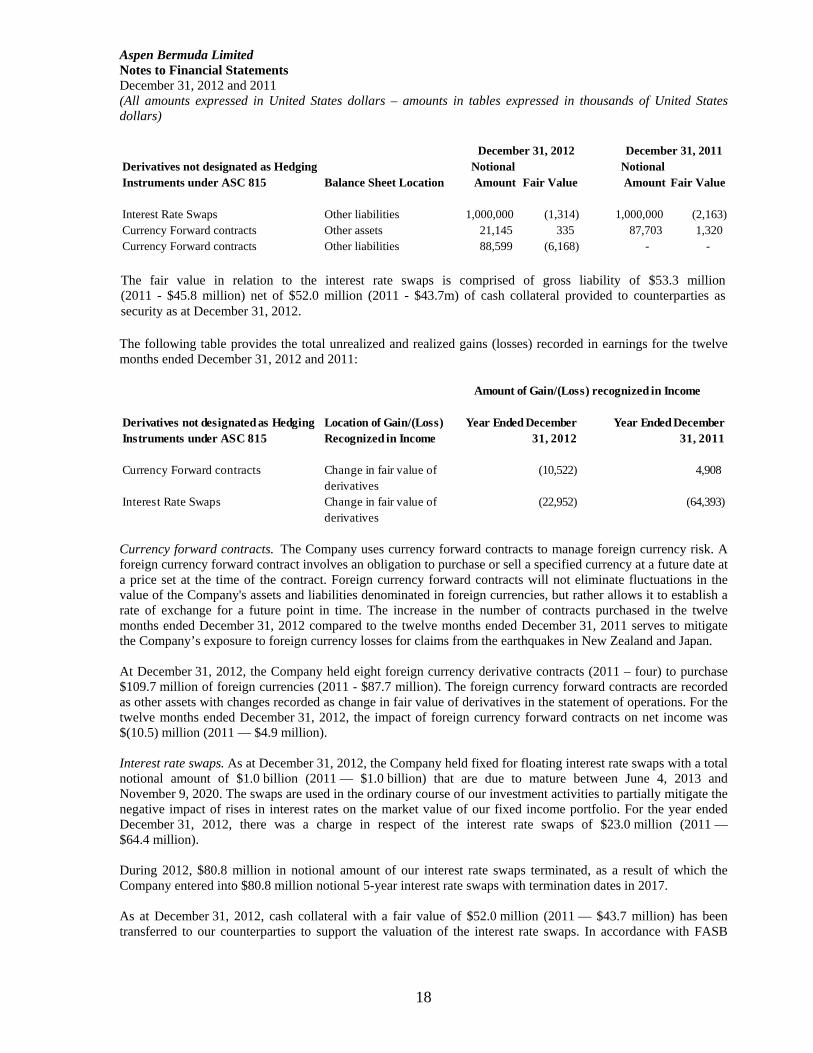
Currency forward contracts. The Company uses currency forward contracts to manage foreign currency risk. A foreign currency forward contract involves an obligation to purchase or sell a specified currency at a future date at a price set at the time of the contract. Foreign currency forward contracts will not eliminate fluctuations in the value of the Company's assets and liabilities denominated in foreign currencies, but rather allows it to establish a rate of exchange for a future point in time. The increase in the number of contracts purchased in the twelve months ended December 31, 2012 compared to the twelve months ended December 31, 2011 serves to mitigate the Company’s exposure to foreign currency losses for claims from the earthquakes in New Zealand and Japan. At December 31, 2012, the Company held eight foreign currency derivative contracts (2011 – four) to purchase $109.7 million of foreign currencies (2011 - $87.7 million). The foreign currency forward contracts are recorded as other assets with changes recorded as change in fair value of derivatives in the statement of operations. For the twelve months ended December 31, 2012, the impact of foreign currency forward contracts on net income was $(10.5) million (2011 — $4.9 million). Interest rate swaps. As at December 31, 2012, the Company held fixed for floating interest rate swaps with a total notional amount of $1.0 billion (2011 — $1.0 billion) that are due to mature between June 4, 2013 and November 9, 2020. The swaps are used in the ordinary course of our investment activities to partially mitigate the negative impact of rises in interest rates on the market value of our fixed income portfolio. For the year ended December 31, 2012, there was a charge in respect of the interest rate swaps of $23.0 million (2011 — $64.4 million). During 2012, $80.8 million in notional amount of our interest rate swaps terminated, as a result of which the Company entered into $80.8 million notional 5-year interest rate swaps with termination dates in 2017. As at December 31, 2012, cash collateral with a fair value of $52.0 million (2011 — $43.7 million) has been transferred to our counterparties to support the valuation of the interest rate swaps. In accordance with FASB
Derivatives not designated as Hedging Instruments under ASC 815
Location of Gain/(Loss) Recognized in Income
Currency Forward contracts
Interest Rate Swaps
Year Ended December 31, 2012
Year Ended December 31, 2011
Amount of Gain/(Loss) recognized in Income
Change in fair value of derivativesChange in fair value of derivatives
(10,522) 4,908
(22,952) (64,393)
Derivatives not designated as Hedging Instruments under ASC 815 Balance Sheet Location
Notional Amount Fair Value
Notional Amount Fair Value
Interest Rate Swaps Other liabilities 1,000,000 (1,314) 1,000,000 (2,163) Currency Forward contracts Other assets 21,145 335 87,703 1,320 Currency Forward contracts Other liabilities 88,599 (6,168) - -
December 31, 2012 December 31, 2011
The fair value in relation to the interest rate swaps is comprised of gross liability of $53.3 million(2011 - $45.8 million) net of $52.0 million (2011 - $43.7m) of cash collateral provided to counterparties assecurity as at December 31, 2012.
Aspen Bermuda Limited Notes to Financial Statements December 31, 2012 and 2011 (All amounts expressed in United States dollars – amounts in tables expressed in thousands of United States dollars)
19
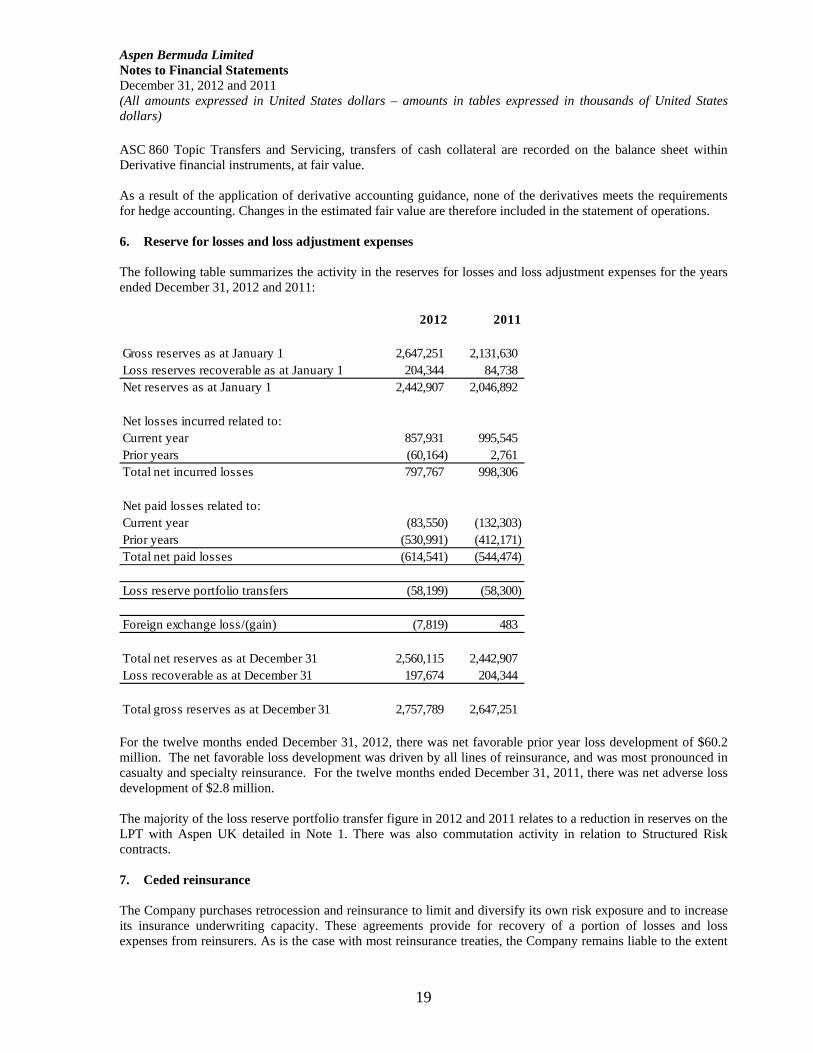
ASC 860 Topic Transfers and Servicing, transfers of cash collateral are recorded on the balance sheet within Derivative financial instruments, at fair value. As a result of the application of derivative accounting guidance, none of the derivatives meets the requirements for hedge accounting. Changes in the estimated fair value are therefore included in the statement of operations. 6. Reserve for losses and loss adjustment expenses The following table summarizes the activity in the reserves for losses and loss adjustment expenses for the years ended December 31, 2012 and 2011:
For the twelve months ended December 31, 2012, there was net favorable prior year loss development of $60.2 million. The net favorable loss development was driven by all lines of reinsurance, and was most pronounced in casualty and specialty reinsurance. For the twelve months ended December 31, 2011, there was net adverse loss development of $2.8 million. The majority of the loss reserve portfolio transfer figure in 2012 and 2011 relates to a reduction in reserves on the LPT with Aspen UK detailed in Note 1. There was also commutation activity in relation to Structured Risk contracts. 7. Ceded reinsurance The Company purchases retrocession and reinsurance to limit and diversify its own risk exposure and to increase its insurance underwriting capacity. These agreements provide for recovery of a portion of losses and loss expenses from reinsurers. As is the case with most reinsurance treaties, the Company remains liable to the extent
2012 2011
Gross reserves as at January 1 2,647,251 2,131,630 Loss reserves recoverable as at January 1 204,344 84,738 Net reserves as at January 1 2,442,907 2,046,892
Net losses incurred related to:Current year 857,931 995,545 Prior years (60,164) 2,761 Total net incurred losses 797,767 998,306
Net paid losses related to:Current year (83,550) (132,303) Prior years (530,991) (412,171) Total net paid losses (614,541) (544,474)
Loss reserve portfolio transfers (58,199) (58,300)
Foreign exchange loss/(gain) (7,819) 483
Total net reserves as at December 31 2,560,115 2,442,907 Loss recoverable as at December 31 197,674 204,344
Total gross reserves as at December 31 2,757,789 2,647,251
Aspen Bermuda Limited Notes to Financial Statements December 31, 2012 and 2011 (All amounts expressed in United States dollars – amounts in tables expressed in thousands of United States dollars)
20
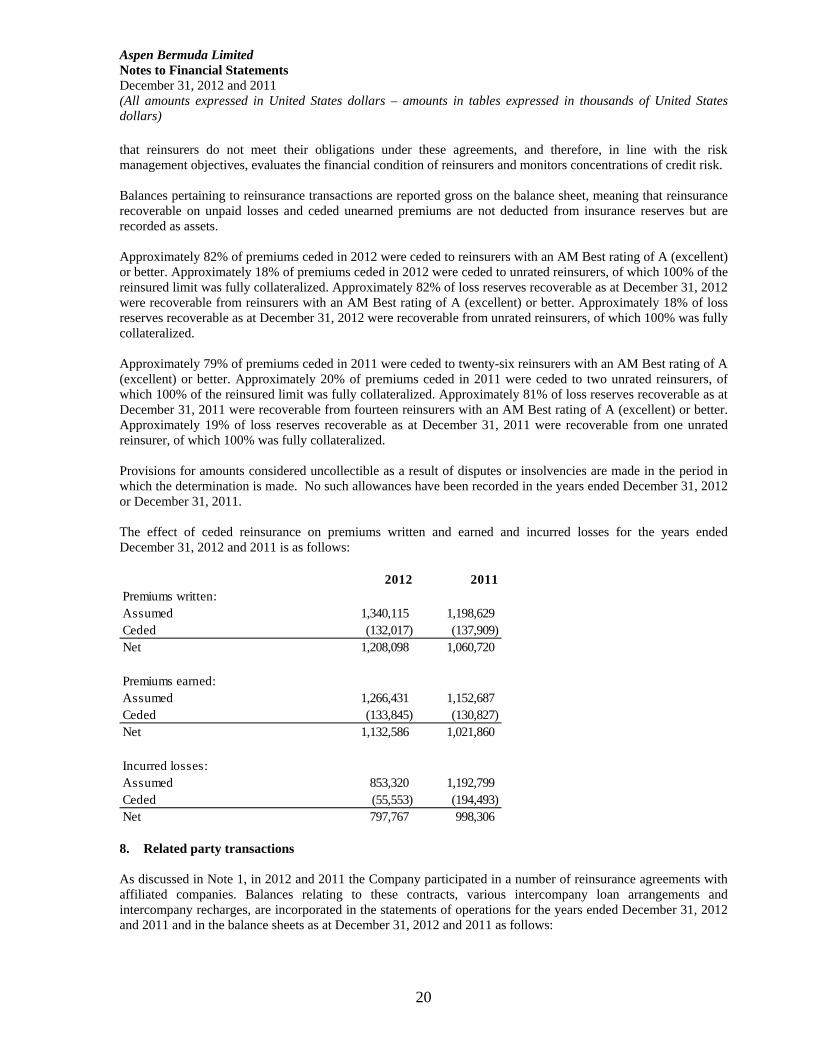
that reinsurers do not meet their obligations under these agreements, and therefore, in line with the risk management objectives, evaluates the financial condition of reinsurers and monitors concentrations of credit risk. Balances pertaining to reinsurance transactions are reported gross on the balance sheet, meaning that reinsurance recoverable on unpaid losses and ceded unearned premiums are not deducted from insurance reserves but are recorded as assets.
Approximately 82% of premiums ceded in 2012 were ceded to reinsurers with an AM Best rating of A (excellent) or better. Approximately 18% of premiums ceded in 2012 were ceded to unrated reinsurers, of which 100% of the reinsured limit was fully collateralized. Approximately 82% of loss reserves recoverable as at December 31, 2012 were recoverable from reinsurers with an AM Best rating of A (excellent) or better. Approximately 18% of loss reserves recoverable as at December 31, 2012 were recoverable from unrated reinsurers, of which 100% was fully collateralized.
Approximately 79% of premiums ceded in 2011 were ceded to twenty-six reinsurers with an AM Best rating of A (excellent) or better. Approximately 20% of premiums ceded in 2011 were ceded to two unrated reinsurers, of which 100% of the reinsured limit was fully collateralized. Approximately 81% of loss reserves recoverable as at December 31, 2011 were recoverable from fourteen reinsurers with an AM Best rating of A (excellent) or better. Approximately 19% of loss reserves recoverable as at December 31, 2011 were recoverable from one unrated reinsurer, of which 100% was fully collateralized.
Provisions for amounts considered uncollectible as a result of disputes or insolvencies are made in the period in which the determination is made. No such allowances have been recorded in the years ended December 31, 2012 or December 31, 2011.
The effect of ceded reinsurance on premiums written and earned and incurred losses for the years ended December 31, 2012 and 2011 is as follows:
8. Related party transactions As discussed in Note 1, in 2012 and 2011 the Company participated in a number of reinsurance agreements with affiliated companies. Balances relating to these contracts, various intercompany loan arrangements and intercompany recharges, are incorporated in the statements of operations for the years ended December 31, 2012 and 2011 and in the balance sheets as at December 31, 2012 and 2011 as follows:
2012 2011Premiums written:Assumed 1,340,115 1,198,629 Ceded (132,017) (137,909) Net 1,208,098 1,060,720
Premiums earned:Assumed 1,266,431 1,152,687 Ceded (133,845) (130,827) Net 1,132,586 1,021,860
Incurred losses:Assumed 853,320 1,192,799 Ceded (55,553) (194,493) Net 797,767 998,306
Aspen Bermuda Limited Notes to Financial Statements December 31, 2012 and 2011 (All amounts expressed in United States dollars – amounts in tables expressed in thousands of United States dollars)
21
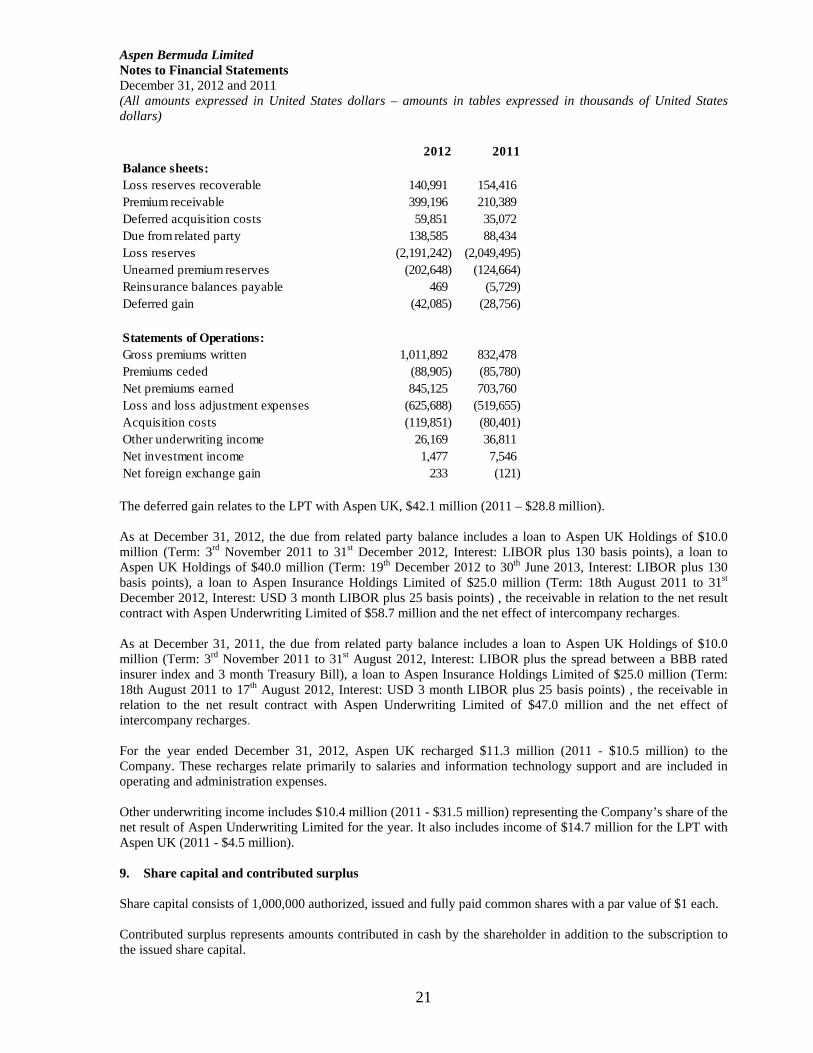
The deferred gain relates to the LPT with Aspen UK, $42.1 million (2011 – $28.8 million). As at December 31, 2012, the due from related party balance includes a loan to Aspen UK Holdings of $10.0 million (Term: 3rd November 2011 to 31st December 2012, Interest: LIBOR plus 130 basis points), a loan to Aspen UK Holdings of $40.0 million (Term: 19th December 2012 to 30th June 2013, Interest: LIBOR plus 130 basis points), a loan to Aspen Insurance Holdings Limited of $25.0 million (Term: 18th August 2011 to 31st December 2012, Interest: USD 3 month LIBOR plus 25 basis points) , the receivable in relation to the net result contract with Aspen Underwriting Limited of $58.7 million and the net effect of intercompany recharges. As at December 31, 2011, the due from related party balance includes a loan to Aspen UK Holdings of $10.0 million (Term: 3rd November 2011 to 31st August 2012, Interest: LIBOR plus the spread between a BBB rated insurer index and 3 month Treasury Bill), a loan to Aspen Insurance Holdings Limited of $25.0 million (Term: 18th August 2011 to 17th August 2012, Interest: USD 3 month LIBOR plus 25 basis points) , the receivable in relation to the net result contract with Aspen Underwriting Limited of $47.0 million and the net effect of intercompany recharges. For the year ended December 31, 2012, Aspen UK recharged $11.3 million (2011 - $10.5 million) to the Company. These recharges relate primarily to salaries and information technology support and are included in operating and administration expenses. Other underwriting income includes $10.4 million (2011 - $31.5 million) representing the Company’s share of the net result of Aspen Underwriting Limited for the year. It also includes income of $14.7 million for the LPT with Aspen UK (2011 - $4.5 million). 9. Share capital and contributed surplus Share capital consists of 1,000,000 authorized, issued and fully paid common shares with a par value of $1 each. Contributed surplus represents amounts contributed in cash by the shareholder in addition to the subscription to the issued share capital.
2012 2011Balance sheets:Loss reserves recoverable 140,991 154,416 Premium receivable 399,196 210,389 Deferred acquisition costs 59,851 35,072 Due from related party 138,585 88,434 Loss reserves (2,191,242) (2,049,495) Unearned premium reserves (202,648) (124,664) Reinsurance balances payable 469 (5,729) Deferred gain (42,085) (28,756)
Statements of Operations:Gross premiums written 1,011,892 832,478 Premiums ceded (88,905) (85,780) Net premiums earned 845,125 703,760 Loss and loss adjustment expenses (625,688) (519,655) Acquisition costs (119,851) (80,401) Other underwriting income 26,169 36,811 Net investment income 1,477 7,546 Net foreign exchange gain 233 (121)
Aspen Bermuda Limited Notes to Financial Statements December 31, 2012 and 2011 (All amounts expressed in United States dollars – amounts in tables expressed in thousands of United States dollars)
22
10. Concentrations of credit risk, contingencies and commitments The Company is potentially exposed to concentrations of credit risk in respect of amounts recoverable from reinsurers, investments and cash and cash equivalents and insurance and reinsurance balances owed by the brokers with whom the Company transacts business. The Aspen Group’s Reinsurance Security Committee define credit risk tolerances in line with the risk appetite set by the Board and they, together with the Company’s risk management function, monitor exposures to individual counterparties. Any exceptions are reported to senior management and the Aspen Group Board’s Risk Committee. As at December 31, 2012, the Company’s investments in fixed maturity and equity securities were held by one custodian. The Company’s investment policies include specific provisions that limit the allowable holdings of a single issue and issuer. At December 31, 2012 and December 31, 2011 there were no investments in any single issuer, other than the U.S. government, U.S. government agencies and U.S. government sponsored enterprises in excess of 2% of the aggregate investment portfolio. As at December 31, 2012, 35% of the Company’s cash and cash equivalents balance was held by one bank with an S&P rating of A+ (2011 – 45%) and 63% of the cash and cash equivalents balance was held by the investment custodian with an S&P rating of A+ (2011 – 45%). In the normal course of business the Company’s bankers issue letters of credit in favour of ceding companies. The Company had three facilities in place as at December 31, 2012. As at December 31, 2012, letters of credit of $876.6 million (2011 - $887.6 million) and GBP Nil (2011 - GBP 3.0 million) were issued and outstanding under facilities fully collateralized with cash and securities on deposit with a fair value of $1,106.9m (2011 - $1,287.1m). In the normal course of business the Company is required to establish trust accounts in favour of ceding companies. As at December 31, 2012 fixed maturity securities with a fair value of $775.6 million were maintained in trust accounts (2011 – cash and cash equivalents of $5.9 million, short term investments of $14.0 million, and fixed maturity securities with a fair value of $477.6 million). The Company leases office space under an operating lease. Future rental commitments as at December 31, 2012 are $4.2 million. 11. Shareholders’ Equity and Regulation The company must at all times maintain a solvency margin and an enhanced capital requirement in accordance with the provisions of the Insurance Act, 1978 of Bermuda. As a Class 4 insurer, the Company is required to maintain a minimum solvency margin equal to the greater of (A) $100 million, (B) 50% of net premiums written (being gross premiums written less any premiums ceded but may not deduct more than 25% of gross premiums when computing net premiums written), and (C) 15% of net discounted aggregate losses and loss expense provisions and other insurance reserves. Each year the Company is required to file with the Bermuda Monetary Authority (the “Authority”) a capital and solvency return within four months of its relevant financial year end (unless specifically extended). The prescribed form of capital and solvency return comprises the insurer’s Bermuda Solvency Capital Requirement (“BSCR”) model, a schedule of fixed income investments by rating category, a schedule of net loss and loss expense provision by line of business, a schedule of premiums written by line of business, a schedule of risk management and a schedule of fixed income securities. As a Class 4 insurer, the Company is required to maintain available statutory capital and surplus in an amount that is equal to or exceeds the target capital levels based on enhanced capital requirements (“ECR”) calculated using the BSCR model. The Authority has provided for the use of pre-approved internally developed company models in lieu of the standardized BSCR, although at this time filing of the BSCR model is still required, regardless of whether an internal model has been approved. The BSCR model is a risk-based capital model introduced by the Authority that measurers risk and determines ECR and a target capital level
Aspen Bermuda Limited Notes to Financial Statements December 31, 2012 and 2011 (All amounts expressed in United States dollars – amounts in tables expressed in thousands of United States dollars)
23
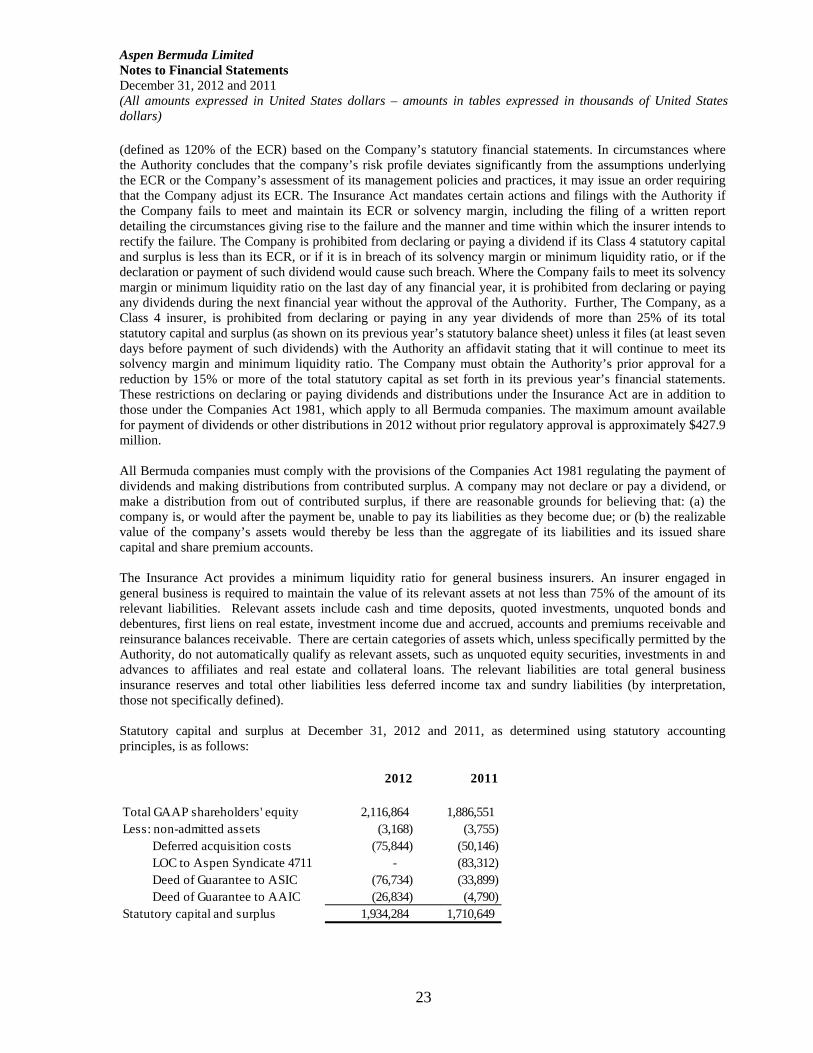
(defined as 120% of the ECR) based on the Company’s statutory financial statements. In circumstances where the Authority concludes that the company’s risk profile deviates significantly from the assumptions underlying the ECR or the Company’s assessment of its management policies and practices, it may issue an order requiring that the Company adjust its ECR. The Insurance Act mandates certain actions and filings with the Authority if the Company fails to meet and maintain its ECR or solvency margin, including the filing of a written report detailing the circumstances giving rise to the failure and the manner and time within which the insurer intends to rectify the failure. The Company is prohibited from declaring or paying a dividend if its Class 4 statutory capital and surplus is less than its ECR, or if it is in breach of its solvency margin or minimum liquidity ratio, or if the declaration or payment of such dividend would cause such breach. Where the Company fails to meet its solvency margin or minimum liquidity ratio on the last day of any financial year, it is prohibited from declaring or paying any dividends during the next financial year without the approval of the Authority. Further, The Company, as a Class 4 insurer, is prohibited from declaring or paying in any year dividends of more than 25% of its total statutory capital and surplus (as shown on its previous year’s statutory balance sheet) unless it files (at least seven days before payment of such dividends) with the Authority an affidavit stating that it will continue to meet its solvency margin and minimum liquidity ratio. The Company must obtain the Authority’s prior approval for a reduction by 15% or more of the total statutory capital as set forth in its previous year’s financial statements. These restrictions on declaring or paying dividends and distributions under the Insurance Act are in addition to those under the Companies Act 1981, which apply to all Bermuda companies. The maximum amount available for payment of dividends or other distributions in 2012 without prior regulatory approval is approximately $427.9 million. All Bermuda companies must comply with the provisions of the Companies Act 1981 regulating the payment of dividends and making distributions from contributed surplus. A company may not declare or pay a dividend, or make a distribution from out of contributed surplus, if there are reasonable grounds for believing that: (a) the company is, or would after the payment be, unable to pay its liabilities as they become due; or (b) the realizable value of the company’s assets would thereby be less than the aggregate of its liabilities and its issued share capital and share premium accounts. The Insurance Act provides a minimum liquidity ratio for general business insurers. An insurer engaged in general business is required to maintain the value of its relevant assets at not less than 75% of the amount of its relevant liabilities. Relevant assets include cash and time deposits, quoted investments, unquoted bonds and debentures, first liens on real estate, investment income due and accrued, accounts and premiums receivable and reinsurance balances receivable. There are certain categories of assets which, unless specifically permitted by the Authority, do not automatically qualify as relevant assets, such as unquoted equity securities, investments in and advances to affiliates and real estate and collateral loans. The relevant liabilities are total general business insurance reserves and total other liabilities less deferred income tax and sundry liabilities (by interpretation, those not specifically defined). Statutory capital and surplus at December 31, 2012 and 2011, as determined using statutory accounting principles, is as follows:
2012 2011
Total GAAP shareholders' equity 2,116,864 1,886,551 Less: non-admitted assets (3,168) (3,755) Deferred acquisition costs (75,844) (50,146) LOC to Aspen Syndicate 4711 - (83,312) Deed of Guarantee to ASIC (76,734) (33,899) Deed of Guarantee to AAIC (26,834) (4,790) Statutory capital and surplus 1,934,284 1,710,649
Aspen Bermuda Limited Notes to Financial Statements December 31, 2012 and 2011 (All amounts expressed in United States dollars – amounts in tables expressed in thousands of United States dollars)
24
At December 31, 2012 and 2011 the Company was required to maintain relevant assets of approximately $2,208.1 million and $2,070.6 million, respectively. At those dates relevant assets were approximately $4,843.4 million and $4,504.8 million, respectively, satisfying the minimum liquidity ratio tests. At December 31, 2012 the Company’s ECR was $1.1 billion (2011 - $1.1 billion). 12. Taxation Under current Bermuda law the Company is not required to pay any taxes in Bermuda on either income or capital gains. The Company has received an assurance from the Minister of Finance of Bermuda under The Exempted Undertakings Tax Protection Act, 1966 of Bermuda that in the event of any such taxes being imposed the Company will be exempted from taxation until the year 2035. 13. Subsequent Events The Company completed its subsequent events evaluation for the period subsequent to the balance sheet date of December 31, 2012, through April 8, 2013 the date the financial statements were available for issuance, and determined that there were no material subsequent events requiring disclosure.