asphalt pavement industry survey on series 138 asphalt pavement industry survey on ... along with...
TRANSCRIPT
Information Series 138 (6th edition) | 1
Information Series 138
Asphalt Pavement
Industry Survey on Recycled Materials and
Warm-Mix Asphalt Usage
2015
6th Annual Survey

2 | Information Series 138 (6th edition)
NAPA Building ● 5100 Forbes Blvd. ● Lanham, MD 20706-4407 Tel: 301-731-4748 ● Fax: 301-731-4621
Toll free: 1-888-468-6499 ● www.AsphaltPavement.org Publication Sales: [email protected] ● Toll free: 888-600-4474
Tel: 412-741-6314 ● Fax: 412-741-0609
6th Annual Asphalt Pavement Industry Survey IS 138
Produced March 2017
This document is disseminated under the sponsorship of the U.S. Department of Transportation, Federal Highway Administration, in the interest of information exchange. The United States Government assumes no liability for its contents or the use of the information contained in this document. The contents of this report reflect the views of the contractor, who is responsible for the accuracy of the data presented herein. The contents do not necessarily reflect the official policy of the Department of Transportation. This report does not constitute a standard, specification, or regulation. The United States Government does not endorse products or manufacturers. Trade or manufacturer’s names may appear only because they are considered essential to the object of this document.

Information Series 138 (6th edition) | 3
Technical Report Documentation Page
1. Report No. 2. Government Accession No. 3. Recipient’s Catalog No.
Information Series 138 (6th edition)
4. Title and Subtitle 5. Report Date
Asphalt Pavement Industry Survey on Recycled Materials and Warm-Mix Asphalt Usage: 2015
March 2017
6. Performing Organization Code
7. Author(s) 8. Performing Organization Report No.
Kent R. Hansen, P.E., and Audrey Copeland, Ph.D., P.E. IS 138(6e)
9. Performing Organization Name and Address 10. Work Unit No. (TRAIS)
National Asphalt Pavement Association 5100 Forbes Blvd. Lanham, MD 20706
11. Contract or Grant No.
DTFH61-13-H-00027
12. Sponsoring Organization Name and Address 13. Type of Report and Period Covered
Federal Highway Administration Office of Asset Management, Pavement and Construction 1200 New Jersey Ave. SE Washington, DC 20590
Final Report 2015
14. Sponsoring Agency Code
FHWA-HIAP-20
15. Supplementary Notes
FHWA Agreement Officer’s Representative: Jeff Withee
16. Abstract
A shared goal of the Federal Highway Administration (FHWA) and the National Asphalt Pavement Association (NAPA) is to support and promote sustainable practices, such as the use of recycled materials and warm-mix asphalt (WMA). The use of recycled materials, primarily reclaimed asphalt pavement (RAP) and reclaimed asphalt shingles (RAS), in asphalt pavements conserves raw materials and reduces overall asphalt mixture costs, as well as reduces the stream of material going into landfills.
WMA technologies have been introduced to reduce production and compaction temperatures for asphalt mixtures, which reduces the energy needed and emissions associated with mix production. Additional benefits include improved compaction of asphalt mixtures leading to improved pavement performance, as well as a longer paving season. WMA was chosen for accelerated deployment in federal-aid highway, state department of transportation, and local road projects as part of FHWA’s 2010 Every Day Counts initiative.
The objective of this survey, first conducted for the 2009 and 2010 construction seasons, is to quantify recycled materials used and WMA produced annually by the asphalt pavement industry to document the deployment of these technologies to understand where they are being used and where they are underutilized. Results show significant growth in the use of RAP, RAS, and WMA technologies since 2009, although the rate of year-over-year growth has generally slowed since 2013.
The asphalt industry remains the country’s most diligent recycler with more than 99 percent of reclaimed asphalt pavement being put back to use. The average percentage of RAP used in asphalt mixtures has increased from 15.6 percent in 2009 to 20.3 percent in 2015. In 2015, the estimated RAP tonnage used in asphalt mixes was 74.2 million tons. This represents more than 3.7 million tons (21 million barrels) of asphalt binder conserved, along with the replacement of some 71 million tons of virgin aggregate.
Similarly, the use of RAS in asphalt pavement mixtures has increased from 701,000 tons in 2009 to an estimated 1.93 million tons in 2015, which is a slight (1.6 percent) decline from RAS tonnage in 2014.
The combined savings of asphalt binder and aggregate from using RAP and RAS in asphalt mixes is estimated at more than $2.6 billion.
More than 1.11 million tons of other recycled materials were reported as being incorporated into asphalt pavement mixtures during the 2015 construction season, included ground tire rubber, blast furnace slag, steel slag, and cellulose fibers.
The estimated total production of WMA for the 2015 construction season was 119.8 million tons. This was a greater than 5 percent increase from the estimated 113.8 million tons of WMA in 2014, and a more than 614 percent increase from the estimated 16.8 million tons in the 2009 construction season. WMA made up about one-third of the total estimated asphalt mixture market in 2015.
Plant foaming, representing 72 percent of the market, is the most commonly used warm-mix technology; chemical additive technologies accounted for a little more than 25 percent of the market.
17. Key Words 18. Distribution Statement
Reclaimed asphalt pavement, reclaimed asphalt shingles, warm-mix asphalt, ground tire rubber, slag, RAP, RAS, WMA, GTR, recycled materials
No restrictions.
19. Security Classification (of this report) 20. Security Classification (of this page) 21. No. of Pages 22. Price
Unclassified. Unclassified. 40 NA
Form DOT F 1700.7 (8-72) Reproduction of completed page authorized
4 | Information Series 138 (6th edition)
Table of Contents List of Abbreviations ............................................................................................................................................................... 5
Executive Summary ................................................................................................................................................................. 6
Background ............................................................................................................................................................................. 8
Objective and Scope ............................................................................................................................................................ 8
Survey Methodology ........................................................................................................................................................... 9
Survey Results ....................................................................................................................................................................... 11
Engineering Recycled Asphalt Mixtures for Quality ............................................................................................................. 14
Reclaimed Asphalt Pavement ............................................................................................................................................... 16
RAP Use by Sector ............................................................................................................................................................. 17
RAP Use by State ............................................................................................................................................................... 18
RAP Stockpiles ................................................................................................................................................................... 20
RAP Fractionation.............................................................................................................................................................. 21
RAP Rejuvenator Use ........................................................................................................................................................ 22
Reclaimed Asphalt Shingles .................................................................................................................................................. 23
RAS Use by Sector ............................................................................................................................................................. 23
RAS Use by State ............................................................................................................................................................... 25
Presumed RAS Binder Blending ........................................................................................................................................ 27
Cost Savings From RAP and RAS ........................................................................................................................................... 28
Warm-Mix Asphalt ................................................................................................................................................................ 29
WMA Use by Sector .......................................................................................................................................................... 29
WMA Use by State ............................................................................................................................................................ 30
WMA Technologies ........................................................................................................................................................... 31
Other Recycled Materials ...................................................................................................................................................... 32
Ground Tire Rubber .......................................................................................................................................................... 32
Steel & Blast Furnace Slag ................................................................................................................................................. 33
Other Recycled Materials .................................................................................................................................................. 35
Summary and Conclusions .................................................................................................................................................... 36
References ............................................................................................................................................................................ 39
Suggested Citation:
Hansen, K.R., & A. Copeland (2017). Annual Asphalt Pavement Industry Survey on Recycled Materials and Warm-Mix Asphalt Usage: 2015, 6th
Annual Survey (IS 138). National Asphalt Pavement Association, Lanham, Maryland.
Information Series 138 (6th edition) | 5
List of Abbreviations
AASHTO American Association of State Highway and Transportation Officials CCPR Cold Central Plant Recycling CIR Cold In-Place Recycling CRM Crumb Rubber Modifier DOT Department of Transportation FDR Full-Depth Reclamation FHWA Federal Highway Administration GTR Ground Tire Rubber HIR Hot In-Place Recycling HMA Hot-Mix Asphalt MWAS Manufacturing Waste Asphalt Shingles NAPA National Asphalt Pavement Association NCAT National Center for Asphalt Technology NCAUPG North Central Asphalt User/Producer Group NEAUPG North East Asphalt User/Producer Group NSA National Slag Association PCAS Post-Consumer Asphalt Shingles PCCAS Pacific Coast Conference on Asphalt Specifications RAP Reclaimed Asphalt Pavement RAS Reclaimed Asphalt Shingles RMA Rubber Manufacturers Association RMAUPG Rocky Mountain Asphalt User/Producer Group SAPA State Asphalt Pavement Association SEAUPG Southeastern Asphalt User/Producer Group UPG User/Producer Group WMA Warm-Mix Asphalt
On the Cover Route 17 in Stafford County, Virginia, was widened in 2016 with more than 92,500 tons of warm-mix asphalt that
incorporated 35 percent RAP in the base layer, 30 percent RAP in the intermediate layer, and 15 percent RAP in the
surface course. Superior Paving Co. of Bristow, Virginia, won a NAPA 2016 Quality in Construction Green Paving
Award for the project.
6 | Information Series 138 (6th edition)
Asphalt Pavement Industry Survey on Recycled Materials and Warm-Mix Asphalt Usage: 2015
Executive Summary The results of the asphalt pavement industry survey for the 2015 construction season show that asphalt mix producers have a
strong record of employing sustainable practices and continue to increase their use of recycled materials and warm-mix
asphalt (WMA). The use of recycled materials, particularly reclaimed asphalt pavement (RAP) and reclaimed asphalt shingles
(RAS), conserves raw materials and reduces overall asphalt mixture costs, allowing road owners to achieve more roadway
maintenance and construction activities within limited budgets. WMA technologies can improve compaction, ensuring
pavement performance and long life; conserve energy; reduce emissions from production and paving operations; and
improve conditions for workers.
The objective of this survey, first conducted for the 2009 and 2010 construction seasons, was to quantify the use of
recycled materials, primarily RAP and RAS, as well as the production of WMA by the asphalt pavement industry. For the
2015 construction season, the National Asphalt Pavement Association (NAPA) conducted a voluntary survey of asphalt
mixture producers across the United States on tons produced, along with a survey of state asphalt pavement
associations (SAPAs) regarding total tons of asphalt pavement mixture produced in their state.
Asphalt mix producers from 48 states and one territory completed the 2015 construction season survey. A total of 214
companies/branches with 1,119 plants were represented in the survey.
The following are highlights of the survey of usage during the 2015 construction season:
• Asphalt mixture producers remain the country’s most diligent recyclers, with more than 99 percent of asphalt
mix reclaimed from old asphalt pavements being put back to use in new pavements.
• The total estimated tons of RAP used in asphalt mixes reached 74.2 million tons in 2015. This is a nearly
3 percent increase from the 2014 construction season, and represents a greater than 32 percent increase from
the total estimated tons of RAP used in 2009. During the same time frame, total tonnage increased only
1.8 percent.
• The percent of producers reporting use of RAP decreased slightly from 100 percent of respondents in 2014 to
99 percent in 2015. Three producers reported landfilling a small amount of RAP during 2015.
• RAP usage during the 2015 construction season is estimated to have reduced the need for 3.7 million tons
(21 million barrels) of asphalt binder and nearly 70.5 million tons of aggregate, with an estimated value in excess
of $2.4 billion.
• The total estimated amount of RAP stockpiled nationwide at the end of the 2015 construction season was
85.1 million tons.
• Fractionated RAP represents about 23 percent of RAP use nationwide, and the tons of RAP mixtures produced
using softer binders are estimated at 24 percent while tons produced using rejuvenators is estimated at
3 percent.
• The total estimated tons of RAS used in asphalt mixes decreased slightly (1.6 percent) to an estimated
1.93 million tons in 2015. Still, the use of RAS in the 2015 construction season increased 175 percent from the
estimated 701,000 tons used in asphalt mixtures in 2009.

Information Series 138 (6th edition) | 7
• RAS usage during the 2015 construction season is estimated to have reduced the need for 386,200 tons
(2.1 million barrels) of asphalt binder and nearly 965,500 tons of aggregate, with an estimated value of about
$194 million.
• Other recycled materials commonly used in asphalt mixtures during the 2015 construction season were ground
tire rubber, blast furnace slag, steel slag, and cellulose fibers. Less commonly used recycled materials in asphalt
mixtures included fly ash and foundry sand.
• The estimated total production of WMA for the 2015 construction season was 119.8 million tons. This was a
greater than 5 percent increase from the estimated 113.8 million tons of WMA in 2014, and a more than
614 percent increase from the estimated 16.8 million tons in the 2009 construction season.
• WMA made up about one-third of the total estimated asphalt mixture market in 2015.
• Plant foaming, representing 72 percent of the market, is the most commonly used warm-mix technology;
chemical additive technologies accounted for a little more than 25 percent of the market.

8 | Information Series 138 (6th edition)
Asphalt Pavement Industry Survey on Recycled Materials and Warm-Mix Asphalt Usage: 2015
Background A shared goal of the Federal Highway Administration (FHWA) and the National Asphalt Pavement Association (NAPA) is
to support and promote sustainable practices, such as incorporation of recycled materials in pavement mixtures and the
use of warm-mix asphalt (WMA). Reclaimed asphalt pavement (RAP) is recycled at a greater rate than any other material
in the United States and helps lower overall material costs, allowing road owners to achieve more roadway maintenance
and construction activities within limited budgets. Another recycled material used in asphalt mixtures is reclaimed
asphalt shingles (RAS) from both manufacturing waste (MWAS) and post-consumer asphalt shingles (PCAS). The use of
RAP and RAS in asphalt pavements can reduce the amount of new asphalt binder and aggregates required in mixes,
which can help stabilize the price of asphalt mixtures and save natural resources. Other recycled materials commonly
incorporated into asphalt pavements include ground tire rubber (GTR), steel slag, blast furnace slag, and cellulose fibers,
among others. By putting waste materials and byproducts to a practical use, the asphalt pavement industry helps reduce
the amount of material going to landfills while improving the sustainability of asphalt mixtures.
WMA technologies reduce the mixing and compaction temperatures for asphalt mixtures. Environmental benefits
include reductions in both fuel consumption and air emissions. Construction benefits include the ability to extend the
paving season into the cooler months, haul material longer distances, improve compaction, and use higher percentages
of RAP (Prowell et al., 2012). As part of FHWA’s original group of Every Day Counts initiatives, WMA was chosen in 2010
for accelerated deployment in federal-aid highway, state department of transportation (DOT), and local road projects
(FHWA, 2013). In 2013, WMA was honored with the Construction Innovation Forum’s NOVA Award for its engineering,
economic, and environmental benefits (CIF, 2013).
FHWA works closely with the pavement industry through associations and other stakeholders to promote pavement
recycling technologies and WMA. From 2007 to 2011, the American Association of State Highway and Transportation
Officials (AASHTO) conducted a biennial survey of state DOTs’ use of recycled materials (Copeland, 2011; Copeland et al.,
2010; Pappas, 2011). The results of the AASHTO survey were presented at FHWA Expert Task Group meetings. FHWA
partners with NAPA to document industry use of RAP, RAS, other recycled materials, as well as WMA technologies used
by asphalt mix producers. These efforts have established a baseline for RAP, RAS, and WMA usage, and have tracked
growth in the use of these sustainable practices in the highway industry since 2009.
FHWA has partnered with NAPA to capture annual RAP, RAS, and WMA use starting with the 2009 construction season
(Hansen & Newcomb, 2011; Hansen & Copeland, 2013a; 2013b; 2014; 2015). Compared to the findings of the first survey
(Hansen & Newcomb, 2011), asphalt mix producers have shown significant growth in the use of these technologies,
although the year-over-year rate of growth has slowed since the 2013 construction season. Since 2012, the survey has also
asked about other recycled materials used in asphalt mixtures. This report documents the results of the industry survey for
the 2015 construction season, including the survey methodology, results, trends, and changes from 2009 through 2015.
The survey questions and data by state are included in the appendices.
Objective and Scope The objective of this effort is to quantify the use of recycled materials and WMA technologies by the asphalt pavement
industry. During 2016, NAPA conducted a voluntary survey of asphalt mixture producers in the United States on tons
produced, along with a survey of state asphalt pavement associations (SAPAs) regarding total tons of asphalt pavement

Information Series 138 (6th edition) | 9
mixture produced in their state during the 2015 construction season. While keeping specific producer data confidential,
NAPA staff compiled the amount of asphalt mixtures produced; the amount of RAP, RAS, and other recycled material
used; and the amount of WMA produced in the United States. Not measured in this survey is the use of in-place asphalt
pavement recycling techniques, such as full-depth reclamation (FDR), cold in-place recycling (CIR), and hot in-place
recycling (HIR). Some cold central plant recycling (CCPR) of RAP may be included in Table 5 among the tons reported as
“Used in Other” or “Used in Cold Mix.”
Survey Methodology The data are analyzed and summarized in this report. To accomplish this work, the following tasks were conducted:
1. Develop an online survey that enables an analysis of the quantities of recycled materials being used in asphalt
mixtures, as well as the total amount of WMA produced nationally.
2. Conduct a voluntary survey of asphalt mix producers throughout the United States and follow up with verbal
requests for information in locations where responses were low.
3. Estimate the total asphalt mixture market in each state or territory by using data provided by SAPAs and the
U.S. Department of Transportation federal-aid highway apportionment to determine a weighting factor for
each state and reconciling the total U.S. asphalt mix tonnage with national estimates.
4. Analyze and summarize the information nationally and by state and prepare a final report.
The survey was conducted using an online survey platform, SurveyMonkey®. Table 1 summarizes the questions asked in
each section of the survey. Sections 1 through 4 have remained consistent from the 2009 to 2014 construction seasons.
Additional questions (highlighted in yellow in Table 1) were added to Sections 2 through 4 for the 2015 construction season
to gather additional information about the use of RAP, RAS, and WMA. Section 5 was added in the 2012 construction
season survey to collect information on the use of other recycled material in asphalt mixtures. For 2015, the Section 5
question asking about specific recycled materials was modified to replace one user-provided response with cellulose fiber.
A copy of the survey form used to gather information for the 2015 construction season is provided as Appendix A.
Producers were notified of the survey through several forums and electronic media. A notice was posted in NAPA’s
e-newsletter, ActionNews, informing members of the survey and asking for their participation. SAPAs solicited
participation by placing notices on their websites and in their newsletters. Announcements were made at NAPA
meetings, as well as at several state asphalt conferences. A press release was sent to construction industry trade media,
and was published in print and online. Notices of the survey and links were shared through social media channels,
including Twitter, Facebook, and LinkedIn.
Asphalt mixture producers then went to the SurveyMonkey website to complete the survey form. Some producers
submitted PDF forms and the data were entered into SurveyMonkey by NAPA. Some multistate producers submitted
data using a spreadsheet developed by NAPA. After the initial data was gathered and analyzed, anomalies in individual
producer records were identified and reconciled.
To determine the estimated total amount of RAP and RAS used and WMA produced nationwide and in each state, the total
amount of asphalt mix produced in each state needed to be determined. Total tonnage of asphalt mix produced represents
both commercial (i.e., private sector) and governmental (i.e., DOT and Other Agency) tonnages. Estimated tonnages for
each sector were provided by SAPAs for 33 states/territories, totaling about 294 million tons. This includes one SAPA that
supplied an estimate of DOT-only tonnage. For this one state, total tonnage was estimated by dividing the DOT tonnage
provided by the SAPA by the percent of DOT tons reported through the survey by asphalt mixture producers in that state.

10 | Information Series 138 (6th edition)
Table 1: Survey Questions Summary (Questions Added in 2015 Highlighted in Yellow)
To estimate the total tons in states where a SAPA estimate of total tonnage was not available, a power curve
relationship based on an examination of the relationship between SAPA-estimated tons and federal-aid highway
apportionment for those states was determined, resulting in Equation 1. This is the same methodology used to estimate
tonnage in previous versions of this survey, and is detailed in Hansen & Newcomb (2011).
Total Estimated Tons = 0.0784 × (State Federal Apportionment)0.9058 [1]
Appendix B and certain tables in this report detail survey responses and estimated values on a state-by-state basis. To
keep specific producer data confidential, no state-specific information is provided in the tables or appendix if fewer than
three producers from the state responded to the survey. Information from states with fewer than three responding
companies is included in the estimated national values, however.
Section 1: General Information
Section 2: RAP Section 3: RAS Section 4: WMA Section 5: Other Recycled
Materials
Number of Plants Tons Accepted Tons Unprocessed Shingles Accepted
Average % Produced for DOT Tons
Were Other Recycled Materials Used (Y/N)
DOT Tons Tons Used in HMA/WMA Tons Processed Shingles Accepted
Average % Produced for Other Agency Tons
Other Recycled Materials Used (GTR, Steel Slag, Blast Furnace Slag, Cellulose Fiber, Up to Two User-Provided Responses)
Other Agency Tons Tons Used in Aggregate Tons Used in HMA/WMA Average % Produced for Commercial & Residential Tons
Tons of HMA/WMA Produced Using Each Recycled Material
Commercial & Residential Tons
Tons Used in Cold Mix Tons Used in Aggregate Chemical Additive % Tons of Each Other Recycled Product Used
Tons Used in Other Tons Used in Cold Mix Additive Foaming %
Tons Landfilled Tons Used in Other Plant Foaming %
Average % for DOT Mixes Tons Landfilled Organic Additive %
Average % for Other Agency Mixes
Average % for DOT Mixes Were WMA Additives Used to Produce Mixtures at HMA Temperatures (Y/N)
Average % for Commercial & Residential Mixes
Average % for Other Agency Mixes
Excess RAP (Y/N) Average % for Commercial & Residential Mixes
Percentage of RAP Fractionated
Excess RAS (Y/N)
Percentage of RAP Mixtures Using Softer Asphalt Binder
What Sectors Allow RAS
Percentage of RAP Mixtures Using Rejuvenators
Estimated percent of RAS Binder Blending with New Asphalt Binder
Tons of RAP Stockpiled

Information Series 138 (6th edition) | 11
Survey Results Asphalt mixture producers from 48 states and one territory completed the survey for the 2015 construction season,
which is one fewer jurisdiction than in 2014. No plants in the District of Columbia, New Mexico, or South Dakota
contributed data for 2015. A total of 214 companies/branches with 1,119 plants are represented in the 2015 survey. This
is down slightly from the 2013 and 2014 construction season surveys, but is equal to or greater than other construction
seasons surveyed. While the total number of companies/branches and plants represented in the survey decreased, the
total tons reported increased from 151.0 million to 152.8 million tons. This may be due to a slight increase in total
asphalt mix production and producers shutting down some less productive or less efficient plants. Table 2 summarizes
the number of asphalt mix production companies/branches and the number of plants reporting for each state. Table 3
summarizes the total number of plants responding in previous years.
Table 2: No. of Companies/Branches Completing 2015 Construction Season Survey by State
State Cos. Plants State Cos. Plants State Cos. Plants
Alabama 4 34 Kentucky 6 44 Ohio 4 67
Alaska * * Louisiana * * Oklahoma 5 13
American Samoa NCR NCR Maine * * Oregon 4 12
Arizona * * Maryland 6 17 Pennsylvania 8 33
Arkansas 6 18 Massachusetts 4 13 Puerto Rico * *
California 4 50 Michigan 5 38 Rhode Island * *
Colorado 4 21 Minnesota 7 27 South Carolina 5 10
Connecticut * * Mississippi 3 18 South Dakota NCR NCR
Delaware * * Missouri 4 18 Tennessee 8 56
District of Columbia NCR NCR Montana * * Texas 8 52
Florida 6 35 Nebraska * * U.S. Virgin Islands NCR NCR
Georgia * * Nevada * * Utah 8 21
Guam NCR NCR New Hampshire 3 11 Vermont * *
Hawaii * * New Jersey * * Virginia 7 39
Idaho 6 18 New Mexico NCR NCR Washington 5 30
Illinois 15 35 New York 12 72 West Virginia 3 13
Indiana 4 36 North Carolina 8 56 Wisconsin 3 57
Iowa 6 18 North Dakota * * Wyoming * *
Kansas 4 20 No. Mariana Islands NCR NCR
NCR = No Companies/Branches Reporting * = Fewer than 3 Companies/Branches Reporting
Table 3: Summary of Jurisdictions (States or Territories), Companies/Branches, and Plants Represented, 2009–2015
Year No. Jurisdictions
Reporting
No. of Companies/Branches
Reporting
No. of Plants Represented
in Survey
Average Tons
Produced per Plant
2009 48 196 1,027 121,000
2010 48 196 1,027 117,000
2011 49 203 1,091 121,000
2012 49 213 1,141 122,000
2013 52 249 1,281 115,000
2014 50 228 1,185 127,000
2015 49 214 1,119 137,000
Table 4 includes state-by-state 2015 construction season total estimated tonnage, as estimated by the SAPA or from
Equation 1; tonnage reported by survey respondents; and the percent of reported tons included in estimated tons. The
closer a state’s percentage is to 100% indicates the completeness of reported tonnage compared to estimated tonnage.

12 | Information Series 138 (6th edition)
At the national level, the survey responses make up 42 percent of the estimated total tons for the 2015 construction
season.
Table 4: Summary of 2015 Estimated and Reported Plant Mix Asphalt Tons by State
State
Tons, Millions Reported % of Estimated State
Tons, Millions Reported % of Estimated Estimated Reported Estimated Reported
Alabama 7.50 3.73 50% Montana 4.08 * * Alaska 4.71 * * Nebraska 3.03 * * Arizona 6.76 * * Nevada 3.53 * * Arkansas 3.20 1.87 58% New Hampshire 1.77 1.30 73% California 25.51 9.33 37% New Jersey 8.66 * * Colorado 7.20 1.51 21% New Mexico 3.50 NCR NCR
Connecticut 3.10 * * New York 16.80 7.22 43%
Delaware 1.71 * * North Carolina 11.00 5.93 54% District of Columbia 1.72 NCR NCR North Dakota 3.04 * * Florida 14.39 6.04 42% Ohio 17.4 11.01 63% Georgia 5.00 * * Oklahoma 6.28 2.06 33% Hawaii 1.72 * * Oregon 4.85 1.67 34% Idaho 3.98 1.06 27% Pennsylvania 19.42 4.60 24% Illinois 15.80 5.19 33% Puerto Rico 1.00 * * Indiana 10.50 5.06 48% Rhode Island 2.28 * * Iowa 3.60 1.47 41% South Carolina 5.45 1.66 30% Kansas 4.00 1.90 48% South Dakota 2.05 NCR NCR Kentucky 6.50 4.09 63% Tennessee 7.76 5.50 71% Louisiana 4.00 * * Texas 20.00 8.27 41% Maine 2.27 * * Utah 3.49 3.26 93% Maryland 7.50 3.30 44% Vermont 2.10 * * Massachusetts 6.20 2.86 46% Virginia 12.50 6.75 54% Michigan 12.60 7.07 56% Washington 5.34 3.47 65% Minnesota 13.50 6.14 45% West Virginia 3.50 1.72 49% Mississippi 4.50 2.09 46% Wisconsin 11.00 8.15 74% Missouri 6.00 1.61 27% Wyoming 2.59 * *
Total 364.91 152.79† 42%
NCR No Companies Reporting * Fewer than 3 Companies/Branches Reporting † Total Reported Tons includes values from state with fewer than 3 Companies/Branches Reporting SAPA Estimated Tons
Figure 1 shows the number of plants, as well as the average tons produced per plant, separated by User/Producer Group
(UPG) region. While the number of plants responding from each UPG region (apart from the North East Asphalt
User/Producer Group), decreased from the 2014 to 2015 construction season, the tons per plant for all UPGs increased.
Significant increases were noted for the North Central Asphalt User/Producer Group (NCAUPG) and North East Asphalt
User/Producer Group (NEAUPG) regions.

Information Series 138 (6th edition) | 13
Figure 1: Number of Plants Responding to Survey by User/Producer Group Regions and Estimated Tonnage, 2009–2015
Table 5 summarizes the RAP, RAS, and WMA data from the 2015 construction season survey alongside data from the
2014 construction season survey (Hansen & Copeland, 2015) for comparison. The information requested in the survey is
summarized in Table 1 and detailed in Appendix A. The column labeled “Reported Values” in Table 5 are national
summaries of the values from asphalt mixture producers completing the survey. The column labeled “Estimated Values”
for the category labeled “Tons of HMA/WMA Produced” were determined as outlined in the Survey Methodology.
For the amount of RAP accepted, asphalt mix producers were asked “How many tons of removed asphalt pavement and
asphalt millings were accepted/delivered to your facilities in the state in 2015?” For the amount of RAS accepted,
producers were asked “How many tons of unprocessed shingles (manufacturing waste and post-consumer/tear-off)
were accepted/delivered to your facilities in the state in 2015?” For the 2015 construction season, producers were also
asked how many tons of processed RAS was acquired from shingle processors. These data are reported in Table 5 as the
tonnage of material accepted. Producers were also asked the tonnage of RAP and RAS used in the production of asphalt
pavement mixtures, cold mix asphalt, as aggregate, or for other purposes, such as in a chip seal. The tons of reclaimed
material sent to landfills was also requested.
For each state, the tons of RAS and RAP reported as accepted and used were multiplied by the ratio of estimated
production to total production, and these values were summed to arrive at the national estimated tons for these
materials, which is reported in the “Estimated Values” column of Table 5.

14 | Information Series 138 (6th edition)
To understand the average percentage of recycled material used in mixes, producers were asked to report the average
recycled content of mixes produced for each sector (DOT, Other Agencies, Commercial & Residential). If precise data
was not available, respondents were asked to provide their best estimate. These responses are reported in the “Average
% Used in Mixes” section of Table 5 for RAP and RAS. To control for inaccuracies in producer estimates of sector-by-
sector percentages, a “National Average All Mixes Based on Tons Used in HMA/WMA” was calculated and reported in
Table 5 for both RAP and RAS based on reported tonnage of each material used in HMA/WMA mixes divided by the total
reported tons produced. Producers were not asked about allowable RAP limits or binder replacement requirements,
which can influence demand for mixes that incorporate these materials.
Producers were asked to give their best estimate of the percent of asphalt paving mixtures produced for each sector
when WMA technology resulted in a temperature reduction of 10°F to 100°F. These percentages were multiplied by the
total mix production for each sector to determine the total estimated tons of WMA produced for each sector. The
survey methodology was designed so that only mixes produced at reduced temperatures are reported. Some WMA
additives are also used for construction benefits unrelated to the goal of reducing production temperatures; therefore,
for the 2015 construction season producers were also asked if they used WMA additives to produce mixtures at HMA
temperatures.
Engineering Recycled Asphalt Mixtures for Quality
For more than three decades, two guiding principles of asphalt recycling have been: 1) mixtures containing RAP
should meet the same requirements as mixes with all virgin materials, and 2) mixes containing RAP should
perform equal to or better than virgin mixtures. This is at the heart of the “Three E’s of Recycling,” which state
that recycled materials should provide Environmental, Economic, and Engineering benefits.
Quality recycled mixes have been successfully designed and produced for many years. The proof is in
performance: a recent study comparing the performance of recycled versus virgin mixes based on Long-Term
Pavement Performance (LTPP) data from 16 U.S. states and two Canadian provinces shows that overlays
containing at least 30 percent RAP performed equal to overlays using virgin mixtures (Carvalho et al., 2010;
West et al., 2011). At the NCAT Test Track, test sections containing 50 percent RAP using standard Superpave mix
design procedures for each layer outperformed companion test sections with all virgin materials in all pavement
performance measures.
However, as the amount and mix of recycled materials in asphalt pavement mixtures increase, additional
considerations for material handling, mixture design, and quality testing become more important. In particular,
RAP and RAS should be tested and classified to determine the amount and qualities of available asphalt cement.
The absorbability of RAP aggregate should also be tested and determined. These values have an impact on
pavement performance and are important to assess when developing a high recycled content mix design. In some
cases, it may be necessary to make use of rejuvenators or a softer asphalt binder to ensure the final mix design
delivers the desired level of product performance.
For more information about processing and using reclaimed asphalt pavement and recycled asphalt shingles,
consult the NAPA publication Best Practices for RAP and RAS Management (Quality Improvement Series No. 129)
(West, 2016).

Information Series 138 (6th edition) | 15
Table 5: Summary of RAP, RAS, WMA Data
Reported Values Estimated Values
2014 2015 2014 2015
Tons of HMA/WMA Produced Tons, Millions Tons, Millions
Total 151.0 152.8 352.0 364.9
DOT 68.7 68.5 160.2 163.6
Other Agency 38.9 40.0 90.7 95.5
Commercial & Residential 43.3 44.3 101.1 105.8
Companies/Branches Reporting 228 214
RAP Tons, Millions Tons, Millions
Accepted 33.8 33.2 75.8 78.0
Used in HMA/WMA 32.2 32.7 71.9 74.2
Used in Aggregate 2.9 1.7 8.5 5.5
Used in Cold Mix 0.1 0.1 0.2 0.2
Used in Other 0.2 0.4 0.6 1.6
Landfilled 0.1 0.4 0.2 1.0
Avg. % Used in Mixes
Avg. % Used in Mixes
Average % for DOT Mixes1 19.6% 17.8%
Average % for Other Agency Mixes1 19.8% 18.2%
Average % for Commercial & Residential1 22.7% 22.3%
National Average All Mixes Based on RAP Tons Used in HMA/WMA2 21.3% 21.4% 20.4% 20.3%
Companies/Branches Reporting Using RAP 228 211
RAS Tons, Millions Tons, Millions
Unprocessed Shingles Accepted 0.692 0.456 1.664 1.129
Processed Shingles Accepted N/A 0.375 N/A 0.842
Used in HMA/WMA 0.809 0.819 1.964 1.931
Used in Aggregate 0.018 0.004 0.043 0.009
Used in Cold Mix — — 0 —
Used in Other 0.002 — 0.006 —
Landfilled — — 0 —
Avg. % Used in Mixes
Avg. % Used in Mixes
Average % for DOT Mixes1 0.72% 0.76%
Average % for Other Agency Mixes1 0.95% 0.88%
Average % for Commercial & Residential1 1.47% 1.06%
National Average All Mixes Based on RAS Tons Used in HMA/WMA2 0.54% 0.54%
Companies/Branches Reporting Using RAS 87 89
WMA % of Total Production Tons, Millions
DOT 37.8% 37.4% 56.9 60.9
Other Agency 34.9% 34.0% 28.4 28.5
Commercial & Residential 29.4% 34.3% 28.5 30.4
Total 113.8 119.8
% of WMA Production
Chemical Additive % 15.0% 25.2%
Additive Foaming % 0.0% 2.1%
Plant Foaming % 84.5% 72.0%
Organic Additive % 0.5% 0.7%
Companies/Branches Reporting Using WMA 174 166 1 Average percent based on contractor’s reported percentage for each sector.
2 Average percent based on total reported tons of RAP or RAS used in HMA/WMA divided by reported total tons HMA/WMA produced.
16 | Information Series 138 (6th edition)
Reclaimed Asphalt Pavement
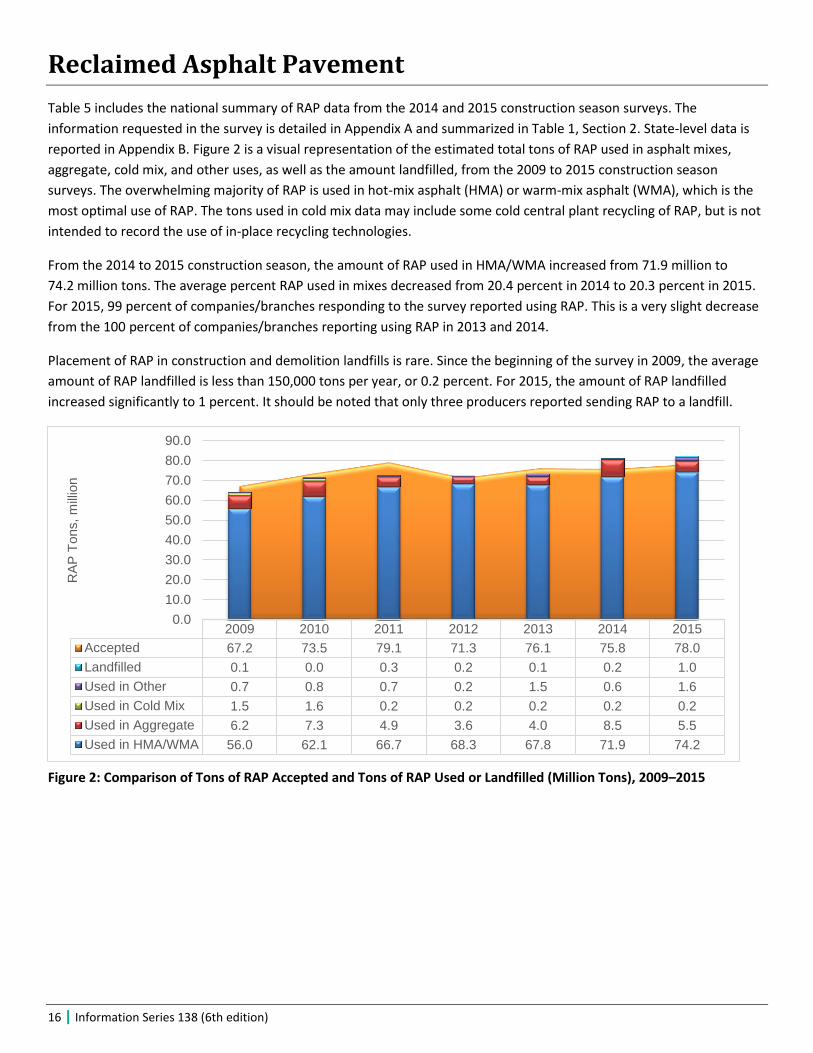
Table 5 includes the national summary of RAP data from the 2014 and 2015 construction season surveys. The
information requested in the survey is detailed in Appendix A and summarized in Table 1, Section 2. State-level data is
reported in Appendix B. Figure 2 is a visual representation of the estimated total tons of RAP used in asphalt mixes,
aggregate, cold mix, and other uses, as well as the amount landfilled, from the 2009 to 2015 construction season
surveys. The overwhelming majority of RAP is used in hot-mix asphalt (HMA) or warm-mix asphalt (WMA), which is the
most optimal use of RAP. The tons used in cold mix data may include some cold central plant recycling of RAP, but is not
intended to record the use of in-place recycling technologies.
From the 2014 to 2015 construction season, the amount of RAP used in HMA/WMA increased from 71.9 million to
74.2 million tons. The average percent RAP used in mixes decreased from 20.4 percent in 2014 to 20.3 percent in 2015.
For 2015, 99 percent of companies/branches responding to the survey reported using RAP. This is a very slight decrease
from the 100 percent of companies/branches reporting using RAP in 2013 and 2014.
Placement of RAP in construction and demolition landfills is rare. Since the beginning of the survey in 2009, the average
amount of RAP landfilled is less than 150,000 tons per year, or 0.2 percent. For 2015, the amount of RAP landfilled
increased significantly to 1 percent. It should be noted that only three producers reported sending RAP to a landfill.
Figure 2: Comparison of Tons of RAP Accepted and Tons of RAP Used or Landfilled (Million Tons), 2009–2015
2009 2010 2011 2012 2013 2014 2015
Accepted 67.2 73.5 79.1 71.3 76.1 75.8 78.0
Landfilled 0.1 0.0 0.3 0.2 0.1 0.2 1.0
Used in Other 0.7 0.8 0.7 0.2 1.5 0.6 1.6
Used in Cold Mix 1.5 1.6 0.2 0.2 0.2 0.2 0.2
Used in Aggregate 6.2 7.3 4.9 3.6 4.0 8.5 5.5
Used in HMA/WMA 56.0 62.1 66.7 68.3 67.8 71.9 74.2
0.0
10.0
20.0
30.0
40.0
50.0
60.0
70.0
80.0
90.0
RA
P T
ons,
mill
ion
Information Series 138 (6th edition) | 17
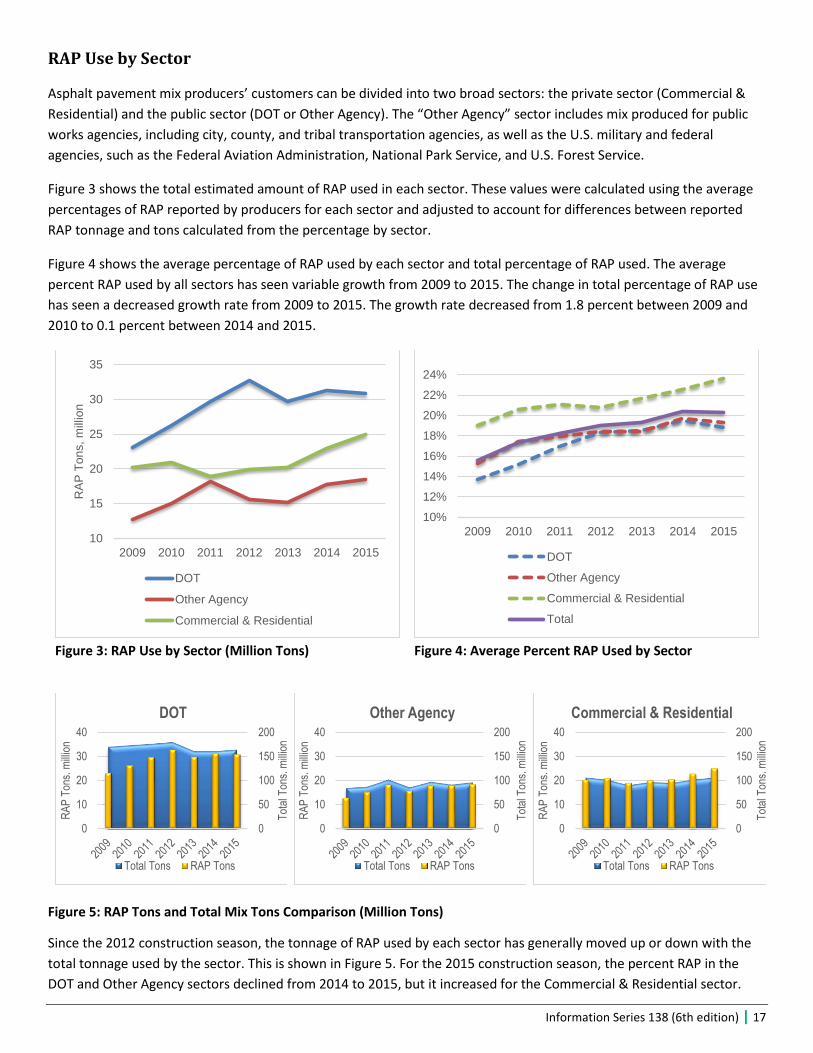
RAP Use by Sector
Asphalt pavement mix producers’ customers can be divided into two broad sectors: the private sector (Commercial &
Residential) and the public sector (DOT or Other Agency). The “Other Agency” sector includes mix produced for public
works agencies, including city, county, and tribal transportation agencies, as well as the U.S. military and federal
agencies, such as the Federal Aviation Administration, National Park Service, and U.S. Forest Service.
Figure 3 shows the total estimated amount of RAP used in each sector. These values were calculated using the average
percentages of RAP reported by producers for each sector and adjusted to account for differences between reported
RAP tonnage and tons calculated from the percentage by sector.
Figure 4 shows the average percentage of RAP used by each sector and total percentage of RAP used. The average
percent RAP used by all sectors has seen variable growth from 2009 to 2015. The change in total percentage of RAP use
has seen a decreased growth rate from 2009 to 2015. The growth rate decreased from 1.8 percent between 2009 and
2010 to 0.1 percent between 2014 and 2015.
Figure 3: RAP Use by Sector (Million Tons)
Figure 4: Average Percent RAP Used by Sector
Figure 5: RAP Tons and Total Mix Tons Comparison (Million Tons)
Since the 2012 construction season, the tonnage of RAP used by each sector has generally moved up or down with the
total tonnage used by the sector. This is shown in Figure 5. For the 2015 construction season, the percent RAP in the
DOT and Other Agency sectors declined from 2014 to 2015, but it increased for the Commercial & Residential sector.
10
15
20
25
30
35
2009 2010 2011 2012 2013 2014 2015
RA
P T
on
s,m
illio
n
DOT
Other Agency
Commercial & Residential
10%
12%
14%
16%
18%
20%
22%
24%
2009 2010 2011 2012 2013 2014 2015
DOT
Other Agency
Commercial & Residential
Total
0
50
100
150
200
0
10
20
30
40
Tot
al T
ons,
mill
ion
RA
P T
ons.
mill
ion
DOT
Total Tons RAP Tons
0
50
100
150
200
0
10
20
30
40
Tot
al T
ons,
mill
ion
RA
P T
ons.
mill
ion
Other Agency
Total Tons RAP Tons
0
50
100
150
200
0
10
20
30
40
Tot
al T
ons,
mill
ion
RA
P T
ons.
mill
ion
Commercial & Residential
Total Tons RAP Tons
18 | Information Series 138 (6th edition)
The increased percent of RAP used in the Commercial & Residential sector, combined with an increase in the tons of mix
used for this sector offset declines in the DOT sector, resulting in an insignificant loss (0.1%) in the national average of
percentage of RAP used.
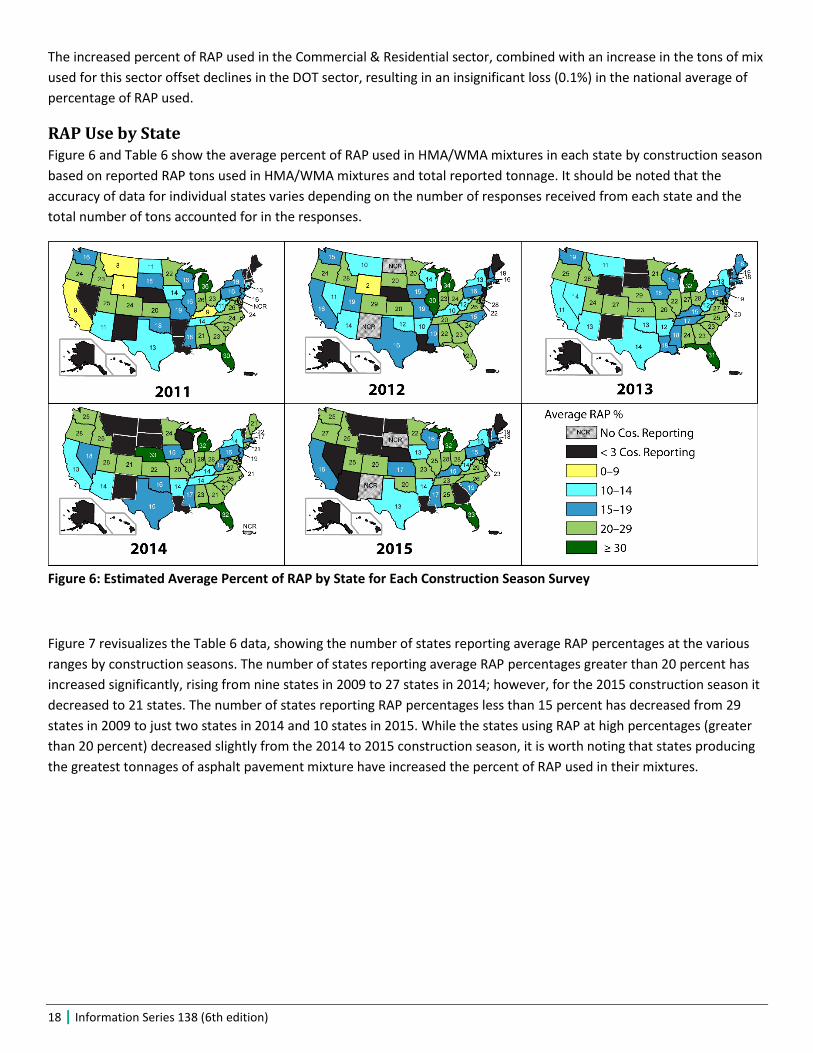
RAP Use by State Figure 6 and Table 6 show the average percent of RAP used in HMA/WMA mixtures in each state by construction season
based on reported RAP tons used in HMA/WMA mixtures and total reported tonnage. It should be noted that the
accuracy of data for individual states varies depending on the number of responses received from each state and the
total number of tons accounted for in the responses.
Figure 6: Estimated Average Percent of RAP by State for Each Construction Season Survey
Figure 7 revisualizes the Table 6 data, showing the number of states reporting average RAP percentages at the various
ranges by construction seasons. The number of states reporting average RAP percentages greater than 20 percent has
increased significantly, rising from nine states in 2009 to 27 states in 2014; however, for the 2015 construction season it
decreased to 21 states. The number of states reporting RAP percentages less than 15 percent has decreased from 29
states in 2009 to just two states in 2014 and 10 states in 2015. While the states using RAP at high percentages (greater
than 20 percent) decreased slightly from the 2014 to 2015 construction season, it is worth noting that states producing
the greatest tonnages of asphalt pavement mixture have increased the percent of RAP used in their mixtures.

Information Series 138 (6th edition) | 19
Table 6: Average Estimated RAP Percent
State
Average RAP Percent
State
Average RAP Percent
2011 2012 2013 2014 2015 2011 2012 2013 2014 2015
Alabama 21% 22% 24% 23% 25% Montana 8% 10% 11%
Alaska Nebraska 29% 33%
Arizona 11% 14% 13% 14% Nevada 11% 14% 18%
Arkansas 10% 12% 14% 14% New Hampshire 19% 19% 22% 19%
California 9% 16% 11% 13% 16% New Jersey 16% 19% 19% Colorado 24% 29% 27% 21% 20% New Mexico NCR NCR
Connecticut 13% 21% New York 16% 13% 13% 14% 16%
Delaware NCR 28% North Carolina 24% 15% 25% 26% 26%
Dist. of Columbia NCR NCR NCR NCR North Dakota 11% NCR
Florida 30% 27% 31% 32% 33% Ohio 23% 24% 28% 28% 28%
Georgia 23% 23% 23% 21% Oklahoma 18% 12% 13% 16% 20%
Hawaii Oregon 24% 24% 25% 28% 27%
Idaho 23% 28% 28% 25% 25% Pennsylvania 16% 16% 15% 16% 15%
Illinois 16% 30% 22% 28% 25% Puerto Rico NCR Indiana 26% 23% 27% 29% 28% Rhode Island
Iowa 14% 15% 18% 15% 13% South Carolina 22% 24% 23% 21% 19%
Kansas 20% 20% 23% 22% 17% South Dakota 18% 20% NCR
Kentucky 9% 10% 15% 14% 15% Tennessee 14% 20% 17% 14% 23%
Louisiana 18% Texas 13% 16% 14% 15% 13%
Maine 18% 21% Utah 25% 19% 24% 28% 25%
Maryland 24% 22% 23% 21% 23% Vermont
Massachusetts 16% 18% 17% 18% Virginia 26% 26% 27% 27% 29%
Michigan 36% 34% 32% 32% 32% Washington 16% 15% 19% 25% 25%
Minnesota 22% 20% 21% 24% 22% West Virginia 11% 12% 12% 15% 14%
Mississippi 18% 19% 18% 17% 17% Wisconsin 16% 14% 15% 16%
Missouri 19% 19% 20% 20% 23% Wyoming 1% 2%
No Companies Reporting
< 3 Companies Reporting
0–9% 10–14% 15–19% 20–29% ≥ 30%
Figure 7: Count of States at Different Average RAP Percentages in HMA/WMA Mixtures
14 149
4 30
5
1510
12
12 15
2
5
14
1414
1313
21
18
914
14
1919
2419
0 03
12
3 2
0
10
20
30
40
50
60
2009 2010 2011 2012 2013 2014 2015
Num
be
r o
f S
tate
s
>0–9% RAP 10–15% RAP 15–19% RAP 20–29% RAP ≥30% RAP

20 | Information Series 138 (6th edition)
RAP Stockpiles During the 2015 construction season, as in 2012 and 2014, more RAP was used across all purposes than was received,
which indicates producers are drawing upon stockpiled RAP. For 2015, 88 percent of producers reported having excess
RAP on hand, compared to more than 91 percent of producers in 2014.
Table 7 shows the reported and estimated amount of RAP stockpiled by state at the end of the 2015 construction
season. To calculate the estimated values, reported tons of RAP stockpiled were divided by the ratio of total reported
tons of mix produced to estimated tons of mix produced. The total tonnage row in Table 7 includes stockpiled tonnages
from states with fewer than three producers reporting. As expected, the more densely populated states with large
urban areas (e.g., California, Pennsylvania, Michigan, and Florida) show the highest amount of RAP stockpiled. While the
amount is not shown in Table 7 because fewer than three companies/branches in the state responded to the survey,
New Jersey has more RAP stockpiled (reported and estimated) than any other state.
Table 7: Reported Tons of RAP Stockpiled
State
Reported Tons Stockpiled (Million)
Estimated Tons Stockpiled (Million) State
Reported Tons Stockpiled (Million)
Estimated Tons Stockpiled (Million)
Alabama 0.92 1.85 Montana * *
Alaska * * Nebraska * *
Arizona * * Nevada * *
Arkansas 0.20 0.34 New Hampshire 0.10 0.13
California 2.17 5.93 New Jersey * *
Colorado 0.24 1.15 New Mexico NCR NCR
Connecticut * * New York 1.11 2.58
Delaware * * North Carolina 1.63 3.02
District of Columbia NCR NCR North Dakota * *
Florida 1.55 3.68 Ohio 1.98 3.13
Georgia * * Oklahoma 0.55 1.67
Hawaii * * Oregon 0.52 1.51
Idaho 0.26 0.72 Pennsylvania 0.97 4.11
Illinois 1.13 3.43 Puerto Rico * *
Indiana 1.69 3.51 Rhode Island * *
Iowa 0.20 0.48 South Carolina 0.11 0.35
Kansas 0.51 1.07 South Dakota NCR NCR
Kentucky 0.71 1.13 Tennessee 1.98 2.80
Louisiana * * Texas 1.29 3.13
Maine * * Utah 1.72 1.84
Maryland 0.77 1.76 Vermont * *
Massachusetts 0.51 1.10 Virginia 1.65 3.06
Michigan 2.32 4.14 Washington 0.56 0.87
Minnesota 1.64 3.61 West Virginia 0.05 0.11
Mississippi 0.57 1.22 Wisconsin 1.27 1.71
Missouri 0.20 0.76 Wyoming * * Total† 37.62 85.13
NCR No Companies/Branches Reporting
* Fewer than 3 Companies/Branches Reporting † Includes Values from States with Fewer than 3 Companies/Branches Reporting
Information Series 138 (6th edition) | 21
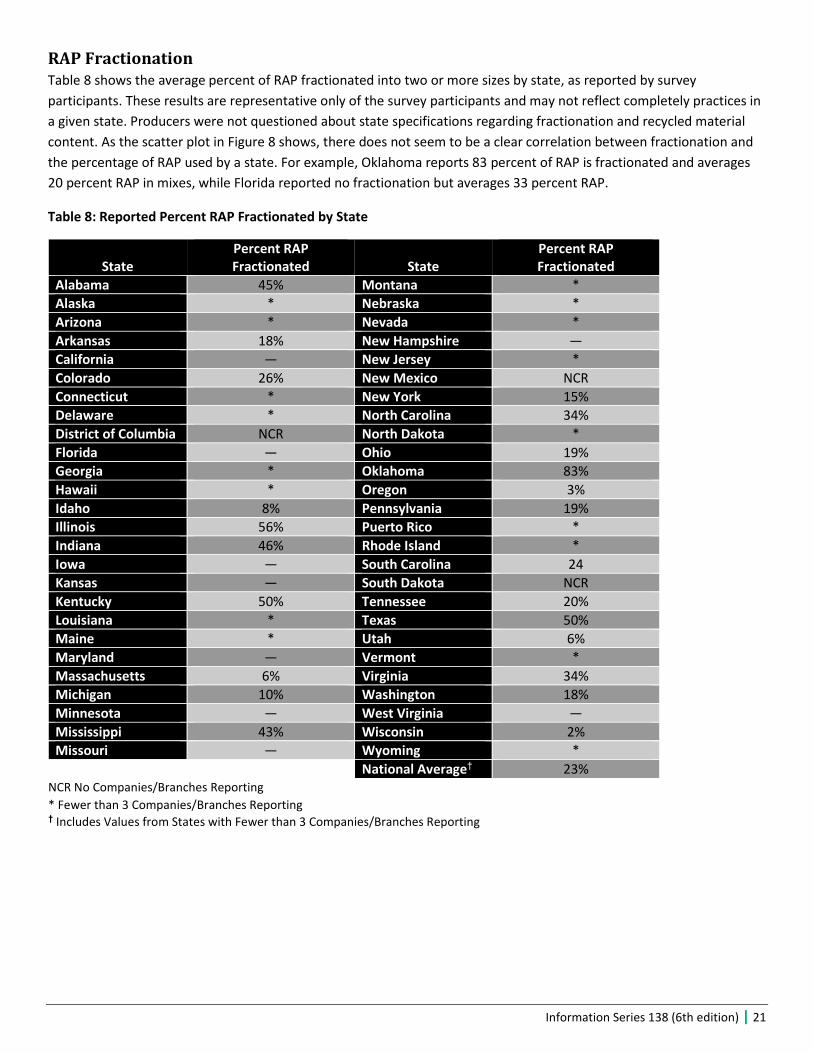
RAP Fractionation Table 8 shows the average percent of RAP fractionated into two or more sizes by state, as reported by survey
participants. These results are representative only of the survey participants and may not reflect completely practices in
a given state. Producers were not questioned about state specifications regarding fractionation and recycled material
content. As the scatter plot in Figure 8 shows, there does not seem to be a clear correlation between fractionation and
the percentage of RAP used by a state. For example, Oklahoma reports 83 percent of RAP is fractionated and averages
20 percent RAP in mixes, while Florida reported no fractionation but averages 33 percent RAP.
Table 8: Reported Percent RAP Fractionated by State
State Percent RAP Fractionated State
Percent RAP Fractionated
Alabama 45% Montana *
Alaska * Nebraska *
Arizona * Nevada *
Arkansas 18% New Hampshire —
California — New Jersey *
Colorado 26% New Mexico NCR
Connecticut * New York 15%
Delaware * North Carolina 34%
District of Columbia NCR North Dakota *
Florida — Ohio 19%
Georgia * Oklahoma 83%
Hawaii * Oregon 3%
Idaho 8% Pennsylvania 19%
Illinois 56% Puerto Rico *
Indiana 46% Rhode Island *
Iowa — South Carolina 24
Kansas — South Dakota NCR
Kentucky 50% Tennessee 20%
Louisiana * Texas 50%
Maine * Utah 6%
Maryland — Vermont *
Massachusetts 6% Virginia 34%
Michigan 10% Washington 18%
Minnesota — West Virginia —
Mississippi 43% Wisconsin 2%
Missouri — Wyoming * National Average† 23%
NCR No Companies/Branches Reporting
* Fewer than 3 Companies/Branches Reporting † Includes Values from States with Fewer than 3 Companies/Branches Reporting

22 | Information Series 138 (6th edition)
Figure 8: Scatter Plot Showing Reported Average Percentage of RAP in Asphalt Mixtures Relative to Reported Percent of RAP Fractionated
RAP Rejuvenator Use Table 9 shows the percent of tons of RAP-containing mixtures produced using softer binder or rejuvenators by state.
These results are representative only of the survey participants and may not reflect completely practices in a given state.
While there is no strong relationship between the amount of RAP mixtures using softer binder or rejuvenators and
percentage of RAP used by the state, it should be noted that most states using more than 20 percent RAP also report
using softer binders or rejuvenators. One example is Florida, which averages 33 percent RAP in mixes and produces
about 87 percent of mixtures with softer binder or rejuvenators.
Table 9: Percentage of RAP Mixes Using Softer Binder and/or Rejuvenators by State
State Softer Binder
Rejuve-nators State
Softer Binder
Rejuve-nators State
Softer Binder
Rejuve-nators
Alabama 7% 2% Louisiana * * Ohio 28% 0%
Alaska * * Maine * * Oklahoma 9% 0%
Arizona * * Maryland 6% 0% Oregon 42% 11%
Arkansas 9% 0% Massachusetts 10% 0% Pennsylvania 8% 10%
California 3% 2% Michigan 28% 0% Puerto Rico * *
Colorado 54% 6% Minnesota 8% 0% Rhode Island * *
Connecticut * * Mississippi 0% 0% South Carolina 0% 0%
Delaware * * Missouri 57% 19% South Dakota NCR NCR
Dist. of Columbia NCR NCR Montana * * Tennessee 5% 29%
Florida 80% 7% Nebraska * * Texas 26% 0%
Georgia * * Nevada * * Utah 51% 16%
Hawaii * * New Hampshire 0% 0% Vermont * *
Idaho 75% 0% New Jersey * * Virginia 1% 0%
Illinois 68% 0% New Mexico NCR NCR Washington 4% 0%
Indiana 36% 0% New York 2% 2% West Virginia 0% 0%
Iowa 58% 18% North Carolina 57% 0% Wisconsin 4% 0%
Kansas 48% 3% North Dakota * * Wyoming * *
Kentucky 9% 0% National Average† 24% 3%
NCR No Companies/Branches Reporting
* Fewer than 3 Companies/Branches Reporting † Includes Values from States with Fewer than 3 Companies/Branches Reporting
0%
5%
10%
15%
20%
25%
30%
35%
40%
- 10 20 30 40 50 60 70 80 90 100
Ave
rage
Per
cen
t R
AP
in A
sph
alt
Mix
ute
s
Percent RAP Fractionated

Information Series 138 (6th edition) | 23
Reclaimed Asphalt Shingles Table 5 includes the national summary of RAS data from the 2014 and 2015 construction season surveys. The
information requested in the survey is detailed in Appendix A and summarized in Table 1, Section 3. State-level data is
reported in Appendix B. Producers were not asked about allowable RAS limits or binder replacement requirements for
their states. Figure 9 is a visual representation of the estimated total tons of RAS used in asphalt mixes, aggregate, cold
mix, and other uses, as well as the amount landfilled, from the 2009 to 2015 construction season surveys.
During the 2015 construction season, the total estimated amount of unprocessed and processed shingles received by
producers was 1.971 million tons, which is slightly higher than the combined amount of RAS used in asphalt mixtures
(1.931 million tons) and in aggregate (9,000 tons). This is a 2.1 percent decline from the 2.013 million total tons of RAS
used during the 2014 construction season and is due in large part to a decrease in the average percent of RAS being
used in Commercial & Residential sector mixes. As in 2014, during the 2015 construction season none of the RAS
accepted by producers was landfilled. An estimated 13.2 million tons of waste shingles are produced annually;1
therefore, asphalt mix producers in 2015 used nearly 15 percent of the total available supply of waste shingles.
Figure 9: Comparison of Tons of RAS Accepted and Tons of RAS Used or Landfilled (Million Tons), 2009–2015. Processed RAS Acceptance First Tracked in 2015
As shown in Figure 9, beginning in the 2012 construction season, producers began reporting using RAS in greater quantities
than they accepted. When this trend was first noticed, producers were contacted to confirm the reported values. All
producers contacted indicated they either had RAS stockpiled or were purchasing RAS from shingle processors. To capture
the volume of processed shingles accepted by producers, the 2015 survey began asking producers “How many tons of
processed shingles were accepted/delivered to your facilities in the state in 2015?” During the 2015 construction season,
the estimated amount of unprocessed shingles accepted by producers declined 32 percent from 2014 to 1.129 million tons.
1 According to the Asphalt Roofing Manufacturers Association (ARMA, 2015), about 13.2 million waste shingles are generated annually — about 12 million tons of post-consumer asphalt shingles (PCAS) and 1.2 million tons of manufacturing waste (MWAS). This is an increase from the commonly cited figure of 11 million tons (NAHB, 1998), reflecting changes in housing stock and the housing market since 1998.
2009 2010 2011 2012 2013 2014 2015
Processed Accepted 0 0 0 0 0 0 0.842
Unprocessed Accepted 0.957 1.851 2.500 1.724 1.599 1.664 1.129
Landfilled 0.000 0.007 0.000 0.000 0.000 0.000 0.000
Used in Other 0.123 0.125 0.000 0.012 0.005 0.006 0.000
Used in Cold Mix 0.000 0.000 0.000 0.000 0.000 0.000 0.000
Used in Aggregate 0.006 0.003 0.074 0.073 0.082 0.043 0.009
Used in HMA/WMA 0.702 1.100 1.192 1.863 1.647 1.964 1.931
0.0
0.5
1.0
1.5
2.0
2.5
3.0
RA
S T
ons,
mill
ion

24 | Information Series 138 (6th edition)
However, this decline in acceptance of unprocessed shingles was offset by the 842,000 tons of processed shingles accepted
by producers (recorded for the first time in the 2015 construction season survey).
The number of companies/branches using RAS has increased from 87 in the 2014 construction season to 89 in 2015. This
is below the 97 companies/branches reporting RAS usage in the 2012 and 2013 construction seasons; however, the
percentage of companies reporting using RAS has held relatively steady at around 40 percent since 2012.
RAS Use by Sector Figure 10 shows the total estimated amount of RAS used in each of the three sectors of the paving market. These values
were calculated using the average percentages of RAS reported by producers for the sectors and adjusted to account for
differences between reported RAS tonnage and tons calculated from the percentage by sector. There was a moderate
increase in the tons of RAS used by DOTs from the 2014 to 2015 construction season due to an increase in total DOT mix
tonnage and the percent RAS used in DOT mixtures. During this same period, RAS use by Other Agencies increased
slightly while the Commercial & Residential sector saw a significant decrease in RAS use.
Figure 11 shows the average RAS percent used in asphalt mixes for the three sectors. These values were calculated using
the average percentages of RAS reported for the different sectors and adjusted to account for differences between
reported RAS tonnage and tons calculated from the percentage by sector. Overall, RAS use has seen relatively steady
growth across all sectors from 2009 to 2015 with some year-to-year variation. Growth has been greatest in the
Commercial & Residential (0.08 percent per year) and Other Agency (0.07 percent per year) sectors with slower growth
in the DOT sector (0.04 percent per year).
Figure 10: Estimated RAS Use by Sector (Million Tons)
Figure 11: Average Percent RAS Used by Sector
In 2015 producers were also asked which sectors allow RAS to be included in asphalt mixtures. Thirty-two states
provided responses, and this information is summarized in Table 10. All 32 states responding reported no limits on the
use of RAS in the Commercial & Residential sectors. Thirteen DOTs reportedly allow RAS in some asphalt pavement
mixes, and 11 DOTs allow it in all mixtures. RAS use is allowed in the Other Agency sector in 24 states; however, the
responses do not distinguish between use allowed in all mixes versus just some mixes. Five states do not allow RAS in
any public-sector (DOT or Other Agency) work, while three states (Kansas, Maryland, and North Carolina) allow RAS in at
least some DOT mixes, but not in Other Agency mixes.
0
0.1
0.2
0.3
0.4
0.5
0.6
0.7
0.8
0.9
2009 2010 2011 2012 2013 2014 2015
RA
S T
on
s,m
illio
n
DOT
Other Agency
Commercial & Residential
0.0%
0.5%
1.0%
2009 2010 2011 2012 2013 2014 2015
DOT
Other Agency
Commercial and Residential

Information Series 138 (6th edition) | 25
Table 10: Sectors Allowing RAS
State
RAS Allowed In?
DOT Mixes Other Agency Mixes Commercial &
Residential Mixes
Alabama Some Mixes Allowed Allowed
Arkansas Some Mixes Allowed Allowed
California Not Allowed Not Allowed Allowed
Colorado Not Allowed Not Allowed Allowed
Connecticut Not Allowed Not Allowed Allowed
Delaware All Mixes Allowed Allowed
Florida Not Allowed Allowed Allowed
Illinois All Mixes Allowed Allowed
Indiana All Mixes Allowed Allowed
Iowa All Mixes Allowed Allowed
Kansas Some Mixes Not Allowed Allowed
Kentucky All Mixes Allowed Allowed
Maine Some Mixes Allowed Allowed
Maryland All Mixes Not Allowed Allowed
Massachusetts Some Mixes Allowed Allowed
Minnesota Some Mixes Allowed Allowed
Mississippi Not Allowed Not Allowed Allowed
Missouri Some Mixes Allowed Allowed
New Hampshire Not Allowed Not Allowed Allowed
New York Some Mixes Allowed Allowed
North Carolina All Mixes Not Allowed Allowed
Ohio Some Mixes Allowed Allowed
Oklahoma Not Allowed Allowed Allowed
Oregon Some Mixes Allowed Allowed
Pennsylvania All Mixes Allowed Allowed
South Carolina Some Mixes Allowed Allowed
Tennessee All Mixes Allowed Allowed
Texas Some Mixes Allowed Allowed
Vermont Not Allowed Allowed Allowed
Virginia Some Mixes Allowed Allowed
Washington All Mixes Allowed Allowed
Wisconsin All Mixes Allowed Allowed
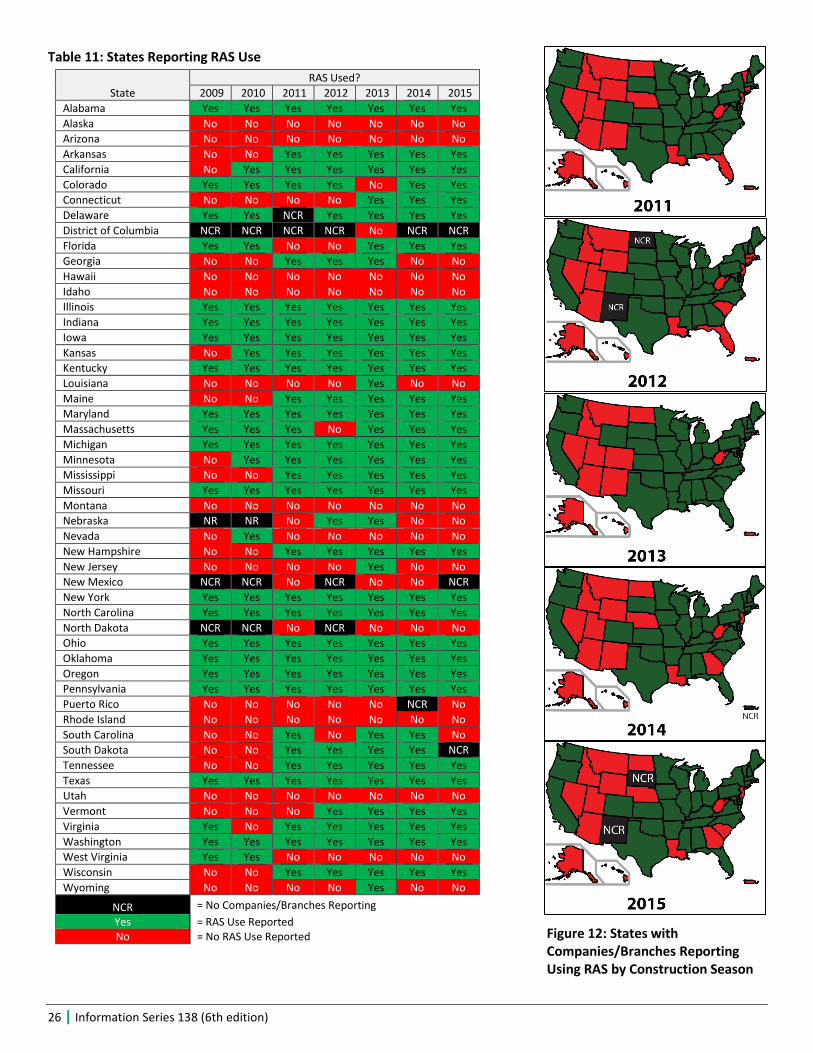
RAS Use by State Figure 12 shows states where asphalt pavement mixture producers reported using RAS from 2011 through 2015. Table
11 shows states where producers reported using RAS in 2009 through 2015. Red indicates states where RAS use was not
reported that construction season. The number of states where producers reported using RAS increased annually from
22 in 2009 to 38 in 2013, but decreased to 34 in 2014 and 32 in 2015. Of the states reporting previous RAS use, only
South Carolina, which reported using RAS in 2014, did not report using it in 2015. South Dakota, which reported using
RAS in 2014, did not have any companies participate in the 2015 construction season survey.
26 | Information Series 138 (6th edition)
Table 11: States Reporting RAS Use
State
RAS Used?
2009 2010 2011 2012 2013 2014 2015
Alabama Yes Yes Yes Yes Yes Yes Yes
Alaska No No No No No No No
Arizona No No No No No No No
Arkansas No No Yes Yes Yes Yes Yes
California No Yes Yes Yes Yes Yes Yes
Colorado Yes Yes Yes Yes No Yes Yes
Connecticut No No No No Yes Yes Yes
Delaware Yes Yes NCR Yes Yes Yes Yes
District of Columbia NCR NCR NCR NCR No NCR NCR
Florida Yes Yes No No Yes Yes Yes
Georgia No No Yes Yes Yes No No
Hawaii No No No No No No No
Idaho No No No No No No No
Illinois Yes Yes Yes Yes Yes Yes Yes
Indiana Yes Yes Yes Yes Yes Yes Yes
Iowa Yes Yes Yes Yes Yes Yes Yes
Kansas No Yes Yes Yes Yes Yes Yes
Kentucky Yes Yes Yes Yes Yes Yes Yes
Louisiana No No No No Yes No No
Maine No No Yes Yes Yes Yes Yes
Maryland Yes Yes Yes Yes Yes Yes Yes
Massachusetts Yes Yes Yes No Yes Yes Yes
Michigan Yes Yes Yes Yes Yes Yes Yes
Minnesota No Yes Yes Yes Yes Yes Yes
Mississippi No No Yes Yes Yes Yes Yes
Missouri Yes Yes Yes Yes Yes Yes Yes
Montana No No No No No No No
Nebraska NR NR No Yes Yes No No
Nevada No Yes No No No No No
New Hampshire No No Yes Yes Yes Yes Yes
New Jersey No No No No Yes No No
New Mexico NCR NCR No NCR No No NCR
New York Yes Yes Yes Yes Yes Yes Yes
North Carolina Yes Yes Yes Yes Yes Yes Yes
North Dakota NCR NCR No NCR No No No
Ohio Yes Yes Yes Yes Yes Yes Yes
Oklahoma Yes Yes Yes Yes Yes Yes Yes
Oregon Yes Yes Yes Yes Yes Yes Yes
Pennsylvania Yes Yes Yes Yes Yes Yes Yes
Puerto Rico No No No No No NCR No
Rhode Island No No No No No No No
South Carolina No No Yes No Yes Yes No
South Dakota No No Yes Yes Yes Yes NCR
Tennessee No No Yes Yes Yes Yes Yes
Texas Yes Yes Yes Yes Yes Yes Yes
Utah No No No No No No No
Vermont No No No Yes Yes Yes Yes
Virginia Yes No Yes Yes Yes Yes Yes
Washington Yes Yes Yes Yes Yes Yes Yes
West Virginia Yes Yes No No No No No
Wisconsin No No Yes Yes Yes Yes Yes
Wyoming No No No No Yes No No
NCR = No Companies/Branches Reporting
Yes = RAS Use Reported No = No RAS Use Reported Figure 12: States with
Companies/Branches Reporting Using RAS by Construction Season

Information Series 138 (6th edition) | 27
Presumed RAS Binder Blending For the 2015 construction season, producers were also asked what percent of the RAS binder do they assume is blending
with new asphalt binders when performing mix designs. The amount of blending depends upon the properties of the
aged asphalt in the RAS and is important to assure there is enough of the blended binder in mixtures to resist cracking
(West, 2016). Lower blending values will normally increase the amount of virgin asphalt required in a mixture, and
indicate that the amount of RAS added to mixtures could increase. Note that higher percentages of RAS will normally
require the use of softer binders and/or rejuvenators.
Table 12 shows the minimum and maximum amount of assumed blending for the 31 states where producers responded
to this question. In general, most responses fell between 60 and 80 percent, with a low of 40 percent and a high of
100 percent. It is important to note that these are reported assumptions used in mix designs, not formal design guidance
or state specifications.
Table 12: Percent Presumed RAS Binder Blending with New Asphalt Binder
State Min. Max. State Min. Max.
Alabama 60 85 Mississippi 70 70 Arkansas 70 80 Missouri 67 80 California 60 60 New Hampshire 75 75 Colorado 60 85 New York 60 60 Connecticut 70 70 North Carolina 75 90 Delaware 70 75 Ohio 75 80 Florida 50 50 Oklahoma 70 80 Illinois 50 100 Oregon 40 80 Indiana 60 80 Pennsylvania 75 90 Iowa 65 89 Tennessee 75 100 Kansas 60 80 Texas 24 75 Kentucky 75 75 Vermont 70 70 Maine 70 80 Virginia 75 95 Maryland 75 90 Washington 40 90 Massachusetts 70 70 Wisconsin 75 100 Minnesota 60 70

28 | Information Series 138 (6th edition)
Cost Savings From RAP and RAS The use of RAP and RAS both reduce the need for virgin materials, conserving valuable asphalt and aggregates. Beyond
the environmental benefit of resource preservation, the use of RAP and RAS can help lower material costs for road
construction, allowing road owners to achieve more roadway maintenance and construction activities within limited
budgets. Table 13 summarizes the individual and cumulative savings realized during the 2015 construction season from
the use of RAP and RAS in asphalt mixtures.
Table 13: Material Savings, 2015
Material Material Quantity,
Million Tons % Aggregate
% Asphalt Binder
Aggregate Cost Savings,
$ Billion
Asphalt Binder Cost
Savings, $ Billion
Total Cost Savings, $ Billion
RAP 74.2 95 5 $0.652 $1.781 $2.433
RAS 1.931 50* 20 $0.009 $0.185 $0.194
Total $0.661 $1.966 $2.627
* Includes granules and mineral filler
The estimated savings shown in Table 13 were based on the cost factors shown in Table 14. Asphalt binder prices were
estimated based upon an average of 2015 asphalt price indexes from 10 states (New Jersey, Maryland, Virginia, Ohio,
Louisiana, Illinois, Georgia, Oregon, Missouri, and Florida). The average price of unmodified asphalts from these states for
2015 was about $470. Three of the states (Florida, Louisiana, and Virginia) also included price indexes for modified asphalts.
The average modified asphalt prices from these states for 2015 was about $600. Assuming that 10 percent of asphalt mixtures
use modified asphalt binders, the average price of asphalt binders used in asphalt mixtures is about $480 per ton.
Most asphalt mixtures today use crushed stone as the primary aggregate, but they often include a small percentage of
natural sand. The U.S. Geological Survey (USGS) reports the average price of crushed stone at about $9.50 per ton, and
sand and gravel at about $7.00 per ton for 2015 (USGS, 2016). Assuming the average asphalt pavement mixture contains
10 percent natural sand and 90 percent crushed stone, the average price of aggregate in an asphalt mixture is $9.25 per
ton for the 2015 construction season.
Table 14: Material Cost Factors, 2015
Material Cost/Ton % of Market
Asp
halt
Unmodified $470 90
Modified $600 10
Weighted Average $480
Ag
gre
gate
Crushed Stone $9.50 90
Sand and Gravel $7.00 10
Weighted Average $9.25
Minor additional cost savings, not calculated for this report, are associated with the use of RAS in stone-matrix asphalt
and other specialty asphalt mixtures where the shingle fibers can replace mineral or cellulose fibers.

Information Series 138 (6th edition) | 29
Warm-Mix Asphalt Table 5 includes the national summary of WMA data from the 2014 and 2015 construction season surveys. The
information requested in the survey is detailed in Appendix A and summarized in Table 1, Section 4. State-level data is
reported in Appendix B. The survey asked producers their estimated percentages of tons of asphalt mixture produced at
reduced temperatures for the different sectors and the percent of which WMA technologies were used, as well as
whether or not WMA technologies were used at HMA production temperatures.
The percent of companies/branches reporting the production of WMA saw rapid increases from the 2009 to 2011
construction seasons, but only modest increases from 2011 to 2013 and remaining essentially level from the 2013 to
2015 construction seasons, as shown in Figure 13.
WMA Use by Sector Figure 14 shows a steady increase in the number of tons of WMA produced for each customer sector from 2011 to 2013,
with modest increases continuing for the 2014 and 2015 construction seasons. WMA use reached almost 120 million
tons in the 2015 construction season, which is a little less than one-third of the total asphalt mix production for the year,
as is shown in Figure 15. This is probably attributable to increased acceptance of WMA by all sectors, as illustrated in
Figure 14.
Figure 13: Percent of Companies/Branches Using WMA
Figure 14: Estimated Tons (Millions) of WMA by Sector
0%
10%
20%
30%
40%
50%
60%
70%
80%
90%
2009 2010 2011 2012 2013 2014 2015
Per
cen
t C
om
pan
ies/
Bra
nch
es U
sin
g W
MA
Percent Companies/Branches Using WMA
'09 '10 '11 '12 '13 '14 '15
Commercial &Residential
4.6 11.3 17.8 21.4 22.8 28.5 30.4
Other Agency 3.6 9.8 16.3 18.9 27.9 28.4 28.5
DOT 8.6 20 34.6 46.4 55.7 56.9 60.9
0
20
40
60
80
100
120
140
Esti
mat
edW
MA
To
ns
(Mill
ion
)
Estimated WMA Tons
DOT Other Agency Commercial & Residential

30 | Information Series 138 (6th edition)
Figure 15: Percent of Total Tonnage Using WMA, 2009–2015
WMA Use by State
Figure 16 shows the estimated total tons of WMA produced in each state. It should be noted that the accuracy of data
for individual states will vary depending on the number of responses received from each state and the total number of
tons represented by the respondents. Nationally, the estimated total tons of WMA increased from 113.8 million tons in
2014 to 119.8 million tons in the 2015 construction season, a greater than 5 percent increase.
From 2014 to 2015, 18 states saw an increase of 5 percentage points or more in WMA production, while 14 states had a
decrease of 5 percentage points or more in WMA production. Three states — Georgia, Michigan, and South Carolina —
had an increase of 25 percentage points or more in WMA production. Georgia and Michigan had dramatic 38 and
Figure 16: Estimated Percent of Total Production Using WMA
5%
11%
19%
24%
30%32% 33%
0%
5%
10%
15%
20%
25%
30%
35%
2009 2010 2011 2012 2013 2014 2015
Per
cen
t To
tal T
on
nag
e U
sin
g W
MA
Percent Total Tonnage Using WMA

Information Series 138 (6th edition) | 31
42 percent increases, respectively. Six states — Arkansas, Colorado, Idaho, Mississippi, Montana, and Nebraska — had a
decrease of 25 percentage points or more in WMA production. The reasons for these fluctuations are uncertain.
WMA makes up over half of the total asphalt mix production in 14 states, down from 15 states in 2014, and four of them
— Kansas, Louisiana, Virginia, and Wyoming — reported WMA as 75 percent or more of total production in 2015.
Nevada, West Virginia, and Rhode Island did not report the use of WMA in 2015.
WMA Technologies As Table 5 shows, plant foaming is the most commonly used technology for the production of WMA. Use of WMA
chemical additives increased from 15 percent in 2014 to 25.2 percent in 2015, an all-time high.
WMA additives can have compaction, antistrip, and other benefits that encourage their use even when a reduction in
production temperature is not sought or achieved by the producer. For this reason in the 2015 construction season
survey, producers were asked if they use WMA additives to produce asphalt mixtures at HMA temperatures. One
hundred producers, 60 percent of respondents, in 41 states reported using WMA additives at HMA temperatures.
Because this survey seeks to quantify only the use of WMA technologies to produce reduced-temperature WMA
mixtures, survey respondents were instructed to report tons of asphalt pavement mixtures produced as HMA with WMA
technologies with total tons of HMA/WMA produced, but not with tons of WMA produced.

32 | Information Series 138 (6th edition)
Other Recycled Materials Starting with the 2012 construction season survey, a series of questions was asked about the use of other recycled
materials in asphalt mixtures. Table 1, Section 5, summarizes the questions asked. The full questionnaire is included as
Appendix A.
Producers were asked how many tons of mix were produced that incorporated other recycled materials, as well as how
many tons of specific materials were used in mix production during the 2015 construction season. Four recycled
materials — ground tire rubber (GTR), steel slag, blast furnace slag, and cellulose fibers — were specifically listed in the
survey. Respondents could specify up to two additional recycled materials used in mixes.
Because the response rate to these questions about other recycled materials was expected to be low and because
producers may not track the use of these materials, state and national estimates of total quantities used for these
materials were not calculated. All values in this section are reported values only and do not represent estimates of the
total quantity of these materials used by state or nationally. Year-to-year variation in reported values is entirely
dependent upon the makeup of the respondents to each year’s survey. Where available, third-party data is referenced
to provide an understanding of the estimated total usage of these materials.
A total of 53 companies/branches from 29 states reported using other recycled materials in asphalt mixtures during the
2015 construction season.
Ground Tire Rubber Table 15 summarizes reported information on the use of ground tire rubber. Twenty-two producers from 14 states
reported using GTR in some mixes. It must be noted that Arizona, which is known to use large quantities of GTR in mixes,
had a relatively low participation rate in the survey. California, also known for its use of GTR, reported the greatest
amount of GTR of any state. The total reported tons of asphalt pavement mix using GTR stayed relatively flat from 2014
to 2015, rising from 1,200,181 tons in 2014 to 1,234,960 in 2015.
While the tonnage produced that incorporates GTR is relatively straightforward to track and report, the tons of GTR
used is harder to document due to different methods of producing mixes that incorporate GTR — the wet process,
which uses GTR as an asphalt cement (AC) modifier, and the dry process, which incorporates GTR as a fine aggregate
(Bahia, 2011) — and the likelihood that GTR is either preblended with AC at the terminal or blended onsite by a third
party. Given these factors, producer reports of tons of GTR used versus tons of mix produced using GTR were given a
heightened level of scrutiny to determine if the reported data was within a reasonable range. When reported tons of
GTR fell outside the expected range, producers were contacted to obtain correct values.
To give a picture of the total market size for GTR, the Rubber Manufacturers Association (RMA) reports that
25.8 percent of U.S. scrap tires were processed into GTR in 2015. The total market for GTR was estimated at 1.02 million
tons, with some 15 percent (153,100 tons) used in asphalt pavement mixes and surface treatments, such as seal coats, in
2015 (RMA, 2016). Therefore, the GTR use reported by survey respondents for the 2015 construction season makes up
about 11.4 percent of the total GTR use in asphalt estimated by RMA.

Information Series 138 (6th edition) | 33
Table 15: Reported Tons Ground Tire Rubber
State Reported Tons of Mix Using GTR Reported Tons of GTR Used
2012 2013 2014 2015 2012 2013 2014 2015
Arizona 33,590 26,300 12,000 11,500 532 380 142 100
California 101,000 523,213 623,953 936,100 — 3,748 9,173 13,514
Florida 86,441 250,779 198,046 110,000 195 531 419 356
Georgia 281,958 65,000 162,000 — — 260 750 —
Illinois — 4,500 — 3,500 — 20 — 36
Indiana — 13,000 — 5,000 — 30 — 140
Louisiana 25,000 104,395 — — — 550 — —
Maine — 14,000 — — — 219 — —
Massachusetts — 24,897 81,882 79,680 — 324 1,146 1,090
Michigan 2,400 12,000 9,300 2,780 20 71 51 17
Missouri 100,000 50,000 — — 300 180 — —
New Hampshire — 28,000 50,000 8,400 — 358 780 114
New York — 10 — — — — — —
Ohio 36,200 1,500 23,000 6,000 — 8 150 60
Oregon — — — 5,000 — — — —
Pennsylvania — 18,000 — — — 140 — —
Puerto Rico — 10,000 NCR — — 170 NCR —
Texas 25,000 50,000 40,000 50,000 — — 200 —
Utah — — — 3,500 — — — 61
Washington — — — 6,500 — — — —
Wisconsin — — — 5,000 — — — 30
Total 691,589 1,195,594 1,200,181 1,234,960 1,047 6,989 12,811 17,518
No. of Producers 15 29 19 22
NCR = No Contractors/Branches Reporting
Steel & Blast Furnace Slag Tables 16 and 17 summarize the reported use of steel slag and blast furnace slag in asphalt mixes, respectively. Eleven
states reported using steel slag and eight states reported using blast furnace slag in the 2015 construction season. It is
interesting to note that while the total tons of mix and materials for each slag type vary from year to year, there has
been a consistent increase in the combined use of both slags, as illustrated in Figure 17 through 2014, but a decrease of
about 12 percent in 2015.
The National Slag Association estimates that more than 20 million tons of slag is produced and marketed annually (NSA,
2015). With a reported 1.1 million tons of slag in asphalt mixes for 2015, the asphalt pavement mix production industry
uses well over 5 percent of the total available slag, based upon reported usage alone. For the states reporting slag use,
11 percent of their total asphalt pavement mixture production tonnage includes slag.
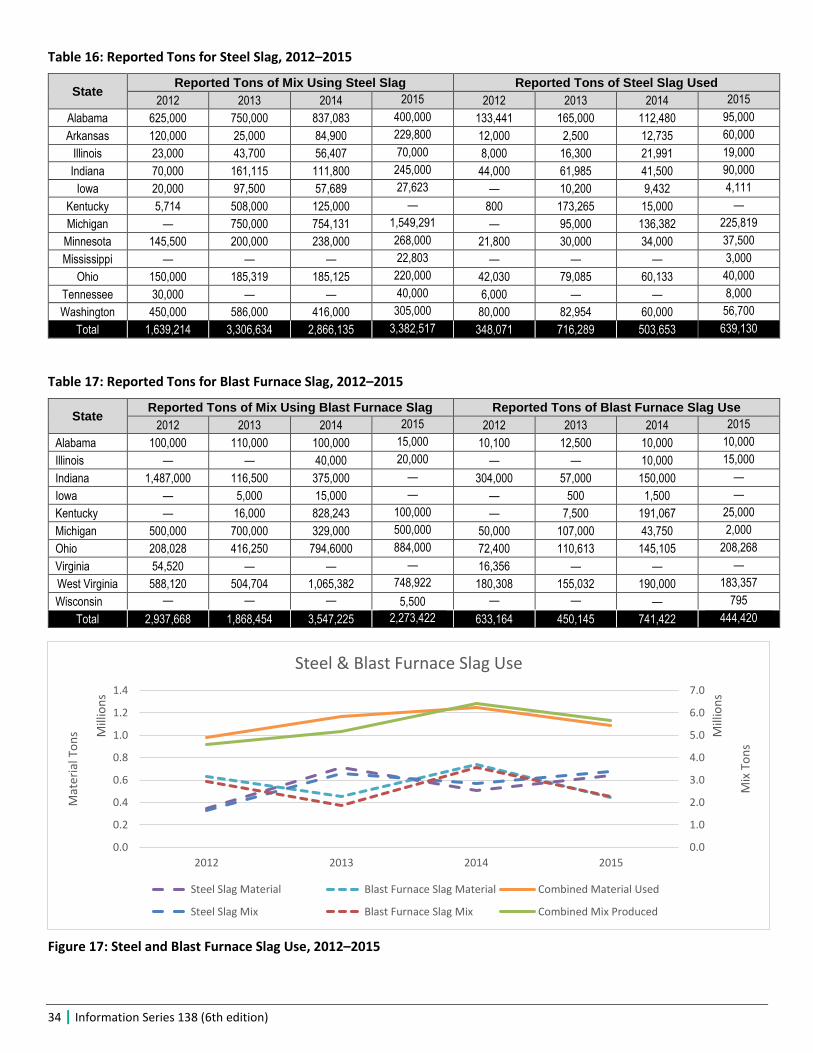
34 | Information Series 138 (6th edition)
Table 16: Reported Tons for Steel Slag, 2012–2015
State Reported Tons of Mix Using Steel Slag Reported Tons of Steel Slag Used
2012 2013 2014 2015 2012 2013 2014 2015
Alabama 625,000 750,000 837,083 400,000 133,441 165,000 112,480 95,000
Arkansas 120,000 25,000 84,900 229,800 12,000 2,500 12,735 60,000
Illinois 23,000 43,700 56,407 70,000 8,000 16,300 21,991 19,000
Indiana 70,000 161,115 111,800 245,000 44,000 61,985 41,500 90,000
Iowa 20,000 97,500 57,689 27,623 — 10,200 9,432 4,111
Kentucky 5,714 508,000 125,000 — 800 173,265 15,000 —
Michigan — 750,000 754,131 1,549,291 — 95,000 136,382 225,819
Minnesota 145,500 200,000 238,000 268,000 21,800 30,000 34,000 37,500
Mississippi — — — 22,803 — — — 3,000
Ohio 150,000 185,319 185,125 220,000 42,030 79,085 60,133 40,000
Tennessee 30,000 — — 40,000 6,000 — — 8,000
Washington 450,000 586,000 416,000 305,000 80,000 82,954 60,000 56,700
Total 1,639,214 3,306,634 2,866,135 3,382,517 348,071 716,289 503,653 639,130
Table 17: Reported Tons for Blast Furnace Slag, 2012–2015
State Reported Tons of Mix Using Blast Furnace Slag Reported Tons of Blast Furnace Slag Use
2012 2013 2014 2015 2012 2013 2014 2015
Alabama 100,000 110,000 100,000 15,000 10,100 12,500 10,000 10,000
Illinois — — 40,000 20,000 — — 10,000 15,000
Indiana 1,487,000 116,500 375,000 — 304,000 57,000 150,000 —
Iowa — 5,000 15,000 — — 500 1,500 —
Kentucky — 16,000 828,243 100,000 — 7,500 191,067 25,000
Michigan 500,000 700,000 329,000 500,000 50,000 107,000 43,750 2,000
Ohio 208,028 416,250 794,6000 884,000 72,400 110,613 145,105 208,268
Virginia 54,520 — — — 16,356 — — —
West Virginia 588,120 504,704 1,065,382 748,922 180,308 155,032 190,000 183,357
Wisconsin — — — 5,500 — — — 795
Total 2,937,668 1,868,454 3,547,225 2,273,422 633,164 450,145 741,422 444,420
Figure 17: Steel and Blast Furnace Slag Use, 2012–2015
0.0
1.0
2.0
3.0
4.0
5.0
6.0
7.0
0.0
0.2
0.4
0.6
0.8
1.0
1.2
1.4
2012 2013 2014 2015
Mix
To
ns
Mill
ion
s
Mat
eria
l To
ns M
illio
ns
Steel & Blast Furnace Slag Use
Steel Slag Material Blast Furnace Slag Material Combined Material Used
Steel Slag Mix Blast Furnace Slag Mix Combined Mix Produced

Information Series 138 (6th edition) | 35
Other Recycled Materials Table 18 summarizes other recycled materials used in asphalt mixtures. Other reported recycled materials include fly
ash, cellulose fiber, foundry sand, recycled glass, and contaminated soil. Recycled glass was reported by Virginia in 2012
and Florida in 2015. Fly ash use was reported in Mississippi and Texas each year of the survey through 2014, but was not
reported in 2015; Wisconsin reported using fly ash in 2014 and 2015; Tennessee first reported using fly ash in 2015.
The reported use of cellulose fiber reached an all-time high of 17 states in 2015, far exceeding the previous high of seven
states in 2014. This is likely due to the specific request for data about cellulose fiber use in the 2015 construction season
survey; in previous years, reporting data about cellulose fiber use was at the discretion of the respondent.
Table 18: Other Recycled Materials
State & Type of Other Recycled Material
Reported Tons of Mix Produced Using Other Recycled Material
Reported Tons of Other Recycled Material Used*
2012 2013 2014 2015 2012 2013 2014 2015
Cellulose Fiber
Alabama — — — 100,000 — — — 500
Alaska — — — 1,000 — — — —
Florida — 20,204 73,600 92,000 — 71 311 147
Georgia — 43,000 — — 129 — —
Illinois — — — 126,150 — — — 240
Indiana — 6,000 — 22,000 — 60 — 1
Louisiana — 31,651 1,500 22,260 — 63 30 45
Maryland — 145,000 120,000 85,000 — 440 360 230
Minnesota — 5,000 — — — 15 — —
Mississippi 76,000 — — — 250 — — —
Missouri — — — 56,000 — — — 100
New Jersey — — — 5,000 — — — —
New York — — 700 1,605 — — 1 —
Ohio — — — 10,220 — — — 90
Oregon — — — 20,000 — — — 8
Pennsylvania — — — 12,952 — — — —
South Carolina — — — 20,000 — — — —
Tennessee — — — 175,940 — — — 80
Texas — 30,600 36,000 50,300 — 90 44 15
Virginia — — 74,000 61,000 — — 120 183
Total 76,000 281,455 305,800 861,427 250 868 866 1,643
Fly Ash
Michigan — — — 50,000 — — — —
Mississippi 50,000 50,000 15,000 — 2,400 2,500 600 —
Tennessee — — — 15,940 — — — 616
Texas 18,000 25,000 20,000 — 1,200 1,700 1,000 —
Wisconsin — — 26,000 102,500 — — 1,500 6,150
Total 68,000 75,000 61,000 168,440 3,600 4,200 3,100 6,766
Bottom Ash
South Dakota 52,000 — — NCR 4,280 — — NCR
Texas — — — 1,000 — — — —
Total 52,000 — — 1,000 4,280 — — —
Foundry Sand
Missouri 5,000 15,130 22,310 10,000 500 1,514 2,231 500
*Not all producers reporting tonnages of mix using other recycled materials provided quantities of recycled materials used. NCR = No Contractors/Companies Reporting

36 | Information Series 138 (6th edition)
Table 18: Other Recycled Materials (Continued)
State & Type of Other Recycled Material
Reported Tons of Mix Produced Using Other Recycled Material
Reported Tons of Other Recycled Material Used*
2012 2013 2014 2015 2012 2013 2014 2015
Petroleum-Contaminated Soil
Massachusetts — — — 35,000 — — — 1,050
Recycled Glass
Florida — — — 1,000 — — — 200
Virginia 173 — — — 34 — — —
Total 173 — — 1,000 34 — — 200
*Not all producers reporting tonnages of mix using other recycled materials provided quantities of recycled materials used. NCR = No Contractors/Companies Reporting
Summary and Conclusions The objective of this survey was to quantify the use of recycled materials and WMA produced by the asphalt pavement
mix production industry during the 2015 construction season. Asphalt mix producers from 48 states and one U.S.
territory completed the 2015 survey, and data was collected from 212 companies/branches with data from 1,119 plants.
Data collected was compared to annual data from previous surveys since the 2009 construction season.
The survey findings for 2015 regarding the use of RAP, RAS, and WMA are summarized in Table 5.
Comparing the 2015 results to 2014 construction season, estimated total asphalt mix production saw a slight increase
from 352 million tons to 364.9 million tons, a 3.7 percent increase. Increases in estimated tonnage were seen across all
customer sectors from 2014 to 2015, with DOT tonnage rising 2.1 percent to 163.6 million tons, Other Agency tonnage
rising 5.3 percent to 95.5 million tons, and Commercial & Residential tonnage rising 4.6 percent to 105.8 million tons.
The use of recycled material has risen dramatically since the 2009 construction season survey; although, year-over-year
growth has slowed in recent years. The 2015 construction season survey shows:
• The total estimated tons of RAP used in asphalt mixes reached 74.2 million tons in 2015. This represents a
greater than 32 percent increase in the total estimated tons of RAP used in 2009. During the same time frame,
total tonnage increased only 1.8 percent.
• The percent of producers reporting use of RAP decreased slightly from 100 percent of respondents in 2014 to
99 percent in 2015.
• The average percent RAP used by all sectors has seen variable growth from 2009 to 2015. The year-to-year
growth in the total percentage of RAP use has slowed from 2009 to 2015, decreasing from a 1.8 percent increase
from 2009 to 2010 to 0.1 percent decrease from 2014 to 2015. The average estimated percent RAP used in all
mixes has increased from 15.6 percent in 2009 to 20.3 percent in 2015.
• Companies/branches reporting excess RAP supplies decreased from 91 percent to 88 percent from 2014 to
2015. As in the 2012 and 2014 construction seasons, the estimated amount of RAP used for all purposes in 2015,
including landfilling, exceeded the amount accepted. RAP use exceeded RAP received by 4.5 million tons in 2015.
• Only three producers reported landfilling RAP during the 2015 construction season.
• The total estimated amount of RAP stockpiled nationwide at the end of the 2015 construction season was
85.1 million tons.

Information Series 138 (6th edition) | 37
• Producers from 29 states reported fractionating RAP. Nationally, a reported 23 percent of RAP is fractionated.
• Producers from 32 states reported using softer binders and 18 states reported using rejuvenators in RAP mixes.
While there is no strong relationship between the amount of RAP used and the use of softer binders or
rejuvenators, most of the states using greater than 20 percent RAP also use softer binders or rejuvenators.
• Use of both recycled manufacturing waste and post-consumer asphalt shingles in asphalt mixes decreased
slightly (1.6 percent) from an estimated 1.96 million tons in 2014 to 1.93 million tons in 2015. Still the use of RAS
in the 2015 construction season increased 175 percent from the estimated 701,000 tons used in asphalt
mixtures in 2009.
• The amount of unprocessed RAS accepted by asphalt mix producers decreased from 1.66 million tons in 2014 to
1.13 million tons in 2015. During the 2015 construction season, an estimated 840,000 tons of processed RAS was
accepted by producers. The combined total of unprocessed and processed RAS accepted in 2015 was
1.94 million tons, slightly higher than the amount of RAS used in asphalt mixtures.
• Eighty-eight percent of companies/branches using RAS reported having excess RAS on hand at the end of the
2015 construction season.
• Of the RAS used in 2015, more than 99 percent was used in asphalt mixes. The remainder was combined with
aggregates. No RAS was landfilled.
• The number of states with reported RAS use decreased from 36 states in 2014 to 34 states in 2015. One state
that reported using RAS in 2014 did not have any producers participating in the 2015 construction season
survey.
• In 2015, producers were asked which sectors allow RAS in asphalt mixtures. Most RAS is allowed in the
Commercial & Residential sector followed by the Other Agency sector. Many DOTs allow RAS in some mixes, but
few allow it in all mixtures.
• The combined savings of asphalt binder ($480/ton) and aggregate ($9.25/ton) from the use of RAP and RAS in
asphalt mixes is more than $2.6 billion. This helps reduce material costs for asphalt pavement mixtures, allowing
road owners to achieve more roadway maintenance and construction activities within limited budgets.
• The number of states reporting use of ground tire rubber (GTR) in asphalt mixtures increased from nine in 2014
to 14 in 2015. The total reported tons of asphalt pavement mix using GTR grew 2.9 percent from 2014 to
1.235 million tons in the 2015 construction season.
• The number of states reporting use of steel or blast furnace slags remained constant at 11 states in 2015, but
the amount of mixtures using these materials decreased by about 12 percent from 2014 to 2015.
• The reported use of cellulose fiber reached an all-time high of 17 states in 2015, due to the survey being
modified to asking specifically about cellulose fiber this year.
• Two states, Tennessee and Wisconsin, reported using fly ash in asphalt mixtures in 2015. Wisconsin reported a
significant increase in the use of fly ash.
• Less commonly recycled materials reported in 2015 included foundry sand, recycled glass, and petroleum-
contaminated soil.

38 | Information Series 138 (6th edition)
The use of WMA continues to increase, but at a slower rate. The 2015 construction season survey shows:
• The estimated total production of WMA for the 2015 construction season was about 120 million tons. This was a
greater than 5 percent increase from the estimated 114 million tons of WMA in 2014 and a more than
614 percent increase from the estimated 16.8 million tons in the 2009 construction season.
• WMA was about one-third of the total estimated asphalt mixture market in 2015.
• Plant foaming, representing 72 percent of the market, is the most commonly used warm-mix technology;
chemical additive technologies accounted for a little more than 25 percent of the market.
• One hundred producers, 60 percent of respondents, in 41 states also reported using WMA additives in some
asphalt pavement mixtures produced at HMA temperatures.
The 2015 survey results show that the asphalt pavement mix production industry has a strong record of sustainable
practices and continues to increase its use of recycled materials and WMA. Since the initial industry survey of the 2009
construction season, producers have increased significantly their use of recycled materials and WMA; however, since
the 2013 survey, indicators are that the rate of increase in the adoption of RAP, RAS, and WMA may be plateauing.
Slightly more RAP was used than received during the 2015 construction season, and 88 percent of producers indicated
they have excess RAP on hand. With an estimated 85 million tons of RAP stockpiled nationwide, opportunities remain to
increase the amount of RAP used in asphalt mixes through permissive specifications, education, and improved RAP
processing, production equipment, and procedures.
RAS use saw a slight decrease in 2015; however, by including 1.931 million tons of waste shingles in asphalt mixtures,
producers recycled 15 percent of the nation’s available waste shingles. As with RAP, permissive specifications,
education, and improved processing, production equipment, and procedures will help increase the amount and
percentages of RAS used in asphalt mixes.
The asphalt pavement mix production industry repurposes many products from other industries. The survey shows that,
for the 2015 construction season, steel and blast furnace slag use was reported in 11 states, GTR use was reported in 14
states, cellulose fiber use was reported in 17 states in 2015; and fly ash in two states.
WMA use continued to increase during the 2015 construction season with a total production of nearly 120 million tons,
which represents nearly one-third of the total estimated asphalt mix production. All states responding to the survey,
with the exceptions of Nevada, West Virginia, and Rhode Island, reported using WMA in 2015. Although the increase in
the use of WMA from the 2014 to 2015 construction season was only about 1 percent, WMA use is expected to continue
to increase, as more states allow the use of WMA technologies in asphalt mixtures.
Information Series 138 (6th edition) | 39
References ARMA (2015). Personal communication from R.X. Gumucio, Asphalt
Roofing Manufacturers Association, Washington, D.C.
Bahai, H.U. (2011). Synthesis of Use of Crumb Rubber in Hot Mix
Asphalt. Final Report for RMRC Project 54. Recycled Materials
Resource Center. Madison, Wisconsin.
Carvalho, R.L., H. Shirazi, M. Ayres Jr., & O. Selezneva (2010).
Performance of Recycled Hot-Mix Asphalt Overlays in
Rehabilitation of Flexible Pavements. In Transportation
Research Record: Journal of the Transportation Research Board,
No. 2155. Transportation Research Board of the National
Academies, Washington, D.C. pp. 55–62. doi:10.3141/2155-06
CIF (2013). 2013 NOVA Award Winner — Warm Mix Asphalt.
Construction Innovation Forum, Walbridge, Ohio.
http://youtu.be/q47p1SAy4g4 [Accessed 14 August 2014]
Copeland, A. (2011). Reclaimed Asphalt Pavement in Asphalt
Mixtures: State of the Practice. Report FHWA-HRT-11-021.
Federal Highway Administration, McLean, Virginia.
Copeland, A., C.L. Jones, & J. Bukowski (2010). Reclaiming Roads.
Public Roads, Vol. 73, No. 5 (March/April). Publication FHWA-
HRT-10-001.
http://www.fhwa.dot.gov/publications/publicroads/10mar/06.
cfm [Accessed 14 August 2014]
FHWA (2013). Every Day Counts: Warm Mix Asphalt [website].
Federal Highway Administration, Washington, D.C.
https://www.fhwa.dot.gov/everydaycounts/technology/asphalt
/intro.cfm [Accessed 14 August 2014]
Hansen, K.R., & A. Copeland (2013a). 2nd Annual Asphalt Pavement
Industry Survey on Reclaimed Asphalt Pavement, Reclaimed
Asphalt Shingles, and Warm-Mix Asphalt Usage: 2009–2011
(IS 138). National Asphalt Pavement Association, Lanham,
Maryland.
Hansen, K.R., & A. Copeland (2013b). Annual Asphalt Pavement
Industry Survey on Recycled Materials and Warm-Mix Asphalt
Usage: 2009–2012, 3rd Annual Survey (IS 138). National Asphalt
Pavement Association, Lanham, Maryland.
Hansen, K.R., & A. Copeland (2014). Annual Asphalt Pavement
Industry Survey on Recycled Materials and Warm-Mix Asphalt
Usage: 2009–2013, 4th Annual Survey (IS 138). National Asphalt
Pavement Association, Lanham, Maryland.
Hansen, K.R., & A. Copeland (2015). Annual Asphalt Pavement
Industry Survey on Recycled Materials and Warm-Mix Asphalt
Usage: 2014, 5th Annual Survey (IS 138). National Asphalt
Pavement Association, Lanham, Maryland.
Hansen, K.R., & D.E. Newcomb (2011). Asphalt Pavement Mix
Production Survey: Reclaimed Asphalt Pavement, Reclaimed
Asphalt Shingles, Warm-Mix Asphalt Usage: 2009–2010
(IS 138). National Asphalt Pavement Association, Lanham,
Maryland.
NAHB (1998). From Roofs to Roads... Recycling Asphalt Roofing
Shingles into Paving Materials. NAHB Research Center, National
Association of Home Builders, Upper Marlboro, Maryland.
NSA (2015). Slag ... A Green Product in Its Own Right! (Document
207-2). National Slag Association, Pleasant Grove, Utah.
http://nationalslag.org/sites/nationalslag/files/documents/SLA
G-A%20Green%20Product.pdf [Accessed 22 September 2015]
Pappas, J. (2011). Recycling Materials Survey. Presented at the RAP
Expert Task Group May Meeting, May 2011, Irvine, California.
http://www.morerap.us/files/meetings/05-11/pappas-
recycling-materials-survey.pdf [Accessed 14 August 2014]
Prowell, B.D., G.C. Hurley, & B. Frank. (2012). Warm-Mix Asphalt:
Best Practices, 3rd Edition (QIP 125). National Asphalt Pavement
Association, Lanham, Maryland.
RMA (2016). 2015 U.S. Scrap Tire Management Summary. Rubber
Manufacturers Association, Washington, D.C.
https://rma.org/sites/default/files/RMA_scraptire_summ_2015
.pdf [Accessed 20 December 2016]
USGS (2016). Mineral Commodities Summaries 2016. U.S. Geological
Survey, Reston, Virginia. doi:10.3133/70140094.
West, R.C. (2016). Best Practices for RAP and RAS Management (QIP
129). National Asphalt Pavement Association, Lanham,
Maryland.
West, R.C., J. Michael, R. Turochy, & S. Maghsoodloo (2011). Use of
Data from Specific Pavement Studies Experiment 5 in the Long-
Term Pavement Performance Program to Compare Virgin and
Recycled Asphalt Pavements. In Transportation Research
Record: Journal of the Transportation Research Board, No.
2208. Transportation Research Board of the National
Academies, Washington, D.C. pp. 82–89. doi:10.3141/2208-11

40 | Information Series 138 (6th edition)
National Asphalt Pavement Association NAPA Building 5100 Forbes Blvd. Lanham, Maryland 20706-4407 www.AsphaltPavement.org [email protected] Toll Free: 888-468-6499 Tel: 301-731-4748 Fax: 301-731-4621 Publication Sales: http://store.AsphaltPavement.org [email protected] Toll Free: 888-600-4474 Tel: 412-741-6314 Fax: 412-741-0609 6th Annual Asphalt Pavement Industry Survey
IS 138