aspirations, there will be no accomplishment. · aspirations hi-p international limited. contents 1...
TRANSCRIPT

Annual Report 2004
Unifying OurAspirationsHi-P International Limited

CONTENTS
1 Highlights of 2004
2 Company Profile
4 Performance at a Glance
6 Letter to Shareholders
8 Board of Directors
10 Key Management Team
12 Operations Review and Outlook
14 Corporate and Business Strategies:
3-Axis Strategy
Execution Foundation
SBU Strategy and Business Model
17 Financial Report 2004
Quotations in the following pages are attributed to our Chairman and CEO, Mr Yao Hsiao Tung. These sayings reflect his personal and management philosophies.

Hi-P International Limited : annual report 2004 p.01
HIGHLIGHTS OF 2004
Awards
• Awarded “Fastest Growing 50” certification for 2004 from DP Information Network Pte Ltd
• Received Most Transparent Company Award (Runner-up in New Issues category) in SIAS Investors' Choice Awards
Achievements
• Achieved ISO 9001 – Hi-P (Shanghai) Industries Co., Ltd.
• Achieved ISO 9001 – Hi-P Tianjin Electronics Co., Ltd.
• Achieved ISO 9001 – Hi-P Suzhou Technology Co., Ltd.
Results
• Achieved 151% rise in revenue and 170% rise in net profit for Q1
• Achieved 159% rise in revenue and 196% rise in net profit for Q2
• Achieved 133% rise in revenue and 117% rise in net profit for Q3
• Achieved 81% rise in revenue and 114% rise in net profit for Q4
”Our aspirations are key to our success. Without aspirations, there will be no accomplishment.“
New Subsidiaries
• Incorporated Hi-P (Suzhou) Electronics Co., Ltd.
• Incorporated Hi-P (Tianjin) Technology Co., Ltd.
• Incorporated Hi-P Samkwang Technology (Singapore) Pte. Ltd.
• Incorporated Hi-P (Shanghai) Technology Co., Ltd.
New Initiatives / Programmes
• Launched Toolmaker Apprentice Programme
• Announced new corporate initiative to reorganize business into Strategic Business Units
• Conducted campus recruitment campaigns at universities in the PRC to select candidates for the Management Associates Programme
Others
• Convened first Annual General Meeting
• Issued share options for the first time under the Employee Share Option Scheme
• Appointed Mr Chester Lin Chien as Non-Executive Director
• Entered into joint venture with Samkwang Industry Company Limited
• Relocated to new factory premises in Xiamen
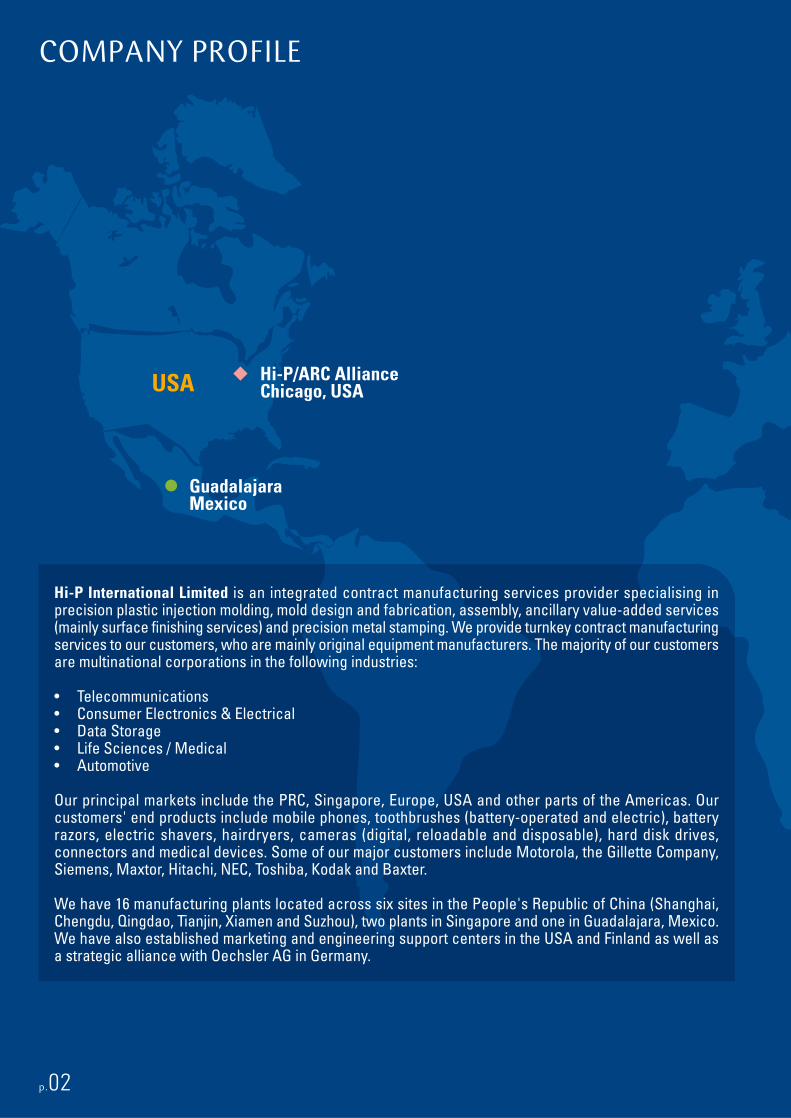
COMPANY PROFILE
p.02
Hi-P/ARC AllianceChicago, USA
GuadalajaraMexico
USA
Hi-P International Limited is an integrated contract manufacturing services provider specialising in precision plastic injection molding, mold design and fabrication, assembly, ancillary value-added services (mainly surface finishing services) and precision metal stamping. We provide turnkey contract manufacturing services to our customers, who are mainly original equipment manufacturers. The majority of our customers are multinational corporations in the following industries:
• Telecommunications• Consumer Electronics & Electrical• Data Storage• Life Sciences / Medical• Automotive
Our principal markets include the PRC, Singapore, Europe, USA and other parts of the Americas. Our customers' end products include mobile phones, toothbrushes (battery-operated and electric), battery razors, electric shavers, hairdryers, cameras (digital, reloadable and disposable), hard disk drives, connectors and medical devices. Some of our major customers include Motorola, the Gillette Company, Siemens, Maxtor, Hitachi, NEC, Toshiba, Kodak and Baxter.
We have 16 manufacturing plants located across six sites in the People's Republic of China (Shanghai, Chengdu, Qingdao, Tianjin, Xiamen and Suzhou), two plants in Singapore and one in Guadalajara, Mexico. We have also established marketing and engineering support centers in the USA and Finland as well as a strategic alliance with Oechsler AG in Germany.

p.03Hi-P International Limited : annual report 2004
Tianjin
Qingdao
Chengdu
Shanghai
Suzhou
Xiamen
Singapore
China
Hi-P/Oechsler AllianceAnsbach, Germany
Salo, Finland
Manufacturing Plant
Marketing & Engineering Support Centre

PERFORMANCE AT A GLANCE
5-YEAR KEY FINANCIAL DATA2000 2001 2002 2003 2004
For the Year (S$ m)Revenue 80 101 143 249 561Gross Profit 29 28 41 66 140Pretax Profit 18 12 20 40 92Net Profit 14 10 18 37 88
Capital Expenditure 19 26 32 55 63Gross Margin 36% 28% 29% 26% 25%Net Margin 18% 10% 13% 15% 16%
At Year End (S$ m)Total Assets 89 124 164 342 443Net Assets 48 62 77 194 271Total Liabilities 40 62 87 149 172Share Capital 18 18 18 44 44Shareholders' Funds 48 61 75 191 269Cash & Cash Equivalents 8 13 8 112 88Interest-bearing Debts 22 35 39 47 22Debt/Equity Ratio 45% 57% 52% 25% 8%Return on Assets * 19% 9% 12% 14% 22%Return on Equity ** 35% 18% 26% 27% 38%
Per Share Data (Singapore cents)Earnings Per Share *** 1.63 1.11 2.02 4.12 9.93Net Assets Per Share *** 5.46 7.05 8.64 21.84 30.58
* Return on Assets is calculated based on net profit and average total assets.** Return on Equity is calculated based on net profit and average shareholders’ equity.*** For comparative purposes, Earnings Per Share and Net Assets Per Share are calculated based on the post-Invitation share
capital of 887,000,000 shares.
p.04
Revenue (S$ m)
249
2003
600
500
300
100
0
561
143
101
2004
2002
2001
2000
400
200
80
Gross Profit (S$ m)
6620
03
100
0
140
41
28
2004
2002
2001
2000
150
50
29
Net Profit (S$ m)
3720
03
100
80
40
0
88
18
10
2004
2002
2001
2000
60
20 14

44
48
8
2004
13
45
2003
PPIM
MDF
Assembly
42
Revenue Contribution By Activity (%) Revenue Contribution By Geography (%)
Revenue Contribution By Segment (%)2004 Quarterly Performance
p.05Hi-P International Limited : annual report 2004
2004 FINANCIAL HIGHLIGHTS
36
56
17
2004
46
132
2003
Telecom
ConsumerElect
Data Storage
Others
39
4
2
14
28
52
2004
5
8
2003
Others
Europe
USA
13
19
55
PRC
Singapore
Revenue
Net Profit
Q2
100
50
0
Q1 Q3 Q4200
151
112
155
143
22
16
25 25
150
PPIMPrecision Plastic Injection Molding
MDFMold Design & Fabrication
LETTER TO SHAREHOLDERS
Dear Shareholders,
2004 was another outstanding year in Hi-P's 24-year history. We achieved record revenues of S$561 million, an increase of 125%. What is more remarkable is that we have managed to achieve this spectacular growth in revenue even after chalking up a cumulative average growth rate of 53% for the five years from 1999 to 2003. Net profit attributable to shareholders rose 141% to S$88 million. The Board of Directors has proposed a first and final dividend of Singapore cents 1.0 per share (2003: Singapore cents 0.5 per share).
2004 also marked the first full year of Hi-P's listing on the Singapore Exchange. Hi-P‘s market capitalization has almost tripled from S$506 million (based on our initial public offer in December 2003) to S$1.4 billion as at 15 March 2005.
I am proud that Hi-P is a company of people that share a common vision and enduring commitment to excellence. Our people have worked very hard to build a company that stands on integrity, excellence and superior customer service. As a result, we have been able to build and deepen relationships with some of the world's leading brands. Besides expressing my appreciation to the dedicated employees of Hi-P, I am also thankful to our board of directors for their prudent counsel and guidance in the execution of our strategy last year. And to our customers, I am grateful for their continuing confidence and support.
A year of great execution
2004 was a year of strong demand across all our customers' end markets. Especially strong were the telecommunications segment and the consumer electronics and electrical segment as we undertook new projects for Siemens, Motorola and the Gillette Company. We also managed more turnkey projects and the expanded scope of work helped boost average selling prices last year.
Even as the company grew, Hi-P continued to exercise financial prudence. Last year, we generated a healthy net operating cashflow of S$58 million (2003: S$54 million). As at end December 2004, Hi-P's financial position remained strong with net cash of S$69 million and a low Debt to Equity ratio of 8%. Return on Equity was a robust 38% (2003: 27%).
...we have been able to build and deepen relationships with some of the world's leading brands...
p.06

SBU strategy to take Hi-P to new heights
Over the years, I have seen Hi-P through many transformations. We have come a long way from our beginnings as a tooling company in the 1980s. Today, we are one of the world's fastest growing contract manufacturers that specialize in precision plastic injection molding and our customers are leading brands in the global market. Today, the Hi-P family has more than 9,500 employees (including contract workers) spread across six countries.
The transformation into a global manufacturing force has been dramatic and yet it has also been deliberate. At Hi-P, one of our key strengths has been our ability to develop and implement effective strategies at each stage of our growth. We have been very successful with our 3-axis strategy in moving up the value chain; in the last four years, we have significantly broadened our core expertise beyond plastic injection molding and are now able to offer our customers integrated, cost efficient turnkey manufacturing solutions. Importantly too, we have established a strong execution foundation in all functional areas and we have built a strong Hi-P culture that is dedicated to excellence.
Going forward, while the outsourcing trend remains intact, we have noticed that manufacturers are also looking beyond leveraging mere comparative cost advantages. They are increasingly focusing on strategic competitive and value advantages, and they prefer to deal with fewer suppliers in their outsourcing process. To better serve the needs of these global manufacturers, we have to be more customer-centric and be able to provide a one-stop solution.
In light of these challenges, Hi-P has announced new corporate initiatives to better position itself for a new era of growth as a global integrated contract manufacturer.
Since January 2005, Hi-P's business has been reorganized into three Strategic Business Units (SBUs):- Wireless, Consumer Electronics and Computing. These three SBUs will each be driven by very capable and experienced senior management. Under this new initiative, each SBU will have greater accountability and greater flexibility to grow their business while at the same time allow Hi-P
as a group to offer our customers better value and the convenience of a one-stop shop. As a result, we will be expanding our process abilities as well as component module manufacturing capabilities to continue the transformation of the company.
Another year of growth in 2005
2005 will be another year of growth. We expect to participate actively in several new product roll-outs by our customers. Our new SBU strategy is also gathering momentum and we are starting to see visible and positive results across the company; our staff are getting more focused and specialised, and the friendly internal competition is driving all to work harder and smarter. We expect to see exponential benefits from our SBU strategy – higher volumes resulting from new customer acquisitions across product and geographical markets, and higher average selling prices as we continue to expand our capabilities and undertake more turnkey work for our customers.
Unifying Our Aspirations
To you, our dear shareholders, I thank you for your support. I am confident that Hi-P has the right people and the right strategy to sustain growth for many years to come and I hope we can continue to scale each new milestone together.
At Hi-P, we believe in attracting, retaining and nurturing the best talents available. We have built up a strong management team that will lead the Group into the next era of growth. Our employees dare to dream and be challenged because they know that they are recognized for their efforts as they grow with the company. Our SBU strategy and our unique Hi-P culture will be the cornerstone of our future ambitions and help us realize our vision of becoming the world's leading global integrated contract manufacturer.
Yao Hsiao TungChairman and Chief Executive OfficerApril 2005
p.07Hi-P International Limited : annual report 2004
”I have experienced many hardships when I was young. Life is like a teacher. It teaches me “never to quit”.“

BOARD OF DIRECTORS
Mr Yao Hsiao Tung is our Chairman and
Chief Executive Officer. He was appointed
to the Board in May 1983. He is responsible
for formulating the strategic directions of
the Group as well as overall management
of the operations. Mr Yao has more than 40
years of experience in the precision tooling
and plastic injection molding industry.
He was a technical service manager with
Du Pont Singapore Electronics Pte Ltd before joining the Group in 1980. Mr Yao holds a
Diploma in Chemical Engineering from Taiwan Kaohsiung Technical College.
Mdm Wong Huey Fang is an Executive
Director and Chief Administrative Officer
of the Group. Her key responsibilities
i n c l u d e m a n a g i n g o u r G r o u p ' s
administrative, legal, public relations
and procurement functions. She was
appointed to the Board in January 1988.
Prior to joining our Group in 1985, Mdm
Wong was a purchaser with Taiwan-based
Aven Electronics Co. Ltd.
Mr Yeo Tiong Eng is a Non-Executive
Director of the Group and was appointed to
the Board in April 1987. He is currently the
Senior Regional Financial Director of Molex
Far East South Management Pte Ltd. Mr Yeo
graduated with a Bachelor’s degree in
Accountancy from Nanyang University.
He also holds a Masters of Business
Administration (Business Law) from Nanyang
Technological University. He is a member of the Institute of Certified Public Accountants
of Singapore.
p.08

Dr Tan Khee Giap is an Independent
Director of the Group and was appointed
to the Board in November 2003. He is an
Associate Professor of Banking and Finance
with Nanyang Technological University.
Dr Tan also serves as a consultant to
multinationals and global organisations
in various areas. He is currently the Deputy
President of the Economics Society of
Singapore. Dr Tan holds a PhD in Economics from the University of East Anglia, UK.
Mr Wong Meng Meng is an Independent
Director of the Group and was appointed
to the Board in November 2003. He is the
Senior Partner of Wong Partnership, and
a director of Clifford Chance Wong Pte Ltd.
He has more than 30 years of experience
in litigation and arbitration in banking,
corporate and commercial matters. He is
a member of the International Arbitration
Institute, the Singapore International Arbitration Centre's Main Panel of Arbitrators, the
Butterworths Asia Advisory Panel on Construction Industry and the Singapore Institute of
Architects Panel of Arbitrators.
Mr Chester Lin Chien is a Non-Executive
Director of the Group and was appointed
to the Board in August 2004. Mr Lin was
previously the Executive Vice President
and President of Solectron's Asia Pacific
region. Prior to joining Solectron, he was
the Chief Executive Officer of NatSteel
Electronics from 1993 to 2001. Previously,
Mr Lin also worked with SCI Systems,
General Electric and General Instruments (Taiwan). He holds a Bachelor's degree in Electrical
Engineering from the Taipei Institute of Technology.
p.09Hi-P International Limited : annual report 2004

1. Philip Tan Tor Howe is our Chief Financial Officer. He is responsible for the overall
financial operations of our Group. Prior to joining the Group in June 2002, he was the
Director of Financial Planning and Analysis of Solectron Technology Pte Ltd (previously
known as NatSteel Electronics Limited). Mr Tan was also previously the Chief Financial
Officer of Uraco Holdings Limited and an auditor with Deloitte & Touche. He holds a
Bachelor of Accountancy degree (Honours) from the National University of Singapore
and is also a Chartered Financial Analyst. He is a member of the Institute of Certified
Public Accountants of Singapore.
2. Gary Ho Hock Yong is our Managing Director, Wireless SBU. He is responsible for the
overall management and business development of the business unit. He has been with
the Group since April 1996 and had previously assumed the roles of Marketing Director,
Senior Sales Engineer, Assistant Sales Manager, Sales Manager, Regional Sales Manager
and Corporate Business Manager within the group. Mr Ho holds a Diploma in Production
Technology from the German Singapore Institute.
3. Gerhard J. Zebe is our Managing Director, Consumer Electronics SBU. He is responsible
for the overall management and business development of the business unit. Mr Zebe
has more than 29 years of experience in the precision plastic injection mold design and
fabrication industry. He was previously Managing Director of the Group's Greater China
operations. Prior to joining the Group in June 2002, Mr Zebe was the Technical Director
in Braun (Shanghai) Co., Ltd. He had previously held various managerial positions in
German-based companies. Mr Zebe holds a Diploma for tool making/tool design with
the German Chamber for Industry and Commerce.
KEY MANAGEMENT TEAM
p.10
1 2 34 5 6

Self-expectation is key. It is like high jump. Will you put the pole so low such that you can jump over it easily;
or will you put the pole higher and work harder to reach the goal? Ambition is the pole to measure life’s goals.
4. Ang Lien Peng is our General Manager, Computing SBU. He is responsible for the
overall management and business development of the business unit. He first joined the
Group in September 1998 as a Customer Account Manager. Mr Ang has more than 18
years of experience in the precision plastic injection molding field, having worked in
Omni Plastics Pte Ltd, Singa Plastics Pte Ltd and Phillips Singapore Pte Ltd. He holds a
Bachelor’s Degree in Business Administration from the Oklahoma City University and a
Diploma in Production Technology from the German Singapore Institute.
5. Chan Hean Wee is our Managing Director, Metal Stamping SPU (Special Process Unit).
He is responsible for the overall management and business development of the process
unit. Mr Chan has more than 20 years of experience in the metal stamping field. Prior
to joining the Group in November 2001, he was Chief Executive Officer and Executive
Director of Bi-link Metal Specialties (S) Pte Ltd. Previously, he also held management
and supervisory positions in NMB Precision Tool & Die Pte, Ltd. and NMB Singapore Ltd.
Mr Chan holds a Bachelor’s degree (First Class Honours) in Mechanical Engineering
from Strathclyde University, Scotland and a Diploma in Mechanical Engineering from
Singapore Polytechnic.
6. Lee Kam Choon is our Vice-President of Human Resources. Prior to joining the Group
in October 2003, Mr Lee was the Senior Vice-President of Group Human Resources at
the United Overseas Bank Group. He had previously held senior management positions
in various multi-national corporations. Mr Lee holds a Bachelor of Commerce (Honours)
from Nanyang University and a Masters of Arts (Human Resources Development) from
George Washington University in the United States.
“
”
p.11Hi-P International Limited : annual report 2004
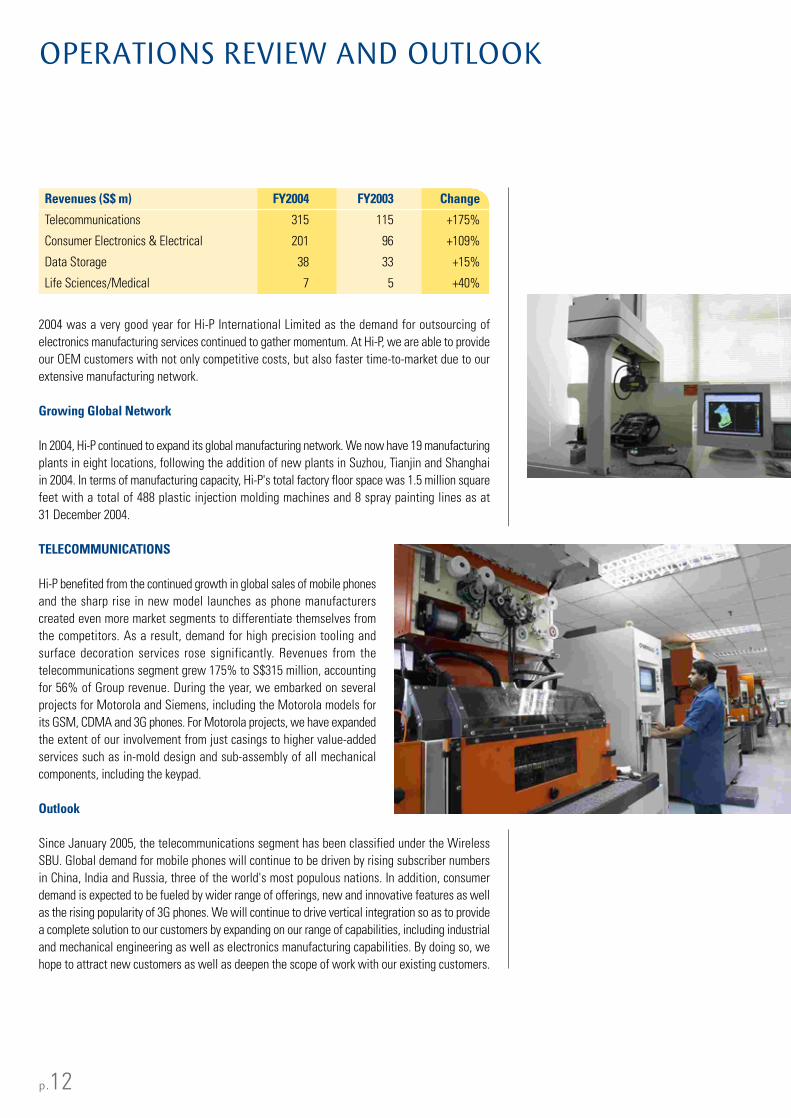
OPERATIONS REVIEW AND OUTLOOK
2004 was a very good year for Hi-P International Limited as the demand for outsourcing of electronics manufacturing services continued to gather momentum. At Hi-P, we are able to provide our OEM customers with not only competitive costs, but also faster time-to-market due to our extensive manufacturing network.
Growing Global Network
In 2004, Hi-P continued to expand its global manufacturing network. We now have 19 manufacturing plants in eight locations, following the addition of new plants in Suzhou, Tianjin and Shanghai in 2004. In terms of manufacturing capacity, Hi-P's total factory floor space was 1.5 million square feet with a total of 488 plastic injection molding machines and 8 spray painting lines as at 31 December 2004.
TELECOMMUNICATIONS
Hi-P benefited from the continued growth in global sales of mobile phones and the sharp rise in new model launches as phone manufacturers created even more market segments to differentiate themselves from the competitors. As a result, demand for high precision tooling and surface decoration services rose significantly. Revenues from the telecommunications segment grew 175% to S$315 million, accounting for 56% of Group revenue. During the year, we embarked on several projects for Motorola and Siemens, including the Motorola models for its GSM, CDMA and 3G phones. For Motorola projects, we have expanded the extent of our involvement from just casings to higher value-added services such as in-mold design and sub-assembly of all mechanical components, including the keypad.
Outlook
Since January 2005, the telecommunications segment has been classified under the Wireless SBU. Global demand for mobile phones will continue to be driven by rising subscriber numbers in China, India and Russia, three of the world's most populous nations. In addition, consumer demand is expected to be fueled by wider range of offerings, new and innovative features as well as the rising popularity of 3G phones. We will continue to drive vertical integration so as to provide a complete solution to our customers by expanding on our range of capabilities, including industrial and mechanical engineering as well as electronics manufacturing capabilities. By doing so, we hope to attract new customers as well as deepen the scope of work with our existing customers.
p.12
Revenues (S$ m) FY2004 FY2003 Change
Telecommunications 315 115 +175%
Consumer Electronics & Electrical 201 96 +109%
Data Storage 38 33 +15%
Life Sciences/Medical 7 5 +40%

CONSUMER ELECTRONICS AND ELECTRICAL
It was also a busy year at the Consumer Electronics and Electrical segment. Apart from ongoing projects for Braun, segment revenue was boosted by new projects with the Gillette Company. These include the Gillette Mach3 Power razor, a battery-operated shaver for men, which had a very successful launch in the United States in 2004.
At the end of the third quarter ended 30 September 2004, we were affected by an abrupt end-of-life cycle for one of Braun’s electric toothbrush project. This affected revenue and capacity utilization for the 3rd and 4th quarter in FY2004. However, we have commenced production of a new Braun electric toothbrush since January 2005.
Revenue from the Consumer Electronics and Electrical segment achieved a more than 2-fold increase to S$201 million, accounting for 36% of Group revenue in 2004.
Outlook
Following the reorganization of the Group in January 2005, this segment will be classified under the Consumer Electronics SBU. We continue to be optimistic on prospects for 2005 in view of the pipeline of projects as indicated in the product roll-out plans of our existing customers such as the Gillette Company and Braun as well as that of new customers. Our strategy is to work with the brand leaders in each market segment as we expand into the other consumer electronics segments such as kitchen machines, power tools and household appliances.
DATA STORAGE/LIFE SCIENCES
2004 marked a year of revival in the data storage market, particularly in consumer electronics products. The Data Storage segment picked up in the second half of the year on the back of rising popularity of small form formats, particularly the 1" drives. As a result, the segment reported 15% growth in revenues to S$38 million.
The Life Sciences segment continued to show strong growth, chalking up revenue growth of 40% to S$7 millon last year. One of the major projects we undertook was a turnkey project for intravenous drip subsystems for Baxter Healthcare SA.
Outlook
Since January 2005, both the data storage segment and life sciences segment have been classified under the Computing SBU. We expect continued steady growth in the data storage segment, especially the 1" drives on the back of buoyant consumer demand for MP3 players, digital video recorders, set-top boxes and games consoles. With greater vertical and horizontal integration, we expect to secure new customers in the computing and medical industries.
p.13Hi-P International Limited : annual report 2004
To cultivate aspiration, one needs to understand oneself and the environment one is in.“
”
“A skyscraper starts with a single brick”. When you build a skyscraper, you have to have a solid foundation. You have to be conscientious with each step because
each step leaves a single footprint.“
”p.14
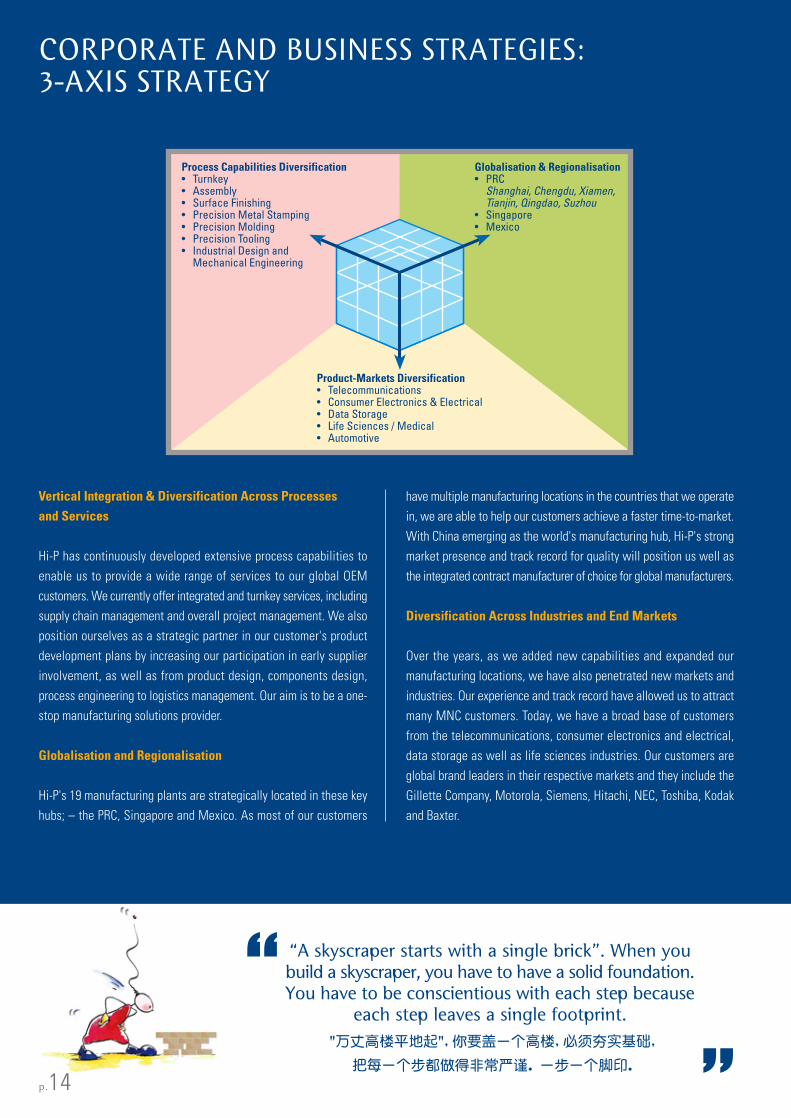
CORPORATE AND BUSINESS STRATEGIES:3-AXIS STRATEGY
Globalisation & Regionalisation• PRC
Shanghai, Chengdu, Xiamen, Tianjin, Qingdao, Suzhou
• Singapore• Mexico
Process Capabilities Diversification• Turnkey • Assembly• Surface Finishing• Precision Metal Stamping• Precision Molding• Precision Tooling• Industrial Design and
Mechanical Engineering
Product-Markets Diversification• Telecommunications• Consumer Electronics & Electrical• Data Storage• Life Sciences / Medical• Automotive
Vertical Integration & Diversification Across Processes and Services
Hi-P has continuously developed extensive process capabilities to enable us to provide a wide range of services to our global OEM customers. We currently offer integrated and turnkey services, including supply chain management and overall project management. We also position ourselves as a strategic partner in our customer's product development plans by increasing our participation in early supplier involvement, as well as from product design, components design, process engineering to logistics management. Our aim is to be a one-stop manufacturing solutions provider.
Globalisation and Regionalisation
Hi-P's 19 manufacturing plants are strategically located in these key hubs; – the PRC, Singapore and Mexico. As most of our customers
have multiple manufacturing locations in the countries that we operate in, we are able to help our customers achieve a faster time-to-market. With China emerging as the world's manufacturing hub, Hi-P's strong market presence and track record for quality will position us well as the integrated contract manufacturer of choice for global manufacturers.
Diversification Across Industries and End Markets
Over the years, as we added new capabilities and expanded our manufacturing locations, we have also penetrated new markets and industries. Our experience and track record have allowed us to attract many MNC customers. Today, we have a broad base of customers from the telecommunications, consumer electronics and electrical, data storage as well as life sciences industries. Our customers are global brand leaders in their respective markets and they include the Gillette Company, Motorola, Siemens, Hitachi, NEC, Toshiba, Kodak and Baxter.

p.15Hi-P International Limited : annual report 2004
A strong Execution Foundation has been the cornerstone of the successful implementation of our corporate strategy over the years. At Hi-P, we are performance driven and yet, people-centered. Our people seek continuous improvement in all areas so as to maximise results. The principles of our execution foundation are applied consistently throughout all functional areas, from Finance, HR, Supply Chain, Quality, Information Technology to Business Development and Operations. The key areas of execution are:
STRONG ORGANISATION STRUCTURE
In Hi-P, we seek to build a strong organisation structure by attracting, retaining and nurturing the best talents available. Jobs are structured to provide adequate depth and scope to the individuals as well as aligned with their personal interests and ambitions. At Hi-P, we emphasise continuous learning and provide regular training across all levels of staff. We continually identify, groom and train potential talents for key positions. Given Hi-P's size and span of business, we are able to offer our employees not only broader scope but also regional and global exposure. Our goal is to cultivate a diverse pool of skilled talents who are innovative, flexible and ambitious, while adhering to the highest standard of integrity and commitment to society, as embodied by our Hi-P Culture.
EFFECTIVE SYSTEMS AND PROCEDURES
Hi-P seeks continuous improvement in its systems and procedures to maximise productivity across the company. We have successfully implemented the SAP R/3 4.6C Enterprise Resource Planning ("ERP") system in 10 manufacturing plants. By linking various business functions such as production, planning, manufacturing, inventory management, purchasing, sales and finance, we have been able to promote the sharing of information and knowledge. The ERP system has also improved operating efficiencies and helped tightened internal controls
within the organisation. We are in the process of extending the ERP system throughout all locations of the Group. To support the rapid growth of our business and our positioning as a strategic partner to our customers, we will also be introducing electronic integration of our customers' systems with our ERP system. This will deepen the relationships with our customers and allow us to provide an end-to-end supply chain system to support our ambition of being the fastest growing integrated contract manufacturer. At the same
time, we also rigorously enforce applications of the system to drive operational performance and improve our efficiency. We do so by the continuous strengthening of operational procedures and training at all levels of the organisation.
EFFECTIVE MOTIVATION MECHANISM
Hi-P has designed a reward system that aligns employees' personal goals with that of the organisation so that each employee is effectively motivated and is able to add value to the organisation. We recognise and reward employees according to their contribution and performance. At Hi-P, we also believe in rewarding our employees appropriately by rewarding them at the optimal intervals according to their levels in the organisation. For example, for production staff, we have implemented a variable wage structure with a high variable component that comprises monthly incentives and a half-yearly variable bonus, based on an employee's individual and team productivity as well as his ability to contribute to meeting clear targets of key performance indicators. Employee evaluations are conducted regularly and targets are also reviewed constantly to ensure that they remain relevant and objective.
Hi-P CULTURE
The two pillars of Hi-P culture are People and Results. We believe that everyone plays a part in the success of the company and we seek to maximise each employee's potential and contribution. Our reward system is designed to motivate employees by ensuring that their compensation is directly commensurate with their contribution and performance as an individual and as well as a team member. We also promote shared values that create a harmonious working environment by emphasising mutual respect, team spirit, integrity and discipline. We aim to build a group of highly productive people who can contribute positively to the individual, family, the company and society.
Build StrongOrganisation with
Right People
Set up EffectiveSystems &Procedures
EstablishEffective Motivation
Mechanism
InculcateHi-P Culture
ExecutionFoundation
CORPORATE AND BUSINESS STRATEGIES:EXECUTION FOUNDATION

p.16
Tooling MetalStamping
IMD / IML *Sheet Window
SurfaceCoating
ConsumerElectronics Wireless Computing
Keypad Antenna CameraModule PCBA **
StrategicBusiness Units
SpecialProcess Units
SpecialComponent
Modules
CORPORATE AND BUSINESS STRATEGIES:SBU STRATEGY AND BUSINESS MODEL
Hi-P has been very successful with our 3-axis strategy in moving up the value chain; in the last four years, we have significantly broadened our core expertise beyond plastic injection molding and are now able to offer our customers integrated, cost efficient turnkey manufacturing solutions. We have also expanded geographically and now have one of the largest tooling and plastic injection capacity in China, which is fast becoming the global manufacturing hub. We have also penetrated new customers and now serve global brand names in the telecommunications, consumer electronics and electrical, data storage as well as life sciences industries.
For our next stage of growth, we have adopted a new business initiative that we believe will effectively position us for sustainable growth ahead and sharpen our competitive edge as we evolve into a one-stop solution provider. Our OEM customers are increasingly focusing on strategic competitive and value advantages and thus prefer to deal with fewer and more integrated suppliers.
Since 1 January 2005, the Group has been reorganised into three Strategic Business Units ("SBUs"): – Wireless, Consumer Electronics and Computing. The SBUs are headed by very experienced senior management.
Each SBU will now have its own manufacturing and tooling operations while sharing resources in the various special processes such as metal stamping and surface coating. This new initiative effectively removes geographic barriers and allows each SBU to operate as independent business entities and profit centers.
We will also integrate vertically to better serve the needs of our customers and to enhance our value-add to them. As such, we will be actively broadening both process and component manufacturing capabilities. These capabilities may include processes such as industrial and mechanical design as well as manufacturing modules such as keypads, LCDs and antennas.
We believe that our new business model will support and strengthen the execution of our 3-axis strategy. We expect to optimise resource utilisation as we move towards realigning our existing resources and maximising the yields from these same resources. We also expect greater accountability and flexibility at each SBU. With this new strategic realignment in our business strategy, we believe that Hi-P can offer customers even greater value and undertake larger turnkey projects. This should result in higher volumes and higher unit prices for Hi-P from each project, thereby helping us to achieve accelerated growth in revenue for the Group.
"At Hi-P, we position ourselves as strategic partners to our customers. We wil l be expanding our manufacturing capabilities to allow us to offer our customers a total integrated
solution that also fast tracks their time-to-market in the very competitive mobile phone market."
Gary HoManaging Director
Wireless SBU
"Our strategy is to work with the brand leaders in each market segment and we will be looking to penetrate other exciting markets within the Consumer Electronics sector
such as housing appliances, kitchen machines and power tools, to name just a few."
Gerhard ZebeManaging Director
Consumer Electronics SBU
"The world of computing holds endless opportunities for Hi-P in the information age. With greater integration of our capabilities and our track record for reliability and quality, we
aim to broaden our customer base and expand our end product range in this sector."
Ang Lien PengGeneral ManagerComputing SBU
* In-mold Decoration / In-mold Label** Printed Circuit Board Assembly

Hi-P International Limited : annual report 2004 p.17
FINANCIAL REPORT 2004
18 Hi-P Group of Companies
19 Corporate Governance Report
27 Management’s Discussion and Analysis
of Financial Condition and Results of Operations
32 Directors’ Report
35 Statement by Directors
36 Auditors’ Report
37 Consolidated Profit and Loss Accounts
38 Balance Sheets
40 Consolidated Statement of Changes in Equity
41 Consolidated Cash Flow Statement
44 Notes to the Financial Statements
78 Statistics of Shareholdings
80 Notice of Annual General Meeting
Proxy Form

p.18
HI-P GROUP OF COMPANIES
HOLDING CO.
Hi-P International Limited11 International Business ParkJurong EastSingapore 609926
SUBSIDIARIES - SINGAPORE
Hi-P Industries Pte. Ltd.11 Woodlands Sector 1Singapore 738357
Hi-P Samkwang Technology(Singapore) Pte. Ltd.11 International Business ParkJurong EastSingapore 609926
Hi-P Management Services Pte. Ltd.(previously known asHi-P Tech Singapore Pte Ltd)11 International Business ParkJurong EastSingapore 609926
SUBSIDIARIES - EAST CHINA
Hi-P (Shanghai) Industries Co., Ltd.Building 8, No. 1006, Jinmin Road,Pudong New District,Shanghai, the PRC
Hi-P Camera Products Co., Ltd.No. 366, Jin Zang Road,Pudong New District,Shanghai, the PRC
Hi-P Precision Plastic Manufacturing(Shanghai) Co., Ltd.No. 366, Jin Zang Road,Pudong New District,Shanghai, the PRC
Hi-P (Shanghai) Housing ApplianceCo., Ltd.No. 366, Jin Zang Road,Pudong New District,Shanghai, the PRC
Hi-P Shanghai Electronics Co., Ltd.No. 366, Jin Zang Road,Pudong New District,Shanghai, the PRC
Hi-P (Suzhou) Technology Co., Ltd.Building G, No. 72 Loujiang Road,Kuatang Sub-Zone,Suzhou Industrial Park,Suzhou, the PRC
Hi-P (Suzhou) Electronics Co., LtdNo. 72 Loujiang Road, Kua Tang Town,Suzhou Industrial Park,Jiangsu, the PRC
Hi-P (Shanghai) Precision Mold &Die Co., Ltd.Building 3 and 4, 1006 Jinmin Road,Jinqiao Export Processing Zone,Shanghai City, the PRC
Hi-P (Shanghai) Technology Co., LtdNo. 3151 Gu Gao Road,Pudong New District,Shanghai, the PRC
SUBSIDIARIES - SOUTH CHINA
Hi-P (Xiamen) Precision PlasticManufacturing Co., Ltd.Xiamen Hai Cang Xing Gang Road,Export Processing Zone,4D Building, the PRC
SUBSIDIARIES - NORTH CHINA
Hi-P Tianjin Electronics Co., Ltd.6, Building C Xiang-an Road,Tianjin Technical and EconomicDevelopment Area, the PRC
Hi-P (Tianjin) Technology Co., Ltd.No. 80, the 9th Street, Tianjin Economicand Development Area, the PRC
Hi-P (Tianjin) Precision Mold &Die Co., Ltd.South Side, Building F,Fenghua Industrial Park,No. 66 the 9th Avenue,Tianjin Technological and EconomicDevelopment Area, Tianjin, the PRC
Qingdao Haier Hi-P Science TechnologyCo., Ltd.Haier Industrial Park, 1 Haier Road,Qingdao, the PRC
SUBSIDIARIES - WEST CHINA
Hi-P (Chengdu) Precision PlasticManufacturing Co., Ltd.D.E.F. Area, 1st floor, #11, Gaopeng Road,Chengdu High-Tech Development Zone,Chengdu, the PRC
Hi-P (Chengdu) Mold Base ManufacturingCo., Ltd.B2, C, 1st floor, #11, Gaopeng Road,Chengdu High-Tech Development Zone,Chengdu, the PRC
SUBSIDIARIES - MEXICO
High Precision Moulding and Tools,S.A. de C.V.Av. De la ExportacionNo. 317 Parque Industrial Guadalajara CarreteraGuadalajara –Chapala Km 7.5 Las Pintas, MP10, El Salto,Jalisco, C.O. 44690, Mexico
SUBSIDIARIES - NORTH AMERICA
Hi-P North America, Inc.2020 Hammond Drive,Schaumburg, IL 60173, USA
SUBSIDIARIES - OTHERS
Hi-P Finland OyHornin Katu 7A, 1, Salo 24100, Finland
Hi-P Mauritius Ltd.802 St James Court, St Denis StreetPort Louis, Mauritius
Hi-P Resources Ltd.802 St James Court, St Denis StreetPort Louis, Mauritius
ASSOCIATED CO.
Express Tech Mfg Pte. Ltd.5004 Ang Mo Kio Avenue 5#02-01, Tech Place IISingapore 569872
Hi-Tec Precision Mould Pte. Ltd.Blk 2 Skytech #04-01Bukit Batok Street 24Singapore 659480

Hi-P International Limited : annual report 2004 p.19
CORPORATE GOVERNANCE REPORT
Hi-P International Limited (the “Company”) is committed to achieving a high standard of corporate governance within the Group. The Companybelieves it has put in place effective self-regulatory corporate practices to protect its shareholders’ interests and enhance long-term shareholders’value. The Board is pleased to report on the Company’s corporate governance processes and activities as required by the Code of CorporateGovernance (the “Code”) prescribed by the Singapore Exchange Securities Trading Limited (“SGX-ST”). For easy reference, sections of the Codeunder discussion are specifically identified. However, this Report should be read as a whole as other sections of this Report may also have an impacton the specific disclosures.
Board Matters
Principle 1: Board Conduct of its Affairs
The Board of Directors (the “Board”) comprises the following members:
Executive Directors
Mr Yao Hsiao TungMdm Wong Huey Fang
Non-executive Directors
Mr Yeo Tiong EngMr Chester Lin Chien
Independent Directors
Dr Tan Khee GiapMr Wong Meng Meng
Apart from its statutory duties and responsibilities, the Board performs the following functions:-
(a) overseeing the management and affairs of the Group;(b) approving the Group’s corporate and strategic directions;(c) nomination of Directors to the Board;(d) appointment of key personnel;(e) reviewing the financial performance of the Group and implementing policies relating to financial matters, which include risk management and
internal control and compliance;(f) approving annual budgets, major funding proposals, investment and divestment proposals; and(g) assuming responsibility for corporate governance.
These functions are carried out either directly or through Board Committees such as the Nominating Committee, the Remuneration Committee andthe Audit Committee.
Matters which are specifically reserved to the full Board for decision are those involving a conflict of interest for a substantial shareholder or aDirector, material acquisitions and disposal of assets, corporate or financial restructuring, share issuance and dividends, and financial results andcorporate strategies.
Formal Board meetings are held at least once every quarter to oversee the business affairs of the Group, and to approve, if applicable, any financialor business objectives and strategies. Ad-hoc meetings are convened when the circumstances require. The Company’s Articles of Association allowa Board meeting to be conducted by way of tele-conference and video-conference.

p.20
CORPORATE GOVERNANCE REPORT
During the financial year, the Board held five meetings and the attendance of each Director at every Board and Board Committee meeting isas follows:-
Name Board Audit Nominating RemunerationCommittee Committee Committee
No. of No. of No. of No. of No. of No. of No. of No. ofmeetings meetings meetings meetings meetings meetings meetings meetings
held attended held attended held attended held attended
Mr Yao Hsiao Tung(Chairman) 5 5 4 4 1 1 1 1
Mdm Wong Huey Fang(Executive Director) 5 5 4 4 1 1 1 1
Mr Yeo Tiong Eng(Non-executive Director) 5 5 4 4 1 1 1 1
Mr Chester Lin Chien(Non-executive Director) 5 1* 4 1* N.A. N.A. N.A. N.A.
Dr Tan Khee Giap(Independent Director) 5 4 4 4 1 1 1 1
Mr Wong Meng Meng(Independent Director) 5 5 4 4 1 1 1 1
* Mr Chester Lin Chien was appointed a Director of the Company on 4 August 2004.
Principle 2: Board Composition and Balance
The Board comprises six Directors, two of whom are non-executive Directors and two are independent Directors. The independence of each Directorwill be reviewed annually by the Nominating Committee. The Nominating Committee adopts the Code definition of what constitutes an independentDirector in its review.
The Board will constantly examine its size and, with a view to determining the impact of the number upon effectiveness, decide on what it considersan appropriate size for the Board, which facilitates effective decision making. The composition of the Board will be reviewed on an annual basis bythe Nominating Committee to ensure that the Board has the appropriate mix of expertise and experience.
The Board, taking into account the nature of operations of the Company, considers its current size to be adequate for effective decision-making.Key information regarding the Directors’ academic and professional qualifications and other appointments is set out on pages 8 and 9 of theAnnual Report.
Hi-P International Limited : annual report 2004 p.21
Principle 6: Access to Information
To assist the Board in fulfilling its responsibilities, the Board is provided with management reports containing relevant background or explanatoryinformation required to support the decision-making process. The Board is provided with adequate and timely information prior to each Boardmeeting. The Board is also provided with management accounts of the Group’s performance, position and prospects on a quarterly basis.
The Board has separate and independent access to senior management and the Company Secretary at all times. The Company Secretary attends allBoard meetings and ensures that all Board procedures are followed. The Company Secretary also ensures that the Company complies with therequirements of the Companies Act and the SGX-ST.
If any of the Directors require independent professional advice in the furtherance of their duties, the cost of such professional advice will be borneby the Company.
Principle 3: Chairman and Chief Executive Officer
It is the view of the Board that it is in the best interest of the Group to adopt a single leadership structure, i.e. where the CEO and the Chairman ofthe Board is the same person, so as to ensure that the decision-making process of the Group would not be unnecessarily hindered.
The Board is of the view that there are sufficient safeguards and checks to ensure that the process of decision making by the Board is independentand based on collective decisions without any individual exercising any considerable concentration of power or influence. Further, all the Boardcommittees are chaired by independent Directors.
The Group’s Chairman and CEO is Mr Yao Hsiao Tung, who is responsible for the day-to-day operations of the Group, as well as monitoring thequality, quantity and timeliness of information flow between the Board and the management. Mr Yao is the founder of the Group and has played akey role in developing the Group’s business. Through the Group’s successful development in these few years, Mr Yao has demonstrated his vision,strong leadership and enthusiasm in this business.
Board Committees
Nominating Committee (“NC”)
Principle 4: Board MembershipPrinciple 5: Board Performance
The NC comprises Dr Tan Khee Giap, Mr Yeo Tiong Eng and Mr Wong Meng Meng. The Chairman of the NC is Dr Tan Khee Giap.
The Board has approved the written terms of reference of the NC. Its functions are as follows:-
(a) recommending and reviewing candidates for appointment to the Board;(b) reviewing candidates nominated for appointment as senior management staff;(c) reviewing and recommending to the Board on an annual basis, the Board structure, size and composition, taking into account the balance
between executive and non-executive, independent and non-independent Directors and having regard at all times to the principles of corporategovernance and the Code;
(d) procuring that at least one-third of the Board shall comprise independent Directors;(e) making recommendations to the Board on continuation of service of any Director who has reached the age of 70;(f) identifying and making recommendations to the Board as to the Directors who are to retire by rotation and to be put forward for re-election at
each Annual General Meeting (“AGM”) of the Company, having regard to the Directors’ contribution and performance, including independentDirectors;
(g) determining whether a Director is independent (taking into account the circumstances set out in the Code and other salient factors); and(h) proposing a set of objective performance criteria to the Board for approval and implementation, to evaluate the effectiveness of the Board as
a whole and the contribution of each Director to the effectiveness of the Board.
CORPORATE GOVERNANCE REPORT
p.22
The NC has adopted a formal process for the evaluation of the performance of the Board. In 2004, the Group implemented the Board-approvedevaluation process and performance criteria to assess the performance of the Board. The performance criteria includes an evaluation of the size andcomposition of the Board, the Board’s access to information, accountability, Board processes and Board performance in relation to discharging itsprincipal responsibilities in terms of the financial indicators as set out in the Code.
The NC assessed the Board’s performance as a whole in FY2004.
The assessment process involves and includes input from the Board members, applying the performance criteria recommended by the NC andapproved by the Board. The Directors’ input are collated and reviewed by the Chairman of the NC, who presents a summary of the overall assessmentto the NC for review. Areas where the Board’s performance and effectiveness could be enhanced and recommendations for improvement are thensubmitted to the Board for discussion and for implementation.
All Directors are subject to the provisions of the Company’s Articles of Association whereby one-third of the Directors are required to retire andsubject themselves to re-election by shareholders at every AGM.
A newly-appointed Director will have to submit himself for re-election at the AGM immediately following his appointment and, thereafter, besubjected to the one-third rotation rule.
The NC recommended to the Board that Mr Yao Hsiao Tung, Dr Tan Khee Giap and Mr Chester Lin Chien be nominated for re-appointment at theforthcoming AGM.
In making the recommendation, the NC had considered the Directors’ overall contribution and performance.
Remuneration Committee (“RC”)
Principle 7: Procedures for Developing Remuneration PoliciesPrinciple 8: Level and Mix of RemunerationPrinciple 9: Disclosure of Remuneration
The RC comprises Mr Wong Meng Meng, Mr Yao Hsiao Tung and Dr Tan Khee Giap. The Chairman of the RC is Mr Wong Meng Meng.
The Board has approved the written terms of reference of the RC. Its functions are as follows:-
(a) recommending to the Board a framework of remuneration for the Board and key executives of the Group (as required by law and/or the Code)which shall include the disclosure of details of the Company’s remuneration policy, level and mix of remuneration and procedure for settingremuneration and details of the specific remuneration packages such as Director’s fees, salaries, allowances, bonuses, options and benefits-in-kind;
(b) proposing to the Board appropriate and meaningful measures for assessing the executive Directors’ performance; and(c) considering the eligibility of Directors for benefits under long-term incentive schemes.
In carrying out the above, the RC may obtain independent external legal and other professional advice as it deems necessary. The expenses of suchadvice shall be borne by the Company.
The Company sets remuneration packages which are competitive and sufficient to attract, retain and motivate Directors and senior managementwith adequate experience and expertise to manage the business and operations of the Group. The remuneration paid and payable to the Directors,executive officers and employees related to Directors or the CEO for services rendered during the financial year ended 31 December 2004 areas follows:
CORPORATE GOVERNANCE REPORT

Hi-P International Limited : annual report 2004 p.23
Remuneration Bands Salary Performance Director’s Others TotalBonus fees
% % % % %
Directors
S$500,000 and above
Yao Hsiao Tung 15 83 2 – 100
S$250,000 – S$500,000
Wong Huey Fang 62 28 10 – 100
Below S$250,000
Yeo Tiong Eng – – 100 – –Dr Tan Khee Giap – – 100 – –Wong Meng Meng – – 100 – –Chester Lin Chien – – 100 – –
Remuneration Bands Salary Performance Others TotalBonus
% % % %
Executive Officers
S$500,001 – S$750,000
Gerhard J. Zebe 57 33 10 100
S$250,000 – S$500,000
Philip Tan Tor Howe 70 30 – 100Gary Ho Hock Yong 56 36 8 100Ang Lien Peng 65 31 4 100Chan Hean Wee 69 22 9 100Lee Kam Choon 67 26 7 100
Employees related to Directorsor the CEO
Exceeding S$150,000
Niece of Yao Hsiao Tung / 60 20 20 100Niece-in-law of Wong Huey Fang
The remuneration of the non-executive and independent Directors is in the form of a fixed fee. The remuneration of the non-executive and independentDirectors will be subject to approval at the AGM.
The Executive Chairman and CEO has a service agreement with the Company. His compensation consists of salary, bonus and performance awardthat is dependent on the Group’s performance.
Save for as mentioned above, none of the employees who are immediate family members of a Director receives remuneration exceeding S$150,000during the year.
CORPORATE GOVERNANCE REPORT
p.24
The Company has a share option scheme known as the Hi-P Employee Share Option Scheme (the “ESOS”) which was approved by shareholders of theCompany on 7 October 2003. The ESOS complies with the relevant rules as set out in Chapter 8 of the Listing Manual. The ESOS will provide eligibleparticipants with an opportunity to participate in the equity of the Company and to motivate them towards better performance through increased dedicationand loyalty. The ESOS is administered by the RC. Further information on the share option scheme can be found on pages 33 and 69 of the Annual Report.
Audit Committee (“AC”)
Principle 11: Audit Committee
The AC comprises Mr Wong Meng Meng, Dr Tan Khee Giap and Mr Yeo Tiong Eng. The Chairman of the AC is Mr Wong Meng Meng.
The Board has approved the written terms of reference of the AC. Its functions are as follows:-
(a) reviewing and evaluating financial and operating results and accounting policies;(b) reviewing audit plan of external auditors, their evaluation of the system of internal accounting controls and their audit report;(c) reviewing the Group’s financial results and the announcements before submission to the Board for approval;(d) reviewing the assistance given by the management to external auditors;(e) considering the appointment/ re-appointment of external auditors;(f) reviewing interested person transactions; and(g) other functions as required by law or the Code.
The AC meets regularly and also holds informal meetings and discussions with the management from time to time. The AC has full discretion toinvite any Director or executive officer to attend its meetings.
The AC has been given full access to and is provided with the cooperation of the Company’s management. In addition, the AC has independentaccess to the external auditors. The AC meets with the external auditors without the presence of management to review matters that might beraised privately. The AC has reasonable resources to enable it to discharge its functions properly.
The AC has reviewed the volume of non-audit services to the Group by the external auditors, and being satisfied that the nature and extent of suchservices will not prejudice the independence and objectivity of the external auditors, is pleased to recommend their re-appointment.
Principle 12: Internal Controls
The Group’s internal controls and systems are designed to provide reasonable, but not absolute assurance to the integrity and reliability of thefinancial information and to safeguard and maintain the accountability of the assets.
The Board believes that, in the absence of any evidence to the contrary, the system of internal controls maintained by the Group’s management andthat was in place throughout the year and up to the date of this Report, is adequate to meet the needs of the Group in its current businessenvironment.
Principle 13: Internal Audit
The internal audit function has been outsourced to Messrs PricewaterhouseCoopers (“internal audit managers”) with effect from 11 January 2005.The internal audit function will report directly to the AC on audit matters and to the CEO on administrative matters.
The objective of the internal audit function is to provide independent and reasonable assurance to the AC and management that the Group’s riskmanagement, controls and governance processes are adequate and effective.
The AC will review with the internal audit managers their audit plans, their evaluation of the system of internal controls, their audit findings andmanagement’s responses to those findings; the effectiveness of material internal controls, including financial, operational and compliance controlsand overall risk management of the Company and the Group; and the adequacy of the internal audit function.
CORPORATE GOVERNANCE REPORT

Hi-P International Limited : annual report 2004 p.25
Communication with Shareholders
Principle 10: Accountability and AuditPrinciple 14: Communication with ShareholdersPrinciple 15: Greater Shareholder Participation
The Company recognizes that effective communication can highlight transparency and enhance accountability to its shareholders. The Companyprovides information to its shareholders via SGXNET announcements, news releases and the Company’s website. Price-sensitive information ispublicly released on an immediate basis where required under the Listing Manual. Where an immediate announcement is not possible, theannouncement is made as soon as possible to ensure that shareholders and the public have a fair access to the information.
The AGM of the Company is a principal forum for dialogue and interaction with all shareholders. All shareholders will receive the Annual Report andthe notice of AGM. At the AGM, shareholders will be given the opportunity to voice their views and to direct questions regarding the Group to theDirectors including the chairpersons of each of the Board committees. The external auditors are also present to assist the Directors in addressingany relevant queries from the shareholders.
The Company ensures that there are separate resolutions at general meetings on each distinct issue.
The Company’s Articles of Association allow a member of the Company to appoint one or two proxies to attend and vote at general meetings.
Risk Management(Listing Manual Rule 1207(4)(d))
The Company does not have a Risk Management Committee. However, the management regularly reviews the Company’s business and operationalactivities to identify areas of significant business risks as well as appropriate measures to control and mitigate these risks. The managementreviews all significant control policies and procedures and highlights all significant matters to the Directors and the AC.
Securities Transactions(Listing Manual Rule 710(2)(b))
The Group has adopted the SGX-ST’s Best Practices Guide with respect to dealings in securities by the Directors and its executive officers. Directors,management and officers of the Group who have access to price-sensitive, financial or confidential information are not permitted to deal in theCompany’s shares during the periods commencing two weeks before the announcement of the Company’s financial statements for each of the firstthree quarters of its financial year, or one month before the announcement of the Company’s financial statement for the financial year end, as thecase may be, and ending on the date of announcements of relevant results, or when they are in possession of unpublished price-sensitive informationon the Group. To provide further guidance to employees on dealings in the Company’s shares, the Company has adopted a code of conduct ontransactions in the Company’s shares. The code of conduct is modeled after the Best Practices Guide with some modifications.
Material Contracts(Listing Manual Rule 1207(8))
Save for the service agreement between Mr Yao Hsiao Tung and the Company, there were no material contracts of the Company or its subsidiariesinvolving the interest of the chief executive officer or any Director or controlling shareholders subsisting at the end of the financial year ended 2004.
CORPORATE GOVERNANCE REPORT

p.26
Interested Person Transactions(Listing Manual Rule 907)
The Company has established procedures to ensure that all transactions with interested persons are reported on a timely manner to the AC and thatthe transactions are carried out on normal commercial terms and will not be prejudicial to the interests of the Company and its minority shareholders.
The aggregate value of interested person transactions entered into during the financial year under review is as follows:
Name of interested person Aggregate value of all interested person Aggregate value of all interestedtransactions during the financial year person transactions conductedunder review (excluding transactions under shareholders’ mandate
less than $100,000 and transactions pursuant to Rule 920conducted under shareholders’ (excluding transactionsmandate pursuant to Rule 920) less than $100,000)
Molex Incorporated andits group of companies- Sales S$1,018,383 N.A.- Purchases S$1,445,140 N.A.
Wong Partnership andClifford Chance Wong Pte Ltd- Fees paid for professional S$101,000 N.A.
legal services rendered
Best Practices Guide
The Company has complied with the Best Practices Guide issued by SGX-ST.
CORPORATE GOVERNANCE REPORT

Hi-P International Limited : annual report 2004 p.27
MANAGEMENT’S DISCUSSION AND ANALYSIS OFFINANCIAL CONDITION AND RESULTS OF OPERATIONS
REVIEW OF RESULTS OF OPERATIONS
Revenue
Our revenue increased by approximately $312.0 million or 125.3% from $248.9 million in FY2003 to $560.9 million in FY2004. In terms of businessactivity, the significant increase in revenue was due mainly to the increase in sales from all our business segments i.e. Precision Plastic InjectionMolding (PPIM), Mold Design and Fabrication (MDF) and Assembly.
Revenue derived from our PPIM division improved significantly by approximately $143.4 million or 137.0% from $104.7 million in FY2003 to $248.1million in FY2004. The increase was primarily accounted for by existing customers such as Braun, Haier, Motorola, Siemens, ZTE and a customer inthe data storage industry and was mainly due to increased orders for existing products or new projects. This was partially offset by the decrease insales to our existing customers, namely Maxtor, DBtel, Nokia and Phillips due to the completion of some of our existing projects or lower demandfrom these customers.
Revenue from our MDF division increased by approximately $8.9 million or 27.3%, from $32.6 million in FY2003 to $41.5 million in FY2004. Theincrease was due mainly to an increase in orders received from Motorola, Braun, Palm, Haier and Siemens. This was partially offset by the decreasein demand from other existing customers such as Maxtor, Nokia and ZTE.
Revenue from our Assembly division increased by approximately $159.7 million or 143.0%, from $111.6 million in FY2003 to $271.3 million inFY2004. The increase was due mainly to the higher sales to Braun, Motorola and Siemens. This was partially offset by the decrease in sales to ZTEdue to the completion of some of the existing projects.
By geographical markets, the increase in Group revenue was due mainly to higher sales to our customers in the PRC, Europe, Singapore and theUnited States. Sales to our customers in the PRC increased by approximately $153.4 million or 112.2%, from $136.8 million in FY 2003 to $290.2million in FY2004. The increase was primarily attributable to Motorola, Siemens, Haier, Capitel and Kodak, and was partially offset by a decrease toother existing customers such as Braun, DBtel, ZTE and Nokia.
Sales to our customers in Europe increased by approximately $109.2 million or 233.0%, from $46.9 million in FY2003 to $156.1 million in FY2004.The increase was mainly attributed to higher sales to our existing customer, Braun, in all three activities.
Sales to our customers in Singapore increased by approximately $47.3 million or 144.4%, from $32.8 million in FY2003 to $80.1 million in FY2004.The increase was mainly attributed to higher sales to Motorola, a customer in the data storage industry and Baxter, and was partially offset by adecrease to Maxtor, an existing customer.
Sales to our customers in the United States increased by approximately $3.6 million or 17.5%, from $21.0 million in FY2003 to $24.6 million inFY2004. The increase was mainly attributed to higher sales to Motorola and MEI, and was partially offset by a decrease to our other existingcustomer, Phillips.
By industry, the increase in revenue was mainly contributed by our customers operating in the telecommunications, consumer electronics andelectrical and data storage industries.
Revenue to our customers operating in the telecommunications industry increased by approximately $200.6 million or 174.8% from $114.8 millionin FY2003 to $315.4 million in FY2004. The increase was due mainly to a significant increase in sales to our existing customers Motorola, Siemens,Haier and Capitel. This was partially offset by lower sales to ITT, Nokia and DBtel.
Revenue to our customers operating in the consumer electronics and electrical industry increased by approximately $104.4 million or 108.7% from$96.1 million in FY2003 to $200.5 million in FY2004. The increase was due mainly to increased sales to existing customers Braun, Kodak and MEI.This was partially offset by lower sales to Phillips.

p.28
Revenue (Cont’d)
Revenue to our customers operating in the data storage industry increased by approximately $5.1 million or 15.2%, from $33.3 million in FY2003 to$38.4 million in FY2004. The increase was due mainly to increased sales to an existing customer, and partially offset by lower sales to Maxtor.
Cost of Sales
Our cost of sales increased by approximately $237.9 million or 129.9%, from $183.1 million in FY2003 to $421.0 million in FY2004. Cost of sales asa percentage of revenue increased marginally from approximately 73.6% in FY2003 to 75.0% in FY2004. The percentage increase in cost of saleswas attributed to higher material costs as a percentage of sales.
Material costs increased by approximately $172.2 million or 149.3% from $115.3 million in FY2003 to $287.5 million in FY2004. The increase inmaterial costs as a percentage of revenue from 46.3% in FY2003 to 51.3% in FY2004 was due primarily to the increase in sales contributed by ourAssembly division which generally requires higher material content.
Labour costs increased by approximately $21.4 million or 76.9%, from $27.9 million in FY2003 to $49.3 million in FY2004. The increase was duemainly to an increase in headcount in FY2004 and more labour hours which were required to meet the increase in production as well as salaryincrements. Labour costs as a percentage of revenue however decreased from approximately 11.2% in FY2003 to 8.8% in FY2004 arising primarilyfrom the increase in sales contribution by our Assembly and PPIM divisions, which generally have a lower labour costs to revenue percentage.
Overhead costs increased by approximately $44.2 million or 110.9%, from $39.9 million in FY2003 to $84.1 million in FY2004. The increase inoverhead was mainly attributed to the increase in utilities, freight charges, factory supplies, depreciation, sales tax (4% non-refundable VAT forexport sales), stock obsolescence and physical inventory written off of $3.3 million, $3.7 million, $18.0 million, $4.7 million, $8.3 million, $4.4 millionand $1.7 million respectively. Overhead costs as a percentage of revenue decreased from 16.0% in FY2003 to 15.0% in FY2004 arising primarilyfrom the increase in sales contribution from our Assembly and PPIM divisions, which generally have a lower overhead costs to revenue percentage.
Gross Profit
Our gross profit increased by approximately $74.1 million or 112.5% from $65.8 million in FY2003 to $139.9 million in FY2004. The increase was inline with the increase in revenue, and was partially offset by the overall decrease in gross profit margins.
Gross profit margins decreased from 26.4% in FY2003 to 24.9% in FY2004 mainly as a result of higher material costs included in cost of sales dueto higher Assembly activities.
Operating Expenses
Our total operating expenses increased by approximately $23.6 million or 93.1% from $25.4 million in FY2003 to $49.0 million in FY2004. Operatingexpenses as a percentage of revenue decreased from 10.2% in FY2003 to 8.7% in FY2004 as a result of economies of scale.
Our administrative expenses increased by approximately $22.4 million or 99.6% from $22.4 million in FY2003 to $44.8 million in FY2004. Theincrease was mainly due to the increase in personnel related costs, depreciation and provision for doubtful debts by $13.0 million, $1.4 million and$5.8 million respectively. The increase in personnel related costs was due mainly to an increase in headcount and annual salary increments and wasin line with the increase in revenue. The Company has been strengthening its technical and management team especially in program management,quality control, materials and operations. The increase in depreciation expense was due mainly to our expansion in China. The increase in provisionfor doubtful debts was mainly attributed to PRC customers.
Our selling expenses increased by approximately $1.3 million or 43.4% from $2.9 million in FY2003 to $4.2 million in FY2004. The increase wasmainly due to the increase in staff costs to meet expanding business needs.
MANAGEMENT’S DISCUSSION AND ANALYSIS OFFINANCIAL CONDITION AND RESULTS OF OPERATIONS

Hi-P International Limited : annual report 2004 p.29
Other Operating Income
Our other operating income increased by approximately $1.1 million or 45.4%, from $2.5 million in FY2003 to $3.6 million in FY2004 due mainly tothe increase in sales of scrap, as a result of higher revenue.
Profit from Operations
Our profit from operations increased significantly by approximately $51.6 million or 120.0% from $42.9 million in FY2003 to $94.5 million in FY2004.The increase in profit from operations was attributable to the increase in gross profit of $74.1 million and other operating income of $1.1 million,partially offset by a $23.6 million increase in operating expenses. Operating profit margin decreased from 17.3% in FY2003 to 16.9% in FY2004 asa result of lower gross profit margin, partly offset by the lower operating expenses as a percentage of revenue.
Financial Income / Expenses and Foreign Exchange Gain / Loss, Net
Our net financial expenses decreased by approximately $0.8 million or 45.3% from $1.8 million in FY2003 to $1.0 million in FY2004 due mainly to thedecrease in total bank borrowings and lease obligations by $25.0 million or 53.1% from $47.1 million as at 31 December 2003 to $22.1 million as at31 December 2004.
Our foreign exchange loss increased by approximately $0.2 million or 19.8% from $1.3 million in FY2003 to $1.5 million in FY2004. The increase wasmainly attributed to our China operations which reported an exchange loss of $0.9 million in FY2003 versus an exchange loss of $2.2 million inFY2004, as a result of higher depreciation of the USD against the SGD, Euro and JPY during FY2004. On the other hand, Hi-P Singapore registereda $0.3 million loss in FY2003 versus a $0.8 million gain in FY2004 on the back of the depreciation of the USD against SGD during FY2004.
Profit Before Taxation and Share of Results of Associated Companies
Our profit before tax and share of results of associated companies increased by approximately $52.1 million or 130.5%, from $39.9 million in FY2003to $92.0 million in FY2004. The increase was due mainly to the significant increase in revenue and gross profit, which were partially offset by theincrease in operating expenses.
Tax
Our tax charge for FY2004 was approximately $3.1 million as compared to $2.9 million in FY2003 due mainly to higher profit before tax. However, oureffective tax rate declined from 7.2% in FY2003 to 3.4% in FY2004 mainly due to the increase in profit contribution from certain PRC subsidiarieswhose profits were entitled to full tax exemption in FY2004.
LIQUIDITY AND CAPITAL RESOURCES
In FY2004, we generated net cash from operating activities before working capital changes of approximately $119.3 million. Cash utilised forworking capital purposes amounted to $52.9 million due mainly to an increase in inventories, trade receivables, other receivables, deposits andprepayments, and decrease in other payables and accruals, and amounts due to related parties (trade) of $38.6 million, $57.4 million, $1.2 million,$2.1 million and $0.9 million respectively. This was partially offset by an increase in trade payables and decrease in notes receivable amounting to$46.8 million and $ 0.4 million respectively. We also made dividend payments and income tax payments of $4.8 million and $4.2 million respectively,resulting in net cash generated from operating activities of approximately $57.5 million.
Net cash used in investing activities amounted to approximately $56.3 million due mainly to our purchase of fixed assets of $59.8 million, partiallyoffset by proceeds from disposal of fixed assets and interest income of approximately $3.2 million and $0.3 million respectively.
We recorded net cash outflow of $25.1 million from our financing activities due mainly to repayment of bank term loans, short-term bank loans andlease obligations amounting to $9.5 million, $9.6 million and $4.8 million. In addition, interest expense paid amounted to $1.3 million.
MANAGEMENT’S DISCUSSION AND ANALYSIS OFFINANCIAL CONDITION AND RESULTS OF OPERATIONS

p.30
REVIEW OF FINANCIAL POSITION
Fixed Assets
Our fixed assets comprise factory buildings, leasehold improvements, construction-in-progress, renovations, plant and machinery, furniture andfittings, office equipment and motor vehicles.
Our fixed assets increased by approximately $35.1 million or 26.2% from $133.9 million as at 31 December 2003 to $169.0 million as at 31December 2004 due mainly to the additions in fixed assets of $63.2 million.
Fixed assets additions comprised mainly of investments in leasehold improvements amounting to approximately $0.5 million, machines undercommissioning of $5.6 million, renovations of $4.6 million, plant and machinery of $48.6 million, computer equipment of $3.4 million and officeequipment, furniture and fittings of $0.5 million. During FY2004, new machines were purchased to support the expansion of operations in Hi-PInternational, Hi-P Shanghai Housing Appliance, Hi-P Shanghai Plastic, Hi-P Tianjin Electronics, Hi-P Shanghai Industries, Hi-P Shanghai Mold &Die, Hi-P Chengdu Plastic, Hi-P Suzhou Technology and Hi-P Xiamen. In addition, machines were acquired for the newly incorporated sites namely;Hi-P Suzhou Electronics, Hi-P Tianjin Technology and Hi-P Shanghai Technology. The increase in office equipment, furniture and fittings was mainlyattributed to Hi-P Shanghai Housing Appliance. The increase in computer equipment was mainly attributed to Hi-P International, Hi-P ShanghaiHousing Appliance, Hi-P Tianjin Technology, Hi-P Suzhou Technology, Hi-P Suzhou Electronics and Hi-P Shanghai Mold & Die. The increase inrenovations was mainly attributed to Hi-P Shanghai Housing Appliance, Hi-P Tianjin, Hi-P Suzhou Technology and Hi-P Suzhou Electronics. Theincrease in leasehold improvements was mainly related to Hi-P International, Hi-P Suzhou Technology and Hi-P Suzhou Electronics.
Current Assets
Our current assets increased by approximately $65.1 million or 31.5% from $206.7 million as at 31 December 2003 to $271.9 million as at 31December 2004. The increase was due mainly to increase in inventories, trade receivables, other receivables, deposits and prepayments, amountsdue from related parties (trade) and fixed deposits, partially offset by the decrease in notes receivable and cash and bank balance. Inventoriesincreased by $35.6 million or 144.4% from $24.7 million as at 31 December 2003 to $60.3 million as at 31 December 2004. Trade receivablesincreased by $52.1 million or 103.2% from $50.5 million as at 31 December 2003 to $102.6 million as at 31 December 2004. The increase ininventories and trade receivables was in line with the increase in revenue. Average inventory turnover had shortened from 38 days to 36 days for theyear ended 31 December 2004. Average receivables turnover had shortened from 62 days to 49 days for the year ended 31 December 2004. Otherreceivables, deposits and prepayments increased by $1.2 million or 7.3% from $16.3 million as at 31 December 2003 to $17.5 million as at 31December 2004. Amounts due from related parties (trade) increased by $1.7 million or 217.7% from $0.8 million as at 31 December 2003 to $2.5million as at 31 December 2004 due mainly to higher sales to Haier in FY2004. Notes receivable decreased by $0.4 million or 30.8%, from $1.2million as at 31 December 2003 to $0.8 million as at 31 December 2004 due mainly to factoring of notes receivable. Cash at bank decreased by $65.1million or 57.5%, from $113.2 million as at 31 December 2003 to $48.1 million as at 31 December 2004 due mainly to transfer to fixed deposits.
Current Liabilities
Our current liabilities increased by approximately $42.4 million or 34.8% from $121.9 million as at 31 December 2003 to $164.3 million as at31 December 2004. The increase was due mainly to the increase in trade payables, other payables and accruals, amounts due to related parties (trade)and the current portion of bank term loans, partly offset by the decrease in short term bank loans, bank overdrafts, provision for taxation and the currentportion of lease liabilities. Trade payables increased by $46.9 million or 92.3% from $50.7 million as at 31 December 2003 to $97.6 million as at 31December 2004. The increase was a result of higher inventory purchases to meet production requirements towards the last quarter of the financialyear. Other payables and accruals increased by $1.4 million or 3.0% from $45.5 million as at 31 December 2003 to $46.9 million as at31 December 2004. Bank term loans increased by $7.6 million or 303.7% from $2.5 million as at 31 December 2003 to $10.1 million as at31 December 2004 due mainly to transfers from the non-current protion of the loan. The provision for taxation decreased by $0.7 million or 27.9%from $2.5 million as at 31 December 2003 to $1.8 million as at 31 December 2004 due to lower profits at taxable plants.
MANAGEMENT’S DISCUSSION AND ANALYSIS OFFINANCIAL CONDITION AND RESULTS OF OPERATIONS

Hi-P International Limited : annual report 2004 p.31
Current Liabilities (Cont’d)
Lease obligations decreased by approximately $3.0 million or 61.3% from $4.9 million as at 31 December 2003 to $1.9 million as at 31 December2004, due to repayment of certain lease liabilities. Short term loans decreased by $9.6 million or 66.2% from $14.5 million as at 31 December 2003to $4.9 million as at 31 December 2004 due mainly to repayment of certain short term loans. Bank overdrafts decreased by $1.2 million or 100.0%from $1.2 million as at 31 December 2003 to nil as at 31 December 2004 due to repayment made.
Non-current Liabilities
Non-current liabilities decreased by approximately $18.9 million or 70.4% from $26.8 million as at 31 December 2003 to $7.9 million as at31 December 2004. The decrease was due mainly to repayment of lease obligations and the transfer of term loans to short term loans. Leaseobligations decreased by approximately $1.8 million or 75.6% from $2.4 million as at 31 December 2003 to $0.6 million as at 31 December 2004.Bank term loans decreased by approximately $17.1 million or 78.9% from $21.7 million as at 31 December 2003 to $4.6 million as at31 December 2004.
Shareholders’ Equity
Shareholders’ equity increased by approximately $77.6 million or 40.6% from $191.4 million as at 31 December 2003 to $269.0 million as at31 December 2004. The increase was mainly due to net profit attributable to shareholders of $88.1 million for FY2004. This was partially offset bythe decrease in translation reserve of approximately $7.7 million. The accumulated profits took into account the deduction of dividend payments of$3.5 million.
MANAGEMENT’S DISCUSSION AND ANALYSIS OFFINANCIAL CONDITION AND RESULTS OF OPERATIONS

p.32
DIRECTORS’ REPORT
The directors are pleased to present their report to the members together with the audited consolidated financial statements of Hi-P InternationalLimited (“the Company”) and its subsidiaries (“the Group”) for the financial year ended 31 December 2004 and the balance sheet of the Company asat 31 December 2004.
Directors
The directors of the Company in office at the date of this report are:
Yao Hsiao Tung (Chairman and Chief Executive Officer)Wong Huey FangYeo Tiong EngDr Tan Khee GiapWong Meng MengChester Lin Chien (appointed on 4 August 2004)
Arrangements to enable directors to acquire shares and debentures
Neither at the end of nor at any time during the financial year, was the Company a party to any arrangement whose objective was to enable thedirectors of the Company to acquire benefits by means of the acquisition of shares or debentures of the Company or any other corporations.
Directors’ interests in shares and debentures
The following directors, who held office at the end of the financial year, had, according to the register of directors’ shareholdings required to be keptunder Section 164 of the Companies Act, an interest in shares of the Company and related corporations, as stated below:
Direct interest as at Deemed interest as at1 January 2004 or 1 January 2004 or
date of appointment 31 December 2004 date of appointment 31 December 2004
Hi-P International LimitedOrdinary shares of $0.05 each
Yao Hsiao Tung 492,485,200 489,029,200 – –Wong Huey Fang – – 492,485,200 489,029,200Yeo Tiong Eng 400,000 400,000 – –Dr Tan Khee Giap 550,000 550,000 – –Wong Meng Meng 500,000 500,000 – –Chester Lin Chien 1,000,000 1,000,000 – –
Save for Mr Yao Hsiao Tung who holds 486,955,600 shares as at 21 January 2005, there was no change in any of the above-mentioned interestsbetween the end of the financial year and 21 January 2005.
By virtue of Section 7 of the Companies Act, Mr Yao Hsiao Tung is deemed to have an interest in the shares held by the Company in allits subsidiaries.
Except as disclosed in this report, no director who held office at the end of the financial year had interests in any shares, share options or debentures ofthe Company, or of related corporations, either at the beginning of the financial year, or date of appointment if later, or at the end of the financial year.

Hi-P International Limited : annual report 2004 p.33
Directors’ contractual benefits
Since the end of the previous financial year, no director of the Company has received or become entitled to receive a benefit (other than as disclosedas directors’ remuneration and fees in the accompanying financial statements or remuneration and benefits pursuant to the terms of the ServiceAgreement with Mr Yao Hsiao Tung included in the aggregate amount of emoluments shown in the financial statements, or any emolumentsreceived from a related corporation) by reason of a contract made by the Company or a related corporation with the director, or with a firm of whichthe director is a member, or with a company in which the director has a substantial financial interest.
Share options
The Hi-P Employee Share Option Scheme (“the Option Scheme”) was approved and adopted at the Company’s Extraordinary General Meeting heldon 7 October 2003. The Option Scheme applies to executive directors, employees of the Group, controlling shareholders and their associates. TheOption Scheme is administered by the Remuneration Committee, comprising Messrs Wong Meng Meng (Chairman), Yao Hsiao Tung and Dr TanKhee Giap.
Other information regarding the Option Scheme is set out below:
(i) The exercise price of the options is determined at the average of the last dealt price for the Company’s shares on the Singapore ExchangeSecurities Trading Limited (SGX-ST) on the five business days immediately preceding the date of grant of such options.
(ii) 50% of the options vest one year after the grant date, and the remaining 50% vest two years after the grant date.
(iii) The options expire 8 years after the grant date, unless they have been cancelled or have lapsed prior to that date.
At the end of the financial year, details of the options granted under the Option Scheme on the unissued ordinary shares of $0.05 each of theCompany are as follows:
Options OptionsExercise outstanding Options outstanding
Date of grant price as at Options cancelled/ as at 31 Exerciseof options per share 1 January 2004 granted lapsed December 2004 period
19/7/2004 $1.39 – 4,230,000 (221,000) 4,099,000 20/7/2005 to 19/7/201222/11/2004 $1.73 – 130,000 – 130,000 22/11/2005 to 21/11/2012
There were no options exercised during the financial year.
Except as disclosed above, there were no unissued shares of the Company or its subsidiaries under options granted by the Company or its subsidiariesas at the end of the financial year.
DIRECTORS’ REPORT

p.34
Share options (cont’d)
Details of Options granted to directors of the Company under the Option Scheme
Aggregate options Aggregate optionsgranted since exercised since
Options granted for commencement of commencement of Aggregate optionsfinancial year ended Option Scheme to Option Scheme to outstanding as at
Name of Directors 31 December 2004 31 December 2004 31 December 2004 31 December 2004
Yao Hsiao Tung 1,300,000 1,300,000 – 1,300,000Wong Huey Fang 300,000 300,000 – 300,000
Except as disclosed above, since the commencement of the Option Scheme, no options have been granted to the controlling shareholders of theCompany or their associates and no participant under the Option Scheme has been granted 5% or more of the total options available under theOption Scheme.
The options granted by the Company do not entitle the holders of the options by virtue of such holding, to any rights to participate in any share issueof any other company.
Audit committee
The Audit Committee performed the functions specified in the Companies Act. The functions performed are detailed in the Report onCorporate Governance.
Auditors
Ernst & Young have expressed their willingness to accept reappointment as auditors.
On behalf of the board of directors,
Yao Hsiao TungChairman and Chief Executive Officer
Yeo Tiong EngDirector
16 March 2005
DIRECTORS’ REPORT

Hi-P International Limited : annual report 2004 p.35
STATEMENT BY DIRECTORS
We, Yao Hsiao Tung and Yeo Tiong Eng, being two of the directors of Hi-P International Limited, do hereby state that, in the opinion of the directors,
(i) the accompanying balance sheets, consolidated profit and loss account, consolidated statement of changes in equity and consolidated cashflow statement together with notes thereto are drawn up so as to give a true and fair view of the state of affairs of the Company and of theGroup as at 31 December 2004 and of the results of the business, changes in equity and cash flows of the Group for the year then ended, and
(ii) at the date of this statement there are reasonable grounds to believe that the Company will be able to pay its debts as and when they fall due.
On behalf of the board of directors,
Yao Hsiao TungChairman and Chief Executive Officer
Yeo Tiong EngDirector
16 March 2005
p.36
AUDITORS’ REPORT TO THE MEMBERS OFHi-P INTERNATIONAL LIMITED AND SUBSIDIARIES
We have audited the financial statements of Hi-P International Limited (“the Company”) and its subsidiaries (“the Group”) for the year ended31 December 2004 set out on pages 37 to 77. These financial statements are the responsibility of the Company’s directors. Our responsibility is toexpress an opinion on these financial statements based on our audit.
We conducted our audit in accordance with Singapore Standards on Auditing. Those Standards require that we plan and perform the audit to obtainreasonable assurance about whether the financial statements are free of material misstatement. An audit includes examining, on a test basis,evidence supporting the amounts and disclosures in the financial statements. An audit also includes assessing the accounting principles used andsignificant estimates made by the directors, as well as evaluating the overall financial statement presentation. We believe that our audit providesa reasonable basis for our opinion.
In our opinion,
(a) the consolidated financial statements of the Group and the balance sheet of the Company are properly drawn up in accordance with theprovisions of the Companies Act (“the Act”) and Singapore Financial Reporting Standards so as to give a true and fair view of the state of affairsof the Group and of the Company as at 31 December 2004 and the results, changes in equity and cash flows of the Group for the financial yearended on that date; and
(b) the accounting and other records required by the Act to be kept by the Company and by those subsidiaries incorporated in Singapore of whichwe are the auditors have been properly kept in accordance with the provisions of the Act.
ERNST & YOUNGCertified Public Accountants
Singapore16 March 2005
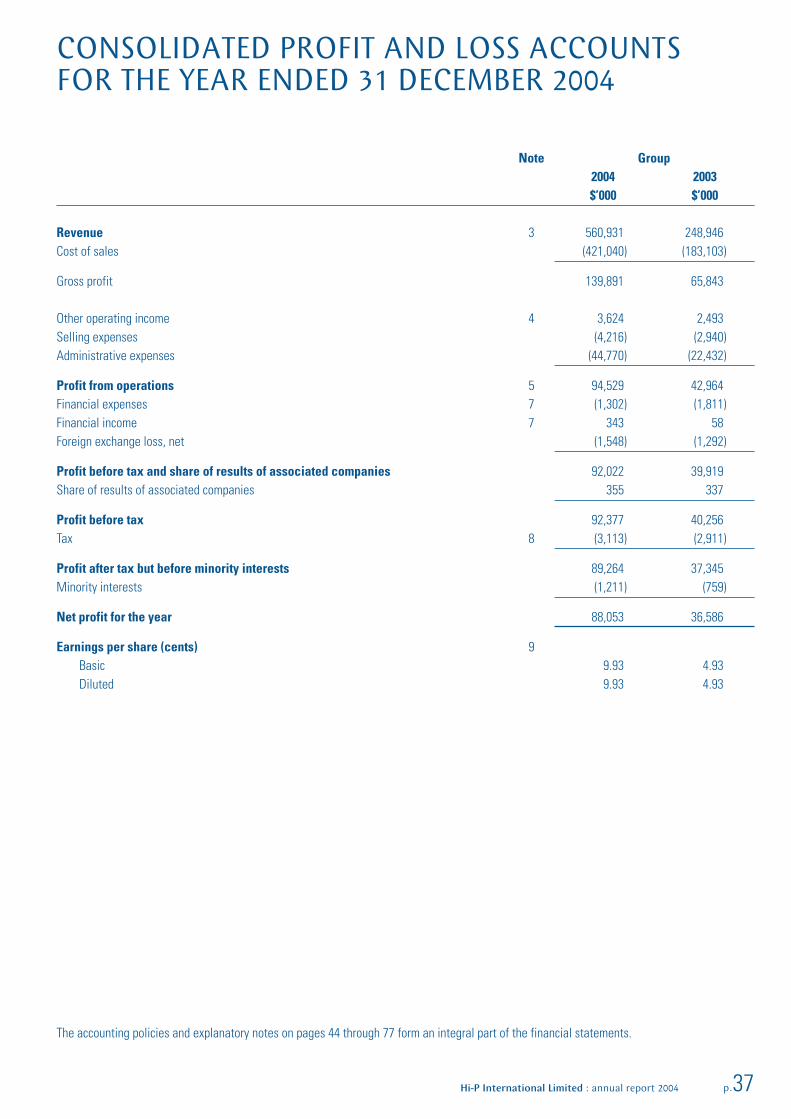
Hi-P International Limited : annual report 2004 p.37
Note Group2004 2003$’000 $’000
Revenue 3 560,931 248,946Cost of sales (421,040) (183,103)
Gross profit 139,891 65,843
Other operating income 4 3,624 2,493Selling expenses (4,216) (2,940)Administrative expenses (44,770) (22,432)
Profit from operations 5 94,529 42,964Financial expenses 7 (1,302) (1,811)Financial income 7 343 58Foreign exchange loss, net (1,548) (1,292)
Profit before tax and share of results of associated companies 92,022 39,919Share of results of associated companies 355 337
Profit before tax 92,377 40,256Tax 8 (3,113) (2,911)
Profit after tax but before minority interests 89,264 37,345Minority interests (1,211) (759)
Net profit for the year 88,053 36,586
Earnings per share (cents) 9Basic 9.93 4.93Diluted 9.93 4.93
CONSOLIDATED PROFIT AND LOSS ACCOUNTSFOR THE YEAR ENDED 31 DECEMBER 2004
The accounting policies and explanatory notes on pages 44 through 77 form an integral part of the financial statements.

p.38
Note Group Company2004 2003 2004 2003$’000 $’000 $’000 $’000
Non-current assetsFixed assets 10 168,965 133,895 22,205 22,166Investment in subsidiaries 11 - - 58,345 50,735Investment in associated companies 12 2,073 1,805 903 903Other non-current asset 13 12 12 12 12Deferred expenditure 14 514 - 514 -
Current assetsInventories 15 60,278 24,668 3,453 3,444Trade receivables 16 102,591 50,487 10,396 7,631Notes receivable 17 840 1,214 - -Other receivables, deposits and prepayments 18 17,500 16,304 308 408Amounts due from subsidiaries (non-trade) 19 - - 46,305 10,977Amounts due from subsidiaries (trade) - - 230 94Amounts due from related parties (trade) 2,481 781 - -Cash and bank balances 48,128 113,227 15,723 80,053Fixed deposits 20 40,067 66 40,067 66
271,885 206,747 116,482 102,673
Current liabilitiesTrade payables 97,586 50,737 6,758 4,396Other payables and accruals 21 46,867 45,516 11,444 9,215Amounts due to subsidiaries (trade) - - 307 390Amount due to a subsidiaries (non-trade) 19 - - 31,186 40Amounts due to related parties (trade) 1,079 38 - -Lease obligations, current portion 22 1,879 4,861 1,442 4,337Provision for income tax 1,831 2,538 374 1,282Bank term loans, current portion 23 10,153 2,515 1,387 2,244Short-term bank loans 24 4,911 14,509 - 3,020Bank overdrafts (secured) 24 - 1,206 - 1,179
164,306 121,920 52,898 26,103
Net current assets 107,579 84,827 63,584 76,570
BALANCE SHEETSAS AT 31 DECEMBER 2004
The accounting policies and explanatory notes on pages 44 through 77 form an integral part of the financial statements.

Hi-P International Limited : annual report 2004 p.39
Note Group Company2004 2003 2004 2003$’000 $’000 $’000 $’000
Non-current liabilitiesLease obligations, non-current portion 22 577 2,368 406 1,768Bank term loans, non-current portion 23 4,574 21,666 694 5,937Deferred tax liability 25 2,774 2,774 2,774 2,774
271,218 193,731 141,689 139,907
EquityShare capital 27 44,350 44,350 44,350 44,350Share premium 75,041 75,041 75,041 75,041Capital reserve 812 37 775 -Reserve fund 28 16,044 9,313 - -Translation reserve (10,035) (2,339) - -Accumulated profits 29 142,761 64,962 21,523 20,516
268,973 191,364 141,689 139,907Minority interests 2,245 2,367 - -
271,218 193,731 141,689 139,907
BALANCE SHEETSAS AT 31 DECEMBER 2004
The accounting policies and explanatory notes on pages 44 through 77 form an integral part of the financial statements.
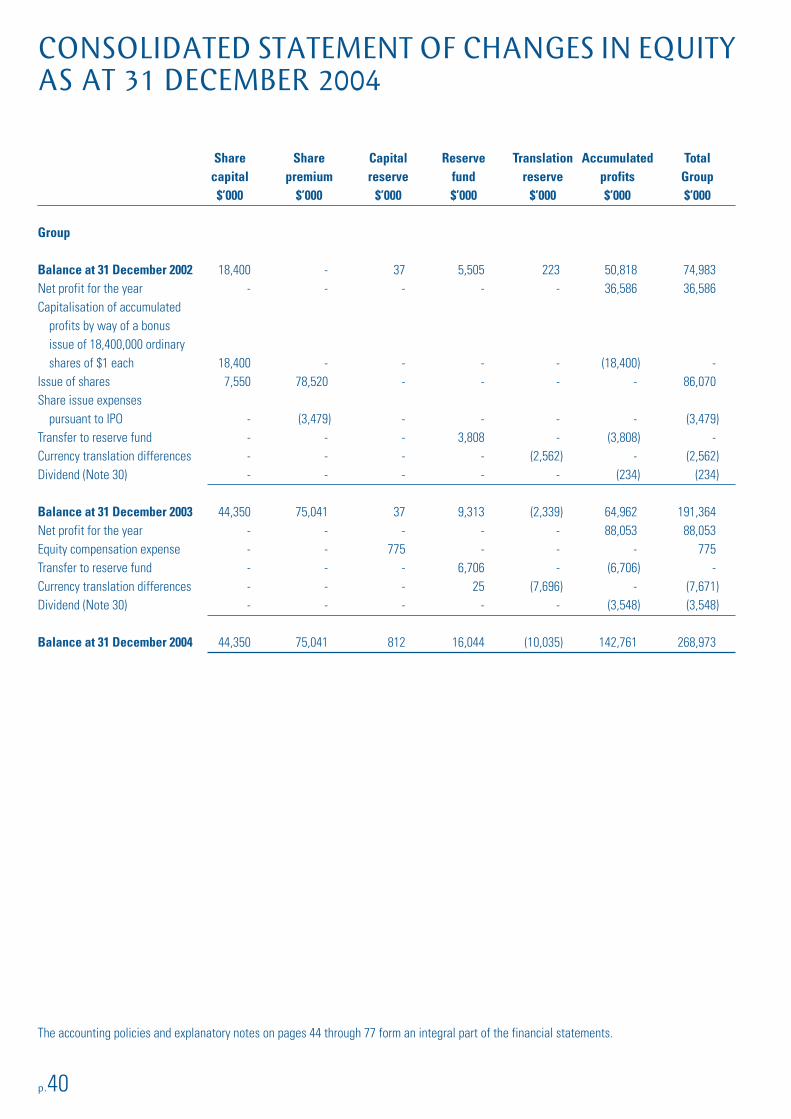
p.40
Share Share Capital Reserve Translation Accumulated Totalcapital premium reserve fund reserve profits Group$’000 $’000 $’000 $’000 $’000 $’000 $’000
Group
Balance at 31 December 2002 18,400 - 37 5,505 223 50,818 74,983Net profit for the year - - - - - 36,586 36,586Capitalisation of accumulated
profits by way of a bonusissue of 18,400,000 ordinaryshares of $1 each 18,400 - - - - (18,400) -
Issue of shares 7,550 78,520 - - - - 86,070Share issue expenses
pursuant to IPO - (3,479) - - - - (3,479)Transfer to reserve fund - - - 3,808 - (3,808) -Currency translation differences - - - - (2,562) - (2,562)Dividend (Note 30) - - - - - (234) (234)
Balance at 31 December 2003 44,350 75,041 37 9,313 (2,339) 64,962 191,364Net profit for the year - - - - - 88,053 88,053Equity compensation expense - - 775 - - - 775Transfer to reserve fund - - - 6,706 - (6,706) -Currency translation differences - - - 25 (7,696) - (7,671)Dividend (Note 30) - - - - - (3,548) (3,548)
Balance at 31 December 2004 44,350 75,041 812 16,044 (10,035) 142,761 268,973
CONSOLIDATED STATEMENT OF CHANGES IN EQUITYAS AT 31 DECEMBER 2004
The accounting policies and explanatory notes on pages 44 through 77 form an integral part of the financial statements.
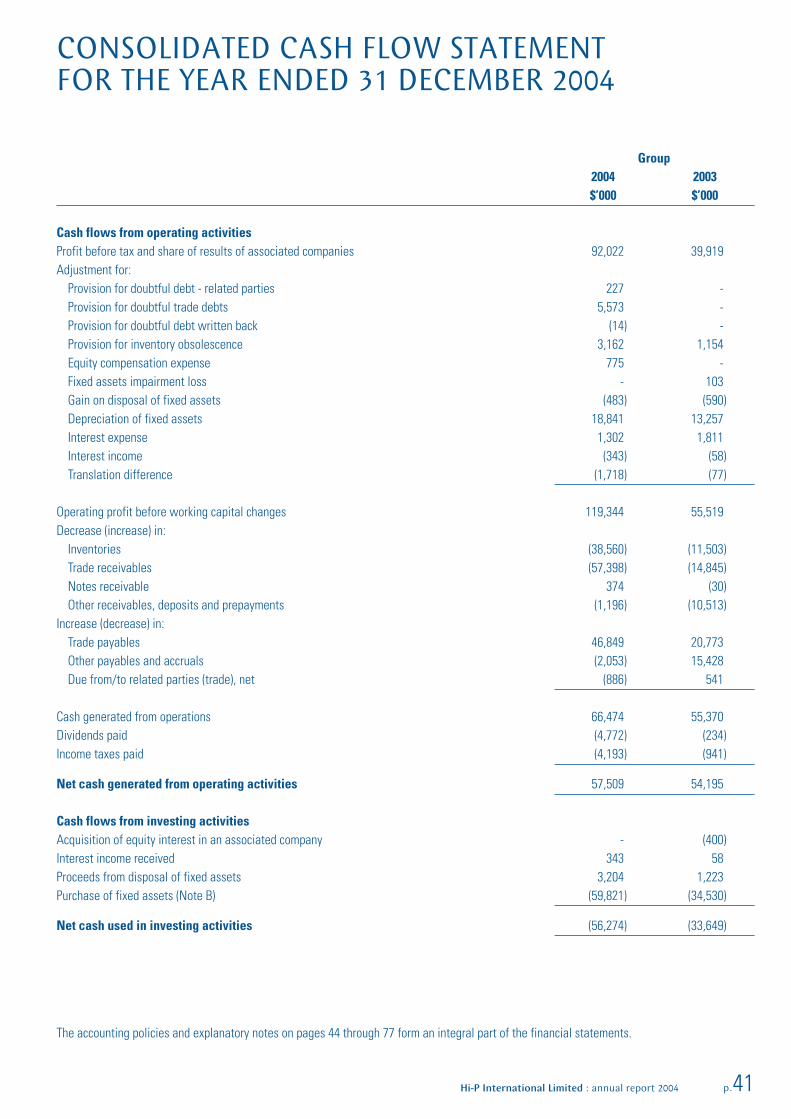
Hi-P International Limited : annual report 2004 p.41
Group2004 2003$’000 $’000
Cash flows from operating activitiesProfit before tax and share of results of associated companies 92,022 39,919Adjustment for:
Provision for doubtful debt - related parties 227 -Provision for doubtful trade debts 5,573 -Provision for doubtful debt written back (14) -Provision for inventory obsolescence 3,162 1,154Equity compensation expense 775 -Fixed assets impairment loss - 103Gain on disposal of fixed assets (483) (590)Depreciation of fixed assets 18,841 13,257Interest expense 1,302 1,811Interest income (343) (58)Translation difference (1,718) (77)
Operating profit before working capital changes 119,344 55,519Decrease (increase) in:
Inventories (38,560) (11,503)Trade receivables (57,398) (14,845)Notes receivable 374 (30)Other receivables, deposits and prepayments (1,196) (10,513)
Increase (decrease) in:Trade payables 46,849 20,773Other payables and accruals (2,053) 15,428Due from/to related parties (trade), net (886) 541
Cash generated from operations 66,474 55,370Dividends paid (4,772) (234)Income taxes paid (4,193) (941)
Net cash generated from operating activities 57,509 54,195
Cash flows from investing activitiesAcquisition of equity interest in an associated company - (400)Interest income received 343 58Proceeds from disposal of fixed assets 3,204 1,223Purchase of fixed assets (Note B) (59,821) (34,530)
Net cash used in investing activities (56,274) (33,649)
CONSOLIDATED CASH FLOW STATEMENTFOR THE YEAR ENDED 31 DECEMBER 2004
The accounting policies and explanatory notes on pages 44 through 77 form an integral part of the financial statements.

p.42
Group2004 2003$’000 $’000
Cash flows from financing activitiesInterest expense paid (1,302) (1,811)(Repayment of)/proceeds from bank term loans, net (9,454) 12,989Repayment of short-term bank loans, net (9,598) (6,179)Lease obligation repayments (4,773) (3,892)Proceeds from issuance of shares - 86,070Share issue expenses pursuant to IPO - (3,479)
Net cash (used in) / generated from financing activities (25,127) 83,698
Net (decrease) / increase in cash and cash equivalents (23,892) 104,244Cash and cash equivalents at beginning of year 112,087 7,843
Cash and cash equivalents at end of year (Note A) 88,195 112,087
Notes to the Consolidated Cash Flow Statement
A. Cash and cash equivalents
Cash and cash equivalents comprise the following balance sheet amounts:
Group2004 2003$’000 $’000
Cash and bank balances 48,128 113,227Fixed deposits 40,067 66Bank overdrafts (secured) - (1,206)
Cash and cash equivalents 88,195 112,087
CONSOLIDATED CASH FLOW STATEMENTFOR THE YEAR ENDED 31 DECEMBER 2004
The accounting policies and explanatory notes on pages 44 through 77 form an integral part of the financial statements.

Hi-P International Limited : annual report 2004 p.43
B. Purchase of fixed assets
Group2004 2003$’000 $’000
Current year additions to fixed assets 63,226 55,180Less:
Financed by leases - (5,202)Payable to creditors (23,442) (22,417)
39,784 27,561Payments for prior year purchase of fixed assets 20,037 6,969
Net cash outflow for purchase of fixed assets 59,821 34,530
CONSOLIDATED CASH FLOW STATEMENTFOR THE YEAR ENDED 31 DECEMBER 2004
The accounting policies and explanatory notes on pages 44 through 77 form an integral part of the financial statements.
p.44
1. Corporate information
Hi-P International Limited (“the Company”) was incorporated in Singapore and it is listed on the Singapore Exchange Securities Trading Limited.
The registered office of the Company is located at 11 International Business Park, Jurong East, Singapore 609926.
The principal activities of the Group are design and fabrication of mold (“MDF”), precision plastic injection molding (“PPIM”), assembly, provisionof ancillary value-added services (mainly surface finishing services) and precision metal stamping. The principal activities of the subsidiariesare as shown in Note 11 to the financial statements.
There have been no significant changes in the nature of these activities during the financial year.
The Group operates in six (2003: six) countries and the Group and Company have 3,454 and 218 (2003: 1,864 and 198) permanent employees asof 31 December 2004, respectively.
2. Significant accounting policies
(a) Basis of preparation of financial statements
The financial statements have been prepared in accordance with Singapore Financial Reporting Standards (“FRS”) as required by theCompanies Act.
The financial statements have been prepared on a historical cost basis, and are presented in Singapore dollars.
The accounting policies have been consistently applied by the Company, and are consistent with those used in the previous financial yearexcept for the early adoption of FRS 102 - Share-Based Payments as discussed more fully below.
FRS 102 Share-Based Payments
The Company has adopted FRS 102 Share-Based Payments issued in July 2004 by the Council on Corporate Disclosure And Governance,with effect from financial year beginning 1 January 2005.
Under FRS 102, the Company accounts for options issued under the Hi-P Employee Share Option Scheme (“the Option Scheme”) as anequity-settled share-based compensation. The equity-settled share-based compensation is measured at fair value at the date of grant andthe expense is amortised and recognised in the income statement on a straight-line basis over the vesting period.
The early adoption of FRS 102 did not result in a restatement of comparative information.
(b) Principles of consolidation of financial statements
The consolidated financial statements comprise the financial statements of the Company and its subsidiaries after the elimination of allmaterial intragroup transactions and resulting unrealised profits. Unrealised losses resulting from intragroup transactions are also eliminatedunless costs cannot be recovered.
NOTES TO THE FINANCIAL STATEMENTS31 DECEMBER 2004

Hi-P International Limited : annual report 2004 p.45
2. Significant accounting policies (cont’d)
(b) Principles of consolidation of financial statements (cont’d)
Subsidiaries are consolidated from the date on which control is transferred to the group and cease to be consolidated from the date onwhich the Group ceases to have control of the subsidiaries. Acquisitions of subsidiaries are accounted for using the purchase methodof accounting.
The consolidated financial statements are prepared using uniform accounting policies for like transactions and other events in similarcircumstances.
Goodwill
Goodwill represents the excess of the cost of acquisition over the fair value of identifiable net assets of a subsidiary or associate at thedate of acquisition. Goodwill is amortised using the straight-line basis over a period of 5 years that benefits are expected to be received.Goodwill is stated at cost less accumulated amortisation and any impairment losses.
(c) Subsidiaries
A subsidiary is a company, in which the Group, directly or indirectly, holds more than 50% of the issued share capital, or controls more thanhalf of the voting power, or controls the composition of the board of directors.
In the Company’s separate financial statements, investments in subsidiaries are accounted for at cost less impairment losses.
(d) Associated companies
An associated company is an entity, not being a subsidiary, in which the Group has a long-term interest of not less than 20% nor more than50% of the equity and in whose financial and operating policy decisions the Group exercises significant influence.
The Group’s investments in associated companies are accounted for using the equity method. The Group’s investments in associatedcompanies include goodwill (net of accumulated amortisation) on acquisition, which is accounted for in accordance with the accountingpolicy for goodwill stated in (b) above.
The most recent available audited financial statements of the associated companies are used by the Group in applying the equity method. Inthe Company’s separate financial statements, investments in associated companies are accounted for at cost less any impairment losses.
(e) Related parties
A related party is a company, not being a subsidiary or an associated company, in which the shareholders or directors of the Company havean equity interest or exercise control or significant influence over the operations of the company.
(f) Other non-current asset
Other non-current asset relates to investment in a club membership stated at cost less any impairment loss.
NOTES TO THE FINANCIAL STATEMENTS31 DECEMBER 2004

p.46
2. Significant accounting policies (cont’d)
(g) Deferred expenditure
Deferred expenditure comprises cost of materials, direct labour and an appropriate proportion of overheads, incurred for production oftoolings. Deferred expenditure is stated at cost less accumulated amortisation and impairment losses. Amortisation of deferred expenditureis over the term of contract with customers commencing in the year when mass production commences and revenue is derived.
(h) Inventories
Inventories are valued at the lower of cost and net realisable value.
Costs incurred in bringing each product to its present location and condition are accounted as follows:
* Raw materials - purchase cost on a weighted average basis;* Work-in-progress and finished goods - cost of direct raw materials and direct labour and an attributable proportion of manufacturing
overheads based on normal operating capacity.
Provision is made for deteriorated, damaged, obsolete and slow-moving stocks.
Net realisable value is the estimated selling price in the ordinary course of business, less estimated costs of completion and the estimatedcosts necessary to make the sale.
(i) Foreign currency translation
Foreign currency transactions
The accounting records of the Company and its subsidiaries are maintained in their respective measurement currencies.
Foreign currency transactions are converted into the measurement currencies at exchange rates closely approximating those ruling at thetransaction dates. Foreign currency monetary assets and liabilities outstanding at the balance sheet are converted into the measurementcurrencies at the rates of exchange approximating those ruling at that date. Non-monetary assets and liabilities are measured using theexchange rates ruling at the transaction dates or, in the case of items carried at fair value, the exchange rates that existed when the valueswere determined. All resultant exchange differences are recognised in the profit and loss account.
Foreign entities
For consolidation purposes, assets and liabilities of the foreign subsidiaries are translated into Singapore dollars at the exchange ratesruling at balance sheet date. Share capital and reserves are translated at historical exchange rates. Revenue and expenses are translatedat average exchange rates for the year, which approximates the exchange rates at the dates of the transactions. All resultant exchangedifferences are taken directly to equity. Foreign currency translation adjustments arising on consolidation are accumulated as a separatecomponent of equity. The Group’s share of the foreign currency translation adjustments accounted for under the equity method is includedin the Group’s investments in associated companies.
NOTES TO THE FINANCIAL STATEMENTS31 DECEMBER 2004

Hi-P International Limited : annual report 2004 p.47
2. Significant accounting policies (cont’d)
(j) Fixed assets
Fixed assets are stated at cost less accumulated depreciation and any impairment in value. All items of fixed assets are initially recordedat cost.
The initial cost of fixed assets comprises its purchase price, including import duties and non-refundable purchase taxes and any directlyattributable costs of bringing the asset to its working condition and location for its intended use, any trade discounts and rebates arededucted in arriving at the purchase price. Expenditure incurred after the fixed assets have been put into operation, such as repairs andmaintenance and overhaul costs, is normally charged to the profit and loss account in the period in which the costs are incurred. Insituations where it can be clearly demonstrated that the expenditure has resulted in an increase in the future economic benefits expectedto be obtained from the use of an item of fixed asset beyond its originally assessed standard of performance, the expenditure is capitalisedas an additional cost of fixed asset.
Depreciation is computed on a straight-line basis over the estimated useful life of the fixed asset as follows:
Factory buildings and leasehold improvements 20 - 57 yearsRenovation 3 - 6 yearsPlant and machinery 3 - 10 yearsMotor vehicles 5 - 6 yearsOffice equipment, furniture and fittings 3 - 10 years
The useful life and depreciation method are reviewed periodically to ensure that the method and period of depreciation are consistentwith the expected pattern of economic benefits from items of fixed assets. An assessment of the carrying value of fixed assets is madewhen there are indications that the assets have been impaired or the impairment loss recognised in prior years no longer exist.
No depreciation is provided for construction-in-progress.
(k) Trade and other receivables
Trade receivables, which generally have 30-90 days credit terms, are recognised and carried at original invoice amount less an allowancefor any uncollectible amount. An estimate for doubtful debts is made when collection of the full amount is no longer probable. Bad debtsare written off as incurred.
Notes receivable which have an average maturity of 2.5 to 6 months, are interest-free and backed by banks or commercial organisations.Notes receivable are carried at cost, being the fair value of the consideration given.
Receivables from subsidiaries and related parties are recognised and carried at cost less an allowance for any uncollectible amounts.
(l) Borrowing costs
Borrowing costs are expensed as incurred.
NOTES TO THE FINANCIAL STATEMENTS31 DECEMBER 2004

p.48
2. Significant accounting policies (cont’d)
(m) Cash and cash equivalents
Cash consists of cash on hand and cash with banks, including fixed deposits and bank overdrafts. Cash equivalents are short term, highlyliquid investments that are readily convertible to known amounts of cash and that are subject to an insignificant risk of changes in value.
Cash on hand and at banks and short-term deposits which are held to maturity are carried at cost.
(n) Trade and other payables
Trade and other payables, which are normally settled on 30-90 day terms, are carried at cost which is the fair value of the consideration tobe paid in the future for goods and services received, whether or not billed to the Group.
Payables to subsidiaries and related parties are carried at cost.
(o) Impairment of assets
Fixed assets and other non-current asset are reviewed for impairment whenever events or changes in circumstances indicate that thecarrying amount of an asset may not have been recoverable. Whenever the carrying amount of an asset exceeds its recoverable amount,an impairment loss is recognised in the profit and loss account.
Reversal of an impairment loss recognised in prior years is recorded when there is an indication that the impairment losses recognised forthe asset no longer exist or have decreased. The reversal is recognised in the profit and loss account. However, the increased carryingamount of an asset due to a reversal of an impairment loss is recognised to the extent it does not exceed the carrying amount that wouldhave been determined (net of amortisation or depreciation) had no impairment loss been recognised for that asset in prior years.
(p) Leases
(i) Finance Lease
Finance leases, which effectively transfer to the Group and the Company substantially all the risks and benefits incidental to ownershipof the leased item, are capitalised at the amounts equal, at the inception of the lease, to the fair value of the leased item, or, if lower,at the present value of the minimum lease payments. Lease payments are apportioned between the finance charges and reduction ofthe lease liability so as to achieve a constant rate of interest on the remaining balance of the liability for each period. Finance chargesare charged directly to the profit and loss account.
Capitalised leased assets are depreciated over the shorter of the estimated useful life of the asset or the lease.
(ii) Operating Lease
Leases where the lessor effectively retains substantially all the risks and benefits of ownership of the leased item, are classified asoperating leases. Operating lease payments are recognised as an expense in the profit and loss account on a straight-line basis overthe lease term.
The aggregate benefit of incentives provided by the lessor is recognised as a reduction of rental expense over the lease term on astraight-line basis.
NOTES TO THE FINANCIAL STATEMENTS31 DECEMBER 2004

Hi-P International Limited : annual report 2004 p.49
2. Significant accounting policies (cont’d)
(q) Employee benefits
(i) Defined contribution plan
The Group participates in the national pension schemes as defined by the laws of the countries in which it has operations. TheSingapore companies in the Group make contributions to the Central Provident Fund (“CPF”) Scheme in Singapore, a defined contributionpension scheme. The subsidiaries incorporated and operating in the People’s Republic of China (“PRC”) are required to provide certainstaff pension benefits to their employees under existing PRC regulations. Pension contributions are provided at rates stipulated byPRC regulations and are contributed to a pension fund managed by government agencies, which are responsible for administeringthese amounts for the subsidiaries’ employees. The subsidiary in Mexico maintains and administers a savings plan for its employeeswhereby the subsidiary and its permanent employees jointly contribute monthly to the savings plan. The funds collected under thissavings plan are allocated to the relevant employees every year. In the event of a termination of employment, the relevant employeemay withdraw his entitlement to the funds.
Contributions to national pension schemes are recognised as an expense in the period in which the related services are performed.
(ii) Employee leave entitlement
Employee entitlements to annual leave are recognised when they accrue to employees. A provision is made for the estimated liabilityfor annual leave as a result of services rendered by employees up to the balance sheet date.
(iii) Equity compensation benefits
The Company accounts for the options issued under the Hi-P Employee Share Option Scheme (“the Option Scheme”) as an equity-settled share-based compensation. The equity-settled share-based compensation is measured at fair value at the date of grant byapplying an option-pricing model. The equity compensation expense is amortised and charged to the profit and loss statement usingthe straight-line method over the vesting periods of the underlying options and credited to capital reserve.
(r) Revenue
Revenue from sale of goods is recognised upon delivery of goods and acceptance by customers.
Revenue from the manufacturing of molds and metal stamps is recognised upon acceptance by customers. All known or anticipated lossesare provided for in the period in which such losses are determined.
Interest income is recognised on an accrual basis. Dividend income is recognised gross on the date it is declared payable by the investeecompany.
Group revenue excludes intercompany transactions and turnover of associates.
NOTES TO THE FINANCIAL STATEMENTS31 DECEMBER 2004

p.50
2. Significant accounting policies (cont’d)
(s) Income taxes
Deferred income tax is provided, using the liability method, on all temporary differences at the balance sheet date between the tax basesof assets and liabilities and their carrying amounts for financial reporting purposes. Deferred tax assets and liabilities are measured at thetax rates that are expected to apply to taxable income in the years in which those temporary differences are expected to be recovered orsettled, based on tax rates enacted or substantively enacted at the balance sheet date.
Deferred tax liabilities are recognised for all taxable temporary differences including those associated with investment in subsidiaries,except where the timing of the reversal of the temporary difference can be controlled by the Group and it is probable that the temporarydifference will not reverse in the foreseeable future.
Deferred tax assets are recognised for all deductible temporary differences, carry-forward of unused tax losses and unabsorbed capitalallowances, to the extent that it is probable that taxable profit will be available against which the deductible temporary differences, carry-forward of unused tax losses and unused tax credits can be utilised.
At each balance sheet date, the Group re-assesses unrecognised deferred tax assets and the carrying amount of deferred tax assets. TheGroup recognises a previously unrecognised deferred tax asset to the extent that it has become probable that future taxable profit willallow the deferred tax asset to be recovered. The Group conversely reduces the carrying amount of a deferred tax asset to the extent it isno longer probable that sufficient taxable profit will be available to allow the benefit of part or all of the deferred tax asset to be utilised.
(t) Provisions
Provisions are recognised when the Group has a present obligation (legal or constructive) as a result of a past event, it is probable that anoutflow of resources embodying economic benefits will be required to settle the obligation and a reliable estimate can be made of theamount of the obligation. Provisions are reviewed at each balance sheet date and adjusted to reflect the current best estimate.
If the effect of the time value of money is material, provisions are determined by discounting the expected future cash flows at a pre-taxrate that reflects current market assessments of the time value of money and, where applicable, the risks specific to the liability. Wherediscounting is used, the increase in the provision due to the passage of time is recognised as an interest expense.
(u) Segments
For management purposes, the Group is organised on a world-wide basis into three major operating activities. These operating activitiesare the basis on which the Group reports its primary segment information.
Segment revenue, expenses and results include transfers between business segments. Such transfers are accounted for on an arm’s length basis.
(v) Research and development costs
Research and development costs are expensed as incurred, except for development costs which relate to the design and testing of new orimproved materials, products or processes which are recognised as an asset to the extent that it is expected that such assets will generatefuture economic benefits.
3. Revenue
Revenue represents sales to customers net of discounts and returns. Intra-group transactions have been excluded from Group revenue.
NOTES TO THE FINANCIAL STATEMENTS31 DECEMBER 2004

Hi-P International Limited : annual report 2004 p.51
4. Other operating income
Group2004 2003$’000 $’000
Gain on disposal of fixed assets 483 590Gain on sale of raw materials 369 309Sale of scrap materials 1,452 275Refund of value-added tax - 161Tax refund on capital investment 1,080 993Others 240 165
3,624 2,493
5. Profit from operations
This is determined after charging (crediting) the following:
Group2004 2003$’000 $’000
Auditors’ remuneration- auditors of the Company 118 57- other auditors 466 214Depreciation of fixed assets 18,841 13,257Directors’ fees 338 34Directors’ remuneration- directors of the Company 3,400* 1,919*- director of a subsidiary company 372 290Equity compensation expense 775 -Provision for doubtful debt - related parties 227 -Provision for doubtful trade debts 5,573 -Write back of provision for doubtful trade debts (14) -Provision for inventory obsolescence 3,162 1,154Fixed assets impairment loss - 103Operating lease expenses 4,479 3,651Research and development costs 2,329 686Personnel expenses (Note 6) 80,047 40,343
* Amount includes performance bonus amounting to approximately $2,906,000 (2003: $1,245,000) pursuant to the Service Agreement enteredinto, computed based on 3% of the Group’s profit before tax and minority interest for the relevant financial year.
NOTES TO THE FINANCIAL STATEMENTS31 DECEMBER 2004
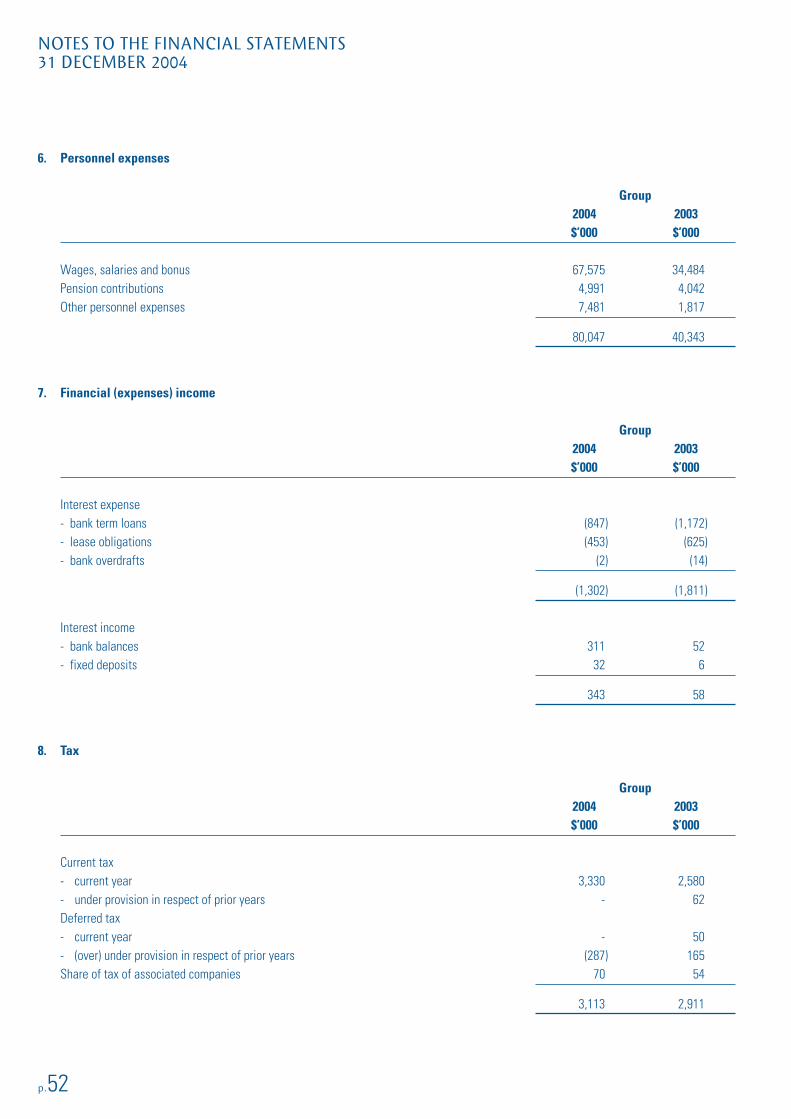
p.52
NOTES TO THE FINANCIAL STATEMENTS31 DECEMBER 2004
6. Personnel expenses
Group2004 2003$’000 $’000
Wages, salaries and bonus 67,575 34,484Pension contributions 4,991 4,042Other personnel expenses 7,481 1,817
80,047 40,343
7. Financial (expenses) income
Group2004 2003$’000 $’000
Interest expense- bank term loans (847) (1,172)- lease obligations (453) (625)- bank overdrafts (2) (14)
(1,302) (1,811)
Interest income- bank balances 311 52- fixed deposits 32 6
343 58
8. Tax
Group2004 2003$’000 $’000
Current tax- current year 3,330 2,580- under provision in respect of prior years - 62Deferred tax- current year - 50- (over) under provision in respect of prior years (287) 165Share of tax of associated companies 70 54
3,113 2,911

Hi-P International Limited : annual report 2004 p.53
8. Tax (cont’d)
The reconciliation of the tax expense and that of accounting profit multiplied by the applicable tax rate is as follows:
Group2004 2003$’000 $’000
Profit before tax and share of results of associated companies 92,022 39,919
Tax at the domestic rates applicable to profits in the countries concerned * 2,635 2,047Tax effect of losses not available for offset against taxable profits 129 157Tax effect of expenses that are not deductible in determining taxable profit 521 296(Over) under provision in respect of prior years (287) 227Tax rebate and exemption 44 -Share of tax of associated companies 70 54Others 1 130
Tax expense 3,113 2,911
* This is computed by aggregating separate computations for each company in their respective countries.
NOTES TO THE FINANCIAL STATEMENTS31 DECEMBER 2004

p.54
8. Tax (cont’d)
In accordance with the “Income Tax Law of the PRC for Enterprises with Foreign Investment and Foreign Enterprises”, the subsidiaries in thePRC are entitled to full exemption from Enterprise Income Tax (“EIT”) for the first two years and a 50% reduction in EIT for the next three years,commencing from the first profitable year after offsetting all tax losses carried forward from the previous five years. Accordingly, the profits ofthese subsidiary companies are taxed at the following tax rates:
2004 2003% %
Hi-P Shanghai Electronics Co., Ltd. 15 15Hi-P Camera Products Co., Ltd. 7.5 7.5Hi-P Precision Plastic Manufacturing (Shanghai) Co., Ltd. 7.5 Tax exemptHi-P (Chengdu) Precision Plastic Manufacturing Co., Ltd. 10 7.5Hi-P (Chengdu) Mold Base Manufacturing Co., Ltd. Tax exempt Tax exemptHi-P (Xiamen) Precision Plastic Manufacturing Co., Ltd. 7.5 7.5Qingdao Haier Hi-P Science Technology Co., Ltd. 12 Tax exemptHi-P Tianjin Electronics Co., Ltd. Tax exempt Tax exemptHi-P (Shanghai) Industries Co., Ltd. Tax exempt Tax exemptHi-P (Shanghai) Housing Appliance Co., Ltd Tax exempt Tax exemptHi-P (Shanghai) Precision Mold & Die Co., Ltd. Tax exempt Tax exemptHi-P (Suzhou) Technology Co., Ltd. Tax exempt *Hi-P (Tianjin) Precision Mold & Die Co., Ltd. Tax exempt *Hi-P (Suzhou) Electronics Co., Ltd * **Hi-P (Tianjin) Technology Co., Ltd * **
* Subsidiary in loss position.
** Subsidiary not incorporated yet.
High Precision Moulding and Tools, S.A. de C.V. is subject to the following types of income taxes:
(i) Asset tax: the 1.8% asset tax rate (which is a minimum income tax rate) is computed on the average value of most assets net of certainliabilities. Since asset tax may be credited against income tax, the former is actually payable only to the extent that it exceeds income taxand any amount actually paid may be recovered in any of the succeeding ten years in which income tax exceeds asset tax; and
(ii) Income tax: the applicable corporate income tax rate is 33%.
Hi-P North America, Inc. is subject to the following types of income taxes:
(i) Federal tax: Graduated tax structure that begins at 15% to a maximum of 35%; and
(ii) State tax: Comprises corporate income tax rate of 4.8% and state replacement tax rate of 2.5%.
NOTES TO THE FINANCIAL STATEMENTS31 DECEMBER 2004

Hi-P International Limited : annual report 2004 p.55
8. Tax (cont’d)
Hi-P Mauritius Ltd. is granted the Global Business Companies Category 1 Licence and is taxed at a flat rate of 15%. However, the subsidiary is entitledto unilateral foreign tax credits under the Income Tax (Foreign Tax Credit) Regulations 1996, which would result in a maximum effective tax rate of 3%.
Hi-P Resources Ltd. is granted the Global Business Companies Category 2 Licence and is tax exempt.
Hi-P Finland Oy is subject to corporate income tax at 29%.
9. Earnings per share
Group2004 2003
Profit attributable to shareholders ($’000) 88,053 36,586
Weighted average number of ordinary sharesin issue used for computing basic earnings per share 887,000,000 742,205,479
Adjustment for number of unissued ordinaryshares under share options 1,859,109 -
Weighted average number of ordinary sharesin issue used for computing diluted earnings per share 888,859,109 742,205,479
Basic earnings per share (cents) 9.93 4.93
Diluted earnings per share (cents) 9.93 4.93
Basic earnings per share is calculated by dividing the profit attributable to shareholders by the weighted average number of ordinary shares inissue during the financial year.
For purposes of calculating diluted earnings per share, the weighted average number of ordinary shares in issue is adjusted to take into accountthe dilutive effect of share options.
NOTES TO THE FINANCIAL STATEMENTS31 DECEMBER 2004

p.56
10. Fixed assets
Factory Office buildings and equipment,
leasehold Construction Plant and Motor furniture(a) Group improvements -in-progress Renovation machinery vehicles and fittings Total
$’000 $’000 $’000 $’000 $’000 $’000 $’000
CostAs at 1.1.2004 25,919 234 12,339 128,034 1,375 12,172 180,073Additions 461 5,623 4,612 48,638 40 3,852 63,226Reclassification (1,547) (1,378) 1,547 1,399 11 (32) -Disposals (4,427) (6) - (395) (66) - (4,894)Translation difference (236) (147) (1,572) (5,674) (25) (328) (7,982)
As at 31.12.2004 20,170 4,326 16,926 172,002 1,335 15,664 230,423
Accumulateddepreciation
As at 1.1.2004 5,076 - 3,259 32,865 386 4,592 46,178Charge for the year 437 - 2,356 13,547 220 2,281 18,841Reclassification 118 - (118) 18 (2) (16) -Disposals (1,405) - (660) (40) (28) - (2,133)Translation difference (162) - (681) (307) (7) (271) (1,428)
As at 31.12.2004 4,064 - 4,156 46,083 569 6,586 61,458
Charge for 2003 701 - 1,565 9,145 137 1,709 13,257
Net book valueAs at 31.12.2004 16,106 4,326 12,770 125,919 766 9,078 168,965
As at 31.12.2003 20,843 234 9,080 95,169 989 7,580 133,895
As at 31 December 2004, the Group had plant and machinery, motor vehicles and office equipment under lease with net book values ofapproximately $5,307,687 (2003: $14,062,000), $325,824 (2003: $443,000) and $69,546 (2003: $112,000) respectively.
NOTES TO THE FINANCIAL STATEMENTS31 DECEMBER 2004

Hi-P International Limited : annual report 2004 p.57
10. Fixed assets (cont’d)
Factory Officebuildings and equipment,
leasehold Plant and Motor furniture(b) Company improvements Renovation machinery vehicles and fittings Total
$’000 $’000 $’000 $’000 $’000 $’000
CostAs at 1.1.2004 15,329 176 19,049 781 857 36,192Additions 300 42 2,193 - 42 2,577Disposals - - (168) (65) - (233)
As at 31.12.2004 15,629 218 21,074 716 899 38,536
Accumulated depreciationAs at 1.1.2004 1,588 14 11,749 216 459 14,026Charge for the year 272 33 1,948 125 82 2,460Disposals - - (128) (27) - (155)Reclassification - - (3) - 3 -
As at 31.12.2004 1,860 47 13,566 314 544 16,331
Charge for 2003 266 14 1,837 76 78 2,271
Net book valueAs at 31.12.2004 13,769 171 7,508 402 355 22,205
As at 31.12.2003 13,741 162 7,303 565 395 22,166
As at 31 December 2004, the Company had plant and machinery and motor vehicles under lease with net book values of approximately $54,000(2003: $3,007,000) and $326,000 (2003: $443,000) respectively.
NOTES TO THE FINANCIAL STATEMENTS31 DECEMBER 2004

p.58
11. Investment in subsidiaries
Subsidiaries comprise:
Company2004 2003$’000 $’000
Unquoted equity shares -
Cost at beginning of year 59,235 40,237Additional investments during the year 7,610 18,998
Cost at end of year 66,845 59,235Provision for impairment (8,500) (8,500)
58,345 50,735
Movement in provision for impairment of investment in subsidiaries during the year is as follows:
At beginning of year and end of the year 8,500 8,500
The Company and the Group had the following subsidiaries as at 31 December 2004:
Country ofPrincipal incorporation and Equity interest Cost of
Name of company activities place of business held by the Group investment2004 2003 2004 2003
% % $’000 $’000
Held by the Company
Hi-P Shanghai Manufacture People’s Republic 100 100 3,530 3,530Electronics Co., Ltd. ** of molds of China
High Precision Moulding Manufacture of Mexico 100 100 11,840 11,840and Tools, S.A. plastic injection partsde C.V. ***
Hi-P (Chengdu) Precision Manufacture of People’s Republic 100 100 3,871 3,352Plastic Manufacturing plastic injection parts of ChinaCo., Ltd.**
Hi-P Camera Products Manufacture of People’s Republic 100 100 8,489 8,489Co., Ltd. ** camera products of China
NOTES TO THE FINANCIAL STATEMENTS31 DECEMBER 2004

Hi-P International Limited : annual report 2004 p.59
11. Investment in subsidiaries (cont’d)
Country ofPrincipal incorporation and Equity interest Cost of
Name of company activities place of business held by the Group investment2004 2003 2004 2003
% % $’000 $’000
Hi-P Precision Plastic Spray painting People’s Republic 100 100 3,769 3,769Manufacturing of China(Shanghai) Co., Ltd. **
Hi-P (Xiamen) Precision Manufacture and People’s Republic 100 100 4,548 4,548Plastic Manufacturing sale of plastic of ChinaCo., Ltd. ** product modules
Qingdao Haier Hi-P Manufacture and People’s Republic 70 70 2,544 2,544Science Technology sale of plastic of ChinaCo., Ltd. ** product modules
Hi-P (Chengdu) Mold Manufacture of People’s Republic 100 100 3,007 3,007Base Manufacturing mold base and of ChinaCo., Ltd. ** components
Hi-P (Shanghai) Manufacture of molds People’s Republic 100 100 4,550 4,550Housing Appliance and related housing of ChinaCo., Ltd ** appliance plastic
components
Hi-P Tianjin Electronics Manufacture People’s Republic 100 100 4,519 4,343Co., Ltd. ** of molds of China
Hi-P Management Manufacture and Singapore 100 100 - @ - @Services Pte Ltd * sale of tools,(formerly known as molds and plasticHi-P Tech Singapore componentsPte Ltd) (currently dormant)
Hi-P Industries Pte. Ltd. * Manufacture of Singapore 100 100 1,500 1,500metal precision
components
Hi-P North America, Provision of engineering United States 100 100 2 2Inc. ## support services of America
Hi-P Finland Oy ### Provision of engineering Finland 100 100 16 16support services
NOTES TO THE FINANCIAL STATEMENTS31 DECEMBER 2004

p.60
11. Investment in subsidiaries (cont’d)
Country ofPrincipal incorporation and Equity interest Cost of
Name of company activities place of business held by the Group investment2004 2003 2004 2003
% % $’000 $’000
Hi-P (Shanghai) Precision Manufacture People’s Republic 100 100 4,335 4,335Mold & Die Co., Ltd. ** of molds of China
Hi-P (Suzhou) Technology Manufacture of People’s Republic 100 100 2,949 2,949Co., Ltd. ** plastic injection parts of China
Hi-P (Tianjin) Precision Manufacture People’s Republic 100 100 2,431 368Mold & Die Co., Ltd. ** of molds of China
Hi-P Mauritius International sales Mauritius 100 100 85 85Ltd #### and marketing activities
Hi-P Resources Provision of human Mauritius 100 100 8 8Ltd **** resource to
related companies
Hi-P (Suzhou) Manufacture and sale People’s Republic 100 100 1,276 -Electronics of molds and plastic of ChinaCo., Ltd ** components
Hi-P (Tianjin) Technology Manufacture and sale People’s Republic 100 100 2,536 -Co., Ltd ** of molds and plastic of China
components
Hi-P (Shanghai) Manufacture and sale People’s Republic 100 - - -Technology Co., Ltd # of molds and plastic of China
components
Hi-P Samkwang Manufacture and Singapore 52 - 1,040 -Technology production of in-mold(Singapore) Pte. Ltd. # decoration lenses
Held by a subsidiary company
Hi-P (Shanghai) Manufacture of precision People’s Republic 100 100 - -Industries stamped metal components of ChinaCo., Ltd. ** and precision tools and die
design and fabrication
66,845 59,235
NOTES TO THE FINANCIAL STATEMENTS31 DECEMBER 2004

Hi-P International Limited : annual report 2004 p.61
11. Investment in subsidiaries (cont’d)
* Audited by Ernst & Young, Singapore.
** Audited by Ernst & Young Hua Ming, an associated firm of Ernst & Young, Singapore.
*** Audited by Mancera, S.C., an associated firm of Ernst & Young, Singapore.
**** Not required to be audited under the laws of the country of incorporation.
# Not required to be audited under the laws of the country of incorporation as the company is newly incorporated.
## Audited by Charles J. Gries & Company L.L.P. Certified Public Accountants.
### Audited by Ernst & Young Oy, an associated firm of Ernst & Young, Singapore.
#### Audited by Ernst & Young, Mauritius, an associated firm of Ernst & Young, Singapore.
@ $2 comprising two subscriber shares of $1 each.
12. Investment in associated companies
Investment in associated companies comprises:
Group Company2004 2003 2004 2003$’000 $’000 $’000 $’000
Unquoted equity shares at cost 903 903 903 903Share of post-acquisition profits of
associated companies- current year 355 337 - -- prior years 1,161 824 - -Share of tax of associated companies- current year (70) (54) - -- prior years (244) (190) - -Share of translation reserve (43) (15) - -Share of reserve fund 11 - - -
2,073 1,805 903 903
NOTES TO THE FINANCIAL STATEMENTS31 DECEMBER 2004

p.62
12. Investment in associated companies (cont’d)
The Group had the following associated companies as at 31 December 2004:
Principal Country of incorporation Equity interest Cost ofName of company activities and place of business held by the Group investment
2004 2003 2004 2003% % $’000 $’000
Express Tech Mfg Manufacture and Singapore 30 30 503 503Pte Ltd* sale of plastic products
and engineering parts
Hi-Tec Precision Mould Manufacture and Singapore 40 40 400 400Pte. Ltd. ** repair of machinery,
machine tools andmachine tool accessories
and die-casting
903 903
* Audited by Deloitte & Touche, Singapore.
** Audited by Lau Chin Huat & Co.
13. Other non-current asset
This relates to investment in a club membership, stated at cost less provision for impairment.
Group and Company2004 2003$’000 $’000
At cost 36 36Provision for impairment (24) (24)
12 12
NOTES TO THE FINANCIAL STATEMENTS31 DECEMBER 2004

Hi-P International Limited : annual report 2004 p.63
14. Deferred expenditure
Group and Company2004 2003$’000 $’000
At cost:Additions during the year and balance at end of year 514 -
Amortisation of toolings cost will commence from January 2005, over the term of contract with the customer for a period of four years.
15. Inventories
Group Company2004 2003 2004 2003$’000 $’000 $’000 $’000
Work-in-progressAt cost 13,792 3,848 1,302 976At net realisable value - - - -
Raw materialsAt cost 28,889 14,734 423 535At net realisable value - 25 - -
Finished goodsAt cost 17,597 5,955 1,728 1,933At net realisable value - 106 - -
Total inventories at lower of cost andnet realisable value 60,278 24,668 3,453 3,444
Work-in-progress, raw materials and finishedgoods are stated after deducting provisionfor inventory obsolescence 4,023 1,192 21 -
At beginning of year 1,192 277 - 45Provision for the year 3,162 1,154 21 -Written off against provision (119) (210) - (45)Translation difference (212) (29) - -
At end of year 4,023 1,192 21 -
NOTES TO THE FINANCIAL STATEMENTS31 DECEMBER 2004
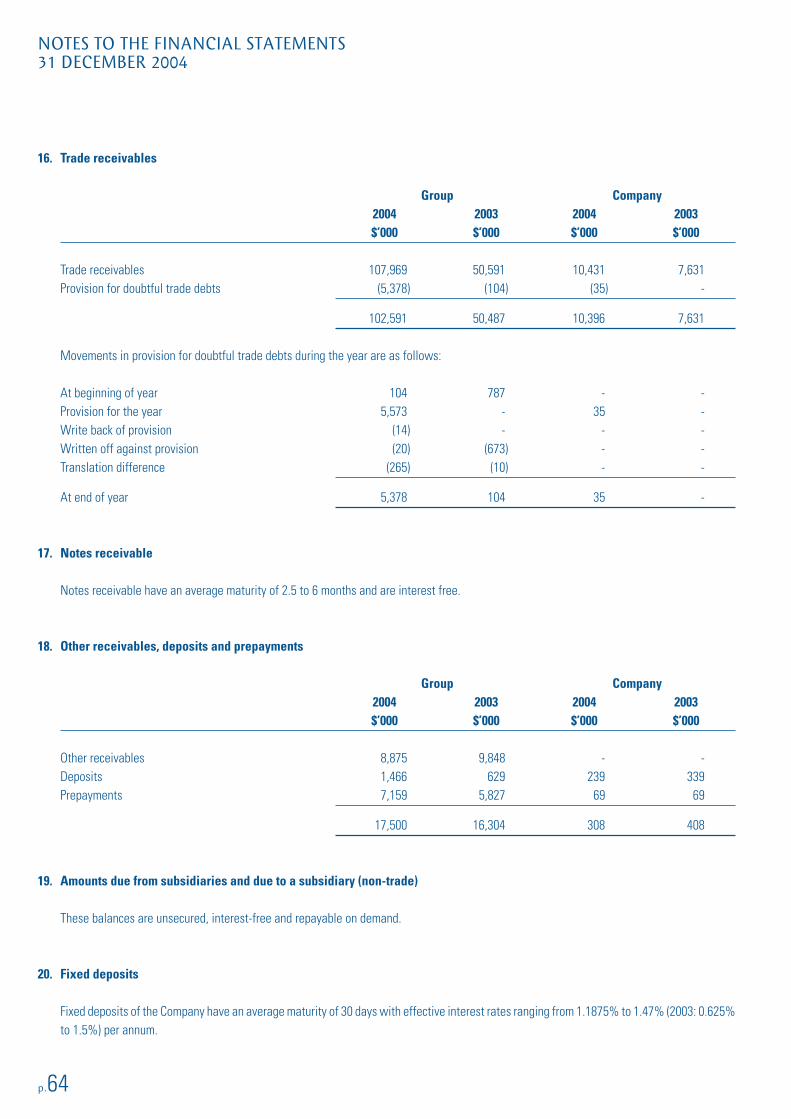
p.64
16. Trade receivables
Group Company2004 2003 2004 2003$’000 $’000 $’000 $’000
Trade receivables 107,969 50,591 10,431 7,631Provision for doubtful trade debts (5,378) (104) (35) -
102,591 50,487 10,396 7,631
Movements in provision for doubtful trade debts during the year are as follows:
At beginning of year 104 787 - -Provision for the year 5,573 - 35 -Write back of provision (14) - - -Written off against provision (20) (673) - -Translation difference (265) (10) - -
At end of year 5,378 104 35 -
17. Notes receivable
Notes receivable have an average maturity of 2.5 to 6 months and are interest free.
18. Other receivables, deposits and prepayments
Group Company2004 2003 2004 2003$’000 $’000 $’000 $’000
Other receivables 8,875 9,848 - -Deposits 1,466 629 239 339Prepayments 7,159 5,827 69 69
17,500 16,304 308 408
19. Amounts due from subsidiaries and due to a subsidiary (non-trade)
These balances are unsecured, interest-free and repayable on demand.
20. Fixed deposits
Fixed deposits of the Company have an average maturity of 30 days with effective interest rates ranging from 1.1875% to 1.47% (2003: 0.625%to 1.5%) per annum.
NOTES TO THE FINANCIAL STATEMENTS31 DECEMBER 2004
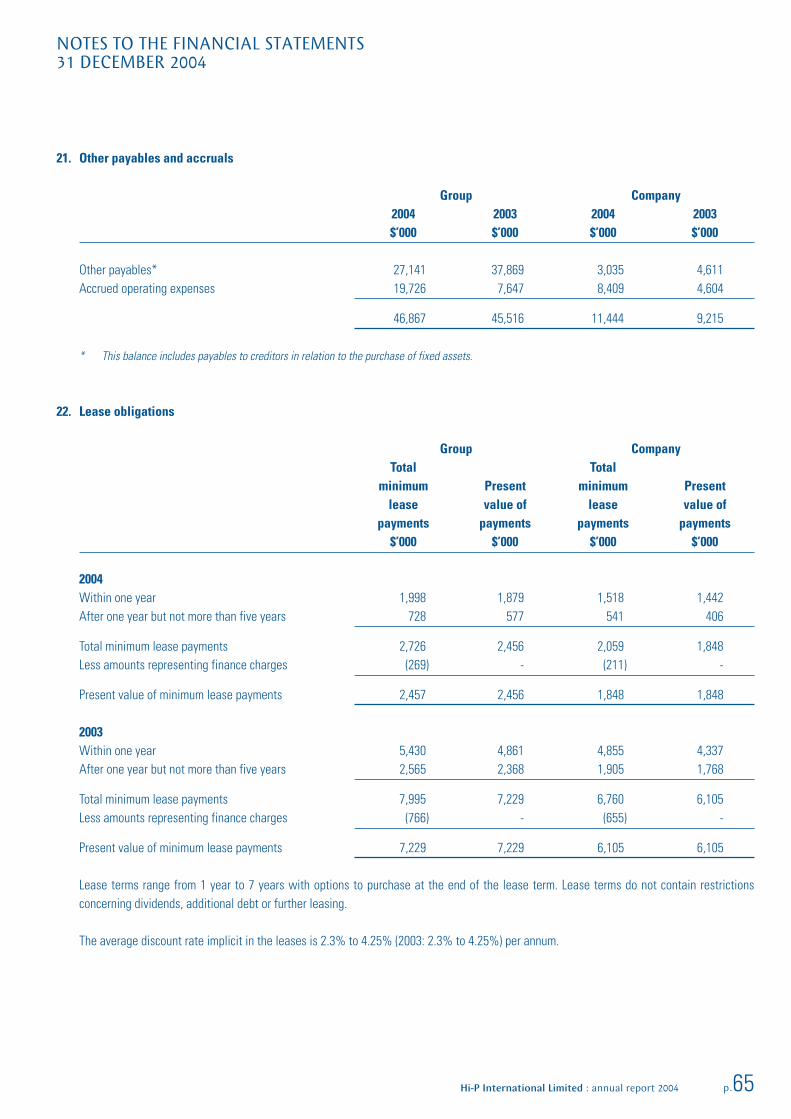
Hi-P International Limited : annual report 2004 p.65
21. Other payables and accruals
Group Company2004 2003 2004 2003$’000 $’000 $’000 $’000
Other payables* 27,141 37,869 3,035 4,611Accrued operating expenses 19,726 7,647 8,409 4,604
46,867 45,516 11,444 9,215
* This balance includes payables to creditors in relation to the purchase of fixed assets.
22. Lease obligations
Group CompanyTotal Total
minimum Present minimum Presentlease value of lease value of
payments payments payments payments$’000 $’000 $’000 $’000
2004Within one year 1,998 1,879 1,518 1,442After one year but not more than five years 728 577 541 406
Total minimum lease payments 2,726 2,456 2,059 1,848Less amounts representing finance charges (269) - (211) -
Present value of minimum lease payments 2,457 2,456 1,848 1,848
2003Within one year 5,430 4,861 4,855 4,337After one year but not more than five years 2,565 2,368 1,905 1,768
Total minimum lease payments 7,995 7,229 6,760 6,105Less amounts representing finance charges (766) - (655) -
Present value of minimum lease payments 7,229 7,229 6,105 6,105
Lease terms range from 1 year to 7 years with options to purchase at the end of the lease term. Lease terms do not contain restrictionsconcerning dividends, additional debt or further leasing.
The average discount rate implicit in the leases is 2.3% to 4.25% (2003: 2.3% to 4.25%) per annum.
NOTES TO THE FINANCIAL STATEMENTS31 DECEMBER 2004
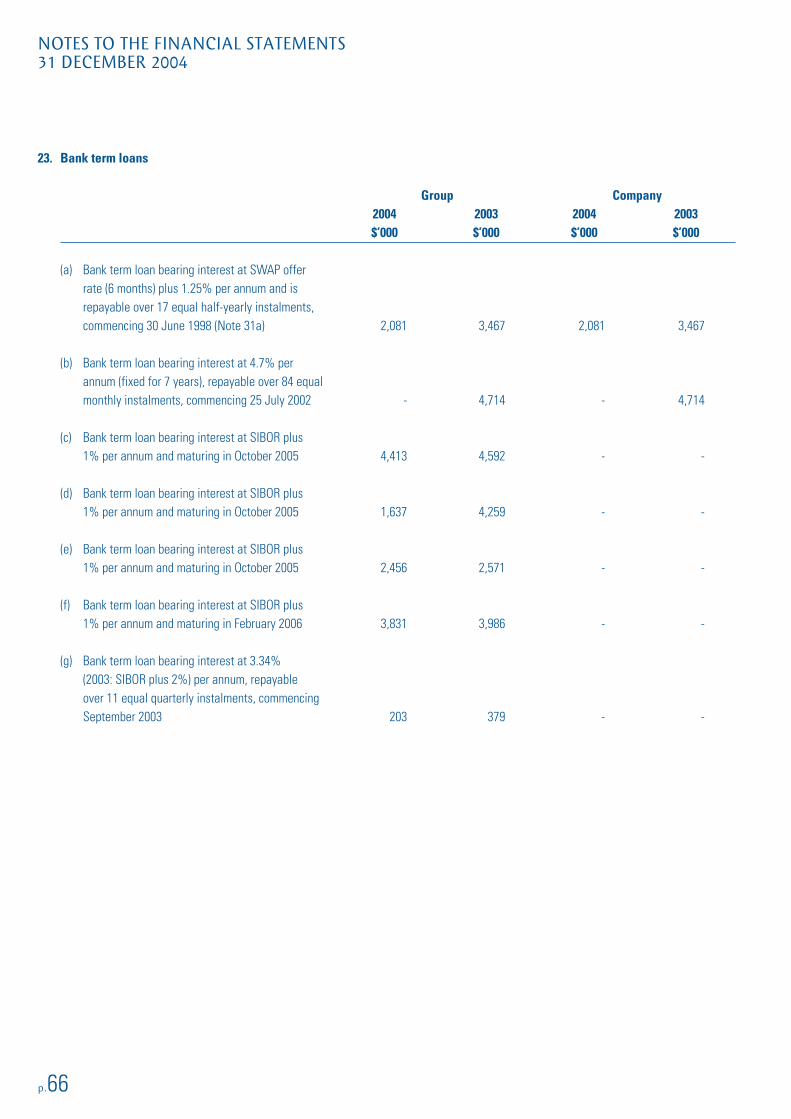
p.66
23. Bank term loans
Group Company2004 2003 2004 2003$’000 $’000 $’000 $’000
(a) Bank term loan bearing interest at SWAP offerrate (6 months) plus 1.25% per annum and isrepayable over 17 equal half-yearly instalments,commencing 30 June 1998 (Note 31a) 2,081 3,467 2,081 3,467
(b) Bank term loan bearing interest at 4.7% perannum (fixed for 7 years), repayable over 84 equalmonthly instalments, commencing 25 July 2002 - 4,714 - 4,714
(c) Bank term loan bearing interest at SIBOR plus1% per annum and maturing in October 2005 4,413 4,592 - -
(d) Bank term loan bearing interest at SIBOR plus1% per annum and maturing in October 2005 1,637 4,259 - -
(e) Bank term loan bearing interest at SIBOR plus1% per annum and maturing in October 2005 2,456 2,571 - -
(f) Bank term loan bearing interest at SIBOR plus1% per annum and maturing in February 2006 3,831 3,986 - -
(g) Bank term loan bearing interest at 3.34%(2003: SIBOR plus 2%) per annum, repayableover 11 equal quarterly instalments, commencingSeptember 2003 203 379 - -
NOTES TO THE FINANCIAL STATEMENTS31 DECEMBER 2004
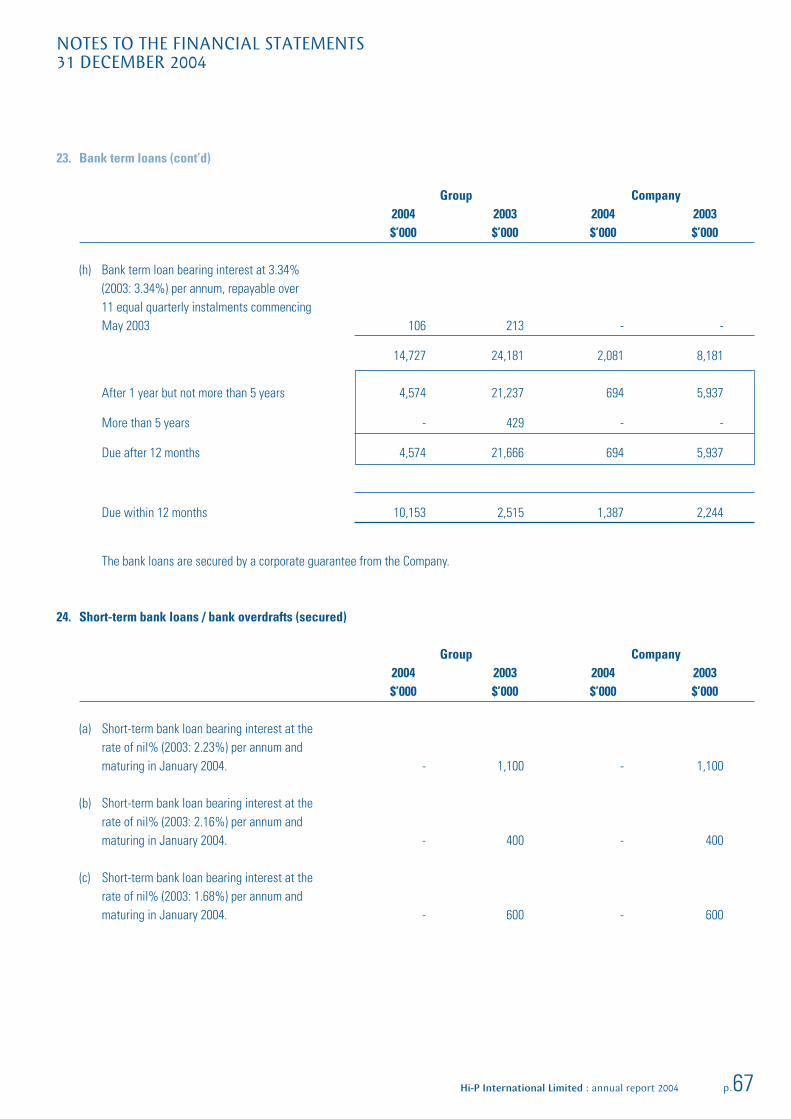
Hi-P International Limited : annual report 2004 p.67
23. Bank term loans (cont’d)
Group Company2004 2003 2004 2003$’000 $’000 $’000 $’000
(h) Bank term loan bearing interest at 3.34%(2003: 3.34%) per annum, repayable over11 equal quarterly instalments commencingMay 2003 106 213 - -
14,727 24,181 2,081 8,181
After 1 year but not more than 5 years 4,574 21,237 694 5,937
More than 5 years - 429 - -
Due after 12 months 4,574 21,666 694 5,937
Due within 12 months 10,153 2,515 1,387 2,244
The bank loans are secured by a corporate guarantee from the Company.
24. Short-term bank loans / bank overdrafts (secured)
Group Company2004 2003 2004 2003$’000 $’000 $’000 $’000
(a) Short-term bank loan bearing interest at therate of nil% (2003: 2.23%) per annum andmaturing in January 2004. - 1,100 - 1,100
(b) Short-term bank loan bearing interest at therate of nil% (2003: 2.16%) per annum andmaturing in January 2004. - 400 - 400
(c) Short-term bank loan bearing interest at therate of nil% (2003: 1.68%) per annum andmaturing in January 2004. - 600 - 600
NOTES TO THE FINANCIAL STATEMENTS31 DECEMBER 2004

p.68
24. Short-term bank loans/ bank overdrafts (secured) (cont’d)
Group Company2004 2003 2004 2003$’000 $’000 $’000 $’000
(d) Short-term bank loan bearing interest at therate nil % (2003: 1.66%) per annum andmaturing in January 2004. - 420 - 420
(e) Short-term bank loan bearing interest at therate of nil % (2003: 1.8%) per annum andmaturing in January 2004. - 500 - 500
(f) Short-term bank loan bearing interest at therate of nil % (2003: 4.425%) per annum andmaturing in July 2004. - 1,235 - -
(g) Short-term bank loan bearing interest at therate of nil% (2003: 4.536%) per annum andmaturing in April 2004. - 5,968 - -
(h) Short-term bank loan bearing interest at therate of nil% (2003: 2.1875%) per annum andmaturing in January 2004. - 2,551 - -
(i) Short-term bank loan bearing interest at therate of nil% (2003: 4.536%) per annum andmaturing in January 2004. - 1,235 - -
(j) Short-term bank loan bearing interest at therate of nil% (2003: 2.32%) per annum andmaturing in January 2004. - 500 - -
(k) Short-term bank loan bearing interest at therate of 2.04% per annum and maturing inJanuary 2005. 4,911 - - -
4,911 14,509 - 3,020
In 2003, the short-term bank loans (a), (b), (c), (d) and (e) were secured by way of a legal mortgage over the factory building of the Company witha net book value of $13,741,000. These short-term bank loans have been fully repaid during the year.
The short-term bank loans are secured by a corporate guarantee from the Company.
NOTES TO THE FINANCIAL STATEMENTS31 DECEMBER 2004
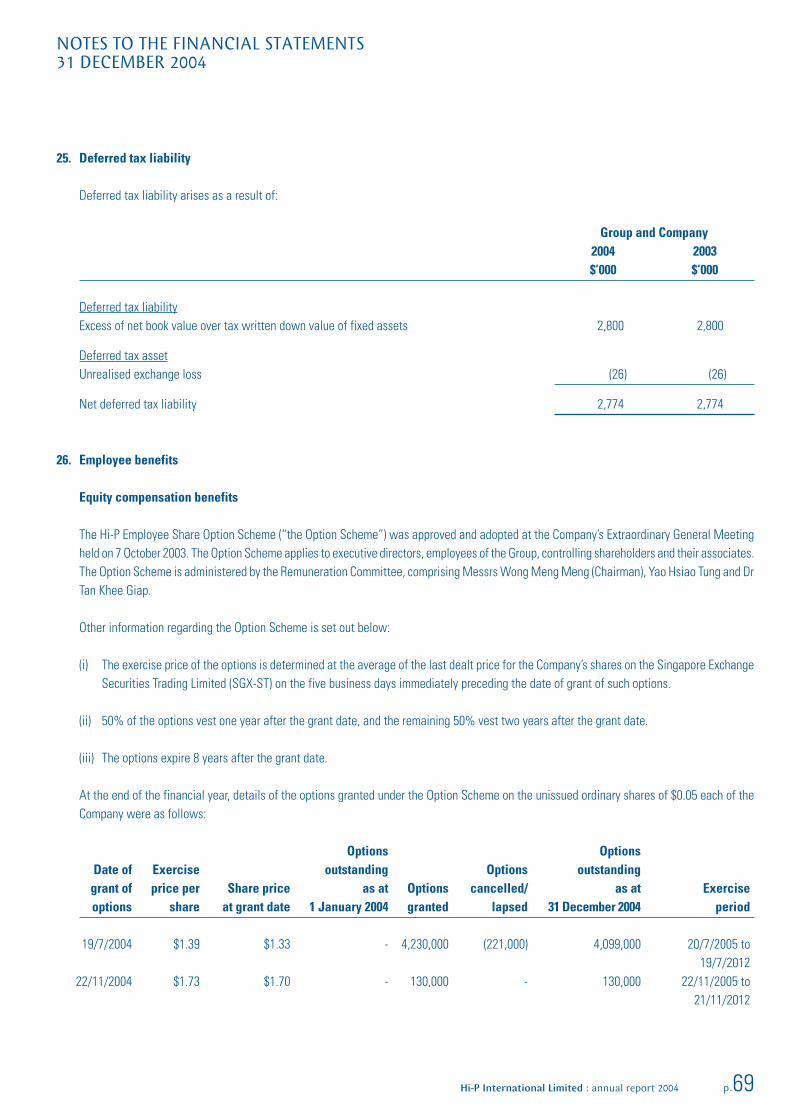
Hi-P International Limited : annual report 2004 p.69
25. Deferred tax liability
Deferred tax liability arises as a result of:
Group and Company2004 2003$’000 $’000
Deferred tax liabilityExcess of net book value over tax written down value of fixed assets 2,800 2,800
Deferred tax assetUnrealised exchange loss (26) (26)
Net deferred tax liability 2,774 2,774
26. Employee benefits
Equity compensation benefits
The Hi-P Employee Share Option Scheme (“the Option Scheme”) was approved and adopted at the Company’s Extraordinary General Meetingheld on 7 October 2003. The Option Scheme applies to executive directors, employees of the Group, controlling shareholders and their associates.The Option Scheme is administered by the Remuneration Committee, comprising Messrs Wong Meng Meng (Chairman), Yao Hsiao Tung and DrTan Khee Giap.
Other information regarding the Option Scheme is set out below:
(i) The exercise price of the options is determined at the average of the last dealt price for the Company’s shares on the Singapore ExchangeSecurities Trading Limited (SGX-ST) on the five business days immediately preceding the date of grant of such options.
(ii) 50% of the options vest one year after the grant date, and the remaining 50% vest two years after the grant date.
(iii) The options expire 8 years after the grant date.
At the end of the financial year, details of the options granted under the Option Scheme on the unissued ordinary shares of $0.05 each of theCompany were as follows:
Options OptionsDate of Exercise outstanding Options outstanding
grant of price per Share price as at Options cancelled/ as at Exerciseoptions share at grant date 1 January 2004 granted lapsed 31 December 2004 period
19/7/2004 $1.39 $1.33 - 4,230,000 (221,000) 4,099,000 20/7/2005 to19/7/2012
22/11/2004 $1.73 $1.70 - 130,000 - 130,000 22/11/2005 to21/11/2012
NOTES TO THE FINANCIAL STATEMENTS31 DECEMBER 2004

p.70
26. Employee benefits (cont’d)
Equity compensation benefits (cont’d)
The estimated weighted average fair value per share option granted under the Option Scheme is $0.4886. This was calculated by using theBlack-Scholes model based on the following assumptions:
Expected volatility 49.21%
Risk-free interest rates 3.33%
Expected dividend yield 0.30%
Expected life 3 years
To allow for the effects of early exercise, it was assumed that employees would exercise the options after vesting date when the share pricewas above the exercise price.
Historical volatility was 43.3%, based on the Company’s share price movements since listing on 17 December 2003.
27. Share capital
2004 2003$’000 $’000
Authorised2,000,000,000 (2003: 25,000,000) ordinary
shares of $0.05 (2003: $1) each 100,000 25,000- Creation of nil (2003: 75,000,000) ordinary shares of $1 each - 75,000
2,000,000,000 (2003: 2,000,000,000) ordinaryshares of $0.05 (2003: $0.05) each 100,000 100,000
Issued and fully paidAt beginning and end of year
887,000,000 (2003: 887,000,000) ordinaryshares of $0.05 each (2003: $0.05 each) 44,350 44,350
The holders of ordinary shares are entitled to receive dividends as and when declared by the Company. All ordinary shares carry one vote pershare without restriction.
28. Reserve fund
Pursuant to the relevant laws in the People’s Republic of China (“PRC”), the Group has set aside reserve fund, which may be utilised to offsetaccumulated losses or increase the capital of subsidiaries, subject to approval from the PRC authorities. The above fund is not available fordividend distribution to the shareholders.
NOTES TO THE FINANCIAL STATEMENTS31 DECEMBER 2004

Hi-P International Limited : annual report 2004 p.71
29. Accumulated profits
Group2004 2003$’000 $’000
Retained in:
- the Company 21,523 20,516- subsidiaries 120,009 43,529- associated companies 1,229 917
142,761 64,962
The accumulated profits of the Company are available for distribution as dividends.
30. Dividends
Group and Company2004 2003$’000 $’000
Final dividend of 0.5 cents per share (2003: 1.63 cents per share)less tax at 20% (2003: 22%) amounting to $3,548,000 (2003: $234,000)is proposed and paid in respect of the previous financial year 3,548 234
After the balance sheet date, the directors proposed a first and final dividend of 1.0 (2003: 0.50) cent per ordinary share less tax at 20%(2003: 20%), amounting to $7,096,000 (2003: $3,548,000) for the financial year ended 31 December 2004. These dividends were not providedfor as at year-end, as they are subject to approval by shareholders at the Annual General Meeting of the Company.
31. Contingent liabilities and commitments
(a) Financial derivatives
As at 31 December 2004, the Group and the Company have an interest rate swap contract to exchange a floating rate obligation for a fixedrate obligation. The notional amount of the interest rate swap contract is $2,081,000 (2003: $3,467,000). The swap contract was enteredinto to hedge the Company’s interest rate exposure on the bank term loan (a) disclosed in Note 23. Unrealised exchange loss of approximately$47,305 (2003: $119,000) has not been recognised in the profit and loss account.
NOTES TO THE FINANCIAL STATEMENTS31 DECEMBER 2004

p.72
31. Contingent liabilities and commitments (cont’d)
(b) Capital expenditure commitments
Group Company2004 2003 2004 2003$’000 $’000 $’000 $’000
Commitments in respect of purchase of fixed assets 8,625 1,551 1,041 428
(c) Operating lease commitments
The Group and the Company have various operating lease agreements for factory sites, offices, staff accommodation and equipment.Most leases contain renewable options. Lease terms do not contain restrictions on the Group’s activities concerning dividends, additionaldebt or further leasing.
Future minimum rentals under non-cancellable leases are as follows:
Group Company2004 2003 2004 2003$’000 $’000 $’000 $’000
Future minimum lease payments- not later than 1 year 6,249 5,223 400 400- 1 year through 5 years 12,239 10,111 1,601 1,601- later than 5 years 19,097 18,778 18,680 19,081
37,585 34,112 20,681 21,082
(d) Litigation
As disclosed in the previous financial year, there is a claim from Hytech Builders Pte Ltd (“Hytech”) in relation to the Company’s leaseholdproperty at 11, International Business Park, Jurong East, Singapore 609926 (the “Project”) amounting to approximately $1.0 million for thebalance construction sum due. The Company and Hytech are negotiating to settle these claims. No provision has been made for theliability that may arise from the potential settlement as the directors do not expect any material loss to result from it.
NOTES TO THE FINANCIAL STATEMENTS31 DECEMBER 2004

Hi-P International Limited : annual report 2004 p.73
32. Related party information
In addition to the related party information disclosed elsewhere, transactions with related parties, on terms agreed between the parties, wereas follows:
Group Company2004 2003 2004 2003$’000 $’000 $’000 $’000
Income
Sales to a corporate shareholder andcompanies related to it 1,018 1,149 - -
Sales to minority shareholder of a subsidiaryand companies related to it 10,486 2,630 - -
Sales to subsidiaries - - 167 243Dividend income from unquoted subsidiaries - - 2,894 10,772
Expenses
Purchases of materials from a corporateshareholder and companies related to it 1,445 1,332 - -
Purchases of materials from minority shareholderof a subsidiary and companies related to it 7,258 6,493 - -
Purchases from subsidiaries - - 98 884Remuneration paid to Directors 3,772 2,209 3,772 2,209Remuneration paid to other key management personnel 2,353 1,770 1,364 1,134Management fee paid to subsidiary - - 374 271
33. Financial risk management objectives and policies
The main risks arising from the Group’s financial instruments are interest rate risk, liquidity risk, foreign currency risk and credit risk. Thepolicies for managing each of these risks are summarised below.
Interest rate risk
The Group obtains additional financing through bank borrowings and leasing arrangements. The Group’s policy is to obtain the most favourableinterest rates available without increasing its foreign currency exposure.
The Group’s policy is to manage its interest cost using a mix of fixed and floating rate debts. To manage this mix in a cost-efficient manner, theGroup enters into interest rate swaps. The interest rate swaps allow the Group to raise long term borrowings at either fixed or floating ratesand swap them into floating and fixed rates respectively, with the objective of lowering the interest costs on these borrowings.
Surplus funds are placed with reputable banks.
Information relating to the Group’s interest rate exposure is also disclosed in the notes on the Group’s borrowings, including leasing obligations.
NOTES TO THE FINANCIAL STATEMENTS31 DECEMBER 2004

p.74
33. Financial risk management objectives and policies (cont’d)
Liquidity risk
In the management of liquidity risk, the Group monitors and maintains a level of cash and cash equivalents deemed adequate by the directorsto finance the Group’s operations and mitigate the effects of fluctuations in cash flows.
Short-term funding is obtained from banking facilities.
Foreign exchange risk
The foreign exchange risk of the Group arises from its subsidiaries operating in the People’s Republic of China and Mexico, which generaterevenue and incur costs denominated in foreign currencies. The Company also generates revenue and incurs costs in foreign currencies, whichgive rise to foreign exchange risk. The Group enters into forward exchange contracts to hedge against its foreign exchange risk resulting fromsales and purchase transactions denominated in foreign currencies.
The Group manages its foreign exchange exposure risk by matching, as far as possible, receipts and payments in each individual currency.Foreign currency is converted into the relevant measurement currency as and when management deems necessary. The unhedged exposure isreviewed and monitored closely on an ongoing basis and management will consider hedging any exposure where appropriate.
Credit risk
The carrying amount of cash and cash equivalents, trade receivables and other receivables represent the Group’s maximum exposure to creditrisk in relation to financial assets. No other financial assets carry a significant exposure to credit risk.
The Group has no significant concentration of credit risk.
Fair value
Fair value is defined as the amount at which the financial instrument could be exchanged in a current transaction between knowledgeablewilling parties in an arm’s length transaction, other than in a forced or liquidation sale. Fair values are obtained from quoted market prices,discounted cash flow models and option pricing models where practical.
The following methods and assumptions are used to estimate the fair value of each class of financial instrument:
Cash and cash equivalents, other current assets and current liabilities
The carrying amount approximates fair value due to the relatively short-term maturity of these financial instruments.
Bank term loans
The fair value of the non-current portions of bank term loans with variable interest rates approximate their carrying amounts.
NOTES TO THE FINANCIAL STATEMENTS31 DECEMBER 2004

Hi-P International Limited : annual report 2004 p.75
33. Financial risk management objectives and policies (cont’d)
Lease obligations
The fair values of these financial instruments approximate the carrying amounts after discounting the relevant cash flows using current interestrates for similar instruments at balance sheet date.
Disclosure of the nature of financial instruments and their significant terms and conditions that could affect the amount, timing and certaintyof future cash flow is presented in the respective notes to the financial statements, where applicable.
Derivatives and other financial instruments
The fair value of the interest rate swap contract as at 31 December 2004 is as follows:Estimated
Notional negativeamount fair value
$’000 $’000
Interest rate swap 2,081 47
The Group enters in forward foreign currency contracts to eliminate the currency exposures that arise from fixed asset purchases denominatedin foreign currencies. Changes in the fair value of instruments used as hedges are not recognised in the financial statements until the hedgedposition matures.
The fair value of the forward foreign currency contracts as at 31 December 2004 is as follows:Notional Unrecognisedamount gain
$’000 $’000
Forward foreign currency contracts 4,249 183
34. Segment information
(a) Business segments
The Group is organised into three main operating activities, namely:
- Precision plastic injection molding (“PPIM”)- Mold design and fabrication (“MDF”)- Provision of sub-product assembly and full-product assembly services (“Assembly”)
Segment assets and liabilities cannot be directly attributable to individual business segments and it is impractical to allocate them to thebusiness segments. Accordingly, it is not meaningful to disclose assets, liabilities and capital expenditure by business segments.
NOTES TO THE FINANCIAL STATEMENTS31 DECEMBER 2004

p.76
34. Segment information (cont’d)
(a) Business segments (cont’d)
PPIM MDF Assembly Eliminations Consolidated$’000 $’000 $’000 $’000 $’000
2004Segment revenueSales to external customers 248,140 41,447 271,344 - 560,931Inter-segment sales 20,813 - - (20,813) -
268,953 41,447 271,344 (20,813) 560,931
Profit from operations 59,569 8,402 26,558 - 94,529Financial expenses (1,302)Financial income 343Foreign exchange loss, net (1,548)Share of results of
associated companies 355Tax (3,113)Minority interests (1,211)
Net profit 88,053
Depreciation 11,873 1,675 5,293 - 18,841Other non-cash expenses 5,639 795 2,514 - 8,948
2003Segment revenueSales to external customers 104,722 32,571 111,653 - 248,946Inter-segment sales 25,982 - - (25,982) -
130,704 32,571 111,653 (25,982) 248,946
Profit from operations 22,269 5,715 14,980 - 42,964Financial expenses (1,929)Financial income 176Foreign exchange loss, net (1,292)Share of results of
associated companies 337Tax (2,911)Minority interests (759)
Net profit 36,586
Depreciation 6,358 2,623 4,276 - 13,257Other non-cash expenses 1,737 446 1,168 - 3,351Fixed assets impairment loss 103 - - - 103
NOTES TO THE FINANCIAL STATEMENTS31 DECEMBER 2004

Hi-P International Limited : annual report 2004 p.77
NOTES TO THE FINANCIAL STATEMENTS31 DECEMBER 2004
34. Segment information (cont’d)
(b) Geographical segments
Revenue is based on the location of customers. Assets and additions to property, plant and equipment are based on the location of thoseassets.
Revenue Assets Capital expenditure2004 2003 2004 2003 2004 2003$’000 $’000 $’000 $’000 $’000 $’000
AsiaPeople’s Republic
of China 290,255 136,814 253,154 193,253 58,000 51,739Singapore 80,075 32,760 146,277 116,703 2,874 3,131Malaysia 4,949 5,146 - - - -Others 4,919 6,375 - - - -
380,198 181,095 399,431 309,956 60,874 54,870Europe 156,100 46,879 127 35 - 11United States
and the restof Americas 24,633 20,972 6,025 6,640 216 299
Others - - 37,866 25,828 126 -
560,931 248,946 443,449 342,459 61,216 55,180
35. Authorisation of financial statements
The financial statements for the year ended 31 December 2004 were authorised for issue in accordance with a resolution of the Directors on16 March 2005.

p.78
Authorised Share Capital : $100,000,000Issued and Fully Paid-up Capital : $44,350,000Number of Shares : 887,000,000Class of Shares : Ordinary shares at $0.05 eachVoting Rights : One vote per share
Size of Shareholdings No. ofShareholders % No. of Shares %
1 - 999 3 0.16 440 0.001,000 - 10,000 1,443 75.83 7,668,000 0.8710,001 - 1,000,000 434 22.80 25,226,000 2.841,000,001 and above 23 1.21 854,105,560 96.29
Total 1,903 100.00 887,000,000 100.00
Substantial Shareholders
Substantial shareholders as recorded in the Register of Substantial Shareholders
Name Direct Interest % Deemed Interest %
Yao Hsiao Tung 486,955,600 54.90 - -Wong Huey Fang - - 486,955,600 54.90 *Molex International Inc 178,924,400 20.17 - -Molex Incorporated - - 178,924,400 20.17 #
* Mdm Wong Huey Fang is the spouse of Mr Yao Hsiao Tung. As such, Mdm Wong Huey Fang is deemed to have an interest in the 486,955,600 shares held
by Mr Yao Hsiao Tung.
# Molex International Inc is a subsidiary of Molex Incorporated. As such, Molex Incorporated is deemed to have an interest in the 178,924,400 shares held by
Molex International Inc.
STATISTICS OF SHAREHOLDINGSAS AT 15 MARCH 2005

Hi-P International Limited : annual report 2004 p.79
Twenty Largest Shareholders
No. Name No. of Shares %
1 Yao Hsiao Tung 481,955,600 54.342 Molex International Inc 178,924,400 20.173 DBS Nominees Pte Ltd 66,267,000 7.474 Citibank Nominees Singapore Pte Ltd 48,846,900 5.515 Raffles Nominees Pte Ltd 27,317,745 3.086 United Overseas Bank Nominees Pte Ltd 13,514,500 1.527 HSBC (Singapore) Nominees Pte Ltd 10,766,000 1.218 UOB Kay Hian Pte Ltd 3,614,000 0.419 Chan Hean Wee 2,140,000 0.2410 DB Nominees (S) Pte Ltd 1,932,915 0.2211 Kim Eng Securities Pte. Ltd. 1,915,000 0.2212 Ho Teck Heng 1,700,000 0.1913 Ho Hock Yong 1,690,000 0.1914 The Asia Life Assurance Society Ltd - Par Fund 1,635,000 0.1815 Tan Tor Howe 1,590,000 0.1816 Chew Poh Chee 1,550,000 0.1717 Phillip Securities Pte Ltd 1,357,000 0.1518 Lee Kam Choon 1,300,000 0.1519 Szeto Tzen 1,282,000 0.1420 Morgan Stanley Asia (S’pore) Securities Pte Ltd 1,242,500 0.14
Total 850,540,560 95.88
Free Float
As at 15 March 2005, approximately 24.7% of the issued share capital of the Company was held in the hands of the public (on the basis ofinformation available to the Company).
Accordingly, the Company has complied with Rule 723 of the Listing Manual of the Singapore Exchange Securities Trading Limited.
STATISTICS OF SHAREHOLDINGSAS AT 15 MARCH 2005

p.80
NOTICE OF ANNUAL GENERAL MEETING
Ordinary Business
1. To receive and adopt the Directors’ Report and Audited Accounts of the Company for the year ended31 December 2004 together with the Auditors’ Report thereon.
2. To declare a first and final dividend of 1.0 Singapore cent per share less income tax for the year ended31 December 2004.
3. To re-elect the following Directors retiring pursuant to Articles 91 and 97 of the Company’s Articles of Association:
Mr Yao Hsiao Tung [Article 91]Dr Tan Khee Giap [Article 91]Mr Chester Lin Chien [Article 97]
Dr Tan Khee Giap will, upon re-election as a Director of the Company, remain as a member of the AuditCommittee and will be considered independent for the purposes of Rule 704(8) of the Listing Manual ofthe Singapore Exchange Securities Trading Limited.
4. To approve the payment of Directors’ fees of S$338,000.00 for the year ended 31 December 2004.(2003: S$34,000.00)
5. To re-appoint Messrs Ernst & Young as the Company’s Auditors and to authorise the Directors to fix theirremuneration.
6. To transact any other ordinary business which may properly be transacted at an Annual General Meeting.
Special Business
To consider and, if thought fit, to pass the following resolutions as Ordinary Resolutions, with or without anymodifications:
7. Authority to allot and issue shares up to fifty per cent. (50%) of issued capital
“That, pursuant to Section 161 of the Companies Act, Cap. 50 and Rule 806(2) of the Listing Manual of theSingapore Exchange Securities Trading Limited (the “Listing Manual”), authority be and is hereby given to theDirectors to:-
(a) allot and issue shares in the Company; and
(b) issue convertible securities and any shares in the Company pursuant to convertible securities
(whether by way of rights, bonus or otherwise) at any time and upon such terms and conditions and for suchpurposes and to such persons as the Directors shall in their absolute discretion deem fit, provided that theaggregate number of shares (including any shares to be issued pursuant to the convertible securities) in theCompany to be issued pursuant to such authority shall not exceed fifty per cent. (50%) of the issued sharecapital of the Company for the time being and that the aggregate number of shares in the Company to beissued other than on a pro-rata basis to the then existing shareholders of the Company shall not exceedtwenty per cent. (20%) of the issued share capital of the Company for the time being. Unless revoked or variedby the Company in general meeting, such authority shall continue in full force until the conclusion of the nextAnnual General Meeting of the Company or the date by which the next Annual General Meeting is required bylaw to be held, whichever is the earlier, except that the Directors shall be authorised to allot and issue newshares pursuant to the convertible securities notwithstanding that such authority has ceased.
(Resolution 1)
(Resolution 2)
(Resolution 3)(Resolution 4)(Resolution 5)
(Resolution 6)
(Resolution 7)
(Resolution 8)
NOTICE IS HEREBY GIVEN that the Annual General Meeting of Hi-P International Limited (the “Company”) will be held atMeritus Mandarin Singapore, Meeting Room 832, 8th floor, South Tower, 333 Orchard Road, Singapore 238867, on Thursday, 28 April 2005at 5.30 p.m. for the following purposes:

Hi-P International Limited : annual report 2004 p.81
NOTICE OF ANNUAL GENERAL MEETING
For the purposes of this Resolution and Rule 806(3) of the Listing Manual, the percentage of issued sharecapital is based on the issued share capital of the Company at the time this Resolution is passed after adjustingfor:-
(i) new shares arising from the conversion or exercise of convertible securities;
(ii) new shares arising from exercising share options or vesting of share awards outstanding or subsisting atthe time of the passing of this Resolution, provided the options or awards were granted in compliancewith the rules of the Listing Manual; and
(iii) any subsequent consolidation or subdivision of shares.” [See Explanatory Note (i)]
8. Authority to grant options and issue shares under the Hi-P Employee Share Option Scheme
“That pursuant to Section 161 of the Companies Act, Cap. 50, the Directors of the Company be and are herebyauthorised to offer and grant options in accordance with the Hi-P Employee Share Option Scheme (the “Scheme”)and to issue such shares as may be required to be issued pursuant to the exercise of the options granted underthe Scheme provided always that the aggregate number of shares to be issued pursuant to the Scheme shallnot exceed fifteen per cent. (15%) of the issued share capital of the Company from time to time.”[See Explanatory Note (ii)]
By Order of the Board
Tan Tor HoweCompany Secretary
Singapore, 11 April 2005
(Resolution 9)

p.82
Explanatory Notes:
(i) The Ordinary Resolution 8 proposed in item 7 above, if passed, will empower the Directors from the date of the above Meeting until the dateof the next Annual General Meeting, to allot and issue shares and convertible securities in the Company. The aggregate number of shares(including any shares issued pursuant to the convertible securities) which the Directors may allot and issue under this Resolution will notexceed fifty per cent. (50%) of the issued share capital (as defined in Resolution 8) of the Company. For issues of shares other than on a pro ratabasis to all shareholders, the aggregate number of shares to be issued shall not exceed twenty per cent. (20%) of the issued share capital (asdefined in Resolution 8) of the Company. This authority will, unless previously revoked or varied at a general meeting, expire at the next AnnualGeneral Meeting of the Company or the date by which the next Annual General Meeting of the Company is required by law to be held,whichever is the earlier. However, notwithstanding the cessation of this authority, the Directors are empowered to issue shares pursuant toany convertible securities issued under this authority.
(ii) The Ordinary Resolution 9 proposed in item 8 above, if passed, will empower the Directors of the Company, to grant options and to allot andissue shares upon the exercise of such options in accordance with the Hi-P Employee Share Option Scheme.
Notes:
1. A member entitled to attend and vote at the Meeting is entitled to appoint a proxy to attend and vote instead of him. A proxy need not be amember of the Company.
2. If the appointor is a corporation, the proxy must be executed under seal or the hand of its duly authorised officer or attorney.
3. The instrument appointing a proxy must be deposited at the registered office of the Company at 11 International Business Park, Singapore609926 not less than forty-eight (48) hours before the time for holding the Meeting.
NOTICE OF ANNUAL GENERAL MEETING

Hi-P International Limited : annual report 2004 p.83
HI-P INTERNATIONAL LIMITEDCompany Registration Number 198004817H
(Incorporated in the Republic of Singapore)
PROXY FORM
I/We (Name)
of (Address)
being a member/members of HI-P INTERNATIONAL LIMITED (the “Company”) hereby appoint:
Name Address NRIC/Passport Proportion ofNumber Shareholdings (%)
and/or (delete as appropriate)
Name Address NRIC/Passport Proportion ofNumber Shareholdings (%)
as my/our proxy/proxies to vote for me/us on my/our behalf, at the Annual General Meeting of the Company (the “Meeting”) to be held atMeritus Mandarin Singapore, Meeting Room 832, 8th floor, South Tower, 333 Orchard Road, Singapore 238867, on Thursday, 28 April 2005,at 5.30 p.m. and at any adjournment thereof. I/We direct my/our proxy/proxies to vote for or against the Resolutions to be proposed at theMeeting as indicated hereunder. If no specific direction as to voting is given, the proxy/proxies will vote or abstain from voting at his/theirdiscretion, as he/they will on any matter arising at the Meeting.
No. Resolutions Relating to: For Against
1. Directors’ Report and Accounts for the year ended 31 December 2004
2. Payment of proposed first and final dividend
3. Re-election of Mr Yao Hsiao Tung
4. Re-election of Dr Tan Khee Giap
5. Re-election of Mr Chester Lin Chien
6. Approval of Directors’ fees
7. Re-appointment of Messrs Ernst & Young as Auditors
8. Authority to issue and allot shares pursuant to Section 161 of the Companies Act, Cap. 50
9. Authority to grant options and issue shares under the Hi-P Employee Share Option Scheme
Dated this day of 2005.
Total No. of Shares No. of Shares
In CDP Register
In Register of MembersSignature(s) of Member(s)or, Common Seal of Corporate Member
IMPORTANT: PLEASE READ NOTES OVERLEAF
p.84
NOTES
1. A member entitled to attend and vote at the Meeting is entitled to appoint one or two proxies to attend and vote in his stead.
2. Where a member appoints more than one proxy, the appointments shall be invalid unless he specifies the proportion of his holding(expressed as a percentage of the whole) to be represented by each proxy.
3. A proxy need not be a member of the Company.
4. A member should insert the total number of shares held. If the member has shares entered against his name in the Depository Register(as defined in Section 130A of the Companies Act, Cap. 50 of Singapore), he should insert that number of shares. If the member hasshares registered in his name in the Register of Members of the Company, he should insert that number of shares. If the member hasshares entered against his name in the Depository Register and registered in his name in the Register of Members, he should insert theaggregate number of shares. If no number is inserted, this form of proxy will be deemed to relate to all shares held by the member.
5. The instrument appointing a proxy or proxies must be deposited at the Company’s registered office at 11 International Business Park,Singapore 609926, not less than 48 hours before the time set for the Meeting.
6. The instrument appointing a proxy or proxies must be under the hand of the appointor or of his attorney duly authorised in writing. Wherethe instrument appointing a proxy or proxies is executed by a corporation, it must be executed either under its common seal or under thehand of its attorney or a duly authorised officer.
7. Where an instrument appointing a proxy is signed on behalf of the appointor by an attorney, the letter or power of attorney or a dulycertified copy thereof must (failing previous registration with the Company) be lodged with the instrument of proxy, failing which theinstrument may be treated as invalid.
GENERAL:
The Company shall be entitled to reject a proxy form which is incomplete, improperly completed, illegible or where the true intentions of theappointor are not ascertainable from the instructions of the appointor specified on the proxy form. In addition, in the case of shares entered inthe Depository Register, the Company may reject a proxy form if the member, being the appointor, is not shown to have shares entered againsthis name in the Depository Register as at 48 hours before the time appointed for holding the Meeting, as certified by The Central Depository(Pte) Limited to the Company.

CORPORATE INFORMATION
Executive Directors
Yao Hsiao TungChairman and Chief Executive Officer(Appointed 21 May 1983)
Wong Huey Fang(Appointed 21 January 1988)
Non-Executive Directors
Yeo Tiong Eng(Appointed 1 April 1987)
Chester Lin Chien(Appointed 4 August 2004)
Independent Directors
Dr Tan Khee Giap(Appointed 5 November 2003)
Wong Meng Meng(Appointed 5 November 2003)
Audit Committee
Wong Meng MengChairman
Dr Tan Khee Giap
Yeo Tiong Eng
Remuneration Committee
Wong Meng MengChairman
Yao Hsiao Tung
Dr Tan Khee Giap
Nominating Committee
Dr Tan Khee GiapChairman
Yeo Tiong Eng
Wong Meng Meng
Company Secretary
Philip Tan Tor HoweCPA, CFA
Registered Office
11 International Business ParkJurong EastSingapore 609926tel: 65-6268 5459fax: 65-6564 1787web-site: www.hi-p.com
Share Registrar
Lim Associates (Pte) Ltd10 Collyer Quay #19-08Ocean BuildingSingapore 049315
Auditor
Ernst & YoungCertified Public Accountants10 Collyer Quay #21-01Ocean BuildingSingapore 049315
Audit Partner-in-charge
Max Loh Khum Whai(Appointed since financial year ended 31 December 2002)

11 International Business Park Jurong East S ingapore 609926
Hi-P International Limited
Company Registration Number: 198004817H

An
nu
al Rep
ort 2
00
4U
nifyin
g O
ur A
spiratio
ns
Hi-P
Intern
ation
al Limited