assay developments for detection of biological analytes
TRANSCRIPT

This document is downloaded from DR‑NTU (https://dr.ntu.edu.sg)Nanyang Technological University, Singapore.
Assay developments for detection of biologicalanalytes
Tan, Jiajun
2019
Tan, J. (2019). Assay developments for detection of biological analytes. Doctoral thesis,Nanyang Technological University, Singapore.
https://hdl.handle.net/10356/143757
https://doi.org/10.32657/10356/143757
This work is licensed under a Creative Commons Attribution‑NonCommercial 4.0International License (CC BY‑NC 4.0).
Downloaded on 12 Mar 2022 17:52:42 SGT
Assay Developments for Detection of Biological
Analytes
JIAJUN TAN
International Graduate School BioNanoTech
Universität für Bodenkultur Wien, Austria
School of Chemical and Biomedical Engineering
Nanyang Technological University, Singapore
A thesis submitted to the Nanyang Technology University and Universität für
Bodenkultur Wien in partial fulfilment of the requirement for the degree of
Doctor of Philosophy
2019

Statement of Originality
I hereby certify that the work embodied in this thesis is the result
of original research, is free of plagiarised materials, and has not
been submitted for a higher degree to any other University or
Institution.
15/11/2019
. . . . . . . . . . . . . . . . . . . . . . . . . . . . . . . . . . .
Date Jiajun Tan

ii
Supervisor Declaration Statement
I have reviewed the content and presentation style of this thesis
and declare it is free of plagiarism and of sufficient grammatical
clarity to be examined. To the best of my knowledge, the
research and writing are those of the candidate except as
acknowledged in the Author Attribution Statement. I confirm
that the investigations were conducted in accord with the ethics
policies and integrity standards of Nanyang Technological
University and that the research data are presented honestly and
without prejudice.
15/11/2019
. . . . . . . . . . . . . . . . . . . . . . . . . . . . . . . . . . .
Date Sierin Lim

iii
Authorship Attribution Statement
This thesis contains material from two papers published and one
accepted and still in press paper in the following peer-reviewed journals in
which I am listed as an author.
Chapter 2 contains materials published as:
1. Y Fang, J Tan, H Choi, S Lim, DH Kim. Highly sensitive naked eye
detection of Iron (III) and H2O2 using poly-(tannic acid) (PTA) coated Au
nanocomposite. Sensors and Actuators B: Chemical 2018 259, 155-161;
as well as
2. Y Fang, J Tan, T Lan, SGF Foo, DG Pyun, S Lim, DH Kim. Universal one-
pot, one-step synthesis of core–shell nanocomposites with self-assembled
tannic acid shell and their antibacterial and catalytic activities. Journal of
Applied Polymer Science 2018 135 (6), 45829
Chapter 3 contains materials published as:
3. J Tan, V Zaremska, S Lim, W Knoll, P Pelosi. Probe-dependence of
competitive fluorescent ligand binding assays to odorant-binding proteins.
Analytical and Bioanalytical Chemistry 2020 412, 546-554
The contributions of the co-authors are as follows:
For the first paper:
Y Fang and J Tan planned the experiments, conducted the experiments and
wrote the paper. H Choi conducted experiments and wrote the paper. S Lim
and DH Kim planned the experiments and wrote the paper.
For the second paper:
Y Fang and J Tan planned the experiments, conducted the experiments and
wrote the paper. T Lan and SGF Foo conducted experiments. DG Pyun
conducted experiments and wrote the paper. S Lim and DH Kim planned
the experiments and wrote the paper.

iv
For the third paper:
P Pelosi and W Knoll conceived and supervised the study. J Tan and V
Zaremska designed and performed experiments. W Knoll provided new
tools and reagents. S Lim and P Pelosi analyzed data. P Pelosi and W Knoll
wrote the manuscript. All authors revised and approved the manuscript.
15/11/2019
. . . . . . . . . . . . . . . . . . . . . . . . . . . . . . . . . . .
Date Jiajun Tan

v
DEDICATIONS
Many shall run to and fro, and knowledge shall be increased – Daniel
12:4
I dedicate this thesis to my family members – parents and sister, as well
as to my girlfriend, for they have ran to and fro during my candidature period,
in order that I may discover, learn, and improve.
The secret things belong unto the LORD our God: but those things which
are revealed belong unto us and to our children for ever – Deuteronomy 29:29
I also dedicate this thesis to God.

vi
ACKNOWLEDGEMENTS
First, I would like to thank my thesis supervisor, Professor Sierin Lim
from NTU and Professor Wolfgang Knoll from AIT. They have been
instrumental in helping me succeed in this thesis, scientifically, logistically and
administratively. Second, I would like to thank my collaborators who have
helped me to further my scientific world view: Professor Paolo Pelosi, AIT,
Professor Fang Yan, who is now at Nanjing Tech University, and Professor
Erik Reimhult, BOKU. They have provided not only scientific help, but also
have been a friend. Third, special mention to Dr Darren Tan from BOKU who
has provided me scientific counsel from a ‘third person’ point of view, which
was very necessary at times. Fourth, I would like to thank my collaborators who
have published papers with me, Prof Richie Kim, SKKU, Prof Soh Siow Ling,
NUS, Dr Do Gi Pyun, Ms Lan Tian, Mr Stanley Foo, Mr Hyunjun Choi, and
Ms Valeriia Zaremska, AIT. Fifth, thank you to Prof Klaus Erik Karjalainen,
NTU, and Prof Nicole Borth, BOKU, for their very crucial advices on the
design of the CAR. Sixth, thank you to my thesis advisory committee, Prof
Duan Hong Wei and Prof Ali Miserez, both from NTU.
I would like to thank the various people from the many labs that I have
been to. From AIT: Ms Zhu Jiao, Ms Chiara D’Onofrio, Ms Isabella Fischer,
Mr Patrik Aspermair, Dr Jakob Andersson, Dr Johannes Bintinger, Mr Ulrich
Ramach, Dr Jokub Dostalek, Mr Stefan Fossati, Mrs Daria Golebiowski, Ms
Simone Hageneder, Ms Simone Katharina, Ms Vanessa Priscilla, Ms Anne
Schuchanegg, Mr Anil Bozdogan, Mr Gonzalo Fenoy, Dr Filippo Fedi, Mr
Nestor Imodaba, Dr Priya Venugopalan, Dr Simone Fortnati, Mr Estaban

vii
Piccinini, Dr Mark Kreuzera, and administrator, Ms Krissalis Alexandra. They
were like a home away from home. From BOKU, Ms Andrea Scheberl, Dr
Monika Debreczeny, Dr Markus Tomek, Dr Arturo Lopez, Dr Susanne Bloch,
Dr Martina Schroffenegger, Ms Fiona Hager, Ms Valentina Mayer, and Dr
Christina Schaeffer. From Biotrans department in ASTAR, Dr Nic Lindley, Dr
Ann Koay, Dr Seetoh Wei Guang, Ms Guo Wei Mei, and Ms Tan Shi Min. And
most importantly, from the labs in NTU, Dr Ambrish Kumar, Dr Yu Kang, Dr
Herlina Arinaita Dewi, Ms Thinzar Win, Mr Vishnu Vadanan, Dr Sagar Regmi,
Dr Mridul Sarker, Dr Rupali Reddy, Mr Sathya Bhaskar, Ms Xu Xiaohan, Dr
Fu Afu, Dr Geraldine Chiew, Dr Ma Shijun, Ms Sam Ravi, Ms Juhi Singh, Dr
Usha Rani, Ms Tabitha Tan, Dr Pham Thao, Dr Kate Qi, and Dr Johnathan
Wolfe. Thank you also to two good friends who journeyed with me up from our
undergraduate days to also partake in doing a PhD program, Ms Su Chengxun
and Mr Brendan Sieow. They have been good listening ears, giving helpful
scientific discussions.
Thank you very much also to the persons who are/were in this
International Graduate School joint degree program with me. You guys were
not only friends and fellow professionals, but hardened sojourners. Vielen
Dank. This is to: Dr Stefanie Hackl, Dr Thomas Zapf, Dr Oliver Bixner, Mr
Nikolaus Leitner, and Dr Bo-Kyeong Yoon. Also thank you to Prof Bo
Liedberg for being the program coordinator.
Lastly, thank you to my parents and sister. And also my girlfriend,
Elaine Lum for having made the journey sweeter!
Dankeschön für alles. Ohne euch alle hätte ich das nicht geschafft.

viii
SUMMARY
Various ligands and analytes interact with biological systems in many
ways. In certain cases, they may cause harm to the body. The detection of these
ligands and analytes are therefore crucial. Their different physical and chemical
properties require unique strategies and methods for the detection of these
substances. This thesis demonstrates three different methods for different
classes of substances such as ions and molecules of sizes below 100 Daltons to
proteins in the range of 100 kilo-Daltons.
Iron ions are important as intermediaries in bodily chemical reactions.
Furthermore, they also play a crucial role in haemoglobin for oxygen transport
in blood. Distinction between the two oxidation states is crucial as the
homeostasis of iron ions is crucial for bodily functions. Here, a tannic acid
shell, gold core nanocomposite was developed to detect Iron (III) ions. The
nanocomposites are synthesized by a one-step one-pot synthesis method
wherein the reduction of gold salt and oxidation of tannic acid to poly tannic
acid shell takes place simultaneously. The chelation of Iron (III) (but not Iron
(II)) to tannic acid results in the aggregation of the nanocomposites driving a
distinct colour change from red to blue that is visible with the naked eye at a
limit of detection of 5 M. The chelation is further exploited to detect H2O2 as
H2O2 oxidizes Iron (II) ions to Iron (III), driving the chelation. The naked eye
visible colour change for H2O2 detection is 0.4 M. While tannic acid-gold core
nanocomposites show good utility for iron ion detections, other chemicals such
as odorants require different approaches.
ix
Odorants are hydrophobic and do not chelate with tannic acid. In nature,
these chemicals require the odorant binding protein for detection where they
enter the binding pockets of odorant binding protein. To detect these odorants
outside their natural environment, pig odorant binding protein (OBP) was
produced recombinantly using an E. coli expression system. We hypothesized
that the deletion of the alpha helix tail domain the in pig OBP would improve
binding of odorants to the pig OBP and increase the pig OBP’s sensitivity to the
odorants. This is because the tail is positioned at the entrance of the binding
pocket and appears to act as a gate hindering odorants from readily entering the
binding pocket. DNA cloning was done to delete the alpha helix tail. We found
that the absence of the tail domain in fact lowers the binding affinity and
increases the dissociation constant by between 32% and 434%. This data
suggests that the alpha helix tail is crucial in providing stability for the ligand
attachment to the binding pocket of the protein. In other words, removing the
tail lowers the entropy of the system.
Detection of more complex molecules, such as protein biomarkers will
require proteins other than odorant binding proteins as these molecules are too
large to enter the binding pocket of the OBPs. Their binding to other proteins
that act as receptors also depend on their geometry charges and hydrophilicity.
Here we worked to develop a cell-based assay for detecting such molecules.
Cell-based assays are more advantageous then conventional system such as
SPR and ELISA as it eliminates signals from unspecific binding. The cell-based
assay is operated by presenting a CAR on the surface of the cell. The scFv
antibody domain of the CAR serves as the receptor site. When a molecular
biomarker binds to the CAR, it should cause a cross-linking and

x
phosphorylation of the CAR followed by an intracellular signalling that can be
coupled to various outputs (e.g. calcium influx, gene transcription). Here, our
designed CAR is intended to bind the ligand epidermal growth factor receptor
(EGFR-CAR). We show using confocal images that the CAR is presented on
the surface of HEK293FT cells. Additionally, EGFR also binds to the expressed
CAR. However, the expected calcium influx and phosphorylation upon ligand
binding were not apparent suggesting that the absence of intracellular cell
signalling taking place. The data suggest challenges for connecting the
extracellular binding event of the EGFR-CAR to the intracellular signalling in
the intended cell that need to be overcome for future development of cell-based
assay.

xi
CURRICULUM VITAE
JIAJUN TAN
EDUCATION:
2014 – Present Ph.D. in Bioengineering
School of Chemical and Biomedical Engineering,
Nanyang Technological University, Singapore
International Graduate School BioNanoTech,
Universität für Bodenkultur Wien, Austria
2010 – 2014 Bachelors in Engineering (Bioengineering)
School of Chemical and Biomedical Engineering,
Nanyang Technological University, Singapore
PUBLICATIONS:
1. Y Fang*, J Tan*, H Choi, S Lim, DH Kim. Highly sensitive naked eye
detection of Iron (III) and H2O2 using poly-(tannic acid) (PTA) coated
Au nanocomposite. Sensors and Actuators B: Chemical 2018 259, 155-
161
2. Y Fang*, J Tan*, T Lan, SGF Foo, DG Pyun, S Lim, DH Kim.
Universal one-pot, one-step synthesis of core–shell nanocomposites
with self-assembled tannic acid shell and their antibacterial and catalytic
activities. Journal of Applied Polymer Science 2018 135 (6), 45829
3. Y Fang*, J Tan*, S Lim, S Soh. Rupturing cancer cells by the
expansion of functionalized stimuli-responsive hydrogels. NPG Asia
Materials 2018 10 (2), e465
4. J Tan*, V Zaremska*, S Lim, W Knoll, P Pelosi. Probe-dependence of
competitive fluorescent ligand binding assays to odorant-binding
proteins. Analytical and Bioanalytical Chemistry 2020 412, 546-554
5. V Zaremska*, J Tan*, S Lim, W Knoll, P Pelosi. Isoleucine residues
determine chiral discrimination of odorant-binding protein. Chemistry–A
European Journal 2020

xii
* Denotes equal contribution
ACADEMIC AWARD:
1. 3rd Place Poster Award at 6th DocDay 2018, University of Natural
Resources and Life Sciences, Vienna
Poster Tittle: Engineering Cell Membrane Surface with Modular
Chimeric Receptors for a Cellular Sensor Platform

xiii
TABLE OF CONTENTS
STATEMENT OF ORIGINALITY ................................................................. i
SUPERVISOR DECLARATION STATEMENT .......................................... ii
AUTHORSHIP ATTRIBUTION STATEMENT ......................................... iii
DEDICATIONS ................................................................................................ v
ACKNOWLEDGEMENTS ............................................................................ vi
SUMMARY .................................................................................................... viii
CURRICULUM VITAE .................................................................................. xi
TABLE OF CONTENTS .............................................................................. xiii
LIST OF FIGURES ........................................................................................ xv
LIST OF ABBREVIATIONS ....................................................................... xxi
Chapter 1 ............................................................................................................ 1
Introduction
1.1 Introduction ................................................................................................ 1
1.2 Iron ............................................................................................................. 1
1.3 Hydrogen Peroxide ..................................................................................... 3
1.4 Polycyclic Aromatic Hydrocarbons ........................................................... 5
1.5 Odours ........................................................................................................ 6
1.6 Biomarkers ................................................................................................. 8
1.7 Thesis Outline .......................................................................................... 10
Chapter 2 .......................................................................................................... 12
Poly-(tannic acid) coated gold nanocomposite for naked eye
detection of Iron (III) and H202
2.1 Introduction .............................................................................................. 12
2.1.1 Nanoparticles ................................................................................ 14
2.1.2 Nanoparticles Synthesis ................................................................ 15
2.2 Results and Discussions ........................................................................... 17
2.2.1 Nanoparticles Synthesis ................................................................ 17
2.2.2 Fe3+ Detection ............................................................................... 21
2.2.3 H2O2 Detection .............................................................................. 27
2.3 Conclusion ................................................................................................ 32
2.4 Materials and Methods ............................................................................. 34

xiv
Chapter 3 .......................................................................................................... 37
On the odorant binding properties of the truncated pig Odorant
Binding Protein
3.1 Introduction .............................................................................................. 37
3.1.1 Odorant Binding Proteins ...................................................................... 38
3.1.2 Expression of Recombinant Proteins in E. coli ..................................... 43
3.1.3 Binding Properties ................................................................................. 46
3.2 Results and Discussions ........................................................................... 48
3.2.1 Expression and Purifications of Proteins .............................................. 48
3.2.2 End Point Binding Studies of Proteins .................................................. 51
3.3 Conclusion ................................................................................................ 56
3.4 Materials and Methods ............................................................................. 58
Chapter 4 .......................................................................................................... 61
Expression of Chimeric antigen receptors on the surface of
HEK293FT cells in the accurate orientation
4.1 Introduction .............................................................................................. 61
4.1.1 Cell Based Bioassays ............................................................................ 61
4.1.2 Chimeric Antigen Receptors and Immunotherapy ................................ 65
4.1.3 Chimeric Antigen Receptors for Detecting Soluble Antigens .............. 71
4.2 Results and Discussions ........................................................................... 72
4.2.1 Expression of CAR ................................................................................ 73
4.2.2 Antigen binding to CAR expressed on HEK293FT cells ..................... 76
4.2.3 Functionality of CAR ............................................................................ 77
4.2.4 Modularity of CAR ............................................................................... 82
4.3 Conclusion ................................................................................................ 84
4.4 Materials and Methods ............................................................................ 84
Chapter 5 .......................................................................................................... 91
Conclusion
References ......................................................................................................... 95
Appendix I ...................................................................................................... 126
Appendix II ..................................................................................................... 130

xv
LIST OF FIGURES
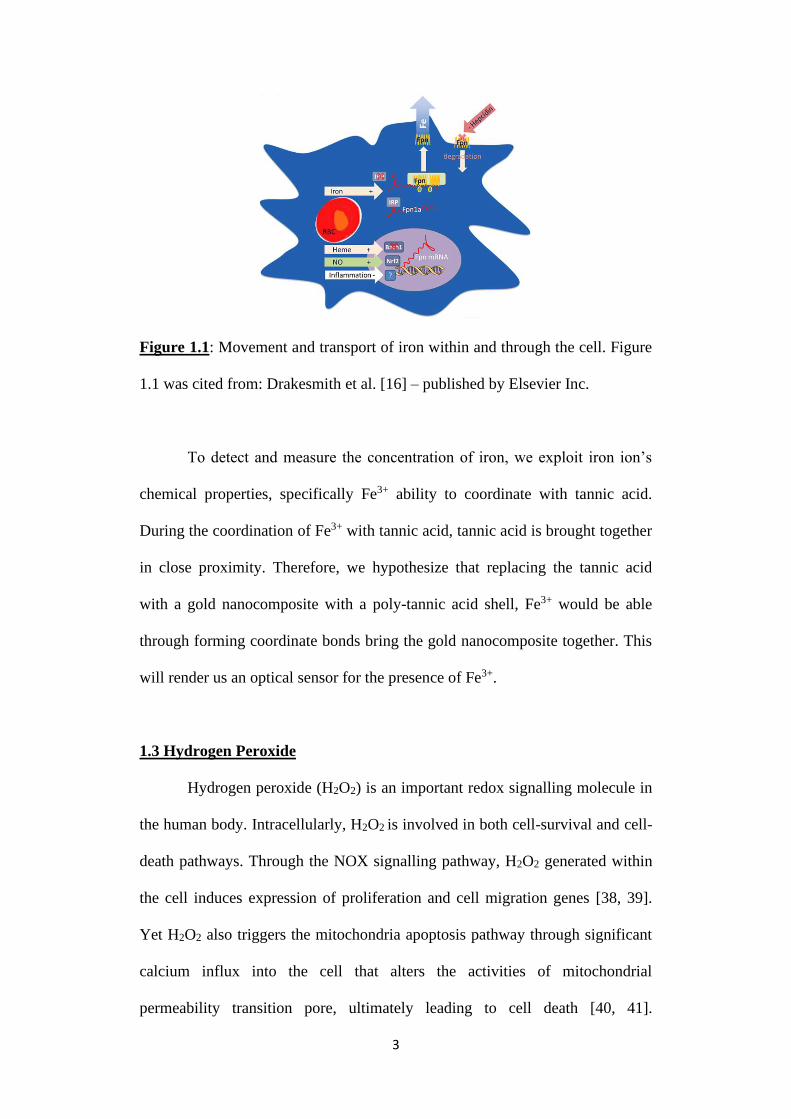
Figure 1.1: Movement and transport of iron within and through the cell. Figure
1.1 was cited from: Drakesmith, H., Nemeth, E. and Ganz, T. (2015). Ironing
out Ferroportin. Cell Metabolism, 22, p.777 – published by Elsevier Inc.
Figure 1.2: The activities of PAH towards DNA. Figure 1.2 was cited from:
Drwal, E., Rak, A. and Gregoraszczuk, E. L. (2019). Review: Polycyclic
aromatic hydrocarbons (PAHs) – Action on placental function and health risks
in future life of newborns. Toxicology, 411, p.132 – published by Elsevier B.V.
Figure 1.3: The interactions of T cell towards B cells and its effect in B cells.
Figure 1.3 was cited from: Crotty, S. (2015). A brief history of T cell help to B
cells. Nature Review Immunology, 14(3), p.185 – published by Springer
Nature.
Figure 2.1: a) Colour of Gold nanoparticles of varying diameters and b) the
corresponding extinction curves. Figures 2.1a and 2.1b are cited from: Subara,
D. and Jaswir, I. (2018). Gold Nanoparticles: Synthesis and application for
Halal Authentication in Meat and Meat Products. International Journal on
Advanced Science, Engineering and Information Technology, 8(4-2), p.1633 –
published by the Indonesian Society for Knowledge and Human Development.
Figure 2.2: Schematic depicting the metal@PTA nanocomposites formation.
The TA shell is the result of polymerized TA.
Figure 2.3: A photograph of the TA solutions under different pH conditions
after a 4 hours incubation at room temperature.
Figure 2.4: a) Table recording the relevant physical measurements of the
different NPs in varying synthesis conditions. b) UV-vis spectra of dispersed
Au@PTA and AuNPs. c) STEM images of Au@PTA. d) Element linear
mapping of Au@PTA. e) FTIR spectra of TA and Au@PTA. f) STEM image
of a single Au@PTA with inset, bare AuNPs.
Figure 2.5: TEM images of Au@PTA nanocomposites at varying time points
of its synthesis, a) 5 minutes, b) 10 minutes, c) 20 minutes. Corresponding
photographs of the nanocomposite at the varying time points of its synthesis is
attached at the bottom of each TEM images.
Figure 2.6: a) Photograph of the solution containing only Au@PTA
nanocomposites (left) and the same solution after the addition of Fe3+ (20 M)
(right). b) UV–vis spectra obtained from solutions of Au@PTA
nanocomposites (solid black line) and after 30 min incubation with Fe3+ (dashed
red line). Solid black line: Au@PTA nanocomposites without Fe3+, dashed red
line: Au@PTA nanocomposites with Fe3+. c) SEM images of Au@PTA
nanocomposites. d) SEM image of the Au@PTA nanocomposites after
incubation with Fe3+.

xvi
Figure 2.7: a) Photograph of the solutions containing Au@PTA incubated for 5
minutes with different concentrations Fe3+ (1 – 10 M). b) UV–vis spectra of
solutions of Au@PTA incubated with varying concentrations of Fe3+. c)
Calibration curve corresponding to part a (5 – 60 M). d) A calibration curve
corresponding to part a (40 − 200 M). Values were normalized by subtracting
from the A600 value at 35 M Fe3+ concentrations. Error bars represent the
standard deviations of three replicates. The lines represent best linear fits for the
respective curves. Furthest points are omitted in the fitting because they do not
fit the linear trend.
Figure 2.8: a) Photograph of solutions containing Au@PTA incubated with
different metal cations. Ion concentration of Na+, K+, Rb+, Ag+, Mg2+, Ca2+,
Zn2+, Fe2+, Co2+, Cu2+, Ni2+, Mn2+, Cd2+, Hg2+, Al3+, Cr3+, Nd3+, Gd3+, and Dy3+
is 50 M. [Fe3+] = 20 M. b) UV-Vis spectra obtained from solutions of
Au@PTA after adding different metal ions.
Figure 2.9: a) Tannic acid contains multiple galloyl groups which five of them
able to form coordinate bonds with metal ions. This makes tannic acid
polydentate. b) Each galloyl group of the polydentate tannic acid is able to form
a coordination bond with a metal ion. For some metal ion, they can form
coordination bond with two additional galloyl groups. This forms tri-
catecholate complexes c) In other metal ions, coordination bond only forms
with one additional galloyl group. This results in bi-cateholate complexes being
form. d) Simulation with density functional theory showing Fe3+ coordinating
with three tannic acids forming a distorted octahedral tris complex. e)
Simulation with density functional theory showing Co2+ coordinating with two
tannic acids forming a planar bis complex. Two water molecules also
coordinate along the Z-axis plane with the Co2+ ion. Figure 2.9a and 2.9b were
cited from Wei, J., Wang, G., Chen, F., Bai, M., Liang, Y., Wang, H., Zhao, D.,
Zhao Y. (2018). Sol–Gel Synthesis of Metal–Phenolic Coordination Spheres
and Their Derived Carbon Composites. Angewandte Chemie International
Edition, vol. 57, pp. 9838 – published by Wiley Periodicals, Inc. Figure 2.9c and
2.9d were cited from: Zheng, W., Christoferson, A. J., Besford, Q. A.,
Richardson. J. J., Guo, J., Ju, Y., Kempe, K., Yarovsky, I., Caruso, F. (2019).
Metal-dependent inhibition of amyloid fibril formation: synergistic effects of
cobalt-tannic acid networks. Nanoscale, 11, p.1921 – published by The Royal
Society of Chemistry.
Figure 2.10: a) Au@PTA nanocomposites after adding Fe2+ (20 M) with no
oxidizing agent, Fe2+ (20 M) with H2O2 as the oxidizing agent, and H2O2, with
no Fe2+ added. b) Photograph of solutions containing Au@PTA
nanocomposites incubated with different metal cations in the presence of H2O2
for 1 minute. Ion concentration of Na+, K+, Mg2+, Zn2+, Ca2+, Cu2+, Mn2+, Co2+,
Ag+, Hg2+, Ni2+ and Fe2+ is 20 M. [H2O2] = 1 M. c) UV–vis spectra of
Au@PTA nanocomposites (solid black line), and after 30 min in the presence
of Fe2+ and H2O2 (dotted red line). d) Graphs showing time dependent growth
in absorbance at 350 nm of Fe3+ after the addition of H2O2 to Fe2+ as well as the
fast aggregation of Au@PTA after the addition of Fe3+ at the extinction peak of
550 nm for Au@PTA.

xvii
Figure 2.11: a) Different concentrations of H2O2 were added to solution of
Au@PTA incubated with Fe2+ to observe changes in colours and intensities.
Concentration of H2O2 increased from 0.1 M to 2.0 M from left to right. b)
UV–vis spectra of solution after 5 minutes after different concentrations of H2O
were added. The extinction peak red shifts when the concentration of H2O2 is
0.1 M or higher. c) Graph showing absorbance at ∼ 650 nm of the various
samples reacted with different concentrations of H2O2. Values were normalized
by subtracting from the A650 value at 0 M H2O2 concentration. Error bars
represent the standard deviations of three replicates.
Figure 2.12: a) SEM images of Au@PTA nanocomposites incubated with Fe2+.
b) SEM image of Au@PTA incubated with Fe2+ and H2O2 with low and high
magnification (inset).
Figure 3.1: Model of pOBPM2. The structure is ubiquitous to all lipocalins.
Figure 3.2: Sequence alignment of various OBPs, hOBP, human OBP; rOBP,
rabbit OBP; pOBP, pig OBP; bOBP, bovine OBP. The figure is cited from:
Schiefner A., Freier R., Eichinger A. and Skerra, A. (2015). Crystal structure of
the human odorant binding protein, OBPIIa. Proteins: Structure, Function, and
Bioinformatics, 83(6), pp.1180-1184 – published by the Wiley Periodicals, Inc.
Figure 3.3: a) The OBP’s interaction with fluorescent probe and odorants as
they are added to the protein. Upon addition of fluorescent probe, some
fluorescent probe enters into the OBP leading to fluorescence being present.
The fluorescence is represented by the yellow rays. When odorants are added, it
competes with the fluorescent to bind with the OBP. Less fluorescent probe
now binds to the OBP and the total fluorescence intensity drops. b, c) Docking
simulation result of positioning of fluorescent probe 1-NPN (b) and 1-AMA (c)
in the pOBPM2 protein.
Figure 3.4: Overview steps for protein production and purification. a, b) Gene
of interest and double digested vector backbone are ligated into a full plasmid.
c, d) Ligated plasmid with gene of interest are transformed into competent E.
coli cells. e) The transformed E. coli cells are grown and IPTG is added to
induce protein production. f, g) Proteins are collected and cleaned up through
application in purification columns.
Figure 3.5: SDS Page gels for pOBPM2 (a) and pOBPM2Δ121 (b). Proteins
pOBPM2 and pOBPM2Δ121 have an apparent molecular weight of 23kDa and
14kDa respectively. Actual theoretical weight however is 17.8kDa and
13.5kDA for pOBPM2 and pOBPM2Δ121 respectively. The lanes in the SDS
Page gels are ladder (1), non-induced with IPTG (2), induced with IPTG (3),
soluble fraction after sonication (4), insoluble fraction after sonication (5).
Figure 3.6: a) Chromatogram for pOBPM2 purification. b) SDS Page gels of
collected fractions from pOBPM2 purification. The lanes are as follow: Lane 1,
Ladder. Lanes 2 to 10, Fractions 20 to 27. Fraction 23, circled in red was used
for binding property analysis. c) Chromatogram for pOBPM2Δ121 purification.
d) SDS Page gels of collected fractions from pOBPM2Δ121 purification. The
lanes are as follow: Lane 1, Ladder. Lanes 2 to 10, Fractions 32 to 39. Fractions
xviii
34 to 39, circled in red were pooled together and applied to the column a second
time for further purification.
Figure 3.7: a) Chromatogram for pOBPM2Δ121 purification. d) SDS Page gels
of collected fractions from pOBPM2Δ121 purification. The lanes are as follow:
Lane 1, Ladder. Lanes 2 to 10, Fractions 16, 20, 21, 22, 23, 26, 31, and 36.
Fraction 22, circled in red was used for binding property analysis.
Figure 3.8: a) Fitted curves with Hill equation of 1-NPN (Red) and 1-AMA
(Blue) binding to pOBPM2. b) Dissociation constants based on fitted curves.
Figure 3.9: Fitted curves for competitive binding assay with various ligands
with the fluorescent probes 1-NPN (a) and 1-AMA (b), binding to pOBPM2. c)
Apparent ligand dissociation constants based on fitted curves.
Figure 3.10: a) Fitted curve with Hill equation of 1-NPN binding to
pOBPM2Δ121. b) Fitted curves for competitive binding assay with various
ligands with the fluorescent probes 1-NPN binding to pOBPM2Δ121. c)
Apparent ligand dissociation constants based on fitted curves. d) Calculation for
change in Gibbs free energy of binding for ligand to respective proteins at
300K. Dissociation constant used for calculation are obtained from Figure 3.9c
and Figure 3.10c.
Figure 3.11: a) Fitted curve with Hill equation of 1-NPN to pOBPMM2 (Red)
and pOBPMM2Δ121 (Blue). b) Fitted curves for competitive binding assay
with various ligands with the fluorescent probes 1-NPN binding to pOBPMM2.
c) Fitted curves for competitive binding assay with various ligands with the
fluorescent probes 1-NPN binding to pOBPMM2Δ121. d) Table of apparent
dissociation constants and change in Gibbs free energy of binding for the each
fluorescence probe or odorant ligand to respective proteins at 300K.
Figure 3.12: The pET5b-pOBP plasmid. The gene is cloned in between the
EcoRI and NdeI restriction sites and driven by the T7 promoter for expression.
Figure 4.1: Signals received by the receptor in a cell based bioassay are
transduced either through the cell’s native signalling pathway or artificial
signalling pathway. The former allows for signal amplification through kinase
cascades (Purple). The latter allows for design of logic gate circuits. Output
signal could be through detection of calcium influx or expression of reporter
genes.
Figure 4.2: The B cell receptor and its downstream signalling pathway whereby
the one of which results in an influx of calcium ions. Figure 4.2 was cited from:
Young, R. M. and Staudt. L. M. (2013) Targeting pathological B cell receptor
signalling in lymphoid malignancies Nature Reviews Drug Discovery 12,
p.229– published by Springer Nature.
Figure 4.3: The envisioned therapeutic B cell based bioassay. Step 1: CAR is at
rest. Step 2: Ligand crosslinks CAR. Step 3: Intracellular signalling pathway
activated. Step 4: Calcium ion influx into cells. Step 5: NFAT response element
results in secretion of therapeutic antibodies.

xix
Figure 4.4: a) Designs of the different CAR. Design one has 6x His-tag located
at the N-terminus of the CAR while design two has a Myc-tag placed between
the scFv and hinge region. b) The CAR gene is placed after the signal peptide
and driven by a CMV promoter.
Figure 4.5: a) Untransfected HEK293FT cells stained with anti-His alexa fluor
488 antibody. b) Design one transfected HEK293FT cells stained with anti-His
alexa fluor 488 antibody. c) Untransfected HEK293FT cells stained with anti-
Myc FITC antibody. d) HEK293FT cells transfected with EGFP gene. e)
Design two transfected HEK293FT cells stained with anti-Myc FITC antibody.
The ruler represents 20 m.
Figure 4.6: HEK293FT cells transfected with plasmid that contains the gene for
both design one CAR and mCherry. Successfully transfected cells show
mCherry expression (red coloured) but no expression of CAR. The ruler
represents 20 m.
Figure 4.7: a) Design two CAR transfected HEK293FT cells stained with
EGFR chimerically fused with 6x His-tag followed by anti-His alexa fluor 488
antibody. Cells fluoresced under confocal microscopy observation proving that
EGFR does indeed bind to design two CAR. b) Design two CAR transfected
HEK293FT cells stained with only EGFR chimerically fused with 6x His-tag.
c) Design two CAR transfected HEK293FT cells stained with only anti-His
alexa fluor 488 antibody. The ruler represents 20 m.
Figure 4.8: Graphs of calcium influx assays for a, b, c) Untransfected
HEK293FT with 0.1 µg mL-1, 1 µg mL-1, and 10 µg mL-1 of EGFR introduced.
d) Untransfected HEK293FT with only HBSS introduced. e, f, g) Untransfected
HEK293FT with 0.1 µg mL-1, 1 µg mL-1, and 10 µg mL-1 of anti-Myc antibody
introduced. h) Untransfected HEK293FT with 5 µM ATP introduced. i, j, k)
Transfected HEK293FT with 0.1 µg mL-1, 1 µg mL-1, and 10 µg mL-1 of EGFR
introduced. l) Transfected HEK293FT with only HBSS introduced. m, n, o)
Transfected HEK293FT with 0.1 µg mL-1, 1 µg mL-1, and 10 µg mL-1 of anti-
Myc antibody introduced. p) Transfected HEK293FT with 5 µM ATP
introduced.
Figure 4.9: a, b) Samples were untransfected or transfected HEK293FT cells
respectively being treated with 30 minutes EGFR (lane 1), 30 minutes EGFR
followed by 1 minute of anti-His antibody (lane 2), 30 minutes EGFR followed
by 2 minutes of anti-His antibody (lane 3), 30 minutes EGFR followed by 3
minutes of anti-His antibody (lane 4), 30 minutes EGFR followed by 5 minutes
of anti-His antibody (lane 5), 30 minutes EGFR followed by 10 minutes of anti-
His antibody (lane 6). c, d) Samples were untransfected or transfected
HEK293FT cells respectively being treated with 1 minute anti-Myc antibody
(lane 1), 2 minutes anti-Myc antibody (lane 2), 3 minutes anti-Myc antibody
(lane 3), 5 minutes anti-Myc antibody (lane 4), 10 minutes anti-Myc antibody
(lane 5), 30 minutes anti-Myc antibody (lane 6). e) Transfected HEK293FT
(lane 1) and untransfected HEK293FT (lane 2) cell lysates who’s blots were
stained with anti-Myc antibody conjugated with horseradish peroxidase. This
sample shows us the apparent position of CAR in the western blot. g, h)
Normalized relative intensity of CAR bands to the sample lane for blots in blot

xx
(b) and blot (d) respectively. The Green boxes represent presence of CAR band
and red boxes the absence.
Figure 4.10: a) Untransfected HEK293FT, stained with anti-Myc FITC
antibody. b) Transfected HEK293FT with L21C CAR, stained with anti-Myc
FITC antibody. The ruler represents 20 m.
Figure 4.11: Construct of pLenti6/V5 directional TOPO Plasmid with crucial
restriction site enzymes circled in red, BamHI, XhoI, XmaI and KpnI.

xxi
LIST OF ABBREVIATIONS
1-AMA 1-Aminoanthracene
1-NPN N-phenylnapthalen-1-amine
AuNPs Gold nanoparticles
BSA Bovine serum albumin
BCR B Cell Receptors
CAR Chimeric Antigen Receptor
DLS Dynamic light scattering
DNA Deoxyribonucleic Acid
EGFP Enhanced green fluorescent protein
EGFR Epidermal Growth Factor Receptor
ELISA Enzyme-linked immunosorbent assay
FPLC Fast Protein Liquid Chromatography
FTIR Fourier transform infrared
gFET graphene Field Effect Transistor
GPCR G-protein coupled receptor
H2O2 Hydrogen Peroxide
Ig Immunoglobulin
IPTG Isopropyl-Beta-D-thiogalactopyranosid
ITAM Immunoreceptor tyrosine-based activation motif
LSPR Localized Surface Plasmon Resonance
NFAT Nuclear factor of activated T-cells
NPs Nanoparticles
OBP Odorant Binding Protein
PAH Polycyclic Aromatic Hydrocarbons
PB Phosphate buffer
PBS Phosphate buffered saline
pOBP pig Odorant Binding Protein
PPs Plant polyphenols
PTA Poly-tannic acid
ROS Reactive Oxygen Species
ScFv Single chained Fragment variable
SPR Surface Plasmon Resonance

xxii
TA Tannic Acid
TBS Tris buffered saline
TBST TBS with 0.2% Tween
TRuC T cell Receptor Fusion Construct
Uniprot Universal Protein Resource
UV Ultraviolet

“There is Plenty of
Room at the
Bottom”
– Richard Feynman

1
CHAPTER 1
Introduction
1.1 Introduction
Many analytes and ligands interact with the human body in many ways.
These substances range from the sizes of ions and molecules below 100 Daltons
to proteins in the range of 100 kilo-Daltons. Their interactions could be either
beneficial or harmful to the human body. Bioassays for the adequate detection
of these substances are essential for further understanding of their functions in
the human body.
1.2 Iron
Iron plays an essential role in the human body. For example, in red
blood cells, iron is essential for enabling the haemoglobin protein to transport
oxygen to various parts of the body [1]. The enzyme ribonuclease reductase
requires iron as cofactor in the catalysis of ribonucleotides to deoxy-
ribonucleotides for deoxyribonucleic acid (DNA) synthesis [2, 3]. The synthesis
of iron-sulphur clusters in mitochondria for iron-sulphur proteins also requires
iron [4-7]. For these functions, iron in the ferrous form (Fe2+) is required.
However, Fe2+ also results in the formation of harmful reactive oxygen species
(ROS) through Fenton reaction [8-10]. The conversion of iron from ferrous to
ferric form enables the homeostatic regulation of iron concentration in its
various forms [11-14].
The intracellular ferritin protein serves as the main iron storage
molecules in the body by catalysing the conversion of iron from it’s ferrous to

2
ferric form and vice versa depending on the body’s needs [15]. Other proteins
involved in iron homeostasis are the iron cell efflux protein, ferroportin, and for
influx, the divalent metal transporter [16-18]. Extracellularly, ferrous iron exists
in soluble form partaking in various reactions [19-22]. Ferric iron, however, is
complexed with transferrin to ensure that it remains inert when being
transported through the human body [23]. Transferrin protein with ferric iron
(holo-transferrin) can be transported into the cells via transferrin receptors [24,
25].
The inability to regulate iron or the deficiency of iron has been linked to
various diseases. Iron deficiency causes anaemia [26], whereas iron overload
has been linked to type-2 diabetes [27, 28]. In the brain, beta-amyloid
formations are encouraged when too much iron is present, giving rise to
Alzheimer’s disease [29-31]. Excess iron is also linked to cancer. Within the
cell, too much iron results in free-radical accumulation, causing DNA damage
[32, 33]. Outside the cells, increased iron increases activity of metalloprotease,
causing the degradation of extracellular matrices, encouraging tumour
metastasis [34]. During inflammation, iron is kept within the cell to prevent
pathogen utilization [35-37]. Excess iron also causes haemochromatosis.
3
Figure 1.1: Movement and transport of iron within and through the cell. Figure
1.1 was cited from: Drakesmith et al. [16] – published by Elsevier Inc.
To detect and measure the concentration of iron, we exploit iron ion’s
chemical properties, specifically Fe3+ ability to coordinate with tannic acid.
During the coordination of Fe3+ with tannic acid, tannic acid is brought together
in close proximity. Therefore, we hypothesize that replacing the tannic acid
with a gold nanocomposite with a poly-tannic acid shell, Fe3+ would be able
through forming coordinate bonds bring the gold nanocomposite together. This
will render us an optical sensor for the presence of Fe3+.
1.3 Hydrogen Peroxide
Hydrogen peroxide (H2O2) is an important redox signalling molecule in
the human body. Intracellularly, H2O2 is involved in both cell-survival and cell-
death pathways. Through the NOX signalling pathway, H2O2 generated within
the cell induces expression of proliferation and cell migration genes [38, 39].
Yet H2O2 also triggers the mitochondria apoptosis pathway through significant
calcium influx into the cell that alters the activities of mitochondrial
permeability transition pore, ultimately leading to cell death [40, 41].

4
Extracellularly, H2O2 is involved in the innate immune response [42]. Damaged
cells in wounds secrete H2O2 creating a decreasing gradient of H2O2
concentration as the distance from the wound site increases. The H2O2 gradient
serves as a signal to recruit leukocytes to the wound site [43]. Apart from
signalling functions, H2O2 also performs antiseptic role in the human body [44].
However, excessive H2O2 being an ROS is a mutagen known to damage DNA
with potential oncogenic consequences [45, 46].
Diffusion of H2O2 and intracellular scavenging of H2O2 helps maintain
the homeostasis of H2O2 in cells. Depending on the make-up of membrane lipid
concentration, the diffusion of H2O2 through the membrane can either occur
freely or be hindered [47]. Aquaporin are also involved in the efflux of H2O2
out of the cells [48]. Scavenging proteins such as peroxidases and catalases
regulate H2O2 levels by removing it [49-52].
Excessive H2O2 levels can result in diseases. High amounts of H2O2 in
the thyroid due to it being a by-product in the synthesis of hormones have been
associated with thyroid cancer [53, 54]. H2O2 providing oxidative stress could
also be a contributing mechanism to the formation of beta-amyloids in
Alzheimer’s disease [55, 56].
H2O2 is an oxidizing agent capable of oxidizing Fe2+ to Fe3+. We thus
hypothesize that this oxidizing property of H2O2, could oxidize Fe2+ to Fe3+. In
turn, by extension, the Fe3+ would coordinate with the tannic acid shell on the
gold nanocomposite, driving the gold nanocomposites to coordinate. Hence,
this yields an optical sensor for H2O2.
5
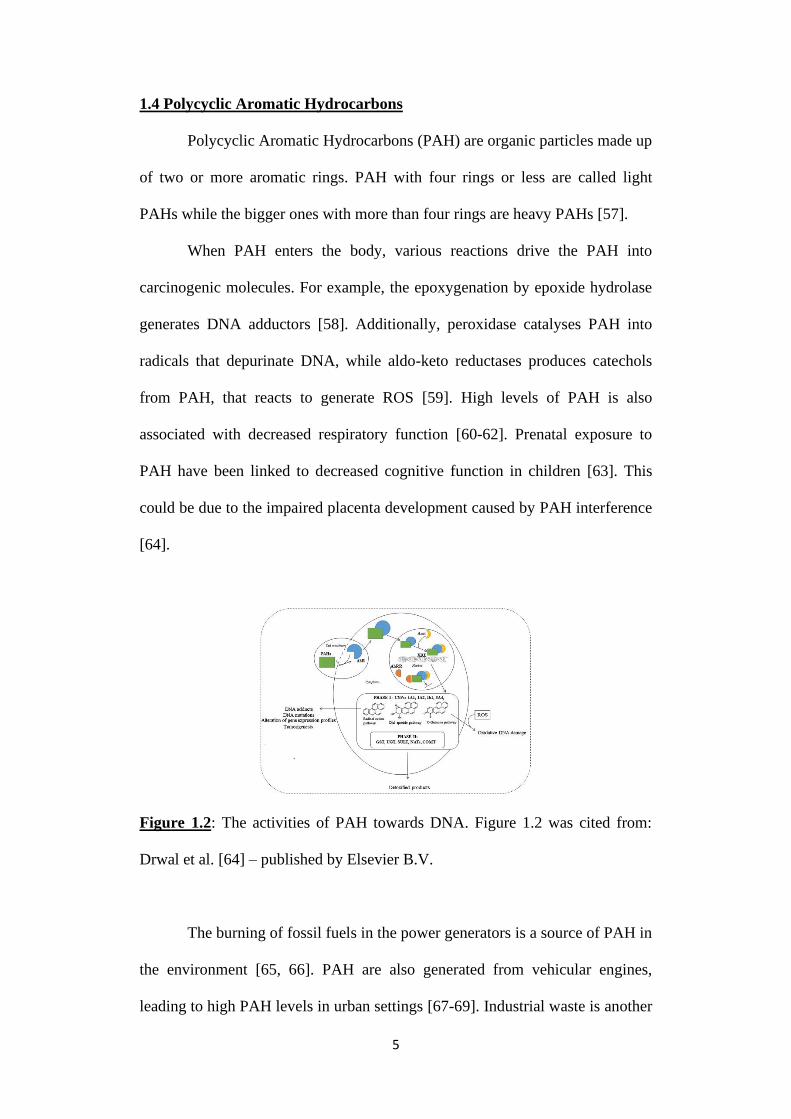
1.4 Polycyclic Aromatic Hydrocarbons
Polycyclic Aromatic Hydrocarbons (PAH) are organic particles made up
of two or more aromatic rings. PAH with four rings or less are called light
PAHs while the bigger ones with more than four rings are heavy PAHs [57].
When PAH enters the body, various reactions drive the PAH into
carcinogenic molecules. For example, the epoxygenation by epoxide hydrolase
generates DNA adductors [58]. Additionally, peroxidase catalyses PAH into
radicals that depurinate DNA, while aldo-keto reductases produces catechols
from PAH, that reacts to generate ROS [59]. High levels of PAH is also
associated with decreased respiratory function [60-62]. Prenatal exposure to
PAH have been linked to decreased cognitive function in children [63]. This
could be due to the impaired placenta development caused by PAH interference
[64].
Figure 1.2: The activities of PAH towards DNA. Figure 1.2 was cited from:
Drwal et al. [64] – published by Elsevier B.V.
The burning of fossil fuels in the power generators is a source of PAH in
the environment [65, 66]. PAH are also generated from vehicular engines,
leading to high PAH levels in urban settings [67-69]. Industrial waste is another

6
source of PAH. Leeching of PAH from solid sludge into liquid phase is a
source of environmental pollution especially in the aquatic environment [70,
71]. Lastly, cigarette smoking is another source of PAH into the human body
[72, 73].
Treatment to remove PAH from the environment is done by the addition
of various oxidizing agents [74, 75]. However, some oxidizing agents such as
chlorides react also with other organic matters, deriving harmful substances [76,
77]. Photolysis of PAH using ultraviolet (UV) light is another removal method.
However, this method risks generating free radicals [78, 79]. Carbon
nanomaterials are also employed to remove PAH through absorption onto its
surface [80, 81]. Recently, bacteria degrading PAH has also been discovered
and isolated, providing potential uses for microorganism based PAH removal
[82, 83].
1.5 Odours
The olfactory system regulates the sense of smell and is responsible for
the detection of odours. Briefly, the olfactory system is made up of the outer
nose and the inner nose which is also known as the nasal cavity. Inhaled air first
past through the outer nose, then the nasal cavity, before entering the windpipe
leading to the lungs [84]. The ceiling of the nasal cavity contains the olfactory
mucosa layer. The layer separates the rest of the nasal cavity from the olfactory
receptor neurons. Odours diffuse through the mucosa layer to stimulate these
neurons [85]. The neuron axons end at the olfactory bulb which consolidates
the signal for further processing in the amygdala of the brain [86, 87]. This
gives rise to olfactory perception in humans.

7
Odours serve important role in human activities ranging from warning
signs to moods alterations. The gradual decomposition of fish causes the
breakdown of odourless trimethylamine-N-oxide into pungent trimethylamine
[88]. The pungent smell provides an indication to the declining freshness and
hence the edibility of the fishes. Leakage of hazardous products such as gases,
in industrial and home settings, is first detected through smell [89]. Taste
perception is altered by the presence of differing odours that concurrently affect
appetite. Chemicals from bodily secretions from one person may also be picked
up by the olfactory receptors of another [90-92]. This allows for interpersonal
chemo-signalling. Men sniffing of women’s tear have their testosterone level
reduced [93].
The odours of volatile organic compounds emitted by the human body
are known to serve as biomarkers for various diseases [94]. Infection of the
respiratory tract system caused by various pathogens is known to cause foul
smells in one’s breath [95]. Patients suffering from cholera discharge sweet
smelling faeces due to the presence of dimethyl disulphide [96]. Various
cancers such as breast and neck cancers emit dimethyl trisulphide, resulting in a
rotten smell [97]. Breathes of lung cancer patient contain various benzenoid
compounds [98-100]. Artificial noses ranging from gas chromatography
techniques to electronic smell sensors are being developed or improved to
detect such odour markers. However, reproducibility, especially carried out in
different surrounding environments remains a challenge [101-103]. Sniffer dogs
able to detect particles at part per trillion lower detection limits are currently
also being trained to act as odour detectors [104, 105].

8
As both PAH and odours are hydrophobic molecules, they are able to
bind into the hydrophobic core of odorant binding proteins (OBP). We
hypothesize that by mutating the OBP, we can increase the association of PAH
and odours to the OBP, rendering a more sensitive bioassay. Specifically, we
look to the removal of the tail domain of the OBP as it appears to act as an
obstructive gate to the entrance of the hydrophobic core.
1.6 Biomarkers
Another class of ligands are biomarkers. Biomarkers are helpful in the
discovery and diagnosis of diseases. Infections result in the generation of
antibodies that target the foreign pathogens. Briefly, upon the entrance of
antigen into the blood, antigens are bound to specific B cell receptors (BCR). B
cells with bound BCR endocytose the antigens, digesting them before
presenting the antigen fragments in a Major Histological Class II Complex.
Thereafter, T helper cells further activate these B cells to secrete antibodies
[106, 107]. Detection of these antibodies that target the foreign pathogens helps
confirm the presence of diseases. In auto-immune diseases, autoantibodies that
target the person itself are detectable in the blood [108, 109]. For example, the
presence of anti-citrullinated antibodies is detectable before symptoms of
rheumatoid arthritis are present [110, 111].

9
Figure 1.3: The interactions of T cell towards B cells and its effect in B cells.
Figure 1.3 was cited from: Crotty, S. [112] – published by Springer Nature.
In cancer, various proteins are overly secreted by the cancerous cells.
For example, in prostate cancer, prostrate-specific antigens levels are increased
in the blood [113]. High levels of CA-125 in blood serum also serve as
indicators of ovarian cancers [114, 115]. However, not all upregulated proteins
are secreted and detectable in the blood stream. Many of these upregulated
proteins are in fact membrane receptor proteins. Epidermal growth factor
receptors (EGFR) are found on triple negative breast cancers [116, 117]. CD19
receptors are overly expressed in lymphoma [118, 119]. However, to test for the
receptors on the cells, blood samples are insufficient. A tissue biopsy is
required to examine the cells for receptor over expression.
Antibodies and its fragment portions such as the single chained
Fragment variable (scFv) are able to bind to these biomarkers. We hypothesize
that by incorporating these biomarkers as chimeric receptors and expressed on

10
the surface membrane of a cell, we could develop a cell based sensor that could
detect the presence of these biomarkesr.
In summary, not only do these analytes and ligands differ in their
molecular weights, their chemical properties such as coordinating bonds,
oxidation energy, hydrophobicity and tertiary structure, are different too. These
chemical properties will be exploited to develop different strategies for their
detections.
1.7 Thesis Outline
In the first chapter, we discussed about five different analytes and
ligands, and their impacts to human health. Adequate detection of these
substances is necessary to better establish and safeguard against them.
Literature reviews for each type of detection strategy is incorporated in each of
the next three chapters.
Chapter two describes the development of naked-eye detection of iron
ions. Gold nanocomposites with poly-tannic acid shell are used for the detection
of Fe3+ as well as H2O2 analytes. By harnessing the unique ability of Fe3+ to
coordinate with three galloyl groups as opposed to two in other metal ions, we
hypothesized that gold nanocomposites were able to aggregate. This then gave
rise to naked eye visible change in colour. Furthermore, the oxidizing property
of H2O2 was used to oxidize Fe2+ into Fe3+. This reaction drove the
nanocomposites to aggregate. As such, a H2O2 detection system was also
developed. This chapter is an adaptation of two papers published in Journal of
Applied Polymer Science, and Sensors and Actuator B: Chemical.

11
An attempt to improve the binding of odorants in pig odorant binding
protein (OBP) is described in Chapter three. The kinetic binding effects upon
domain deletion of the pig OBP were investigated. The pig OBP (pOBP) has
been shown to bind to various hydrophobic PAH and odours. Here, we delete
the tail domain of the protein as we hypothesized that the tail domain functions
as a hindrance to the entering of these molecules. However, our result shows
otherwise. The removal of the tail in fact leads to a drop in binding activity of
the molecules to the protein. The tail deletion lowers the entropy of the
molecule binding pig OBP complex. This chapter is an adapted from a paper
published in Analytical and Bioanalyitical Chemistry.
In chapter four, we designed a chimeric antigen receptor (CAR) for
detection of EGFR. The CAR was successfully expressed on the surface of the
HEK293FT cells in the correct orientation with the intended extracellular
domains on the external of the cells. EGFR was also shown to bind onto the
CAR. We hypothesized that the binding of EGFR to the CAR would thus
trigger a downstream signalling resulting in a calcium influx into the cell.
However, calcium influx assay performed showed that the EGFR was unable to
trigger a downstream signalling cascade within the HEK293FT cells that
culminates into a calcium influx into the cell. Subsequent western blot study
showed that the phosphorylation level of the tyrosines on the CAR did not alter
even when the presentation time of EGFR ligand increased.
In the last chapter, we present the thesis conclusion and the future
outlook for bioassays.

12
CHAPTER 2
Poly-(tannic acid) coated gold nanocomposite for naked eye detection of
Iron (III) ions and H2O2
2.1 Introduction
Detection of iron is crucial as iron plays multiple roles in the human
body. Clinically relevant range of iron is between 7 to 30 M [120].
Homeostasis of iron at the right level is necessary for proper bodily functions.
The detection of the Fe3+ ion is one method for iron detection. Current method
for clinical detection of iron concentration in blood uses Ferrozine to complex
with Fe2+ ions yielding a photometric complex with measurable with
absorbance at 577 nm. Briefly, addition of Ascorbic acid to blood serum lowers
the pH, liberates Fe3+ ions from transferrin and reducing the ions to Fe2+ ions.
Thereafter, the Fe2+ ions are complexed with Ferrozine. Additionally, to remove
false signals arising from the presence of copper (II), thiourea is added to
complex with copper (II) [121, 122].
The current clinical method requires an additional step of reducing Fe3+
to Fe2+ and is not a direct measurement of Fe3+ concentration. However, various
methods have now been developed to directly detect Fe3+ ions by exploiting its
chemical properties. For example, its reduction property to Fe2+, allows for
stable coordination with bilirubin [123]. As an octahedral high spin 3d5
transition metal ion that allows for photo induced electron transfer between
energy orbitals, it is able to quench fluorescence [124-127]. Fe3+ also
coordinates well with the galloyl groups of catechol [128]. These methods have
been exploited for Fe3+ ion detection.
13
To exploit these chemical properties of Fe3+ to detect Fe3+ presence,
various molecules have been developed with varying degrees of efficiency
based on its limit of detection. Fluorophores probe molecules were synthesized
in two methods whereby the fluorescence is quenched in the presence of Fe3+.
Here, the limits of detection are 0.5 ppm and 0.1 nM respectively [124, 127].
Copper nanoclusters were also synthesized in one method. Here, fluorescence is
also quenched when Fe3+ is present [126]. The limit of detection is 2 M. To
exploit the coordination with gallyol groups, catechol filled molecules were
synthesized. The presence of Fe3+ drives a colour change with limit of detection
at 3.52 M. This assay also has the highest sensitivity of 7.33 x 10⁻⁷ M as
compared to the other assays [128].
Despite their low limits of detection, the synthesizing of these molecules
and the copper nanoclusters, require multiple steps for synthesis. The synthesis
methods also make use of lab equipment rendering them more difficult for
synthesis. These challenges are overcome in our method where the gold
nanocomposite is produced in a one-pot one-step method. Lastly, the use of
fluorophore in some assays means that the fluorophore molecules are
susceptible to photo bleaching.
Here, we exploit the coordination chemistry between Fe3+ ions and
tannic acid to induce poly-(tannic acid) coated gold nanocomposite (Au@PTA)
to aggregate. This thus causes a red-shift in plasmon bands, and extinction
wavelengths, resulting in naked eye visible colour change from red to blue.
Additionally, H2O2, another crucial biological analyte was also detected
by utilizing its oxidation of Fe2+ to Fe3+ ions in the presence of the Au@PTA.
H2O2 is noted to be clinically dangerous when it reaches level at above 50 M

14
[129]. When in Fe2+ state, the Au@PTA did not aggregate. However, when
oxidized to Fe3+, the Au@PTA aggregated. The current method for detecting
H2O2 and measuring its concentration is through the use of titration with
potassium iodide [130]. When potassium iodide is added to the colourless H2O2
solution, the iodide is oxidized to iodine, turning the solution dark purple.
2.1.1 Nanoparticles
The IUPAC has defined nanoparticles as a particle of any shape with at
least two dimensions between 1 nm and 100 nm [131]. As metal particles are
reduced to such sizes, they begin exhibiting optical properties different from
those of bulk metals. When light propagates towards the surface of metal, the
electric field in the electromagnetic waves drives surface free electrons to
vibrate, generating an electric field that propagates along, and oscillates in and
out of the air metal interface. These vibrating electrons are known as plasmons.
In metal nanoparticles however, when the wavelength of electromagnetic wave
propagated is larger than the nanoparticles, the plasmons generated do not
propagate but are instead confined within the nanoparticle. This creates the
phenomenon of Localized Surface Plasmon Resonance (LSPR) [132]. The
wavelengths in which the electromagnetic waves are able to resonate with the
plasmons, and thus be absorbed by the metal nanoparticles are dependent on the
nanoparticles’ sizes, shapes and dielectric constants. This can be calculated
using the Mie model, a solution to the Maxwell equations. The characteristic
extinction UV-vis spectra of metal nanoparticles give it its characteristic blue
shift in colour as the metal nanoparticles increase in sizes or aggregates [133].

15
Figure 2.1: a) Colour of Gold nanoparticles of varying diameters and b) the
corresponding extinction curves. Figures 2.1a and 2.1b are cited from: Subara
et. al. [134] – published by the Indonesian Society for Knowledge and Human
Development.
2.1.2 Nanoparticles Synthesis
Nanoparticle synthesis typically relies on the Turkevich method
pioneered in 1951 [135, 136]. Briefly, the gold salt, gold hydrochlorate diluted
in solution is reduced by citrate or ascorbic acid at 100 oC or room temperature
respectively under stirring condition, yielding gold nanoparticles. Since then,
other reducing agents such as sodium borohydride, glutamic acid, or
hydroquinone have also been utilized [137-139]. To stabilize and ensure
monomeric dispersion of the nanoparticles, capping agents such as citrate,
gallic acid, or surfactants including DAXAD 19 were added to the formed
nanoparticles [133, 135, 140-142]. To yield polymer shells, further addition of
cross-linkers or UV irradiation is done to polymerize the monomers [143].
Recently, there has been an increasing trend of replacing synthetic
polymers with plant polyphenols (PPs) for bionanomaterial synthesis [144-
148]. The use of PPs, specifically tea polyphenol, and tannic acid (TA) for
synthesizing metal@polymer nanocomposites has been reported by Fei et al.
and Zeng et al. in 2014. Fei et al.’s method, although a one-step process,

16
requires microwave irradiation, while Zeng et al.’s method, a conventional two-
step method, needs the addition of Fe3+ ions as cross-linkers [149-154].
TA has been shown to undergo oxidative self-polymerization to PTA
before coating onto graphene oxide surface [155]. Furthermore, TA has also
been used as a sole reducing and capping agent in heating-free green synthesis
of metal nanoparticles [156, 157]. These two properties make TA an
advantageous candidate for the synthesis of metal@polymer nanocomposite.
Nevertheless, current methods of synthesizing metal@polyphenol
nanocomposite with TA shell as described by Zeng et al. still relied on Fe3+ ions
to induce coordination between TA to form the shell [151].
In our method, the reduction of gold salt as well as TA polymerization
occurred concurrently, thus allowing for a one-pot, and one-step synthesis
method for Au@PTA NP.
Figure 2.2: Schematic depicting the metal@PTA nanocomposites formation.
The TA shell is the result of polymerized TA.

17
2.2 Result and Discussion
2.2.1 Nanocomposite Synthesis
Firstly, to determine the optimal pH for Au@PTA synthesis, TA
polymerization was carried out at varying pHs. The estimated pKa value of TA
is 8.5 [158]. TA monomer was found to be stable in solutions of pH ≤ 7.0 as
oxidation of TA is inhibited in acidic condition. However, as the pH increases >
7.0, TA undergoes oxidation with atmospheric oxygen, during which, self-
polymerization of TA takes place spontaneously. The TA solution turns faint
yellow (Figure 2.3). When pH increases beyond pH > 8.5, the speed of TA
oxidation and self-polymerization would be sped up and the polymerized TA
would be further oxidized and disassembled into smaller soluble molecules
[159]. As such the shell would be unable to assemble on the AuNP core. These
observations infer to us that in the final Au@PTA nanocomposite product, the
TA was cross-linked through oxidation of HAuCl4 and oxygen dissolved in the
solution before self-assembling into the shell surrounding the AuNP cores. pH
7.8 was thus determined to be the optimal pH for Au@PTA nanocomposite
synthesis.

18
Figure 2.3: A photograph of the TA solutions under different pH conditions
after a 4 hours incubation at room temperature.
Au@PTA nanocomposite was synthesized by one-pot synthesis mixing
of Au3+ and TA under mildly alkaline condition and characterized through TEM
imaging and dynamic light scattering (DLS) (Figure 2.4a). The Au@PTA
nanocomposites were comprised of two components with distinct electronic
densities as compared to bare gold nanoparticles (AuNPs) (Figure 2.4b) [151].
The average diameter of the Au@PTA core was ∼20 nm, while the shell
thickness was ∼5 nm. The solution of Au@PTA nanocomposites exhibited a
red colour similar to that of typical Au colloids [160-162]. The UV–vis spectra
of an Au@PTA solution showed an extinction peak at around 550 nm (Figure
2.4c). The slight red-shift in the extinction peak of Au@PTA in comparison to
that of 20 nm AuNPs (extinction peak of ∼520 nm) was due to the increase of
refractive index around AuNPs arising from the PTA coating on AuNPs [145,

19
151, 163]. The corresponding element linear mapping of a single
nanocomposite (Figure 2.4d, e) showed the distribution of the various elements
in the nanocomposite, comprising Au (green), C (red), and O (black), indicating
that the nanocomposites were composed of Au at its core and PTA as its shell
[154]. Fourier transform infrared (FTIR) spectra confirmed that TA was
oxidized by HAuCl4 (Figure 2.4f), which is in good agreement with previous
reports [164]. Integration of the PTA shell onto the surface of the Au cores
decreased the zeta potential from −11.5 ± 0.5 mV to −17.2 ± 0.5 mV due to the
presence of acidic galloyl groups in TA.

20
Figure 2.4: a) Table recording the relevant physical measurements of the
different NPs in varying synthesis conditions. b) UV-vis spectra of dispersed
Au@PTA and AuNPs. c) STEM images of Au@PTA. d) Element linear
mapping of Au@PTA. e) FTIR spectra of TA and Au@PTA. f) STEM image
of a single Au@PTA with inset, bare AuNPs.
Time-course experiment was conducted to determine the growth
mechanism of Au@PTA nanocomposites by monitoring the morphology of the
nanocomposites using TEM at synthesis time points of 5, 10, and 20 minutes.
Similar to other nanoparticle synthesis techniques, the electronic density at the
beginning of the synthesis process (5 minutes) was not uniformed and the
nanoparticles aggregated in a “like-attracts-like” manner (Figure 2.5a). The
white halo around the nanoparticles may be attributed to the presence of
partially polymerized PTA. We may attribute the “like-attracts-like”
aggregation of nanoparticles to the fusion between metal nanoclusters, which
would grow into larger mesocrystals, as observed in many biomineralization
processes [165-167]. At 10 minutes, although we observed capping of PTA
onto the mesocrystals, uniformed Au@PTA nanocomposites were still not fully
assembled (Figure 2.5b). After 20 minutes, capping of PTA is completed and a
shell of thickness of ∼5 nm was observed around the Au core (Figure 2.5c).

21
Figure 2.5: TEM images of Au@PTA nanocomposites at varying time points
of its synthesis, a) 5 minutes, b) 10 minutes, c) 20 minutes. Corresponding
photographs of the nanocomposite at the varying time points of its synthesis is
attached at the bottom of each TEM images.
2.2.2 Fe3+ Detection
The synthesized Au@PTA was applied as a sensor to detect iron (III)
ions. When Fe3+ was added to the Au@PTA solutions at room temperature,
naked eye visible colour change from red to blue was observed (Figure 2.6a).
UV–vis spectroscopy showed an extinction band shift from 550 nm to 600 nm
(Figure 2.6b). The shift of which was caused by the aggregation of Au@PTA
was confirmed via SEM imaging (Figure 2.6c, d).

22
Figure 2.6: a) Photograph of the solution containing only Au@PTA
nanocomposites (left) and the same solution after the addition of Fe3+ (20 M)
(right). b) UV–vis spectra obtained from solutions of Au@PTA
nanocomposites (solid black line) and after 30 min incubation with Fe3+ (dashed
red line). Solid black line: Au@PTA nanocomposites without Fe3+, dashed red
line: Au@PTA nanocomposites with Fe3+. c) SEM images of Au@PTA
nanocomposites. d) SEM image of the Au@PTA nanocomposites after
incubation with Fe3+.
To evaluate the minimum aqueous concentration of Fe3+ ions required
for visible colour change, we added Fe3+ into the Au@PTA solution at final
Fe3+ concentrations ranging from 1M to 10 M. After 5 minutes of reaction
time, obvious colour changes with [Fe3+] ≥ 5 M were observed (Figure 2.7a).
Upon analysis of the UV–vis spectra of Au@PTA incubated at varying

23
Fe3+concentrations, we observed the presence of two sets of linear dynamic
ranges (Figure 2.7b). Between concentrations of 5 M and 40 M, the increase
in Fe3+ concentrations corresponded linearly to an increase in red-shift of the
peak up to a maximum of 50 nm (Figure 2.7c). The sensitivity is 1.29 nm M-1.
From Fe3+ concentrations of 40 M to 200 M, we observed that the intensity
of absorbance at 600 nm (A600) decreased linearly as the Fe3+ concentration
increased (Figure 2.6d). The sensitivity is 0.002 M-1. This difference was due
to the nature of aggregation. Consequently, the changes in the extinction curve
that had taken place were different for the two different dynamic ranges. Below
concentrations of 40 M, coordinate bonds between Fe3+ and Au@PTA
resulted in the formation of small perforated aggregates. At these ranges, the
extinction is mainly dominated by absorbance. Thus changes in size results in
shift of extinction peak. However, above 40 M concentrations, not only did
these small perforated aggregates form, they also clustered together to form
larger aggregates. The extinction of Au@PTA at this size ranges is now
dominated by scattering. As such, the increase in aggregation results in the
broadening of extinction peak and decrease in extinction.

24
Figure 2.7: a) Photograph of the solutions containing Au@PTA incubated for 5
minutes with different concentrations Fe3+ (1 – 10 M). b) UV–vis spectra of
solutions of Au@PTA incubated with varying concentrations of Fe3+. c)
Calibration curve corresponding to part a (5 – 60 M). d) A calibration curve
corresponding to part a (40 − 200 M). Values were normalized by subtracting
from the A600 value at 35 M Fe3+ concentrations. Error bars represent the
standard deviations of three replicates. The lines represent best linear fits for the
respective curves. Furthest points are omitted in the fitting because they do not
fit the linear trend.
We also tested the selectivity of this assay for Fe3+ ions by testing the
assay with various, monovalent, divalent, or trivalent ions at final
concentrations of 50 M. Results show that only the sample containing Fe3+
induced a noticeable colour change in Au@PTA (Figure 2.8). None of the other
metal ions interfered with the assay. Even when the concentrations of these ions
were increased to ten times the concentration of Fe3+ added (i.e., up to 200 M),
no distinct visible colour changes or precipitates were observed in the
Au@PTA solutions (data not shown). Furthermore, no colour changes (except
for Ag+ and Hg2+) or aggregations were observed after incubating the samples

25
for four weeks, indicating the long term stability of the Au@PTA based
detection system. Conclusively, Au@PTA can be conveniently used to visually
detect Fe3+ in a highly sensitive and selective manner.
Figure 2.8: a) Photograph of solutions containing Au@PTA incubated with
different metal cations. Ion concentration of Na+, K+, Rb+, Ag+, Mg2+, Ca2+,
Zn2+, Fe2+, Co2+, Cu2+, Ni2+, Mn2+, Cd2+, Hg2+, Al3+, Cr3+, Nd3+, Gd3+, and Dy3+
is 50 M. [Fe3+] = 20 M. b) UV-Vis spectra obtained from solutions of
Au@PTA after adding different metal ions.
Tannic acid is a polydentate molecule. However, unlike
Ethylenediaminetetraacetic acid, the molecule does not chelate onto only one
metal ion. Instead, tannic acid is able to form multiple coordination bonds with
multiple metal ions, at each of its galloyl groups [168, 169]. The metal ions are
able to further form coordination bonds with other tannic acid through their
galloyl groups (Figure 2.9a). This results in the aggregation of tannic acid
giving rise to the formation of PTA. However, only Fe3+ is able to form tri-
catecholate complexes [170, 171]. Other metal ions tested are only able to form
mono-catecholate or bi-catecholate complexes [172]. This would explain the
more efficient aggregation of Au@PTA for Fe3+ as compared to the other metal

26
ions and thus the selectivity (Figure 2.9b, c). Modelling using density functional
theory by Ponce et al. and Zhang et al. showed that Fe3+ complex with galloyl
groups forms a six-coordinate distorted octahedral tris complex. Whereas metal
ions such as Co2+ form a four-coordinate planar bis complex (Figure 2.9d, e).
Two water molecules coordinate along the Z-axis to stabilize the complex
essentially giving rise to an octahedral coordinate geometry shape [173, 174].
The distorted geometry for the tris complex may be attributed to steric
hindrance caused by the large size of galloyl groups as compared to that of two
water molecules that gives rise to a non-distorted octahedral shape.
Figure 2.9: a) Tannic acid contains multiple galloyl groups which five of them
able to form coordinate bonds with metal ions. This makes tannic acid
polydentate. b) Each galloyl group of the polydentate tannic acid is able to form
a coordination bond with a metal ion. For some metal ion, they can form
coordination bond with two additional galloyl groups. This forms tri-

27
catecholate complexes c) In other metal ions, coordination bond only forms
with one additional galloyl group. This results in bi-cateholate complexes being
form. d) Simulation with density functional theory showing Fe3+ coordinating
with three tannic acids forming a distorted octahedral tris complex. e)
Simulation with density functional theory showing Co2+ coordinating with two
tannic acids forming a planar bis complex. Two water molecules also
coordinate along the Z-axis plane with the Co2+ ion. Figure 2.9a and 2.9b were
cited from: Wei et al. [175] – published by Wiley Periodicals, Inc. Figure 2.9c
and 2.9d were cited from: Zhang et al. [173] – published by The Royal Society
of Chemistry.
2.2.3 H2O2 Detection
As H2O2 oxidizes Fe2+ to Fe3+ (Equation (1)), we made use of the Fe3+
produced from the oxidation of Fe2+ when H2O2 was added to form
coordination bonds with the galloyl groups of the PTA shell causing the
Au@PTA to aggregate immediately. When H2O2 or Fe2+ was added separately
to the Au@PTA mixture, no colour changes in the assay were observed even
after 30 min. However, when H2O2 and Fe2+ ions were added together in the
assay system, the colour of Au@PTA solution turned blue (Figure 2.10a). The
presence of Fe2+ was crucial for the assay to detect H2O2. Other monovalent,
divalent, or trivalent ions do not induce any colour shifts (Figure 2.10b). UV–
vis spectroscopy analysis showed that the absorbance at 550 nm decreased and
the peak broadened with marked increase at ∼650 nm (Figure 2.10c). To show
that the change in colour is due to the oxidation of Fe2+ to Fe3+ by the addition
of H2O2, we compared the initial reaction rates for the production of Fe3+ after

28
the addition of H2O2 to Fe2+ to that of the production of Fe3+ Au@PTA
aggregates. The extinction peak of Fe3+ (350 nm) and Au@PTA aggregates
(550 nm) was measured over a course of 300 seconds after the addition of H2O2
to Fe2+ ions, and Au@PTA to Fe3+ respectively. We observed that the
absorbance value for Fe3+ starts to stabilize only after 200 seconds whereas the
value for the Fe3+ Au@PTA aggregate stabilizes within the first 50 seconds
(Figure 2.10d). This shows that the rate limiting step for the reaction is the
formation of Fe3+ after the addition of H2O2 to Fe2+.
Figure 2.10: a) Au@PTA nanocomposites after adding Fe2+ (20 M) with no
oxidizing agent, Fe2+ (20 M) with H2O2 as the oxidizing agent, and H2O2, with
no Fe2+ added. b) Photograph of solutions containing Au@PTA
nanocomposites incubated with different metal cations in the presence of H2O2
for 1 minute. Ion concentration of Na+, K+, Mg2+, Zn2+, Ca2+, Cu2+, Mn2+, Co2+,
Ag+, Hg2+, Ni2+ and Fe2+ is 20 M. [H2O2] = 1 M. c) UV–vis spectra of

29
Au@PTA nanocomposites (solid black line), and after 30 min in the presence
of Fe2+ and H2O2 (dotted red line). d) Graphs showing time dependent growth
in absorbance at 350 nm of Fe3+ after the addition of H2O2 to Fe2+ as well as the
fast aggregation of Au@PTA after the addition of Fe3+ at the extinction peak of
550 nm for Au@PTA.
To investigate the sensitivity of our Au@PTA based sensor for the
detection of H2O2, aliquots containing varying concentrations of the analyte
H2O2 were added into Au@PTA nanocomposite solutions mixed with Fe2+, and
the result were observed both visually and with the use of spectrometry (Figure
2.11a). Minimum concentration of H2O2 required for the Au@PTA solution to
turn visibly blue was 0.4 M. Between H2O2 concentrations from 0.4 M to 2.0
M, an increase in the intensity of blue colour was seen as the added H2O2
concentration increased. Our naked eye H2O2 minimum detection concentration
of 0.4 M was lower than the reported minimum visual detection limit for H2O2
concentration of 0.5 M reported in the horseradish peroxidase-dependent
nanoflower system developed by Lin et al. [154]. To our knowledge, this makes
our system the lowest detection level via naked eye visualization [176-179]. By
observing the UV–vis spectrum with varying concentrations of H2O2 added, we
observed that our assay allowed for a large linear dynamic range between H2O2
concentrations of 0.01 M and 0.14 M. We observed that the absorbance at
∼650 nm increased linearly as the concentration of H2O2 increased (Figure
2.11b, c). Our assay’s linear dynamic range was much wider as compared to
other previously reported sensors (2.5–11.2 mM, 0.979–17.6 mM, and 0.02–0.5
mM) when similar experimental conditions were used for H2O2 detection [154,

30
176, 179]. As the H2O2 concentration reached the saturation limit of 1.4 M in
our assay, the normalized absorbance at 650 nm increases at a slower rate as
compared to between concentrations of 0.01 M and 0.14 M.
Figure 2.11: a) Different concentrations of H2O2 were added to solution of
Au@PTA incubated with Fe2+ to observe changes in colours and intensities.
Concentration of H2O2 increased from 0.1 M to 2.0 M from left to right. b)
UV–vis spectra of solution after 5 minutes after different concentrations of H2O
were added. The extinction peak red shifts when the concentration of H2O2 is
0.1 M or higher. c) Graph showing absorbance at ∼ 650 nm of the various
samples reacted with different concentrations of H2O2. Values were normalized
by subtracting from the A650 value at 0 M H2O2 concentration. Error bars
represent the standard deviations of three replicates.
Interestingly, while comparing the UV–vis spectrometry of our two
assays, we realized that as increasing H2O2 was added to the H2O2 detection
assay, a second peak appeared at ∼650 nm with increasing intensity (Figure

31
2.7b, 2.11c). This peak was absent in the Fe3+ assay regardless of the
concentration of Fe3+ added. This is because the Fe3+ induced aggregation is a
bulk clustering of Au@PTA. However, in the H2O2 detection assay, the
clustering as observed under SEM is “wire-like” (Figure 2.12). This results in
two different planes of LSPR, producing two extinction peaks similar to that of
nanorods and nanowires [180, 181]. To account for the “wire-like” oligomer
structure present in the H2O2 detection assay but absent in the Fe3+ detection
assay, we examined the chemistry taking place for each assay. In the Fe3+
detection assay, the addition of Fe3+ to Au@PTA resulted in an aggregation
induced by the coordination between Fe3+ and the galloyl groups of PTA.
However, when H2O2 was added to the mixture of Au@PTA and Fe2+ ions, a
multi-step reaction took place. When added, H2O2 induced oxidation of Fe2+ to
Fe3+ which was accompanied by the generation of ·OH free radicals (Equation
(1)). The ·OH free radicals then reacted with the galloyl groups of PTA by
capturing proton from them (Equation (2–3)) converting the polyphenol into
phenoxyl radicals. Unlike galloyl groups which coordinated efficiently with
Fe3+, no coordination takes place between phenoxyl radicals and Fe3+ ions. The
absence of galloyl groups which had been replaced with phenoxyl radicals
resulted in the slowing down of Au@PTAs aggregation. Thus, the formation
and aggregation of oligomers was more favourable than the aggregation of
Au@PTAs.

32
Figure 2.12: a) SEM images of Au@PTA nanocomposites incubated with Fe2+.
b) SEM image of Au@PTA incubated with Fe2+ and H2O2 with low and high
magnification (inset).
Equations:
(1)
(2)
(3)
2.3 Conclusion
In conclusion, we have developed a highly sensitive Fe3+ and H2O2
sensor based on Au@PTA core@shell nanocomposites. Au@PTA was
prepared by one-pot synthesis mixing of TA and gold salt together in mildly
alkaline pH condition under constant vortex for 20 min at room temperature.
TA reduced the gold salt to form AuNP and itself oxidized into PTA. The PTA
then assembled onto the AuNP to form Au@PTA nanocomposites.
Relying on Fe3+ coordination to galloyl groups on TA, we developed a
highly selective and sensitive sensor for detecting Fe3+. The minimum detection

33
limit for naked eye colour change from red to blue in the presence of Fe3+ only
is at a hitherto unreported low of 20 M. Leveraging on the oxidation of Fe2+ to
Fe3+ by H2O2, we were able to develop our sensor further to detect H2O2 when
Au@PTA was mixed together with Fe2+. The naked eye detectable colour
change for this assay was 0.4 M of H2O2. The high sensitivity of the H2O2
assay maybe explained by the formation of “wire-like” oligomer formed due to
the presence of phenoxyl groups and the absence of galloyl groups.
As iron and its ions are important biological minerals while H2O2 is an
important chemical intermediary in various industries, it is imperative that a
highly sensitive, selective and easily visible read-out is available to detect the
presence of Fe3+ and H2O2 [176-179, 182-187]. Herein, we have developed a
PTA coated Au core@shell nanocomposite that fulfils these criteria. Coupled
with its green, one-pot and one-step synthesis method, our assay is highly
advantageous.
Future work will involve testing our Au@PTA nanocomposites for use
in clinical settings for quantifying Fe3+ or H2O2 levels. Possible bodily fluids for
testing may include blood, urine, saliva and cerebral spinal fluids [188-190].
One challenge to overcome is that the additional colour from the bodily fluid
sample may create noise signals in our visual detection system. Colourless
samples such as saliva will not pose a problem. Neither will urine samples that
are yellow in colour as the intensity of the Au@PTA assay will overcome the
yellow colour. Blood however, is red in colour and because Au@PTA is also
red in colour, blood samples will certainly interfere with the Au@PTA assay.
One method to overcome this is to only test the platelet poor plasma fraction of
the blood sample [191]. Platelet poor plasma fraction of blood can be obtained

34
by centrifuging the blood sample. Another challenge to overcome is that of the
formation of protein corona by proteins in the clinical samples on the Au@PTA
nanocomposites when these samples are presented to the assay [192, 193].
Protein coronas are known to prevent the aggregation of nanoparticles [194]. As
the assay relies on aggregation of Au@PTA to drive the assay’s colour change,
protein corona formation could pose a challenge to the assay from working
ideally. Further investigation is required to examine if Fe3+ is able to overcome
the protein corona’s effect and still drive Au@PTA to aggregate before the
assay can reach clinical standard.
Nonetheless, tannic acid is unable to form coordinate bonds with
hydrocarbons and odours. To detect these particles, proteins, specifically
odorant binding proteins are used. Attempts to improve the detection of these
particles are discussed in the next chapter.
2.4 Materials and Methods
Materials
Hydrogen Tetrachloroaurate Hydrate (HAuCl4·3H2O), Hydrogen
Peroxide (H2O2), Trisodium Citrate, Tannic Acid (TA), Sodium Borohydride
(NaBH4), Silver Nitrate (AgNO3), Rubidium Chloride (RbCl), Calcium
Chloride (CaCl2), Manganese Chloride Tetrahydrate (MnCl2·4H2O), Colbalt(II)
Nitrate Hexhydrate (Co(NO3)2·4H2O), Nickel Sulphate Hexahydrate
(Ni2SO4·6H2O), Copper(II) Sulphate Pentahydrate (CuSO4·5H2O), Zinc
Sulphate Heptahydrate (Zn2SO4·6H2O), Cadmium Chloride (CdCl2),
Mercury(II) Chloride (HgCl2), Aluminium Postassium Sulphate Dodecahydrate
(AlKO8S212H2O), Potassium Chromium(III) Sulphate Dodecahydrate

35
(CrKO8S2·12H2O), Neodymium(III) Chloride Hexahydrate (NdCl3·6H2O),
Gadolinium(III) Chloride Hexahydrate (Cl3Gd·6H2O), Dysprosium(III)
Chloride Hexahydrate (Cl3Dy·6H2O), Iron (III) Chloride Hexahydrate
(FeCl3·6H2O), and Iron (II) Chloride (FeCl2), were purchased from Sigma-
Aldrich, Sodium Chloride (NaCl), Potassium Chloride (KCl) were purchased
from Merck. Magnesium Sulphate Anhydrous (MgSO4) was purchased from
MP Biomedicals. All chemicals were used as received. Phosphate buffer (PB),
sodium salt (pH = 7.8, 10 mM) was used for synthesizing PTA-based
core@shell nanocomposites. Water used in all experiments was deionized and
ultrafiltered to 18 MΩ·cm using a Milipore Milli-Q gradient system.
Synthesis of core-shell metal@PTA nanocomposites
Au@PTA nanocomposites were prepared by pipetting 50 L of TA (40
mg mL−1) into 10 mL HAuCl4·3H2O (1 mM) in 10 mM PB (pH = 7.8) at room
temperature in Corning conical tube. It is to be noted that synthesis in other
tubes (e.g. BD Falcon) did not yield any nanoparticle. The suspension was then
vigorously mixed with a vortex mixer for 20 minutes. The colour of the solution
turned red and gradually deepened until no further colour change was observed.
The obtained Au@PTA were collected by centrifugation (9000 x g for 15
minutes) and rinsed with water twice. Bare AuNPs were synthesized using the
same method, except that PB solution (pH = 7.8, 10 mM) was replaced with DI
water. When conducting pH-dependent experiments, various buffer systems
were used to adjust the pH value: pH = 3.3, glycine − HCl (10 mM); pH = 6.0,
7.0, 7.8, PB (10 mM); pH = 8.5, Tris-HCl (10 mM).
Characterization

36
The size and morphology of the synthesized materials were
characterized using field-emission scanning electron microscopy (FE-SEM,
JEOL JSM-6700F) at an acceleration voltage of 5 kV, trans-mission electron
microscope (TEM, Hitachi H-7500), and HRTEM with an energy dispersive X-
ray spectrometry (HRTEM-EDX, FEI, Tecnai G2 F20). Zeta-potential
measurements were conducted in water by a potential analyser (Zetasizer Nano
ZS, Malvern Instruments). UV–vis absorption tests were carried out on
Shimadzu UV-2450 spectrophotometer in transmission mode.
Highly selective visual detection of Iron (III) cations
The standard procedure is as follows. Briefly, aliquots of 1 mM Fe3+
were added to the aqueous Au@PTA solutions (1 mL) to yield the final
concentration series (1.0 M − 400 M). We also investigated the selectivity of
our new approach for Fe3+ over other metal ions (Na+, K+, Rb+, Ag+, Mg2+,
Ca2+, Mn2+, Fe2+, Co2+, Ni2+, Cu2+, Zn2+, Cd2+, Hg2+, Al3+, Cr3+, Dy3+, Gd3+,
Nd3+) under the same conditions. The colour change from red to blue indicates
successful detection of specific ions. It is to be noted that aggregates may form
after a few days. UV–vis spectra were acquired to investigate the interaction
between the ions and Au@PTA.
Visual detection of H2O2
Au@PTA solution was added to a 96-well plate to a volume of 100 L.
Subsequently, Fe2+ was added to final concentration of 20 M. The reaction
was started by adding various volume of 100 M H2O2.

37
Chapter 3
On the odorant binding properties of the truncated pig Odorant Binding
Protein
3.1 Introduction
For the detection of PAH and odorants, aggregation of Au@PTA is an
unsuitable strategy as these compounds are hydrophobic and do not coordinate
with the galloyl groups of tannic acid. Instead, the pig Odorant Binding Protein
(pOBP) is utilized. Previous studies have shown the binding of pOBP to PAH
and odorants [195]. Diphenyl binds to mutated pOBP with a dissociation
constant of 0.14 M, while anthracene has a dissociation constant to the
mutated pOBP at 1.0 M. In fact, the pOBP has also been used as a receptor
protein and immobilized on various systems such as the graphene field effect
transistor (gFET) to render a bioassay [196, 197]. In this chapter, we examined
the impact which the deletion of a domain in the pOBP has on the protein’s
binding capacity towards different odorants. As the pOBP binds to several
ligands, it is of potential use as a receptor protein in bioassays and can be
immobilized on various systems such as the gFET [196, 197].
The current method of measuring PAH and odorant concentrations is
through the use of analytical equipment such as the gas chromatography, high
performance liquid chromatography or mass spectrometry [198-202]. These
methods yield low limit of detection of down to 0.001 g mL-1. However, in
order to eliminate the need for cumbersome equipment, research is now turning
towards developing biosensors that can be miniaturized onto chips. These
biosensors utilize olfactory receptors for the receptor components [203-205].

38
These are the closest biosensors that mimic the function of olfactory receptors.
However, as these olfactory receptors are membrane proteins, refolding in lipid
membrane is required. This is unlike OBPs which are soluble proteins and thus
advantageously do not require refolding in a lipid membrane.
In this project, we study the effects in the binding properties of pOBP
upon the deletion of the alpha helix tail, beginning from amino acid: 121,
glycine (pOBPΔ121). Instead of using pOBP wild type, we used a previously
examined mutant pOBPM2 that bears a tryptophan in position eighty-eight
instead of phenylalanine. pOBPM2 had been mutated from pOBP wild type to
have a higher affinity to PAH [195]. Our truncated protein will thus be known
as pOBPM2Δ121. Till date, however, no study in the properties of the deletion
in the alpha helix tail has been conducted for pOBP or any lipocalin.
Additionally, we also hypothesize that the absence of the tail, which acts as a
gate, will allow for stronger ligand interaction with the inner core of the beta
barrel. As such, the dissociation constant of ligands to pOBPM2Δ121 ought to
decrease. In the context of bioassays, we expect the sensitivity to therefore
increase. Minimum detection limit ought to also decrease.
3.1.1 Odorant Binding Proteins
The vertebrate OBPs, which include pOBP, are a member of the
lipocalin family of protein. They are structurally conserved with eight stranded
anti-parallel beta barrel and an alpha helix tail. A disulphide bridge is formed at
the end of the alpha helix tail with the fourth strand of the beta barrel [206,
207]. This structure of lipocalin (and OBPs) is the same in most members of the
family except for the bovine OBP, which lacks the disulphide bridge [208-214].

39
Bovine OBP protein engages in domain swapping to form a dimer and thus
stabilizes the structure. Mutations of pOBP’s cysteines in the alpha helix tail
and beta barrel to remove the disulphide bridge as well as the deletion of
glycine at position 121, yields a pOBP physiologically similar to the bovine
OBP [210, 211, 214, 215].
Hydrophobic molecules bind to the core of the beta barrel of lipocalins
despite their diverse roles and tissue expression levels [207, 216]. Lipocalins
found in tears are postulated to either scavenge for or deliver lipids to the eyes
[217]. Major urinary proteins, another sub-group of lipocalins, are thought to
deliver pheromones into the environment [218, 219]. Boar salivary lipocalins,
binding to steroid male pheromones, are thought to be involved in sexual
arousal [220, 221].
Figure 3.1: Model of pOBPM2. The structure is ubiquitous to all lipocalins.

40
The first vertebrate OBP was discovered in 1982 by Pelosi et al. in cow
olfactory mucosa while searching for olfactory receptors [222]. Since then,
orthologues were found and isolated in sheep, mouse, rabbit, pig, human, and
other vertebrates [223-226]. The crystal structure for some of the OBPs has also
been solved [206, 227]. Advent of whole organism gene sequencing has led to
the identification of six panda OBPs [227]. With the genomic sequencing and
subsequent discovery and functional characterizations of olfactory receptors,
these proteins were recognized as those responsible for recognising odorants
and starting the signal processing cascade [228-231]. Thereafter, the role of
OBP was proposed to be an aider in the transportation of hydrophobic odorants
across the hydrophilic nasal mucosa to the olfactory receptors on the cilia of
olfactory neurons [232, 233]. High concentrations of odorants in the nasal
cavity drive the binding of odorants into the OBP. Upon travelling through the
nasal mucosa to the olfactory bulb, low concentrations of odorants in the
surrounding olfactory bulb drives the OBP to release the odorants. The odorants
in turn bind onto the olfactory receptors [234]. Therefore, the dissociation
constant of odorant to OBP ought to be higher than that of the olfactory
receptor. Some OBPs perform similar roles by delivering pheromones to the
vomeronasal organ [235].

41
Figure 3.2: Sequence alignment of various OBPs, hOBP, human OBP; rOBP,
rabbit OBP; pOBP, pig OBP; bOBP, bovine OBP. The figure is cited from:
Schiefner et al. [236] – published by the Wiley Periodicals, Inc.
Nevertheless, reverse chemo ecology experiments have shown that
OBPs bind a wide variety of odours [237]. This renders OBPs suitable for use
as the receptor modulus of bioassays. In fact, two OBPs, pOBP and insect A.
mellifera (structurally different from lipocalins) have already been developed
for use in gFET sensor [196, 197]. Initial studies of binding experiments relied
on the use of radioligands to conduct competitive binding assays with various
odours for determination of dissociation constants [237, 238]. Thereafter, the
radioligands were replaced with fluorescent probes such as 1-Aminoanthracene
(1-AMA), or N-phenylnapthalen-1-amine (1-NPN) [239, 240].

42
Figure 3.3: a) The OBP’s interaction with fluorescent probe and odorants as
they are added to the protein. Upon addition of fluorescent probe (yellow),
some fluorescent probe enters into the OBP leading to fluorescence being
present. The fluorescence is represented by the yellow rays. When odorants
(dark blue) are added, it competes with the fluorescent to bind with the OBP.
Less fluorescent probe now binds to the OBP and the total fluorescence
intensity drops. b, c) Docking simulation result of positioning of fluorescent
probe 1-NPN (b) and 1-AMA (c) in the pOBPM2 protein.
The exact factors and their contribution to causing the odorants and
PAH to have different binding properties to the OBP are not yet known.
However, we do know for certain that size is one of the factors. Molecules are
to be small enough to enter the binding pocket of the OBP. Another factor is
hydrophobicity. Only hydrophobic molecules can enter the binding pocket of

43
the OBP. An interesting factor is chirality. Different chirality of a molecule can
have different binding properties to the OBP [241]. Recently, it has been shown
that the mutation of the amino acids in the binding pocket of the OBP can
reverse the binding properties of the chiral molecules [242].
3.1.2 Expression of Recombinant Proteins in E. coli
Proteins are polypeptide chains with at least the molecular weight of 10
kDa [243]. The pOBP has a theoretical molecular weight of 17.7 kDa. Protein
sequences are encoded by DNA sequences, where each amino acid is encoded
by three base pairs. According to the central dogma of molecular biology, in the
cells, DNA is first transcribed into mRNA with RNA polymerase. With the aid
of ribosomes, the mRNA is translated into the protein sequence [244-246].
To synthesize the proteins recombinantly through the use of bacteria
(especially E. coli) cells, nucleotide sequences has to be obtained. One method
is through the use of Edman degradation [247-249]. Certain protein genes,
already sequenced may be obtained from gene banks such as Universal Protein
Resource (Uniprot) [250]. These genes may then be synthesized artificially
(genetic engineering) and cloned into an expression plasmid vector.
Plasmids, which are circularized DNA, normally function to enable
horizontal gene transfers between bacteria through the pili [251]. However, in
genetic engineering of plasmids for protein synthesis, they are outfitted with
three crucial functions: an origin of replication, an antibiotic resistance gene
and a promoter sequence for expression of the protein of interest, the pOBP
gene in our case [252-254]. Origin of replications enables E. coli to replicate
the plasmid DNA enabling mass production of plasmids. Antibiotic resistance

44
gene when expressed in respective organism confers survivability of organisms
in the presence of antibiotics. This allows for selection of colony clones
containing the plasmids.
To clone the gene of interest into the expression plasmids, restriction
enzymes cleave the ends of the gene of interest and the expression plasmid
separately [255, 256]. This is followed by ligation of the gene of interest into
the expression plasmid before transformation of the ligated plasmid into
chemically competent E. coli [257, 258]. For storage or plasmid amplification
purposes, DH5α strain of E. coli is used. DH5α E. coli is mutated to deactivate
its endonuclease protein rendering it suitable as glycerol stock for plasmid
storage purposes [259, 260]. For production of protein, the BL21 (DE3) E. coli
and its derivative strains are commonly used as these strains contain the lac
operon T7 promoter in its genome [261-264].
Activation of T7 promoter is done by addition of isopropyl-Beta-D-
thiogalactopyranosid (IPTG). The IPTG is analogous to lactose, and its
introduction inhibits the repressor’s activity, allowing for the activation of the
Lac Operon situated upstream of the T7 promoter in the native E. coli genomic
DNA. Thus, the T7 promoter is synthesized and drives the expression of the
gene of interest in the plasmid [261-264].
After expression, proteins that are extracted from the E. coli cytoplasm
through sonication or by using the French press. Alternatively, proteins directed
to the periplasm by the incorporation of PelB leader sequence are extracted via
osmotic lysis [265-267]. Thereafter, the proteins are purified by running
through separation columns usually with the aid of a Fast Protein Liquid
Chromatography (FPLC) system. Proteins are separated based on intrinsic

45
characteristics, such as charges, hydrophobicity, mass, and tag presence. Ion
exchange chromatography separates proteins based on charges [268-272].
For the pOBPM2 and pOBPM2Δ121, the GE Healthcare Life Sciences
HiTrap QFF anion exchange column is used for purification. As the theoretical
isoelectric points of the proteins are 4.37 and 4.51 respectively, the two proteins
would be of negative charge when buffered in pH 7.4 buffer and thus binds to
the positively charged anion column. The gradual increase of salt results in the
dislodging of the protein from the column as the salt competes with the protein
in binding to the column. As such, the protein of interest is separated from other
proteins and is thus purified.
Figure 3.4: Overview steps for protein production and purification. a, b) Gene
of interest and double digested vector backbone are ligated into a full plasmid.
c, d) Ligated plasmid with gene of interest are transformed into competent E.
coli cells. e) The transformed E. coli cells are grown and IPTG is added to

46
induce protein production. f, g) Proteins are collected and cleaned up through
application in purification columns.
3.1.3 Binding Properties
In a mixture of receptors and ligands, which in this chapter would be
specifically pOBP, and PAH or odorants respectively, there will exist three
species of substances: the receptor, the ligand, and the receptor-ligand complex.
The model is as such:
[𝑅. 𝐿] ⇋ 𝑅 + 𝐿
The ratio of the concentrations receptor-ligand complex against the product of
receptor and ligand concentrations at equilibrium is termed the association
constant and describes the affinity of the ligand to the receptor. Conversely, the
reciprocal of the association constant is termed the dissociation constant.
(1)
As observed from equation (1), as per Le Chatelier’s principle, the
disturbance in concentration of either receptor or ligand will result in the
establishment of a new equilibrium with a new concentration of receptor-ligand
complex. However, the dissociation constant value remains the same. The value
is unique to each binding pair.
In the end point binding studies between ligands and receptors, it is
possible to determine ligand concentration, receptor-ligand complex
concentration, and total receptor concentrations. It is not possible to determine
ligand-free receptor concentration. As such, equation (1) requires
𝐾𝐷 =[𝑅][𝐿]
[𝑅. 𝐿]
47
rearrangement to eliminate the unmeasurable ligand-free receptor
concentration.
Rearranging equation (1) gives rise to the Hill Equation [273-276]:
(2)
In a competitive end point binding assay, another species of competitive
ligand will be present and the model will be as such:
[𝑅. 𝐿] + 𝐶 ⇋ 𝑅 + 𝐿 + 𝐶 ⇋ [𝑅. 𝐶] + 𝐿
Resolving this model gives the formula:
(3)
This formula is also the precursor to the commonly used formula
reported in various papers for the calculation of KC [195, 227, 277].
(4)
Nonetheless, the dissociation constant between a ligand and a receptor is
also dependent on the temperature as expounded by the Arrhenius equation.
The dissociation constant of the ligand is related to the reaction standard
state Gibbs free energy by the equation:
(5)
Here, R is the ideal gas constant and T, the temperature in Kelvins.
At equilibrium, the ratio of the concentrations receptor-ligand complex,
receptor, and ligand concentrations will result in the minimization of Gibbs free
[𝑅. 𝐿] = [𝑅]𝑇𝑜𝑡𝑎𝑙[𝐿]
𝐾𝐿 + [𝐿]
[𝑅. 𝐿] = [𝑅]𝑇𝑜𝑡𝑎𝑙[𝐿]
𝐾𝐿(1 +[𝐶]𝐾𝐶
) + [𝐿]
𝐾𝐶 = [𝐼𝐶50]𝐾𝐿
𝐾𝐿 + [𝐿]
∆𝐺ᴼ = −𝑅𝑇 𝑙𝑛 𝐾𝐷
48
energy. The first-order differentiation of total Gibbs free energy with respect to
‘reaction progress’, meaning, the ratio concentration of the receptor-ligand
complex, will give the equation [278]:
(6)
Thereafter, since it is a minima value, the first-order differentiation will
be equal to zero. As such, we equate equation (6) to zero:
(7)
The rearrangement of equation (7) will have us arrive at equation (5).
The Gibbs free energy equation is stated below:
(8)
3.2 Results and Discussions
3.2.1 Expression and Purification of Proteins
We first ran SDS Page gels to confirm that the proteins pOBPM2 and
pOBPM2Δ121 were expressed (Figure 3.5). The protein pOBPM2 was found in
the soluble and insoluble fractions. However, pOBPM2Δ121 was only found in
the insoluble fraction.
Interestingly, we observed that the bands for lanes 1 and 2 to be very
faint for pOBPM2 as compared to pOBPM2Δ121. The volumes of bacterial cell
culture used to prepare the SDS Page samples were equal. This meant that the
density for pOBPM2 cell culture was much lower than that of the
pOBPM2Δ121. A possible reason for this is that the bacterial cells containing
the pOBPM2 plasmids were growing at a slower rate than the bacterial cells
containing the pOBPM2Δ121 plasmids. The pOBPM2 plasmid being longer
∆𝐺ᴼ + 𝑅𝑇 𝑙𝑛 𝐾𝐷
0 = ∆𝐺ᴼ + 𝑅𝑇 𝑙𝑛 𝐾𝐷
∆𝐺ᴼ = ∆𝐻ᴼ − 𝑇 ∆𝑆ᴼ

49
would have more nucleotides, requiring more nutrients for its replication.
Henceforth, lesser nutrients were available for bacterial cell replication. For
lanes 3 and 4, this problem was absent as the samples were equalised to have
the same amount of overall protein. This was possible as the cells were already
sonicated and the proteins were extracted and thus measurable.
Figure 3.5: SDS Page gels for pOBPM2 (a) and pOBPM2Δ121 (b). Proteins
pOBPM2 and pOBPM2Δ121 have an apparent molecular weight of 23kDa and
14kDa respectively. Actual theoretical weight however is 17.8kDa and
13.5kDA for pOBPM2 and pOBPM2Δ121 respectively. The lanes in the SDS
Page gels are ladder (1), non-induced with IPTG (2), induced with IPTG (3),
soluble fraction after sonication (4), insoluble fraction after sonication (5).
Next, urea was used to solubilize the pOBPM2Δ121 which underwent
three rounds of dialysis to refold in urea free soluble fraction. The soluble
fraction of protein pOBPM2 was directly taken for purification.
The solubilized fractions of the two proteins were purified through a
HiTrap QFF anion exchange column with increasing salt concentration gradient
wise. For pOBPM2, we were able to obtain high purity. However, for
pOBPM2Δ121, many contamination proteins are present in the eluted fractions
(Figure 3.6).

50
Figure 3.6: a) Chromatogram for pOBPM2 purification. b) SDS Page gels of
collected fractions from pOBPM2 purification. The lanes are as follow: Lane 1,
Ladder. Lanes 2 to 10, Fractions 20 to 27. Fraction 23, circled in red was used
for binding property analysis. c) Chromatogram for pOBPM2Δ121 purification.
d) SDS Page gels of collected fractions from pOBPM2Δ121 purification. The
lanes are as follow: Lane 1, Ladder. Lanes 2 to 10, Fractions 32 to 39. Fractions
34 to 39, circled in red were pooled together and applied to the column a second
time for further purification.
To further purify the pOBPM2Δ121 protein, fractions from the first run
containing the protein were pooled together. This was then applied into the
column with increasing salt concentration step wise, with five columns volume
for each step (Figure 3.7). Purified pOBPM2Δ121 fractions were obtained.

51
Figure 3.7: a) Chromatogram for pOBPM2Δ121 purification. d) SDS Page gels
of collected fractions from pOBPM2Δ121 purification. The lanes are as follow:
Lane 1, Ladder. Lanes 2 to 10, Fractions 16, 20, 21, 22, 23, 26, 31, and 36.
Fraction 22, circled in red was used for binding property analysis.
3.2.2 End Point Binding Studies of Proteins
End point binding studies were done on Purified pOBPM2 and
pOBPM2Δ121 to determine the dissociation constant of various ligands. We
first incubated the proteins with varying concentrations of fluorescent probes to
establish the kinetics of the proteins with the fluorescent probes. Thereafter,
endpoint competitive binding assays of respective ligands with the fluorescent
probes were done. 1-AMA was initially chosen as past experiments relied on
the use of 1-AMA as the fluorescent probe [195, 240]. However, it was soon
realized that 1-AMA does not bind at all to pOBPM2Δ121. Thereafter, 1-NPN,
which has never been used to study pOBP or pOBPM2, was used as an
additional probe (Figure 3.8). Fluorescent probe assays were modelled upon:
[𝑃. 𝐹] ⇋ 𝑃 + 𝐹
The model gives rise to the Hill equation as observed in equation (2).
The formula is thus:

52
(9)
Figure 3.8: a) Fitted curves with Hill equation of 1-NPN (Red) and 1-AMA
(Blue) binding to pOBPM2. b) Dissociation constants based on fitted curves.
To elucidate the dissociation constants of the various odorants,
appropriate curve fittings were utilized (Figure 3.9). Assuming that there only
was a single binding site and only one molecule (probe or odour) can fit in at
each instances, the model would be as such:
[𝑃. 𝐹] + 𝑂 ⇋ 𝑃 + 𝐹 + 𝑂 ⇋ [𝑃. 𝑂] + 𝐹
Resolving this model gives rise to equation (3). The formula is thus:
(10)
[𝑃. 𝐹] = [𝑃]𝑇𝑜𝑡𝑎𝑙[𝐹]
𝐾𝐹 + [𝐹]
[𝑃. 𝐹] = [𝑃]𝑇𝑜𝑡𝑎𝑙[𝐹]
𝐾𝐹(1 +[𝑂]𝐾𝑂
) + [𝐹]
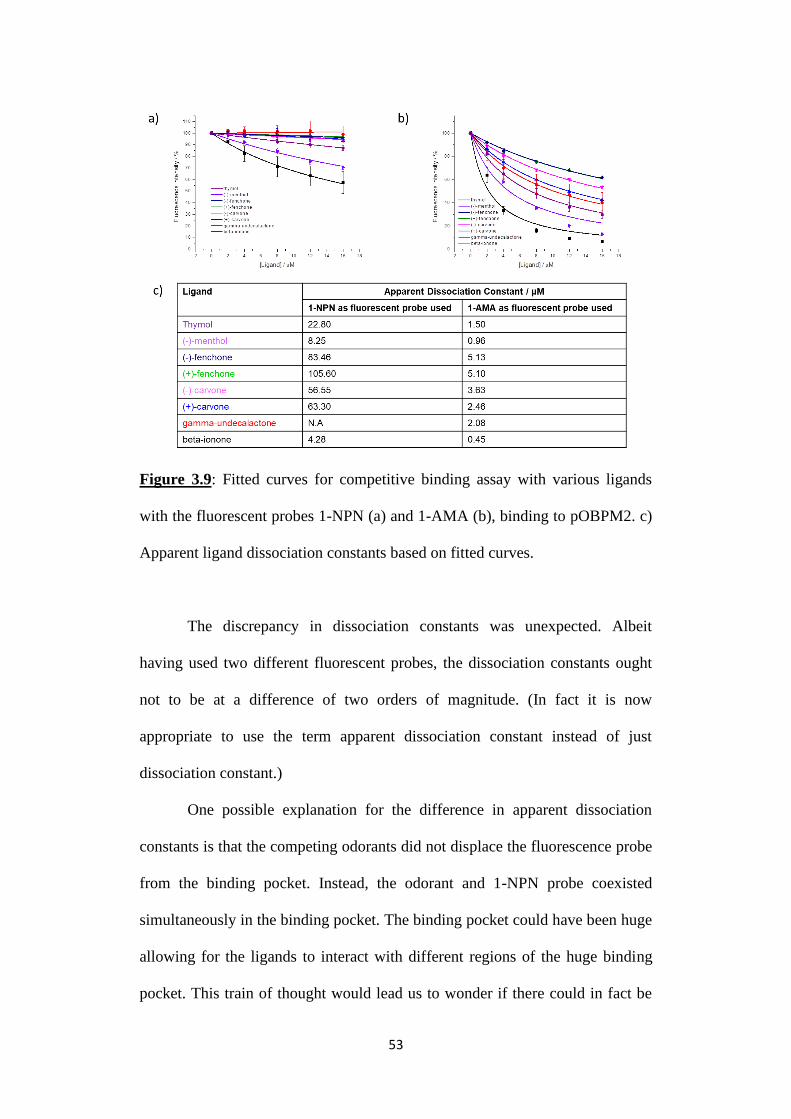
53
Figure 3.9: Fitted curves for competitive binding assay with various ligands
with the fluorescent probes 1-NPN (a) and 1-AMA (b), binding to pOBPM2. c)
Apparent ligand dissociation constants based on fitted curves.
The discrepancy in dissociation constants was unexpected. Albeit
having used two different fluorescent probes, the dissociation constants ought
not to be at a difference of two orders of magnitude. (In fact it is now
appropriate to use the term apparent dissociation constant instead of just
dissociation constant.)
One possible explanation for the difference in apparent dissociation
constants is that the competing odorants did not displace the fluorescence probe
from the binding pocket. Instead, the odorant and 1-NPN probe coexisted
simultaneously in the binding pocket. The binding pocket could have been huge
allowing for the ligands to interact with different regions of the huge binding
pocket. This train of thought would lead us to wonder if there could in fact be
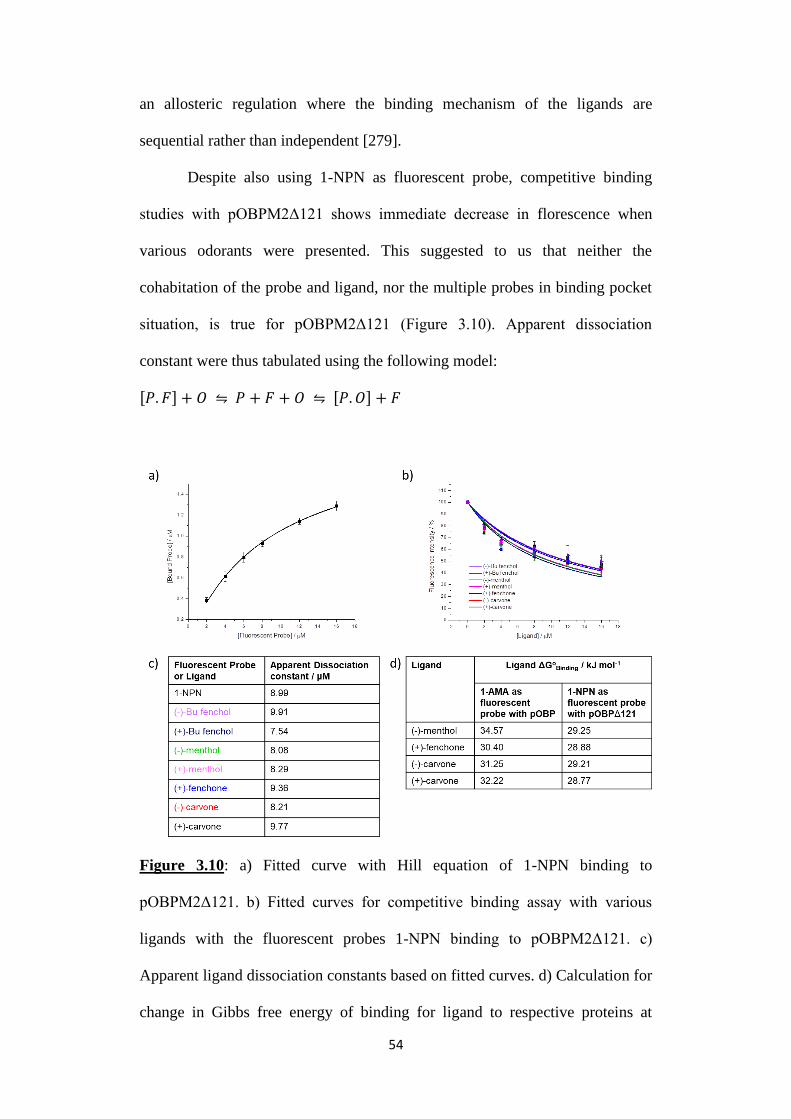
54
an allosteric regulation where the binding mechanism of the ligands are
sequential rather than independent [279].
Despite also using 1-NPN as fluorescent probe, competitive binding
studies with pOBPM2Δ121 shows immediate decrease in florescence when
various odorants were presented. This suggested to us that neither the
cohabitation of the probe and ligand, nor the multiple probes in binding pocket
situation, is true for pOBPM2Δ121 (Figure 3.10). Apparent dissociation
constant were thus tabulated using the following model:
[𝑃. 𝐹] + 𝑂 ⇋ 𝑃 + 𝐹 + 𝑂 ⇋ [𝑃. 𝑂] + 𝐹
Figure 3.10: a) Fitted curve with Hill equation of 1-NPN binding to
pOBPM2Δ121. b) Fitted curves for competitive binding assay with various
ligands with the fluorescent probes 1-NPN binding to pOBPM2Δ121. c)
Apparent ligand dissociation constants based on fitted curves. d) Calculation for
change in Gibbs free energy of binding for ligand to respective proteins at

55
300K. Dissociation constant used for calculation are obtained from Figure 3.9c
and Figure 3.10c.
We observed here an increase in dissociation constants (and thus
increase in change in Gibbs free energy for binding) of the various odorant
ligands and fluorescence probe to the truncated protein as compared to the non-
truncated protein.
To further confirm that the tail deletion was responsible for the decrease
in association of the odorants to the protein, we tested the binding of various
odorants to a highly mutated pOBPM2 and its truncated version (pOBPMM2
and pOBPMM2Δ121). The mutations included three amino acids in the binding
pocket (V80A, V90A, and N102K). Firstly, we observed that the binding of the
fluorescent probe 1-NPN to pOBPMM2 was lower than that of pOBPM2 by an
order of magnitude. Among the odorant ligands that exhibited binding
properties to the pOBPMM2 and pOBPMM2Δ121, we saw immediate decrease
in fluorescence, this suggested to us that the pOBPMM2 and pOBPMM2Δ121
have neither the properties of two fluorescence probe nor fluorescent probe and
ligand coexisting in the binding pocket. We also observed that certain odorant
ligands did not bind to the two proteins and their introduction brought about a
stark increase in fluorescence. Amongst the odorants that can bind to both
proteins, we notice an increase in dissociation constant for binding to
pOBPMM2Δ121 as compared to pOBPMM from between 32% to 434%
depending on the odour presented (Figure 3.11). Here, the apparent dissociation
constant for competitive binding was fitted with the following curve:

56
(10)
Figure 3.11: a) Fitted curve with Hill equation of 1-NPN to pOBPMM2 (Red)
and pOBPMM2Δ121 (Blue). b) Fitted curves for competitive binding assay
with various ligands with the fluorescent probes 1-NPN binding to pOBPMM2.
c) Fitted curves for competitive binding assay with various ligands with the
fluorescent probes 1-NPN binding to pOBPMM2Δ121. d) Table of apparent
dissociation constants and change in Gibbs free energy of binding for the each
fluorescence probe or odorant ligand to respective proteins at 300K.
3.3 Conclusion
Here, we have shown clearly that the hypothesis that the tail acts as a
gating mechanism to ligand entry and thus its removal would allow greater
[𝑃. 𝐹] = [𝑃]𝑇𝑜𝑡𝑎𝑙[𝐹]
𝐾𝐹(1 +[𝑂]𝐾𝑂
) + [𝐹]

57
ligand interaction to the pOBP binding pocket is false. Instead, the tail is crucial
for providing stability to the ligands in the binding pocket. The entropy for the
pOBP without the tail is lower than that of the pOBP with the tail.
Nevertheless, we have uncovered here a pitfall in the liberal use of
fluorescent probes in competitive binding assays. The calculation of IC50 and
apparent dissociation constants verily depends on the interactive model of the
ligands and proteins [280].
One limitation to using pOBPs or OBPs in general as receptors for
detecting odorants or PAH is that the pOBP is unspecific. As observed in our
experiment, albeit at different binding constants, the pOBP binds to a host of
odorants. Recent research has shown promise in altering the binding specificity
of the pOBP by mutating the amino acids with the side chains facing the
binding pocket of the pOBP [242]. Further work in mutating different OBPs
can be done to confer more specificity to OBP binding.
Future work through the use of X-ray crystallography with protein in
complex with various ligands ought to be performed to determine the binding
site and capacity of the various odorants and fluorescence probe to the pOBP
and the truncated pOBP. Partial truncation of the tail domain as well as the
replacement of the alpha helix in the tail domain to perhaps GALA peptide will
also be helpful to investigate the tail’s importance to the pOBP’s structure.
Nonetheless, care must be taken with the use of X-ray crystallography in
observing protein ligand interactions. For example, the binding of various
alcohols to the LUSH OBP (structurally not a lipocalin) was proven to be false
despite X-ray crystallography data showing otherwise [281, 282]. Meanwhile, it
is therefore shown that the only proven method to enhance the binding of

58
ligands to pOBP for use as receptor on 2-dimensional transducer surfaces is
through the directed evolution and mutation of the amino acids in the pOBP
binding pocket [195].
Odorants and PAH interact in many ways with the human body. Their
detection by the pOBP is due to its ability to enter the binding pocket of the
pOBP. Other analytes such as biomarkers are much bigger or are not
hydrophobic in nature. They are unfortunately unable to enter the binding
pocket. Other strategies such as chimeric antigen receptor are required and will
be discussed in the next chapter.
3.4 Materials and Methods
Synthesis of pOBPM2Δ121 and pOBPMM2Δ121 genome
The pOBPM2 and pOBPMM2 genes cloned into pET-5b plasmid were
amplified using Phusion High Fidelity DNA polymerase (Thermo Fisher
Scientific) with the forward primer: 5’-atatacatATGcaagagcctcaacctgagca-3’
and reverse primer: 5’agctcgaatTCATCAtttgcccaacagtcccg-3’. Thereafter, the
PCR product was purified and digested with the restriction enzymes: NdeI and
EcoRI (Thermo Fisher Scientific). The digested PCR product was purified and
ligated back into the pET-5b plasmid vector with T4 ligase (Thermo Fisher
Scientific), yielding pOBPM2Δ121 and pOBPMM2Δ121 respectively.
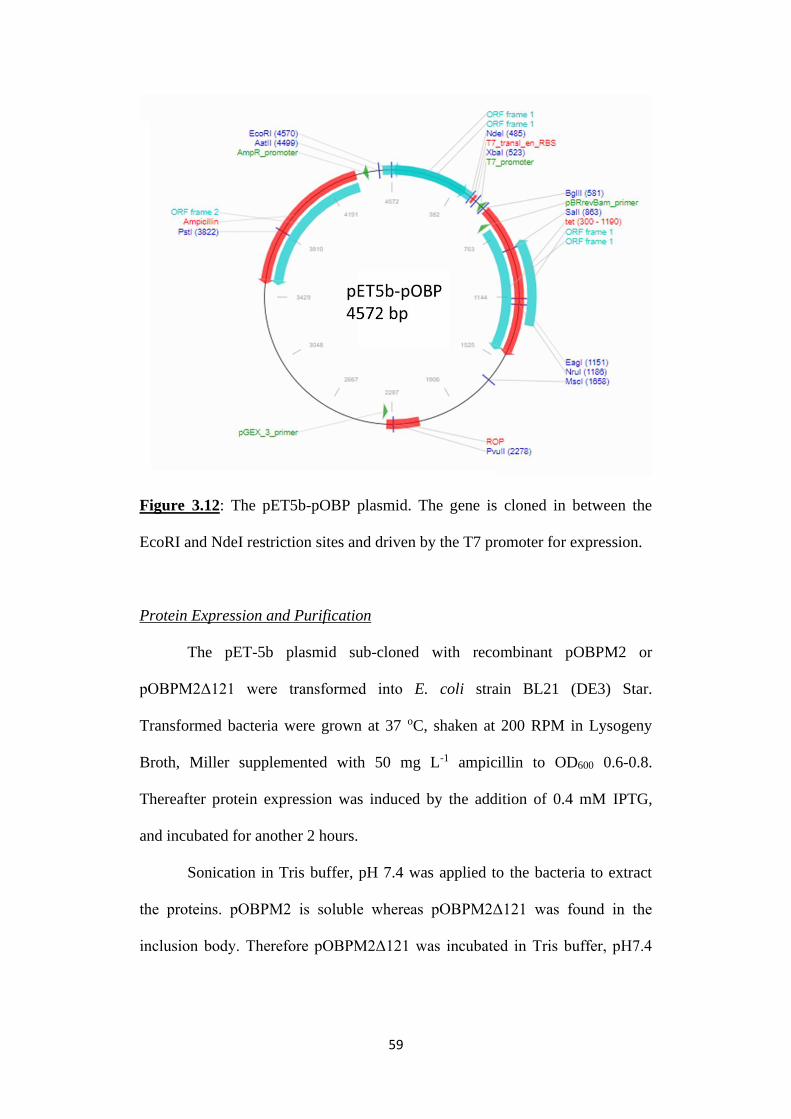
59
Figure 3.12: The pET5b-pOBP plasmid. The gene is cloned in between the
EcoRI and NdeI restriction sites and driven by the T7 promoter for expression.
Protein Expression and Purification
The pET-5b plasmid sub-cloned with recombinant pOBPM2 or
pOBPM2Δ121 were transformed into E. coli strain BL21 (DE3) Star.
Transformed bacteria were grown at 37 oC, shaken at 200 RPM in Lysogeny
Broth, Miller supplemented with 50 mg L-1 ampicillin to OD600 0.6-0.8.
Thereafter protein expression was induced by the addition of 0.4 mM IPTG,
and incubated for another 2 hours.
Sonication in Tris buffer, pH 7.4 was applied to the bacteria to extract
the proteins. pOBPM2 is soluble whereas pOBPM2Δ121 was found in the
inclusion body. Therefore pOBPM2Δ121 was incubated in Tris buffer, pH7.4

60
supplemented with 6M Urea and 1mM Dithiotheritol for solubilisation before
undergoing dialysis three times for refolding.
Proteins were cleaned up by FPLC through a HiTrap Q FF anion
exchange chromatography column with either gradient or step function
protocol. Protein purity was confirmed with SDS Page analysis. Protein
concentration was determined by UV-vis by multiplying absorbance at 280 nm
with protein extinction coefficient.
Fluorescence binding assay
Fluorescent probes and odorant ligands were first prepared as stock
solution by dissolving in methanol at 1mM concentration. Thereafter, affinity of
fluorescence probe to protein was measured by incubation in a Perkin-Elmer
LS45 Spectrofluorometer. Proteins were diluted to 1 M or 2 M concentration
while fluorescence probes were added incrementally between 0.2 M and 16
M. For competitive binding assays, 2 M fluorescence probes were added to 2
M proteins before incremental addition of odorant ligands from 2 M to 16
M. When using 1-AMA fluorescence probe, excitation wavelength used was
375 nm with emission spectra recoded between 460 nm and 550 nm. Maximum
emission peak at 500 nm was used for determining apparent dissociation
constant. For 1-NPN fluorescence probe, excitation wavelength was 337 nm
while emission spectra recorded was between 380 nm and 450 nm. Maximum
emission peak at 410 nm was used for determining apparent dissociation
constant. Curve fitting was done on software OriginPro 8.5 with appropriate
curves. Error bars represent standard deviation of sample.
61
Chapter 4
Expression of Chimeric antigen receptors on the surface membrane of
HEK293FT cells in the accurate orientation
4.1: Introduction
The detection of soluble biomarkers has to rely on a new strategy and
cannot be done using Au@PTA or pOBP proteins. Biomarkers are unable to
form coordinate bonds with tannic acid, neither are they able to enter the
binding pocket of pOBP proteins. Here, we have designed a Chimeric antigen
receptor (CAR) for use as a cell based bioassay.
4.1.1: Cell based bioassays
Cell based bioassays rely on the whole cell in vitro or in vivo to act as
the receptor and readout. Typically, intracellular or membrane receptors detect
the presence of extracellular ligands. This in turn couples unto an intracellular
signalling pathway, transducing and amplifying a signal through the cell,
resulting in the activation of a gene that acts as the output signal [283, 284].
The intracellular pathway transducing the signal may be either native to the cell
or an artificially constructed circuit [285-290]. Since signal transduction can
only occur through the activation of the receptors, cellular bioassays are
advantageous in preventing unspecific binding as interactions between the
ligands and the membrane will result in no signalling [277, 291-293]. This is
unlike in the case of enzyme-linked immunosorbent assay (ELISA) where
unspecific binding can occur, resulting in false signals.

62
Apart from ELISA, other methods used to detect ligand analytes include
graphene Field Effect Transistor (gFET), Biolayer interferometry, Surface
Plasmon Resonance (SPR), and Quartz Crystals Microbalance [294-298]. In
general, these methods also rely on surface modification with receptors that
binds onto the analytes [299-306]. As such, these techniques like ELISA also
can result in false signals generated by unspecific binding. Various methods
have been proposed to reduce unspecific binding, however, cell based sensor is
able to eliminate the possibility of even unspecific binding generating signals
[307-312].
Figure 4.1: Signals received by the receptor in a cell based bioassay are
transduced either through the cell’s native signalling pathway or artificial
signalling pathway. The former allows for signal amplification through kinase
cascades (Purple). The latter allows for design of logic gate circuits. Output
signal could be through detection of calcium influx or expression of reporter
genes.

63
Examples of protein receptor for cell based bioassay include the G-
protein coupled receptor (GPCR) and Chimeric Antigen Receptor (CAR).
GPCRs are a class of eukaryotic seven trans-membrane receptor
proteins that bind to a wide range of ligands [313-317]. The binding of ligand to
GPCR, causes a conformational change of the GCPR. This results in the
activation of G-protein, leading to a variety of signalling cascades within the
cell resulting in a gene activation response [318-321]. The wide range of
available ligand target makes it a good candidate for receptor purposes.
However, the folding and assembly of GPCR cell membrane requires an
endoplasmic reticulum and chaperone proteins [322-326]. Thus GPCR can only
be expressed natively in eukaryotic cells.
CARs are composed of an extracellular single chained Fragment
variable (scFv) recognition element, and an intracellular tyrosine containing
immunoreceptor tyrosine-based activation motif (ITAM) domain with a
transmembrane domain in between [293, 327]. Upon ligand binding, the CAR
crosslinks with the tyrosine in the ITAM phosphorylating and activates a native
signalling pathway.
As the signalling pathway in which these receptors converge unto brings
forth calcium influx into cells, presence of calcium influx is an indication of the
receptor’s activation, and conversely shows ligand presence. Electrophysiology
techniques coupling cells onto electronic chips may be used to detect the
calcium influx [328]. Conversely, calcium indicator dyes fluorescing due to
calcium chelation are also employed [329-331]. The fluorescence may be
detected through flow cytometry, plate reader or even observed under confocal
microscopy [332-334]. Calcium influx into cells has also been known to
64
activate NFκB and Nuclear factor of activated T-cells (NFAT) promoters [335-
337]. As such, by coupling luciferase genes or fluorescent protein genes after
the promoters, calcium influx can be observed through the expression of these
genes [338-341].
Recent advances in molecular biology, metabolic engineering and
synthetic biology have aided the advancement of cell based bioassay. Directed
evolution of receptor molecules has led to increased sensitivity and selectivity
[342-344]. Possible false response signal generated by cross talks in signalling
pathways can be knocked down by small interfering RNA or CRISPRi [345-
347]. With the aid of synthetic biology, artificial signalling pathways have also
been designed for signal transduction [286, 288, 289, 348-350]. These pathways
are designed to reflect electrical circuits, enabling the incorporation of logic
gates. For example, using AND gate, the expression of two transcription factors
due to activation of two receptors, result in the expression of the actuator
proteins [285, 288, 351, 352]. This is especially so for CAR immunotherapy
where the use of AND gate ensures that only cancer cells, not healthy cells are
triggered to undergo apoptosis [351]. Nevertheless, mammalian cell based
sensors has also been engineered to circumvent the signalling pathway.
Schwarz et al. replaces the cytoplasmic domain of the CAR with a protease and
transcription factor. Crosslinking of CAR cleaves the transcription factor from
the CAR freeing it to drive the transcription of the response gene [292]. This
eliminates the possibility of cross talking and false signalling.
Other cell based sensors have been developed in other organisms. In
prokaryotes, transmembrane protein localized in the periplasm of Gram
negative E. coli and V. Cholerae or outer membrane of Gram positive L. Lactis

65
have been used to detect sugar molecules such as galactose and maltose, or
quorum sensing analytes [353-361]. Reporter genes such as fluorescent proteins
help generate an output signal. Yeast and Xenopus oocyte are examples of
eukaryotic non-mammalian cell based sensors that have been developed [277,
343, 362-365]. Expression of reporter genes are used as output signals in yeast.
However, for Xenopus oocyte, electrophysiology techniques such as patch
clamp are used to measure chloride ions influx which acts as the output signal.
Calcium dependent chloride ions channels are opened upon receptor activation,
generating a measurable influx of chloride ions [366, 367].
Despite the advantageous use of cell based sensor in removing
unspecific binding in bioassays, there are still various limitations unique to
biosensors. For example, as life cell cultures are used, experiments need to be
conducted in biosafety facilities. Additionally, precaution has to be taken to
prevent contamination of genetically modified cells into the environment [368,
369].
4.1.2: Chimeric Antigen Receptors and Immunotherapy
CAR expressed in Cytotoxic T cells has also been used for therapeutic
purposes. Specifically in immunotherapy where the CAR is designed to target
cancer cells in vivo. The scFv domain of the CAR is engineered to bind to
membrane proteins overexpressed on cancer cells. Thereafter, the crosslinking
of the CAR activates the Cytotoxic T cell to induce apoptosis in the targeted
cell [370, 371].
The design of such chimeric receptors in T cells has undergone various
changes and enhancements over the years. Nonetheless, a simple description of
66
the CAR may be portrayed as such: outer membrane antigen detection unit,
usually a scFv antibody, a transmembrane domain, and finally an
intramembrane signalling module, consisting the ITAM [372-374].
The T cell receptor comprises 8 sub units of polypeptides: 1 alpha, 1
beta, 2 epsilon, 1 gamma, 1 delta, and 2 zeta polypeptides. The epsilon, gamma
and delta subunits are transmembrane and each contains an ITAM domain. The
zeta polypeptide is cytoplasmic, and extends into the membrane region of the
cell, where they are joined together via a disulphide bridge. Each zeta sub unit
contains 3 ITAM domains. The alpha and beta subunits are located on the
extracellular region of the cell with a transmembrane portion. They are joined
together via a disulphide bridge in the extracellular portions and they act as the
targeting modularity for the T cell receptor. Together, these 8 sub units interact
with each other through hydrophobic interaction in the cell membrane to yield a
functional T cell receptor [375].
The first work to direct the targeting modularity of the T cell to a
specific target was through chimerically replacing the binding site of the alpha
and beta sub units with the variable region (heavy chains) of antibodies. The
result is a T cell that now targets an antigen similar to that of the antibody.
Prove of the chimeric T cell functionality is shown when interleukin-2 secretion
levels are increased upon antigen presentation [376, 377]. Furthermore, these
chimeric receptors were also injected into mice embryos resulting in transgenic
mice producing T cells expressing the chimeric receptors and hence, are
programmed for specific target.
However, these chimeric receptors still rely on the assembly of the sub
units into T cell in order for its functionality. In 1993, two separate groups
67
published results in which an scFv was genetically fused to either the gamma or
zeta subunit of the T cell receptor. Not only did the chimeric receptor localize at
the cell membrane after its expression, its functionality was also confirmed
when interleukin-2 or interleukin-3 secretion levels increased upon antigen
presentation [378]. To increase the exposure of the scFv to antigens presented,
Karjalainen et al. included a CD8 hinge region in between the scFv and zeta
subunit of the T cell receptor [379].
Moreover, it is known that T cell activation relies not only on T cell
receptors stimulation, but also a host of other T cell receptors such as CD28 and
CD137. Activation of CD28 results in increased interleukin secretion, whereas
for CD137, its activation causes increased T cell proliferation and survival. As
such, to enhance the intracellular chimeric T cell signalling, CD28 and, or
CD137 cytoplasmic tails containing ITAM domains were genetically fused to
the chimeric receptors already with the zeta domain. Generation two chimeric T
cell receptors have the additional CD28 domain while generation three chimeric
receptor has additional CD28 and CD137 cytoplasmic tail domain [380-382].
To date, the CAR in T cells has undergone four generations of
development [383]. The addition of different cytoplasmic domains for co-
stimulatory purposes is the difference between generations. For example, the
addition of CD28 domain results in proliferation of cytotoxic T cells upon
stimulation [370]. Recently, Baeuerle et al. has developed a full T cell receptor
fused with receptor scFv. This ensures that all signalling pathways of a native T
cell receptor are retained upon activation of this CAR also known as T cell
Receptor Fusion Construct (TRuC) [384]. Numerous clinical trials for CAR
immunotherapy have already been conducted to treat various cancers [385,

68
386]. Two third generation CAR products targeting CD-19 for B cell lymphoma
treatment, Kymriah TM and Yescarta TM are already approved by the Federal
Drug Administration [387]. Despite these developments, strategies for
delivering CAR expressing Cytotoxic T cells to solid tumours are still being
researched [383, 388]. Various adverse effects and T cell exhaustion needs also
to be overcome [389-391].
However, such CAR has only been used once in B cells and only for the
alpha tail domain. Furthermore the transmembrane domain used in the B cell’s
CAR is native to that of T cell receptors; chimeric B cell receptor with B cell
receptor transmembrane domain has not yet been developed [392]. This is not
surprising as B cell receptor’s transmembrane domain is known to be overly
hydrophilic as compared to T cell receptor’s transmembrane domain and hence
requires interaction with other transmembrane domain in order to be expressed
on the cell membrane surface.
The B cell receptors are composed of four protein subunits,
Immunoglobulin (Ig) light chain, Ig heavy chain, Ig alpha, and Ig beta. Two Ig
heavy chains and two Ig light chains are covalently linked by disulphide bonds
forming the extracellular domain of the receptors. Differing specific amino acid
sequences of the extracellular Ig domains confers binding specificity of the
BCR to various different antigen, ensuring accurate selectivity of the BCR and
for each B cell. The heavy chain extends into the cell membrane via the trans-
membrane region to interact with the Ig alpha and Ig beta domains.
The Ig alpha and beta are also covalently joined together by a disulphide
bond forming the intracellular cytoplasmic domain of the receptors. The Ig
alpha is a 220 amino acid protein, with position 113 amino acid cysteine (C113)

69
responsible for forming the disulphide bond with the Ig beta. Ig beta is a 228
amino acid protein, with position 135 amino acid cysteine (C135) responsible
forming the disulphide bond with the Ig alpha. The cytoplasmic amino acids
containing the crucial ITAM domains are 160-220 and 181-228, for Ig alpha
and Ig beta respectively.
Upon binding of the BCR by antigens, two BCR will undergo
dimerization resulting in the phosphorylation of the ITAMs. The
phosphorylation of ITAMs activates the BCR resulting in a signalling cascade
within the B cells which ultimately leads to an influx of calcium ions into the
cell [393-401].
Figure 4.2: The B cell receptor and its downstream signalling pathway whereby
the one of which results in an influx of calcium ions. Figure 4.2 was cited from:
Young, R. M. and Staudt. L. M. [402]– published by Springer Nature.
Experimenting of BCR with the removal of the intracellular Ig alpha
and Ig beta domain, results in the inability of the BCR to be expressed on the

70
surface of the B cell. However, when the tyrosine and serine amino acids within
the transmembrane region is mutated to two hydrophobic amino acids valine,
the BCR is able to be expressed on the surface of the B cell in the absence of
the intracellular Ig alpha and Ig beta domains. Subsequent experiments
involving genetic fusion of either Ig alpha or Ig beta cytoplasmic domains to
the intracellular end of the Ig heavy chain shows not only localization of the B
cell receptor on the B cell membrane surface, but also functionality of the B cell
receptor through influx of calcium ions [403-405].
Unlike Cytotoxic T cells, B cells do not cause the apoptosis of targeted
cells. Instead, B cells in nature, secretes high volume of antibodies when
activated. As such, it is possible to utilize B cells for antibody therapy via B cell
activation using chimeric BCR. In nature, in a single B cell, the antibodies
secreted by the B cells for antigen targeting are similar to the antigens B cell
receptors target. However, with the use of chimeric BCR, the B cells can be
trained to secrete antibodies that targets different antigen from the receptors. A
possible application for this would be to direct the B cells to secrete antibodies
targeting cancer cells when it detects markers secreted by the tumour [406].
Another characteristic of B cells are that their activation require the
helper T cells to co-stimulate it for antibody secretion. One way to circumvent
this is to use a non-constitutive promoter that can be induced by the
downstream signalling process as a result of BCR activation. As calcium influx
takes place when B cells are activated, an NFAT promoter which activates in
the high concentration of calcium can be used for secondary signal output after
the activation of the chimeric BCR [112].

71
4.1.3: Chimeric Antigen Receptors for Detecting Soluble Antigens
Recent advances in CAR development has allowed the CAR to respond
to soluble antigens. CAR has also been ported into HEK293 cells, allowing it to
serve as a cell-based bioassay [291, 293].
Here we replaced the extracellular Ig heavy and Ig light domains with a
scFv as design for our CAR. Our scFv, B10, is specific to target Epidermal
Growth Factor Receptor (EGFR) which is overly expressed in triple negative
breast cancer cells including MDA-MB-231. The intracellular domain would be
that of the BCR alpha tail in order that the ITAM may couple onto the B cell
signaling pathway. To stimulate localization of the CAR, we added a cleavable
murine Ig kappa chain signal peptide as the leader sequence [407].
Epitope tags such as the 6x His-tag or Myc-tag were also introduced at
the outer membrane location of the CAR to serve as an epitope marker in order
for confocal microscopy to be done to confirm the expression, localization and
orientation of the CAR.
The design of the CAR was built upon various past works. Firstly,
Sanchez et al., Mitchell et al., and Stevens et al. showed that it was possible to
produce a functional truncated BCR when conjoining the tail portion of Ig
Alpha to that of the membrane region of the BCR [395, 403, 405]. Although in
their design, they still retained the full antibody as the antigen detection outer
domain rather than change it to a scFv. However, it was necessary to mutate the
YS amino acids to VV in the membrane domain of their BCR, else the
truncated BCR would not be expressed successfully. This mutation was carried
forward into our CAR design. The outer domain was built upon past work of
Brocker et al. and Eshhar et al. which were the first developments having an

72
scFv with a T cell receptor tail, essentially the first CAR. The design which also
incorporated with a hinge region to increase the scFv’s binding capacity was
used in our CAR (with BCR Ig alpha tail) [379, 408].
We envisioned that CAR displaying B cells would serve as a cell-based
bioassay coupled with therapeutic purposes. The activation of CAR of the B
cells would result in a downstream signaling cascade similar to that which
occurs in a B cell. Thereafter, this signaling cascade will drive calcium influx
into the cells, wherein, an NFAT response element would result in the cell
secreting therapeutic antibody genes (Figure 4.3).
Figure 4.3: The envisioned therapeutic B cell based bioassay. Step 1: CAR is at
rest. Step 2: Ligand crosslinks CAR. Step 3: Intracellular signalling pathway
activated. Step 4: Calcium ion influx into cells. Step 5: NFAT response element
results in secretion of therapeutic antibodies.
4.2 Results and Discussions
As a first step to the development of the envisioned B cell based
bioassay, we tested the system on HEK293FT cells. Two constructs for the

73
gene were first cloned into the pLenti6/V5 directional TOPO vector backbone
to be expressed by the CMV promoter (Figure 4.4). Thereafter, the plasmids
were transfected into HEK293FT cells for expression.
Figure 4.4: a) Designs of the different CAR. Design one has 6x His-tag located
at the N-terminus of the CAR while design two has a Myc-tag placed between
the scFv and hinge region. b) The CAR gene is placed after the signal peptide
and driven by a CMV promoter.
4.2.1 Expression of CAR
Confocal microscopy imaging confirms that the expression level for
CAR design one was very low, about two or three in the million seeded cells.
However, for design two, the number of cells expressing CAR was comparable
to that of the number of cells expressing the enhanced green fluorescent protein

74
(EGFP) control (Figure 4.5). For negative control, untransfected cells were also
stained with the antibody and showed no fluorescence signal.
Figure 4.5: a) Untransfected HEK293FT cells stained with anti-His alexa fluor
488 antibody. b) Design one transfected HEK293FT cells stained with anti-His
alexa fluor 488 antibody. c) Untransfected HEK293FT cells stained with anti-
Myc FITC antibody. d) HEK293FT cells transfected with EGFP gene. e)
Design two transfected HEK293FT cells stained with anti-Myc FITC antibody.
The ruler represents 20 m.
The reason for the low amounts of cells expressing the CAR could be
either due to the tag positioning or due to transfection inefficiency. To test if
transfection inefficiency is the cause, we introduced a mCherry gene in between
the XmaI and KpnI position in the pLenti6/V5 directional TOPO where the
mCherry gene expression is driven by the SV40 promoter.
After transfection and staining with the anti-His alexa fluor 488
conjugated antibody, we observed that there are cells expressing the mCherry
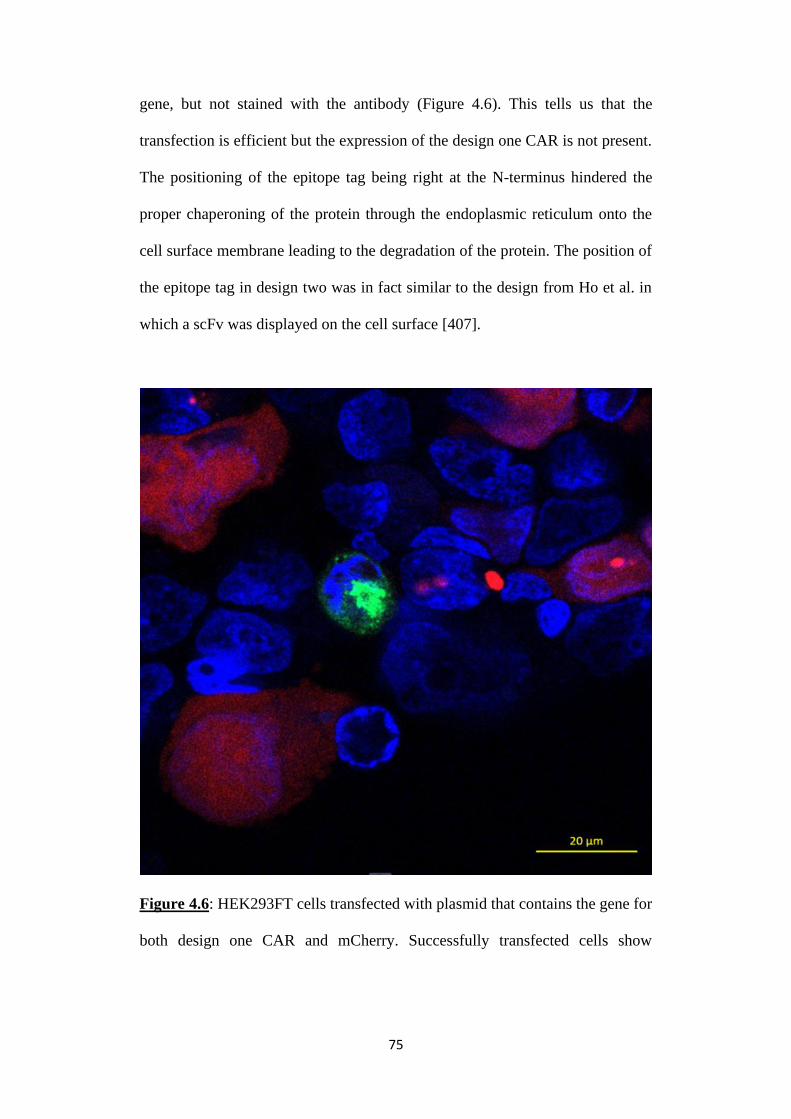
75
gene, but not stained with the antibody (Figure 4.6). This tells us that the
transfection is efficient but the expression of the design one CAR is not present.
The positioning of the epitope tag being right at the N-terminus hindered the
proper chaperoning of the protein through the endoplasmic reticulum onto the
cell surface membrane leading to the degradation of the protein. The position of
the epitope tag in design two was in fact similar to the design from Ho et al. in
which a scFv was displayed on the cell surface [407].
Figure 4.6: HEK293FT cells transfected with plasmid that contains the gene for
both design one CAR and mCherry. Successfully transfected cells show
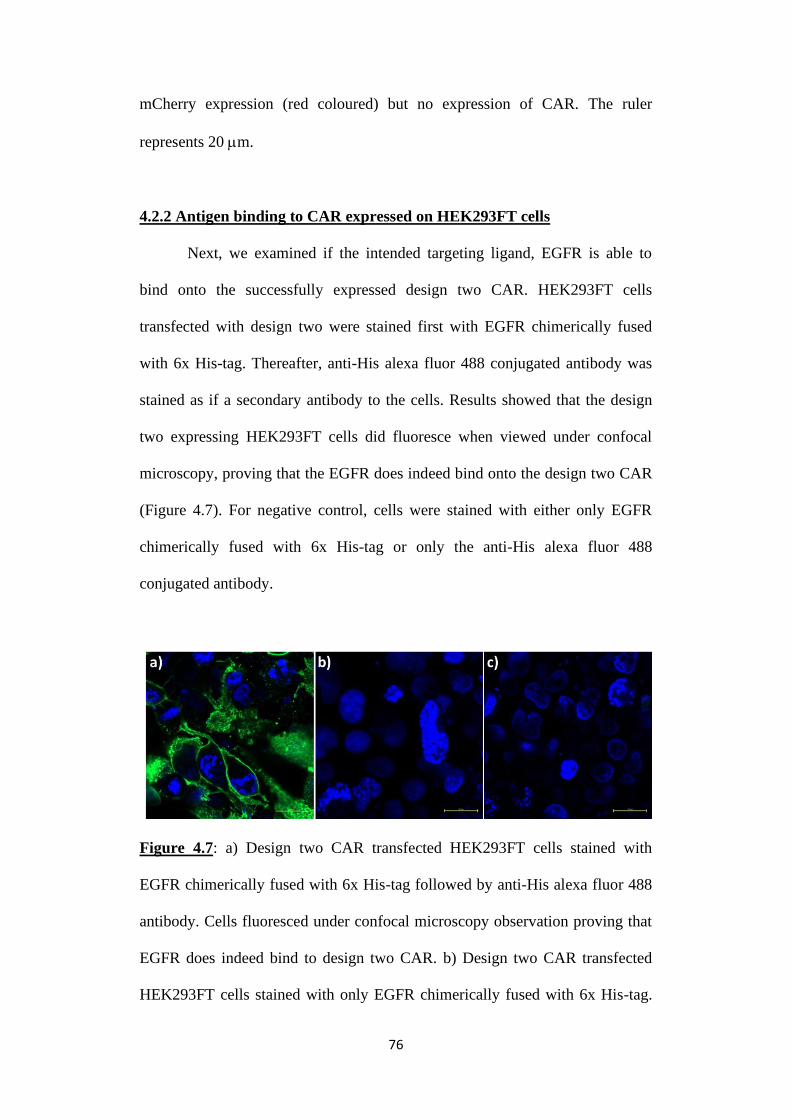
76
mCherry expression (red coloured) but no expression of CAR. The ruler
represents 20 m.
4.2.2 Antigen binding to CAR expressed on HEK293FT cells
Next, we examined if the intended targeting ligand, EGFR is able to
bind onto the successfully expressed design two CAR. HEK293FT cells
transfected with design two were stained first with EGFR chimerically fused
with 6x His-tag. Thereafter, anti-His alexa fluor 488 conjugated antibody was
stained as if a secondary antibody to the cells. Results showed that the design
two expressing HEK293FT cells did fluoresce when viewed under confocal
microscopy, proving that the EGFR does indeed bind onto the design two CAR
(Figure 4.7). For negative control, cells were stained with either only EGFR
chimerically fused with 6x His-tag or only the anti-His alexa fluor 488
conjugated antibody.
Figure 4.7: a) Design two CAR transfected HEK293FT cells stained with
EGFR chimerically fused with 6x His-tag followed by anti-His alexa fluor 488
antibody. Cells fluoresced under confocal microscopy observation proving that
EGFR does indeed bind to design two CAR. b) Design two CAR transfected
HEK293FT cells stained with only EGFR chimerically fused with 6x His-tag.

77
c) Design two CAR transfected HEK293FT cells stained with only anti-His
alexa fluor 488 antibody. The ruler represents 20 m.
The successful binding of the antibodies to the outer membrane epitope
tag as well as the analyte to the outer membrane scFv domain of the CAR
proves to us that the scFv and epitope tags are located on the outer membrane
domains of the CAR. Therefore, the CAR is in the accurate orientation with the
intended outer membrane domains located externally of the cell. The
transmembrane domain of the CAR would have led to the arrestment of the
translocation of the CAR polypeptide across the ER membrane [395, 409]. The
inner domains of the CAR are therefore certainly in the HEK293FT cells.
4.2.3 Functionality of CAR
Next we tested the functionality of design two CAR by testing for the
presence of calcium influx when presenting the transfected HEK293FT cells
with EGFR. If the CAR is functional, EGFR ought to crosslink the CAR. The
ITAM domain would thereafter be phosphorylated resulting in a signalling
cascade. This would thus culminate in a calcium influx into the cell.
Fluo-4 was taken up into transfected and untransfected cells through an
incubation period. If calcium ions were present, the calcium ions would chelate
with Fluo-4, resulting in a measurable emission at 525 nm wavelength.
Conversely, if calcium was not present, no emission at 525 nm would be
detected.
When B cell receptors are activated, the first kinases being activated are
the Lyn kinase followed by the Syk kinase. These two kinases are present in

78
HEK293FT cells and thus we could expect the CAR with a B cell receptor tail
and ITAM to trigger a signalling cascade resulting in calcium influx when in
the HEK293FT cell [410, 411]. If a T cell receptor tail is used instead, we
would not expect any signalling as the first kinase T cell receptor
phosphorylates is ZAP 70 kinase. The ZAP 70 kinase is not present in
HEK293FT cells [412, 413].
Post Fluo-4 incubated transfected and untransfected HEK293FT cells
were presented with varying concentrations of EGFR. We also presented the
cells with anti-Myc antibodies. We were concerned that EGFR being a
monomer would only bind to a single CAR instead of two CARs which would
be necessary for CAR crosslinking to take place. Anti-Myc antibodies in
contrast are dimeric and therefore would certainly crosslink the CARs. For
positive control, adenosine triphosphate (ATP) that stimulates the P2Y
receptors whose signalling results in calcium influx was used. For negative
control, buffer free of EGFR, antibodies or ATP were used.
We observed when ATP is applied to the cells in the positive control
sample, a spike in emission intensity occurs. This shows that the ATP does
indeed stimulate a calcium influx signalling response (Figure 4.8h, p).
However, we do not observe an emission signal spike in the samples where
EGFR and antibodies were added to the cells. The signal is the same as that of
the negative control. This suggests that no calcium influx has taken place.

79
Figure 4.8: Graphs of calcium influx assays. The Y-axis is the emission
intensity and the X-axis is time. For a, b, c) Untransfected HEK293FT with 0.1
µg mL-1, 1 µg mL-1, and 10 µg mL-1 of EGFR introduced. d) Untransfected
HEK293FT with only HBSS introduced. e, f, g) Untransfected HEK293FT with
0.1 µg mL-1, 1 µg mL-1, and 10 µg mL-1 of anti-Myc antibody introduced. h)
Untransfected HEK293FT with 5 µM ATP introduced. i, j, k) Transfected
HEK293FT with 0.1 µg mL-1, 1 µg mL-1, and 10 µg mL-1 of EGFR introduced.
l) Transfected HEK293FT with only HBSS introduced. m, n, o) Transfected
HEK293FT with 0.1 µg mL-1, 1 µg mL-1, and 10 µg mL-1 of anti-Myc antibody
introduced. p) Transfected HEK293FT with 5 µM ATP introduced.
The reason for the absence of calcium influx ought to be investigated. It
could either be due to the absence of CAR crosslinking or that the CAR
crosslinking failed to transmit the intracellular signalling adequately to drive the
calcium influx.
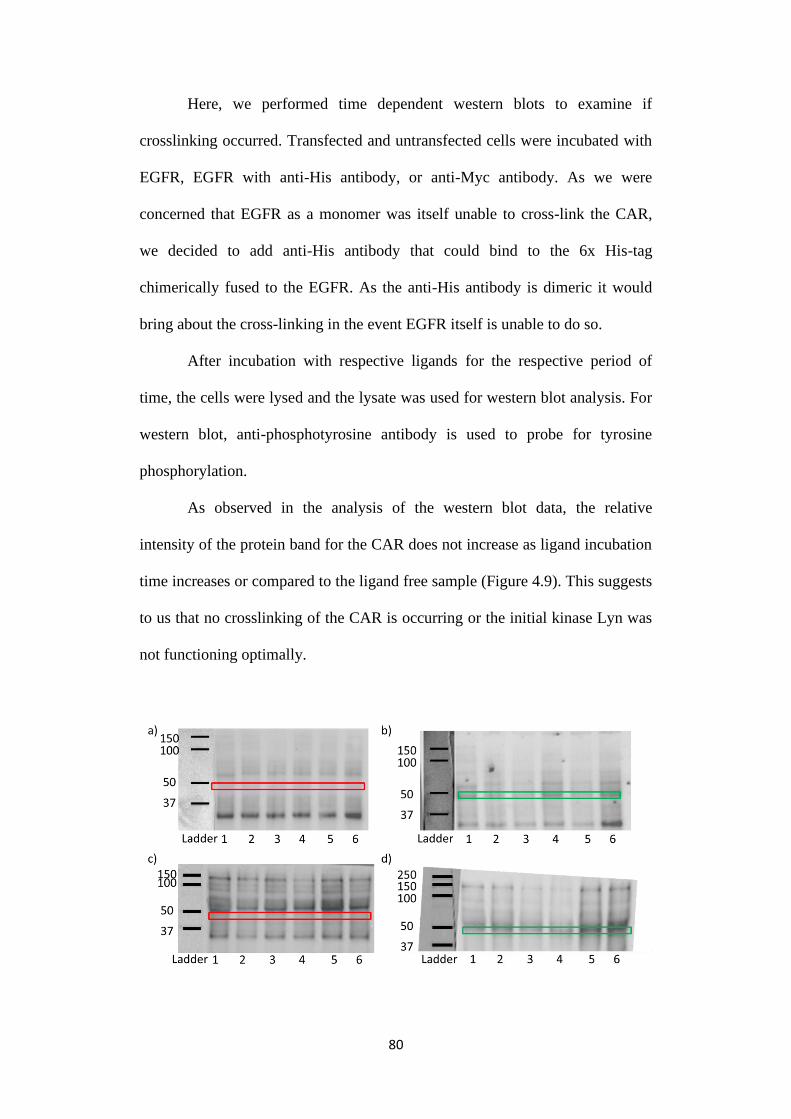
80
Here, we performed time dependent western blots to examine if
crosslinking occurred. Transfected and untransfected cells were incubated with
EGFR, EGFR with anti-His antibody, or anti-Myc antibody. As we were
concerned that EGFR as a monomer was itself unable to cross-link the CAR,
we decided to add anti-His antibody that could bind to the 6x His-tag
chimerically fused to the EGFR. As the anti-His antibody is dimeric it would
bring about the cross-linking in the event EGFR itself is unable to do so.
After incubation with respective ligands for the respective period of
time, the cells were lysed and the lysate was used for western blot analysis. For
western blot, anti-phosphotyrosine antibody is used to probe for tyrosine
phosphorylation.
As observed in the analysis of the western blot data, the relative
intensity of the protein band for the CAR does not increase as ligand incubation
time increases or compared to the ligand free sample (Figure 4.9). This suggests
to us that no crosslinking of the CAR is occurring or the initial kinase Lyn was
not functioning optimally.

81
Figure 4.9: a, b) Samples were untransfected or transfected HEK293FT cells
respectively being treated with 30 minutes EGFR (lane 1), 30 minutes EGFR
followed by 1 minute of anti-His antibody (lane 2), 30 minutes EGFR followed
by 2 minutes of anti-His antibody (lane 3), 30 minutes EGFR followed by 3
minutes of anti-His antibody (lane 4), 30 minutes EGFR followed by 5 minutes
of anti-His antibody (lane 5), 30 minutes EGFR followed by 10 minutes of anti-
His antibody (lane 6). c, d) Samples were untransfected or transfected
HEK293FT cells respectively being treated with 1 minute anti-Myc antibody
(lane 1), 2 minutes anti-Myc antibody (lane 2), 3 minutes anti-Myc antibody
(lane 3), 5 minutes anti-Myc antibody (lane 4), 10 minutes anti-Myc antibody
(lane 5), 30 minutes anti-Myc antibody (lane 6). e) Transfected HEK293FT
(lane 1) and untransfected HEK293FT (lane 2) cell lysates who’s blots were
stained with anti-Myc antibody conjugated with horseradish peroxidase. This
sample shows us the apparent position of CAR in the western blot. g, h)
Normalized relative intensity of CAR bands to the sample lane for blots in blot
(b) and blot (d) respectively. The Green boxes represent presence of CAR band
and red boxes the absence.

82
4.2.4 Modularity of CAR
Lastly, we examined the modularity of design two CAR by switching
the existing B10 scFv to another L21C scFv, albeit also binding to EGFR.
However, under confocal microscopy viewing, the protein is not expressed at
all (Figure 4.10). As both genes contain the cleavable murine Ig kappa chain
signal peptide, we do not suppose that the signal peptide is the reason for the
failure of the CAR to be expressed and localized on the membrane surface of
the HEK293FT cells. Instead, the difference in initial amino acid sequences of
the two scFv may explain the reason why one gets expressed and localized
while the other does not. The first ten amino acids of the B10 scFv are
QLQLQESPGG whereas for L21C, they are EVKLQQSGAE.
Figure 4.10: a) Untransfected HEK293FT, stained with anti-Myc FITC
antibody. b) Transfected HEK293FT with L21C CAR, stained with anti-Myc
FITC antibody. The ruler represents 20 m.
In this project we intended for the cross-linking of our receptor to
phosphorylate the CAR ITAM domains. This in turn would phosphorylate the
83
Lyn and Syk kinase. These events phosphorylate other kinases downstream to
drive calcium influx which then activates the NFAT promoter. We did not
however observe any calcium influx. We also did not observe any
phosphorylation of the CAR ITAMs either. The presence of Syk kinase is
crucial for the phosphorylation of the CAR ITAMs [414]. The HEK293FT cell
expresses a low level of Syk protein as opposed to other blood cells [410]. The
low presence of Syk kinase could be the reason for the absence of CAR ITAM
phosphorylation.
Another possibility for the CAR cross-linking not giving rise to calcium
influx is that the cross-linking of the CAR at the extracellular domain does not
drive the intracellular domains to cross-link sufficiently. Previous work by
Sanchez et al. has developed a chimeric BCR similar to our design except that
the scFv domain is replaced with an Ig domain that when cross-linked can
induce a calcium influx [395]. The Ig domain is larger than the scFv domain
and thus has greater steric hindrance and would be harder for the intracellular
domains to cross-link when the extracellular domains are cross-linked. Since,
the Ig domain chimeric BCR could show intracellular cross-linking proven by
calcium influx, the CAR with scFv domain will not have a problem inducing
intracellular cross-linking when the extracellular domains are cross-linked. One
method to test for this is to fuse a fluorescent protein at the C terminus of the
CAR. Upon extracellular domain cross-linking we should observe that the
emission intensity for each fluorescent spot is increased if the intracellular
domains are cross-linked bringing the fused fluorescent proteins together. If
intracellular domains are not cross-linked, the fluorescent proteins would

84
remain separate and would register at lower intensity as compared to when
cross-linked and brought close together.
4.3 Conclusion
In conclusion, we have here expressed a CAR successfully on the
membrane of the HEK293FT cell in the correct orientation and shown that the
intended ligand EGFR does bind onto the surface CAR. The Au@PTA and
pOBP protein systems are unable to bind to EGFR and therefore will not be
able to even function as a cell based biosensor.
Nonetheless, despite the binding of EGFR to the CAR, we observe no
downstream signaling process that could result in a calcium influx taking place.
As a result, the sensor system is present, however, the response signal is absent.
As our final product aims to have the CAR functional in B cells, we are
confident that the system would work because our CAR’s tail and ITAM
domain are obtained from B cell receptor domains. The CAR would certainly
be able to transmit the extracellular binding event into intracellular crosslinking
signal. Future work would have the CAR expressed in B cells to render the B
cell a therapeutic bioassay. Its functionality would be tested through calcium
influx assay and antibody secretion.
4.4 Materials and Methods
Molecular cloning of EGFP, CAR B10 design one, CAR B10 design two, CAR
L21C, and mCherry into expression plasmid
Genes for EGFP, CAR B10 design one, CAR B10 design two, CAR
L21C, and mCherry were purchased as Gblock from IDT DNA. They were

85
subsequently amplified using Phusion High-Fidelity DNA polymerase (Thermo
Scientific) before double digestion with BamHI and XhoI restriction enzymes
(Thermo Scientific). The digested gene fragment inserts are then ligated into
doubly digested pLenti6/V5 directional TOPO vector backbone (Thermo
Scientific) at the BamHI and XhoI restriction sites. For mCherry, the Glock was
not amplified, but instead digestion directly with XmaI and KpnI. The plasmid
pLenti6/V5 directional TOPO were also digested with XmaI and KpnI. The
restriction enzymes XmaI and KpnI were also purchased from Thermo
Scientific. Ligation is done with T4 ligase (Thermo Scientific). Post-ligation,
recombinant plasmids were transformed into Stbl3 E. coli cells (Thermo
Scientific) for plasmid amplification.
Primers used for the Gblock amplification are:
EGFP, Forward Primer:
TCTAGAGGATCCACCATGGTTAGTAAAGGCGAAGAGTTGT
EGFP, Reverse Primer:
CTAGACTCGAGTTATTACTTGTACAATTCGTCCATGCCAAGG
B10 Design one, Forward Primer:
TCTAGAGGATCCACCATGGAAACAGATACTCTCCTGC
B10 Design one, Reverse Primer:
CTAGACTCGAGTTATTATGGCTTTTCCAGCTGAGCGTC
B10 Design two, Forward Primer:
TCTAGAGGATCCACCATGGAGACTGACACGCTCCTTCTTT
B10 Design two, Reverse Primer:
CTAGACTCGAGTTATTAGGGCTTCTCCAATTGTGCGT
L21C, Forward Primer:

86
TCTAGAGGATCCACCATGGAAAC
L21C, Reverse Primer:
CTAGACTCGAGTTATTACGGCTTCT
Figure 4.11: Construct of pLenti6/V5 directional TOPO Plasmid with crucial
restriction site enzymes circled in red, BamHI, XhoI, XmaI and KpnI.
Transfection of genes in HEK293FT cells and its imaging
HEK293FT cells were trypsinized with 0.05% trypsin (Thermo
Scientific) and plated on a D35-10-1-N cell culture dish (Cellvis) at 1 x 10⁶
cells in 2 mL of Dulbecco’s Modified Eagles Medium (DMEM) medium
(Thermo Scientific) supplemented with 10% Fetal Bovine Serum (FBS)
(Thermo Scientific). The cells were incubated under 37 oC, 5% CO2 condition.

87
Complexing of Lipofectamine 3000 (Thermo Scientific) was done by
incubating 7.5 µL of Lipofectamine 3000 in 125 µL Opti-MEM at room
temperature for 15 minutes before a mixture of 2.5 µg recombinant expression
vector, and 5 µL of P3000 reagent in 125 µL of Opti-MEM was pipetted in.
Thereafter the mixture was further left to stand a further fifteen minutes before
pipetting into the HEK293FT cells.
Forty-eight hours after transfection, cells were fixed by incubating at
room temperature for one hour with 2% paraformaldehyde. Fixed cells were
then washed three times with phosphate buffered saline (PBS) before
incubating with 3% bovine serum albumin (BSA), 0.3 M glycine dissolved in
PBS for 1 hour in room temperature. Thereafter, cells were stained with
antibody overnight at 4 oC with antibody diluted in 1% BSA. The antibody used
was either the D3I10 anti-His antibody conjugated with alexafluor 488, (Cell
Signaling Technology #14930) or the 9E10 anti-Myc antibody conjugated with
FITC (Thermo Scientific #13-2511).
After incubating overnight, stained cells were washed three times with
PBS and stained with DAPI diluted in PBS at 300 nM concentration for 15
minutes. Cells were washed three times again and kept in PBS solution. The
Leica TCS SP5 Confocal microscope was then used to examine the cells at 63x
magnification.
For testing EGFR binding to transfected HEK293FT cells, the protocol
was modified by having the EGFR chimerically fused with 6x His-tag
(Acrobiosystems) stain the cells overnight at 4 oC with antibody diluted in 1%
BSA. Thereafter, cells were washed three times with PBS before staining at

88
room temperature with the D3I10 anti-His antibody conjugated with Alexa
Fluor 488.
Calcium influx assay
HEK293FT cells were plated in 384 well plates at a density of 2.4 x 10⁴
cells per well supplemented with 30 µL of DMEM supplemented with 10%
FBS. After incubation overnight, cells were transfected with respective
recombinant plasmids. Thereafter the cells were left to further incubate for
another 48 hours.
Cell medium were removed and the cells were incubated for four hours
with 30 µL of Hank’s buffered saline solution (HBSS), pH 7.4, supplemented
with 100 mM of Fluo-4. Thereafter, the cells are ready for calcium influx assay.
Calcium influx assay was carried out using the fluorescence imaging
plate reader (FLIPRTM, Molecular Devices). The volume of ligands such as
EGFR chimerically fused with 6x His-tag (Acrobiosystems) and 9E10 anti-Myc
antibody (Thermo Scientific #13-2500) be added to the cells was fixed at 25 µL
diluted in HBSS. Since the cell medium was 30 µL, the total volume would be
55 µL. In essence, it would be a 2.2 times dilution of ligands. To achieve the
final ligand concentration of 0.1 µg mL-1, 1 µg mL-1, and 10 µg mL-1 of ligands
in 55 µL, stock solutions of the ligands needed to be of the concentrations of
0.22 µg mL-1, 2.2 µg mL-1, and 22 µg mL-1. For ATP, as the final concentration
is 5 µM, the stock solution concentration is 11 µM.
Detection of phosphorylation using western blot assay
HEK293FT cells were plated in 24 well plates at a density of 1 x 10⁵
cells per well supplemented with 500 µL of DMEM supplemented with 10%
FBS. After incubation overnight, cells were transfected with respective

89
recombinant plasmids. Thereafter the cells were left to further incubate for
another 48 hours.
Cell medium was removed through pipetting and ligands were added to
the cells for respective periods of time. Ligands were diluted with PBS to a
concentration of 10 µg mL-1, and 100 µL were added to each cell well. When
the respective time is up, 100 µL of 2 x Laemmli buffer supplemented with 5%
beta mercaptoethanol were added to the cells to lyse the cells and prepare the
lysate for SDS Page.
The lysates were collected and incubated at 95 oC for 10 minutes before
running in an SDS Page gel. Thereafter, the proteins on the gel were transferred
onto a nitrocellulose blot through the use of semi-dry transfer method at a
current of 120 mA for one hour.
Transferred blots were washed twice with pH 7.4 Tris buffered saline
(TBS) before blocking with 3% BSA dissolved in TBS with 0.2% Tween
(TBST). Blocking was done for one hour at room temperature under shaking
conditions. Thereafter, blocked blots were stained with anti-phosphotyrosine
antibody conjugated with horseradish peroxidase (Cell Signaling Technology
#5465) or anti-Myc antibody conjugated with horseradish peroxidase (Thermo
Scientific #MA1-980-HRP). Antibodies were dissolved in 3% BSA
supplemented TBST before applying on the blot overnight at 4 oC.
Thereafter, the stained blots were washed three times with TBST to
remove unbounded antibody and developed with chemiluminescence reagent
(Cell Signaling Technology #6883) and viewed under Invitrogen gel doc
system. Photographed images were anlyzed using ImageJ to determine the pixel
grayscale density. Relative intensity was obtained by dividing absolute intensity

90
of the protein band to that of all the proteins in the lane. Normalized relative
intensity was obtained by dividing each lane’s respective relative intensity
value with that of negative control sample where cells were not exposed to any
ligand.

91
CHAPTER 5
Conclusion
Bioassays play an important role in the detection of various biologically
relevant analyte. Depending on the chemical and physical properties, different
methods and strategies for detection are required. A one-size-fits-all method
lacks the ability to distinguish the complexity of the analytes. This thesis
describes three distinct attempts to detect ionic, small molecule odorants by
exploiting their coordinating chemistry, hydrophobicity and size respectively.
The coordination of Iron (III) ions by tannic acid allows for tannic acid-
gold core nanocomposites to be aggregated together. Hydrogen peroxide’s
oxidation of Iron (II) to Iron (III) is exploited for the detection of hydrogen
peroxide since Iron (II) does not result in aggregation of tannic acid-gold core
nanocomposites but Iron (III) does. As odorants and polycyclic aromatic
hydrocarbons enter the binding pocket of the pig odorant binding protein, we
tried to modify the protein to increase binding affinity to these substances.
However, our results show otherwise. Diseases biomarkers are too large and
hydrophilic to enter the binding pocket of pOBP or coordinate with tannic acid.
We developed a chimeric antigen receptor based cell-based sensor to detect the
protein biomarkers.
Improvements to the performance of the bioassays are required for
subsequent translations. Performance of the bioassays may be summed up with
three ‘S’ – selectivity, sensitivity, and stability [415-417].
Selectivity pertains to the sensor’s ability to detect only the target ligand
of interest (absence of promiscuity) while the presence of other contaminants

92
does not generate any noise signal. This thus ensures a desirable high signal to
noise ratio [298, 418-420].
The sensitivity of a biosensor refers to the ratio of the signal output to
ligand concentration [416]. As the formula is a ratio, sensitivity is usually
reported as a linear fit [416]. Although not related to sensitivity, the minimum
detection limit (as low as possible), and saturation limit (as high as possible) of
the ligand by the sensor is also crucial in determining the sensor’s performance.
The stability of the biosensor deals with the reusability of the sensor.
For example, the long-term stability of the reusable biosensor, calculated as the
number of cycles to failures, is determined by factors such as the degradation of
the proteins in the sensor, and leaching of transducer surface [415, 416].
Continuous operation stability is another consideration [421]. Frequent
calibrations of equipment between each reading will promote reproducibility
while a drifting baseline may be an indication of malfunctioning equipment
[422]. Batch to batch data reproducibility in the biosensor’s performance is
equally crucial.
Specifically to bringing Au@PTA from the bench to commercialization
requires additional challenges besides the three ‘S’. For example, a suitable
packing method should be designed for transportation and storage of the
Au@PTA, such that its environment such as temperature can remain constant.
This needs to be overcome to render the Au@PTA as a bioassay commercially
viable.
For each bioassay in the thesis, we plan further work to either enhance
the performances of the bioassays or to better understand the functions of the
proteins.

93
From chapter two, we envision the synthesis of gold-silver hybrid core
metal@PTA nanoparticle. This is so as to achieve a high sensitivity colour shift
prescribed by Chen et al. [423]. Other forms of protein receptors, such as
antibodies will also be conjugated onto the nanoparticle to confer other targets
to our bioassay [424].
From chapter three, we plan to further the deletion of the alpha helix tail
to not just pOBP but to other lipocalins, especially the bovine OBP. The bovine
OBP, unlike other lipocalins, has its tail engage in domain swapping with other
monomers for stability [214] By mutating other lipocalins, it will provide a
better insight to the role of the alpha helix in the stability of the protein.
In the purpose of developing bioassays, we will continue to mutate the
amino acids in the beta barrel of the different OBPs to confer better sensitivity
and selectivity to the OBPs to different PAHs and odorants. These mutated
OBPs will be examined for biosensor activity through incorporation onto
platforms such as the gFET.
Nonetheless, the challenge of unspecific binding of the odorants to the
transducers remains to be overcome.
From chapter four, we aim next to express the CARs on the surface of
the B cell and engineer the B cell to secrete therapeutic antibodies upon the
activation of the CARs. We thus will formulate a therapeutic in vivo bioassay.
As opposed to adherent cells, traditional transfection methods such as
using lipofectamine to drive the gene of interest into the suspension cells are
not possible. Instead, viral transduction strategy such as using lentivirus for
transduction is required. The first step in our work will be to optimize lentivirus
transduction into the suspension B cells. An EGFP gene instead of the CAR

94
gene will be used. Thereafter, we will deliver the CAR gene into the B cell
allowing the cell to express the CAR protein.
Antibody staining of the transduced B cells will be done to examine if
CAR is successfully expressed on the surface of the B cells. Thereafter, calcium
influx assay will be conducted to examine if the CARs are functional by
exposing the transduced B cells to the CAR binding ligands.
In summary, by improving the strategy from the work in each chapter,
we gradually bring the standard of biological anlayical detection closer to that
of what the biological body is able to achieve. In addition to improving the
three ‘S’ – selectivity, sensitivity, and stability, robustness of detection will
become more paramount. The ability to detect a single molecule is the ultimate
goal for future biological analytics and will require the development of novel
approaches that straddles between molecular and device engineering.

95
REFERENCES
[1] C. D. Karakochuk, S. Y. Hess, D. Moorthy, S. Namaste, M. E. Parker,
A. I. Rappaport, et al., "Measurement and interpretation of hemoglobin
concentration in clinical and field settings: a narrative review," Annals
of the New York Academy of Sciences, vol. 1450, pp. 126-146, 2019.
[2] N. Sanvisens, M. C. Bañó, M. Huang, and S. Puig, "Regulation of
Ribonucleotide Reductase in Response to Iron Deficiency," Molecular
Cell, vol. 44, pp. 759-769, 2011/12/09/ 2011.
[3] E. Torrents, "Ribonucleotide reductases: essential enzymes for bacterial
life," Frontiers in Cellular and Infection Microbiology, vol. 4, 2014-
April-28 2014.
[4] H. Beinert, R. H. Holm, and E. Münck, "Iron-Sulfur Clusters: Nature's
Modular, Multipurpose Structures," Science, vol. 277, pp. 653-659,
1997.
[5] M. Fontecave, "Iron-sulfur clusters: ever-expanding roles," Nature
Chemical Biology, vol. 2, pp. 171-174, 2006/04/01 2006.
[6] M. Cardenas-Rodriguez, A. Chatzi, and K. Tokatlidis, "Iron–sulfur
clusters: from metals through mitochondria biogenesis to disease," JBIC
Journal of Biological Inorganic Chemistry, vol. 23, pp. 509-520, June
01 2018.
[7] D. C. Johnson, D. R. Dean, A. D. Smith, and M. K. Johnson,
"STRUCTURE, FUNCTION, AND FORMATION OF BIOLOGICAL
IRON-SULFUR CLUSTERS," Annual Review of Biochemistry, vol. 74,
pp. 247-281, 2005.
[8] C. J. Morris, J. R. Earl, C. W. Trenam, and D. R. Blake, "Reactive
oxygen species and iron—a dangerous partnership in inflammation,"
The International Journal of Biochemistry & Cell Biology, vol. 27, pp.
109-122, 1995/02/01/ 1995.
[9] S. J. Dixon and B. R. Stockwell, "The role of iron and reactive oxygen
species in cell death," Nature Chemical Biology, vol. 10, p. 9,
12/17/online 2013.
[10] T. S. Koskenkorva-Frank, G. Weiss, W. H. Koppenol, and S.
Burckhardt, "The complex interplay of iron metabolism, reactive
oxygen species, and reactive nitrogen species: Insights into the potential
of various iron therapies to induce oxidative and nitrosative stress," Free
Radical Biology and Medicine, vol. 65, pp. 1174-1194, 2013/12/01/
2013.
[11] G. J. Anderson and D. M. Frazer, "Current understanding of iron
homeostasis," The American Journal of Clinical Nutrition, vol. 106, pp.
1559S-1566S, 2017.
[12] H. Saito, "METABOLISM OF IRON STORES," Nagoya journal of
medical science, vol. 76, pp. 235-254, 2014.
[13] R. Coffey and T. Ganz, "Iron homeostasis: An anthropocentric
perspective," Journal of Biological Chemistry, vol. 292, pp. 12727-
12734, August 4, 2017 2017.
[14] D. F. Wallace, "The Regulation of Iron Absorption and Homeostasis,"
The Clinical biochemist. Reviews, vol. 37, pp. 51-62, 2016.
96
[15] P. Arosio, L. Elia, and M. Poli, "Ferritin, cellular iron storage and
regulation," IUBMB Life, vol. 69, pp. 414-422, 2017.
[16] H. Drakesmith, E. Nemeth, and T. Ganz, "Ironing out Ferroportin," Cell
Metabolism, vol. 22, pp. 777-787, 2015.
[17] D. M. Ward and J. Kaplan, "Ferroportin-mediated iron transport:
Expression and regulation," Biochimica et Biophysica Acta (BBA) -
Molecular Cell Research, vol. 1823, pp. 1426-1433, 2012/09/01/ 2012.
[18] L. T. Vlasveld, R. Janssen, E. Bardou-Jacquet, H. Venselaar, H. Hamdi-
Roze, H. Drakesmith, et al., "Twenty Years of Ferroportin Disease: A
Review or An Update of Published Clinical, Biochemical, Molecular,
and Functional Features," Pharmaceuticals (Basel, Switzerland), vol.
12, p. 132, 2019.
[19] W. G. Barb, J. H. Baxendale, P. George, and K. R. Hargrave, "Reactions
of Ferrous and Ferric Ions with Hydrogen Peroxide," Nature, vol. 163,
pp. 692-694, 1949/04/01 1949.
[20] W. G. Barb, J. H. Baxendale, P. George, and K. R. Hargrave, "Reactions
of ferrous and ferric ions with hydrogen peroxide. Part I.—The ferrous
ion reaction," Transactions of the Faraday Society, vol. 47, pp. 462-500,
1951.
[21] R. Eid, N. T. T. Arab, and M. T. Greenwood, "Iron mediated toxicity
and programmed cell death: A review and a re-examination of existing
paradigms," Biochimica et Biophysica Acta (BBA) - Molecular Cell
Research, vol. 1864, pp. 399-430, 2017/02/01/ 2017.
[22] I. M. Kolthoff and A. I. Medalia, "The Reaction between Ferrous Iron
and Peroxides. I. Reaction with Hydrogen Peroxide in the Absence of
Oxygen," Journal of the American Chemical Society, vol. 71, pp. 3777-
3783, 1949/11/19 1949.
[23] D. J. Kosman, "Iron metabolism in aerobes: Managing ferric iron
hydrolysis and ferrous iron autoxidation," Coordination Chemistry
Reviews, vol. 257, pp. 210-217, 2013/01/01/ 2013.
[24] D. R. Richardson and P. Ponka, "The molecular mechanisms of the
metabolism and transport of iron in normal and neoplastic cells,"
Biochimica et Biophysica Acta (BBA) - Reviews on Biomembranes, vol.
1331, pp. 1-40, 1997/03/14/ 1997.
[25] C. M. Lawrence, S. Ray, M. Babyonyshev, R. Galluser, D. W. Borhani,
and S. C. Harrison, "Crystal Structure of the Ectodomain of Human
Transferrin Receptor," Science, vol. 286, pp. 779-782, 1999.
[26] C. Camaschella, "Iron-Deficiency Anemia," New England Journal of
Medicine, vol. 372, pp. 1832-1843, 2015.
[27] J. C. Barton and R. T. Acton, "Diabetes in HFE Hemochromatosis,"
Journal of diabetes research, vol. 2017, pp. 9826930-9826930, 2017.
[28] S. Swaminathan, V. A. Fonseca, M. G. Alam, and S. V. Shah, "The
Role of Iron in Diabetes and Its Complications," Diabetes Care, vol. 30,
pp. 1926-1933, 2007.
[29] M. Chen, J. Zheng, G. Liu, C. Zeng, E. Xu, W. Zhu, et al., "High
Dietary Iron Disrupts Iron Homeostasis and Induces Amyloid-β and
Phospho-τ Expression in the Hippocampus of Adult Wild-Type and
APP/PS1 Transgenic Mice," The Journal of Nutrition, 2019.

97
[30] J.-L. Liu, Y.-G. Fan, Z.-S. Yang, Z.-Y. Wang, and C. Guo, "Iron and
Alzheimer’s Disease: From Pathogenesis to Therapeutic Implications,"
Frontiers in Neuroscience, vol. 12, 2018-September-10 2018.
[31] J. Becerril-Ortega, K. Bordji, T. Fréret, T. Rush, and A. Buisson, "Iron
overload accelerates neuronal amyloid-β production and cognitive
impairment in transgenic mice model of Alzheimer's disease,"
Neurobiology of Aging, vol. 35, pp. 2288-2301, 2014/10/01/ 2014.
[32] D. H. Manz, N. L. Blanchette, B. T. Paul, F. M. Torti, and S. V. Torti,
"Iron and cancer: recent insights," Annals of the New York Academy of
Sciences, vol. 1368, pp. 149-161, 2016.
[33] M. Jung, C. Mertens, E. Tomat, and B. Brüne, "Iron as a Central Player
and Promising Target in Cancer Progression," International Journal of
Molecular Sciences, vol. 20, p. 273, 2019.
[34] Y. Wang, L. Yu, J. Ding, and Y. Chen, "Iron Metabolism in Cancer,"
International journal of molecular sciences, vol. 20, p. 95, 2018.
[35] James E. Cassat and Eric P. Skaar, "Iron in Infection and Immunity,"
Cell Host & Microbe, vol. 13, pp. 509-519, 2013.
[36] C. P. Doherty, "Host-Pathogen Interactions: The Role of Iron," The
Journal of Nutrition, vol. 137, pp. 1341-1344, 2007.
[37] E. P. Skaar, "The battle for iron between bacterial pathogens and their
vertebrate hosts," PLoS pathogens, vol. 6, pp. e1000949-e1000949,
2010.
[38] C. Polytarchou, M. Hatziapostolou, and E. Papadimitriou, "Hydrogen
Peroxide Stimulates Proliferation and Migration of Human Prostate
Cancer Cells through Activation of Activator Protein-1 and Up-
regulation of the Heparin Affin Regulatory Peptide Gene," Journal of
Biological Chemistry, vol. 280, pp. 40428-40435, December 9, 2005
2005.
[39] D. R. Gough and T. G. Cotter, "Hydrogen peroxide: a Jekyll and Hyde
signalling molecule," Cell Death & Disease, vol. 2, pp. e213-e213,
2011/10/01 2011.
[40] M. Redza-Dutordoir and D. A. Averill-Bates, "Activation of apoptosis
signalling pathways by reactive oxygen species," Biochimica et
Biophysica Acta (BBA) - Molecular Cell Research, vol. 1863, pp. 2977-
2992, 2016/12/01/ 2016.
[41] A. Dumont, S. P. Hehner, T. G. Hofmann, M. Ueffing, W. Dröge, and
M. L. Schmitz, "Hydrogen peroxide-induced apoptosis is CD95-
independent, requires the release of mitochondria-derived reactive
oxygen species and the activation of NF-κB," Oncogene, vol. 18, pp.
747-757, 1999/01/01 1999.
[42] S. F. Erttmann and N. O. Gekara, "Hydrogen peroxide release by
bacteria suppresses inflammasome-dependent innate immunity," Nature
Communications, vol. 10, p. 3493, 2019/08/02 2019.
[43] S. K. Yoo and A. Huttenlocher, "Innate Immunity: Wounds Burst H2O2
Signals to Leukocytes," Current Biology, vol. 19, pp. R553-R555,
2009/07/28/ 2009.
[44] M. A. Akuji and D. J. Chambers, "Hydrogen peroxide: more harm than
good?," BJA: British Journal of Anaesthesia, vol. 118, pp. 958-959,
2017.
98
[45] A. Zunino, P. Degan, T. Vigo, and A. Abbondandolo, "Hydrogen
peroxide: effects on DNA, chromosomes, cell cycle and apoptosis
induction in Fanconi's anemia cell lines," Mutagenesis, vol. 16, pp. 283-
288, 2001.
[46] C. Andreoli, P. Leopardi, S. Rossi, and R. Crebelli, "Processing of DNA
damage induced by hydrogen peroxide and methyl methanesulfonate in
human lymphocytes: analysis by alkaline single cell gel electrophoresis
and cytogenetic methods," Mutagenesis, vol. 14, pp. 497-504, 1999.
[47] G. P. Bienert, J. K. Schjoerring, and T. P. Jahn, "Membrane transport of
hydrogen peroxide," Biochimica et Biophysica Acta (BBA) -
Biomembranes, vol. 1758, pp. 994-1003, 2006/08/01/ 2006.
[48] O. Rodrigues, G. Reshetnyak, A. Grondin, Y. Saijo, N. Leonhardt, C.
Maurel, et al., "Aquaporins facilitate hydrogen peroxide entry into guard
cells to mediate ABA- and pathogen-triggered stomatal closure,"
Proceedings of the National Academy of Sciences, vol. 114, pp. 9200-
9205, 2017.
[49] J. Williams, "THE DECOMPOSITION OF HYDROGEN PEROXIDE
BY LIVER CATALASE," The Journal of general physiology, vol. 11,
pp. 309-337, 1928.
[50] L. Galeazzi, G. Groppa, and S. Giunta, "Mueller-Hinton broth
undergoes visible oxidative color changes in the presence of peroxidase
and hydrogen peroxide," Journal of Clinical Microbiology, vol. 28, pp.
2145-2147, 1990.
[51] J. N. Rodríguez-López, D. J. Lowe, J. Hernández-Ruiz, A. N. P. Hiner,
F. García-Cánovas, and R. N. F. Thorneley, "Mechanism of Reaction of
Hydrogen Peroxide with Horseradish Peroxidase: Identification of
Intermediates in the Catalytic Cycle," Journal of the American Chemical
Society, vol. 123, pp. 11838-11847, 2001/12/01 2001.
[52] P. George, "Reaction Between Catalase and Hydrogen Peroxide,"
Nature, vol. 160, pp. 41-43, 1947/07/01 1947.
[53] I. Szanto, M. Pusztaszeri, and M. Mavromati, "H2O2 Metabolism in
Normal Thyroid Cells and in Thyroid Tumorigenesis: Focus on NADPH
Oxidases," Antioxidants, vol. 8, p. 126, 2019.
[54] Y. Song, N. Driessens, M. Costa, X. De Deken, V. Detours, B.
Corvilain, et al., "Roles of Hydrogen Peroxide in Thyroid Physiology
and Disease," The Journal of Clinical Endocrinology & Metabolism,
vol. 92, pp. 3764-3773, 2007.
[55] C. Behl, J. B. Davis, R. Lesley, and D. Schubert, "Hydrogen peroxide
mediates amyloid β protein toxicity," Cell, vol. 77, pp. 817-827,
1994.
[56] B. J. Tabner, O. M. A. El-Agnaf, S. Turnbull, M. J. German, K. E.
Paleologou, Y. Hayashi, et al., "Hydrogen Peroxide Is Generated during
the Very Early Stages of Aggregation of the Amyloid Peptides
Implicated in Alzheimer Disease and Familial British Dementia,"
Journal of Biological Chemistry, vol. 280, pp. 35789-35792, October
28, 2005 2005.
[57] W.-j. Zhao, X.-b. Chen, L. Fang, C.-l. Li, and D.-y. Zhao,
"Determination of Light–Medium–Heavy Polycyclic Aromatic
Hydrocarbons in Vegetable Oils by Solid-Phase Extraction and High-
Performance Liquid Chromatography with Diode Array and

99
Fluorescence Detection," Journal of Agricultural and Food Chemistry,
vol. 61, pp. 1804-1809, 2013/02/27 2013.
[58] W. M. Baird, L. A. Hooven, and B. Mahadevan, "Carcinogenic
polycyclic aromatic hydrocarbon-DNA adducts and mechanism of
action," Environmental and Molecular Mutagenesis, vol. 45, pp. 106-
114, 2005.
[59] N. Chatterjee and G. C. Walker, "Mechanisms of DNA damage, repair,
and mutagenesis," Environmental and molecular mutagenesis, vol. 58,
pp. 235-263, 2017.
[60] L. Yang, W.-C. Wang, S.-C. C. Lung, Z. Sun, C. Chen, J.-K. Chen, et
al., "Polycyclic aromatic hydrocarbons are associated with increased
risk of chronic obstructive pulmonary disease during haze events in
China," Science of The Total Environment, vol. 574, pp. 1649-1658,
2017/01/01/ 2017.
[61] B. Moorthy, C. Chu, and D. J. Carlin, "Polycyclic Aromatic
Hydrocarbons: From Metabolism to Lung Cancer," Toxicological
Sciences, vol. 145, pp. 5-15, 2015.
[62] S. Cakmak, C. Hebbern, J. D. Cakmak, and R. E. Dales, "The influence
of polycyclic aromatic hydrocarbons on lung function in a
representative sample of the Canadian population," Environmental
Pollution, vol. 228, pp. 1-7, 2017/09/01/ 2017.
[63] W. A. Jedrychowski, F. P. Perera, D. Camann, J. Spengler, M. Butscher,
E. Mroz, et al., "Prenatal exposure to polycyclic aromatic hydrocarbons
and cognitive dysfunction in children," Environmental Science and
Pollution Research, vol. 22, pp. 3631-3639, March 01 2015.
[64] E. Drwal, A. Rak, and E. L. Gregoraszczuk, "Review: Polycyclic
aromatic hydrocarbons (PAHs)—Action on placental function and
health risks in future life of newborns," Toxicology, vol. 411, pp. 133-
142, 2019/01/01/ 2019.
[65] J. E. Balmer, H. Hung, Y. Yu, R. J. Letcher, and D. C. G. Muir,
"Sources and environmental fate of pyrogenic polycyclic aromatic
hydrocarbons (PAHs) in the Arctic," Emerging Contaminants, vol. 5,
pp. 128-142, 2019/01/01/ 2019.
[66] M. Ya, L. Xu, Y. Wu, Y. Li, S. Zhao, and X. Wang, "Fossil Fuel-
Derived Polycyclic Aromatic Hydrocarbons in the Taiwan Strait, China,
and Fluxes across the Air–Water Interface," Environmental Science &
Technology, vol. 52, pp. 7307-7316, 2018/07/03 2018.
[67] L. C. Marr, T. W. Kirchstetter, R. A. Harley, A. H. Miguel, S. V.
Hering, and S. K. Hammond, "Characterization of Polycyclic Aromatic
Hydrocarbons in Motor Vehicle Fuels and Exhaust Emissions,"
Environmental Science & Technology, vol. 33, pp. 3091-3099,
1999/09/01 1999.
[68] M. G. Perrone, C. Carbone, D. Faedo, L. Ferrero, A. Maggioni, G.
Sangiorgi, et al., "Exhaust emissions of polycyclic aromatic
hydrocarbons, n-alkanes and phenols from vehicles coming within
different European classes," Atmospheric Environment, vol. 82, pp. 391-
400, 2014/01/01/ 2014.
[69] C. A. Alves, C. Barbosa, S. Rocha, A. Calvo, T. Nunes, M. Cerqueira, et
al., "Elements and polycyclic aromatic hydrocarbons in exhaust
100
particles emitted by light-duty vehicles," Environmental Science and
Pollution Research, vol. 22, pp. 11526-11542, August 01 2015.
[70] E. Stańczyk-Mazanek, L. Stępniak, and U. Kępa, "Analysis of
Migration of Polycyclic Aromatic Hydrocarbons from Sewage Sludge
Used for Fertilization to Soils, Surface Waters, and Plants," Water, vol.
11, p. 1270, 2019.
[71] J.-Y. Oh, S.-D. Choi, H.-O. Kwon, and S.-E. Lee, "Leaching of
polycyclic aromatic hydrocarbons (PAHs) from industrial wastewater
sludge by ultrasonic treatment," Ultrasonics Sonochemistry, vol. 33, pp.
61-66, 2016/11/01/ 2016.
[72] R. Goldman, L. Enewold, E. Pellizzari, J. B. Beach, E. D. Bowman, S.
S. Krishnan, et al., "Smoking Increases Carcinogenic Polycyclic
Aromatic Hydrocarbons in Human Lung Tissue," Cancer Research, vol.
61, pp. 6367-6371, 2001.
[73] E. C. Klingbeil, K. M. Hew, U. C. Nygaard, and K. C. Nadeau,
"Polycyclic aromatic hydrocarbons, tobacco smoke, and epigenetic
remodeling in asthma," Immunologic research, vol. 58, pp. 369-373,
2014.
[74] A. Mojiri, J. L. Zhou, A. Ohashi, N. Ozaki, and T. Kindaichi,
"Comprehensive review of polycyclic aromatic hydrocarbons in water
sources, their effects and treatments," Science of The Total Environment,
vol. 696, p. 133971, 2019/12/15/ 2019.
[75] A. Rubio-Clemente, R. A. Torres-Palma, and G. A. Peñuela, "Removal
of polycyclic aromatic hydrocarbons in aqueous environment by
chemical treatments: A review," Science of The Total Environment, vol.
478, pp. 201-225, 2014/04/15/ 2014.
[76] P. Westerhoff, P. Chao, and H. Mash, "Reactivity of natural organic
matter with aqueous chlorine and bromine," Water Research, vol. 38,
pp. 1502-1513, 2004/03/01/ 2004.
[77] M. Deborde and U. von Gunten, "Reactions of chlorine with inorganic
and organic compounds during water treatment—Kinetics and
mechanisms: A critical review," Water Research, vol. 42, pp. 13-51,
2008/01/01/ 2008.
[78] H. Yu, Q. Xia, J. Yan, D. Herreno-Saenz, Y.-S. Wu, I. W. Tang, et al.,
"Photoirradiation of polycyclic aromatic hydrocarbons with UVA light -
a pathway leading to the generation of reactive oxygen species, lipid
peroxidation, and dna damage," International journal of environmental
research and public health, vol. 3, pp. 348-354, 2006.
[79] L. Zhang, P. Li, Z. Gong, and X. Li, "Photocatalytic degradation of
polycyclic aromatic hydrocarbons on soil surfaces using TiO2 under UV
light," Journal of Hazardous Materials, vol. 158, pp. 478-484,
2008/10/30/ 2008.
[80] A. A. Akinpelu, M. E. Ali, M. R. Johan, R. Saidur, M. A. Qurban, and
T. A. Saleh, "Polycyclic aromatic hydrocarbons extraction and removal
from wastewater by carbon nanotubes: A review of the current
technologies, challenges and prospects," Process Safety and
Environmental Protection, vol. 122, pp. 68-82, 2019/02/01/ 2019.
[81] K. Yang, L. Zhu, and B. Xing, "Adsorption of Polycyclic Aromatic
Hydrocarbons by Carbon Nanomaterials," Environmental Science &
Technology, vol. 40, pp. 1855-1861, 2006/03/01 2006.

101
[82] M. Kronenberg, E. Trably, N. Bernet, and D. Patureau, "Biodegradation
of polycyclic aromatic hydrocarbons: Using microbial
bioelectrochemical systems to overcome an impasse," Environmental
Pollution, vol. 231, pp. 509-523, 2017/12/01/ 2017.
[83] S. Chen, Z. Ma, S. Li, M. G. Waigi, J. Jiang, J. Liu, et al., "Colonization
of polycyclic aromatic hydrocarbon-degrading bacteria on roots reduces
the risk of PAH contamination in vegetables," Environment
International, vol. 132, p. 105081, 2019/11/01/ 2019.
[84] P. Ghafarian, H. Jamaati, and S. M. Hashemian, "A Review on Human
Respiratory Modeling," Tanaffos, vol. 15, pp. 61-69, 2016.
[85] R. Elsaesser and J. Paysan, "The sense of smell, its signalling pathways,
and the dichotomy of cilia and microvilli in olfactory sensory cells,"
BMC Neuroscience, vol. 8, p. S1, 2007/09/18 2007.
[86] Y. Soudry, C. Lemogne, D. Malinvaud, S. M. Consoli, and P. Bonfils,
"Olfactory system and emotion: Common substrates," European Annals
of Otorhinolaryngology, Head and Neck Diseases, vol. 128, pp. 18-23,
2011/01/01/ 2011.
[87] D. H. Zald and J. V. Pardo, "Emotion, olfaction, and the human
amygdala: amygdala activation during aversive olfactory stimulation,"
Proceedings of the National Academy of Sciences of the United States of
America, vol. 94, pp. 4119-4124, 1997.
[88] M. H. Janeiro, M. J. Ramírez, F. I. Milagro, J. A. Martínez, and M.
Solas, "Implication of Trimethylamine N-Oxide (TMAO) in Disease:
Potential Biomarker or New Therapeutic Target," Nutrients, vol. 10, p.
1398, 2018.
[89] A. Majid, N. Burenhult, M. Stensmyr, J. d. Valk, and B. S. Hansson,
"Olfactory language and abstraction across cultures," Philosophical
Transactions of the Royal Society B: Biological Sciences, vol. 373, p.
20170139, 2018.
[90] J. H. B. de Groot and M. A. M. Smeets, "Human Fear Chemosignaling:
Evidence from a Meta-Analysis," Chemical Senses, vol. 42, pp. 663-
673, 2017.
[91] I. Frumin, O. Perl, Y. Endevelt-Shapira, A. Eisen, N. Eshel, I. Heller, et
al., "A social chemosignaling function for human handshaking," eLife,
vol. 4, p. e05154, 2015/03/03 2015.
[92] J. H. B. de Groot, L. A. E. M. van Houtum, I. Gortemaker, Y. Ye, W.
Chen, W. Zhou, et al., "Beyond the west: Chemosignaling of emotions
transcends ethno-cultural boundaries," Psychoneuroendocrinology, vol.
98, pp. 177-185, 2018/12/01/ 2018.
[93] S. Gelstein, Y. Yeshurun, L. Rozenkrantz, S. Shushan, I. Frumin, Y.
Roth, et al., "Human Tears Contain a Chemosignal," Science, vol. 331,
pp. 226-230, 2011.
[94] M. Di Lena, F. Porcelli, and D. F. Altomare, "Volatile organic
compounds as new biomarkers for colorectal cancer: a review,"
Colorectal Disease, vol. 18, pp. 654-663, 2016.
[95] W. Li, W. Dai, M. Liu, Y. Long, C. Wang, S. Xie, et al., "VOC
biomarkers identification and predictive model construction for lung
cancer based on exhaled breath analysis: research protocol for an
exploratory study," BMJ Open, vol. 9, p. e028448, 2019.

102
[96] M. Shirasu and K. Touhara, "The scent of disease: volatile organic
compounds of the human body related to disease and disorder," The
Journal of Biochemistry, vol. 150, pp. 257-266, 2011.
[97] M. Shirasu, S. Nagai, R. Hayashi, A. Ochiai, and K. Touhara, "Dimethyl
Trisulfide as a Characteristic Odor Associated with Fungating Cancer
Wounds," Bioscience, Biotechnology, and Biochemistry, vol. 73, pp.
2117-2120, 2009/09/23 2009.
[98] A. G. Dent, T. G. Sutedja, and P. V. Zimmerman, "Exhaled breath
analysis for lung cancer," Journal of thoracic disease, vol. 5 Suppl 5,
pp. S540-S550, 2013.
[99] M. Hakim, Y. Y. Broza, O. Barash, N. Peled, M. Phillips, A. Amann, et
al., "Volatile Organic Compounds of Lung Cancer and Possible
Biochemical Pathways," Chemical Reviews, vol. 112, pp. 5949-5966,
2012/11/14 2012.
[100] Z. Jia, H. Zhang, C. N. Ong, A. Patra, Y. Lu, C. T. Lim, et al.,
"Detection of Lung Cancer: Concomitant Volatile Organic Compounds
and Metabolomic Profiling of Six Cancer Cell Lines of Different
Histological Origins," ACS Omega, vol. 3, pp. 5131-5140, 2018/05/31
2018.
[101] C. Sánchez, J. P. Santos, and J. Lozano, "Use of Electronic Noses for
Diagnosis of Digestive and Respiratory Diseases through the Breath,"
Biosensors, vol. 9, p. 35, 2019.
[102] G. Rocco, G. Pennazza, M. Santonico, F. Longo, R. Rocco, P. Crucitti,
et al., "Breathprinting and Early Diagnosis of Lung Cancer," Journal of
Thoracic Oncology, vol. 13, pp. 883-894, 2018.
[103] L. Capelli, G. Taverna, A. Bellini, L. Eusebio, N. Buffi, M. Lazzeri, et
al., "Application and Uses of Electronic Noses for Clinical Diagnosis on
Urine Samples: A Review," Sensors, vol. 16, p. 1708, 2016.
[104] C. Angle, L. P. Waggoner, A. Ferrando, P. Haney, and T. Passler,
"Canine Detection of the Volatilome: A Review of Implications for
Pathogen and Disease Detection," Frontiers in Veterinary Science, vol.
3, 2016-June-24 2016.
[105] F. Röck, N. Barsan, and U. Weimar, "Electronic Nose: Current Status
and Future Trends," Chemical Reviews, vol. 108, pp. 705-725,
2008/02/01 2008.
[106] R. V. Luckheeram, R. Zhou, A. D. Verma, and B. Xia, "CD4+T Cells:
Differentiation and Functions," Clinical and Developmental
Immunology, vol. 2012, p. 12, 2012.
[107] S. Crotty, "A brief history of T cell help to B cells," Nature Reviews
Immunology, vol. 15, pp. 185-189, 2015/03/01 2015.
[108] K. Elkon and P. Casali, "Nature and functions of autoantibodies,"
Nature Clinical Practice Rheumatology, vol. 4, pp. 491-498, 2008/09/01
2008.
[109] R. H. Scofield, "Autoantibodies as predictors of disease," The Lancet,
vol. 363, pp. 1544-1546, 2004.
[110] C. Ge and R. Holmdahl, "The structure, specificity and function of anti-
citrullinated protein antibodies," Nature Reviews Rheumatology, vol. 15,
pp. 503-508, 2019/08/01 2019.
[111] A. Raptopoulou, P. Sidiropoulos, M. Katsouraki, and D. T. Boumpas,
"Anti-Citrulline Antibodies in the Diagnosis and Prognosis of

103
Rheumatoid Arthritis: Evolving Concepts," Critical Reviews in Clinical
Laboratory Sciences, vol. 44, pp. 339-363, 2007/01/01 2007.
[112] S. Crotty, "A brief history of T cell help to B cells," Nature reviews.
Immunology, vol. 15, pp. 185-189, 2015.
[113] J. Hernández and I. M. Thompson, "Prostate-specific antigen: A review
of the validation of the most commonly used cancer biomarker,"
Cancer, vol. 101, pp. 894-904, 2004.
[114] D. Killock, "Biomarker potential of CA-125 enhanced," Nature Reviews
Clinical Oncology, vol. 12, pp. 437-437, 2015/08/01 2015.
[115] M. Hirsch, J. Duffy, C. Davis, M. Nieves Plana, K. Khan, o. b. o. t. I. C.
t. H. Outcomes, et al., "Diagnostic accuracy of cancer antigen 125
for endometriosis: a systematic review and meta-analysis," BJOG: An
International Journal of Obstetrics & Gynaecology, vol. 123, pp. 1761-
1768, 2016.
[116] W.-S. Liao, Y. Ho, Y.-W. Lin, E. Naveen Raj, K.-K. Liu, C. Chen, et
al., "Targeting EGFR of triple-negative breast cancer enhances the
therapeutic efficacy of paclitaxel- and cetuximab-conjugated
nanodiamond nanocomposite," Acta Biomaterialia, vol. 86, pp. 395-
405, 2019/03/01/ 2019.
[117] K. Nakai, M.-C. Hung, and H. Yamaguchi, "A perspective on anti-
EGFR therapies targeting triple-negative breast cancer," American
journal of cancer research, vol. 6, pp. 1609-1623, 2016.
[118] K. Wang, G. Wei, and D. Liu, "CD19: a biomarker for B cell
development, lymphoma diagnosis and therapy," Experimental
Hematology & Oncology, vol. 1, p. 36, 2012/11/29 2012.
[119] J. S. Abramson, "Anti-CD19 CAR T-Cell Therapy for B-Cell Non-
Hodgkin Lymphoma," Transfusion Medicine Reviews, 2019/08/29/
2019.
[120] R. A. Sherwood, "HAEMOGLOBINS (HEMOGLOBINS)," in
Encyclopedia of Analytical Science (Second Edition), P. Worsfold, A.
Townshend, and C. Poole, Eds., ed Oxford: Elsevier, 2005, pp. 223-229.
[121] F. E. Smith, J. Herbert, J. Gaudin, D. J. Hennessy, and G. R. Reid,
"Serum iron determination using ferene triazine," Clinical Biochemistry,
vol. 17, pp. 306-310, 1984/10/01/ 1984.
[122] L. L. Stookey, "Ferrozine---a new spectrophotometric reagent for iron,"
Analytical Chemistry, vol. 42, pp. 779-781, 1970/06/01 1970.
[123] M. Maity, K. Bera, U. Pal, K. Khamaru, and N. C. Maiti, "Sensing of
Iron(III) Ion via Modulation of Redox Potential on Biliverdin Protected
Silver Nanosurface," ACS Applied Nano Materials, vol. 1, pp. 6099-
6111, 2018/11/26 2018.
[124] S. Biswas, V. Sharma, P. Kumar, and A. L. Koner, "Selective sensing of
lysosomal iron(III) via three-component fluorescence-based strategy in
living cells," Sensors and Actuators B: Chemical, vol. 260, pp. 460-464,
2018/05/01/ 2018.
[125] N. Chauhan, S. R. Anand, R. Aggarwal, J. Kaushik, S. S. Shekhawat, A.
K. Sonker, et al., "Soluble non-toxic carbon nano-rods for the selective
sensing of iron(iii) and chromium(vi)," New Journal of Chemistry, vol.
43, pp. 10726-10734, 2019.
104
[126] D. K. Sahu, D. Singha, and K. Sahu, "Sensing of iron(III)-biomolecules
by surfactant-free fluorescent copper nanoclusters," Sensing and Bio-
Sensing Research, vol. 22, p. 100250, 2019/02/01/ 2019.
[127] Y. Yang, X. Wang, Q. Cui, Q. Cao, and L. Li, "Self-Assembly of
Fluorescent Organic Nanoparticles for Iron(III) Sensing and Cellular
Imaging," ACS Applied Materials & Interfaces, vol. 8, pp. 7440-7448,
2016/03/23 2016.
[128] N. Łukasik, E. Wagner-Wysiecka, and A. Małachowska, "Iron(iii)-
selective materials based on a catechol-bearing amide for optical
sensing," Analyst, vol. 144, pp. 3119-3127, 2019.
[129] B. Halliwell, M. V. Clement, and L. H. Long, "Hydrogen peroxide in
the human body," FEBS Letters, vol. 486, pp. 10-13, 2000/12/01/ 2000.
[130] K. S. Putt and R. B. Pugh, "A High-Throughput Microtiter Plate Based
Method for the Determination of Peracetic Acid and Hydrogen
Peroxide," PLOS ONE, vol. 8, p. e79218, 2013.
[131] M. Vert, Y. Doi, K.-H. Hellwich, M. Hess, P. Hodge, P. Kubisa, et al.,
"Terminology for biorelated polymers and applications (IUPAC
Recommendations 2012)," in Pure and Applied Chemistry vol. 84, ed,
2012, p. 377.
[132] V. Amendola, R. Pilot, M. Frasconi, O. M. Maragò, and M. A. Iatì,
"Surface plasmon resonance in gold nanoparticles: a review," Journal of
Physics: Condensed Matter, vol. 29, p. 203002, 2017/04/20 2017.
[133] S. Agnihotri, S. Mukherji, and S. Mukherji, "Size-controlled silver
nanoparticles synthesized over the range 5–100 nm using the same
protocol and their antibacterial efficacy," RSC Advances, vol. 4, pp.
3974-3983, 2014.
[134] D. Subara and I. Jaswir, "Gold Nanoparticles: Synthesis and application
for Halal Authentication in Meat and Meat Products," vol. 8 (2018),
07/13 2018.
[135] J. Kimling, M. Maier, B. Okenve, V. Kotaidis, H. Ballot, and A. Plech,
"Turkevich Method for Gold Nanoparticle Synthesis Revisited," The
Journal of Physical Chemistry B, vol. 110, pp. 15700-15707,
2006/08/01 2006.
[136] J. Turkevich, P. C. Stevenson, and J. Hillier, "A study of the nucleation
and growth processes in the synthesis of colloidal gold," Discussions of
the Faraday Society, vol. 11, pp. 55-75, 1951.
[137] N. Wangoo, K. K. Bhasin, S. K. Mehta, and C. R. Suri, "Synthesis and
capping of water-dispersed gold nanoparticles by an amino acid:
Bioconjugation and binding studies," Journal of Colloid and Interface
Science, vol. 323, pp. 247-254, 2008/07/15/ 2008.
[138] S. D. Perrault and W. C. W. Chan, "Synthesis and Surface Modification
of Highly Monodispersed, Spherical Gold Nanoparticles of 50−200
nm," Journal of the American Chemical Society, vol. 131, pp. 17042-
17043, 2009/12/02 2009.
[139] M. Brust, M. Walker, D. Bethell, D. J. Schiffrin, and R. Whyman,
"Synthesis of thiol-derivatised gold nanoparticles in a two-phase
Liquid–Liquid system," Journal of the Chemical Society, Chemical
Communications, pp. 801-802, 1994.
[140] S. Pal, Y. K. Tak, and J. M. Song, "Does the Antibacterial Activity of
Silver Nanoparticles Depend on the Shape of the Nanoparticle? A Study

105
of the Gram-Negative Bacterium <em>Escherichia coli</em>," Applied
and Environmental Microbiology, vol. 73, pp. 1712-1720, 2007.
[141] X. Liu, Y. Chen, H. Li, N. Huang, Q. Jin, K. Ren, et al., "Enhanced
Retention and Cellular Uptake of Nanoparticles in Tumors by
Controlling Their Aggregation Behavior," ACS Nano, vol. 7, pp. 6244-
6257, 2013/07/23 2013.
[142] C. K. K. Choi, J. Li, K. Wei, Y. J. Xu, L. W. C. Ho, M. Zhu, et al., "A
Gold@Polydopamine Core–Shell Nanoprobe for Long-Term
Intracellular Detection of MicroRNAs in Differentiating Stem Cells,"
Journal of the American Chemical Society, vol. 137, pp. 7337-7346,
2015/06/17 2015.
[143] W. Schärtl, "Current directions in core–shell nanoparticle design,"
Nanoscale, vol. 2, pp. 829-843, 2010.
[144] V. Kozlovskaya, O. Zavgorodnya, Y. Chen, K. Ellis, H. M. Tse, W. Cui,
et al., "Ultrathin polymeric coatings based on hydrogen-bonded
polyphenol for protection of pancreatic islet cells," Advanced functional
materials, vol. 22, pp. 3389-3398, 2012.
[145] T. S. Sileika, D. G. Barrett, R. Zhang, K. H. A. Lau, and P. B.
Messersmith, "Colorless Multifunctional Coatings Inspired by
Polyphenols Found in Tea, Chocolate, and Wine," Angewandte Chemie
International Edition, vol. 52, pp. 10766-10770, 2013.
[146] Z. Chen, C. Wang, J. Chen, and X. Li, "Biocompatible, Functional
Spheres Based on Oxidative Coupling Assembly of Green Tea
Polyphenols," Journal of the American Chemical Society, vol. 135, pp.
4179-4182, 2013/03/20 2013.
[147] D. G. Barrett, T. S. Sileika, and P. B. Messersmith, "Molecular diversity
in phenolic and polyphenolic precursors of tannin-inspired
nanocoatings," Chemical Communications, vol. 50, pp. 7265-7268,
2014.
[148] W. E. Bentley and G. F. Payne, "Nature's Other Self-Assemblers,"
Science, vol. 341, pp. 136-137, 2013.
[149] K. Ohno, K.-m. Koh, Y. Tsujii, and T. Fukuda, "Synthesis of Gold
Nanoparticles Coated with Well-Defined, High-Density Polymer
Brushes by Surface-Initiated Living Radical Polymerization,"
Macromolecules, vol. 35, pp. 8989-8993, 2002/11/01 2002.
[150] J. Shan, M. Nuopponen, H. Jiang, E. Kauppinen, and H. Tenhu,
"Preparation of Poly(N-isopropylacrylamide)-Monolayer-Protected
Gold Clusters: Synthesis Methods, Core Size, and Thickness of
Monolayer," Macromolecules, vol. 36, pp. 4526-4533, 2003/06/01
2003.
[151] T. Zeng, X. Zhang, Y. Guo, H. Niu, and Y. Cai, "Enhanced catalytic
application of Au@polyphenol-metal nanocomposites synthesized by a
facile and green method," Journal of Materials Chemistry A, vol. 2, pp.
14807-14811, 2014.
[152] S. Luo, J. Xu, Y. Zhang, S. Liu, and C. Wu, "Double Hydrophilic Block
Copolymer Monolayer Protected Hybrid Gold Nanoparticles and Their
Shell Cross-Linking," The Journal of Physical Chemistry B, vol. 109,
pp. 22159-22166, 2005/12/01 2005.
[153] E. W. Edwards, M. Chanana, D. Wang, and H. Möhwald, "Stimuli-
Responsive Reversible Transport of Nanoparticles Across Water/Oil

106
Interfaces," Angewandte Chemie International Edition, vol. 47, pp. 320-
323, 2008.
[154] J. Fei, J. Zhao, C. Du, A. Wang, H. Zhang, L. Dai, et al., "One-Pot
Ultrafast Self-Assembly of Autofluorescent Polyphenol-Based
Core@Shell Nanostructures and Their Selective Antibacterial
Applications," ACS Nano, vol. 8, pp. 8529-8536, 2014/08/26 2014.
[155] H. J. Kim, Y.-S. Choi, M.-Y. Lim, K. H. Jung, D.-G. Kim, J.-J. Kim, et
al., "Reverse osmosis nanocomposite membranes containing graphene
oxides coated by tannic acid with chlorine-tolerant and antimicrobial
properties," Journal of Membrane Science, vol. 514, pp. 25-34,
2016/09/15/ 2016.
[156] Y. Cao, R. Zheng, X. Ji, H. Liu, R. Xie, and W. Yang, "Syntheses and
Characterization of Nearly Monodispersed, Size-Tunable Silver
Nanoparticles over a Wide Size Range of 7–200 nm by Tannic Acid
Reduction," Langmuir, vol. 30, pp. 3876-3882, 2014/04/08 2014.
[157] T. Y. Kim, S.-H. Cha, S. Cho, and Y. Park, "Tannic acid-mediated green
synthesis of antibacterial silver nanoparticles," Archives of Pharmacal
Research, vol. 39, pp. 465-473, April 01 2016.
[158] I. Erel-Unal and S. A. Sukhishvili, "Hydrogen-Bonded Multilayers of a
Neutral Polymer and a Polyphenol," Macromolecules, vol. 41, pp. 3962-
3970, 2008/06/01 2008.
[159] L. Lybaert, E. De Vlieghere, R. De Rycke, N. Vanparijs, O. De Wever,
S. De Koker, et al., "Bio-Hybrid Tumor Cell-Templated Capsules: A
Generic Formulation Strategy for Tumor Associated Antigens in View
of Immune Therapy," Advanced Functional Materials, vol. 24, pp.
7139-7150, 2014.
[160] Y. Sun and Y. Xia, "Shape-Controlled Synthesis of Gold and Silver
Nanoparticles," Science, vol. 298, pp. 2176-2179, 2002.
[161] M. Grzelczak, J. Pérez-Juste, P. Mulvaney, and L. M. Liz-Marzán,
"Shape control in gold nanoparticle synthesis," Chemical Society
Reviews, vol. 37, pp. 1783-1791, 2008.
[162] L. Guo, A. R. Ferhan, H. Chen, C. Li, G. Chen, S. Hong, et al.,
"Distance-Mediated Plasmonic Dimers for Reusable Colorimetric
Switches: A Measurable Peak Shift of More than 60 nm," Small, vol. 9,
pp. 234-240, 2013.
[163] D. Acharya and B. Mohanta, "Optical properties of synthesized Ag and
Ag@SiO2 core-shell nanoparticles," AIP Conference Proceedings, vol.
1832, p. 050155, 2017.
[164] M. Jastrzebska, J. Zalewska-Rejdak, R. Wrzalik, A. Kocot, I. Mroz, B.
Barwinski, et al., "Tannic acid-stabilized pericardium tissue: IR
spectroscopy, atomic force microscopy, and dielectric spectroscopy
investigations," Journal of Biomedical Materials Research Part A, vol.
78A, pp. 148-156, 2006.
[165] K. Liang, R. Ricco, C. M. Doherty, M. J. Styles, S. Bell, N. Kirby, et
al., "Biomimetic mineralization of metal-organic frameworks as
protective coatings for biomacromolecules," Nature Communications,
vol. 6, p. 7240, 06/04/online 2015.
[166] D. J. Tobler, J. D. Rodriguez-Blanco, K. Dideriksen, N. Bovet, K. K.
Sand, and S. L. S. Stipp, "Citrate Effects on Amorphous Calcium
107
Carbonate (ACC) Structure, Stability, and Crystallization," Advanced
Functional Materials, vol. 25, pp. 3081-3090, 2015.
[167] D. Gürsoy, T. Biçer, J. D. Almer, R. Kettimuthu, S. R. Stock, and F. De
Carlo, "Maximum a posteriori estimation of crystallographic phases in
X-ray diffraction tomography," Philosophical transactions. Series A,
Mathematical, physical, and engineering sciences, vol. 373, p.
20140392, 2015.
[168] L. Fan, Y. Ma, Y. Su, R. Zhang, Y. Liu, Q. Zhang, et al., "Green coating
by coordination of tannic acid and iron ions for antioxidant
nanofiltration membranes," RSC Advances, vol. 5, pp. 107777-107784,
2015.
[169] M. A. Rahim, H. Ejima, K. L. Cho, K. Kempe, M. Müllner, J. P. Best, et
al., "Coordination-Driven Multistep Assembly of Metal–Polyphenol
Films and Capsules," Chemistry of Materials, vol. 26, pp. 1645-1653,
2014/02/25 2014.
[170] J. Guo, Y. Ping, H. Ejima, K. Alt, M. Meissner, J. J. Richardson, et al.,
"Engineering Multifunctional Capsules through the Assembly of Metal–
Phenolic Networks," Angewandte Chemie, vol. 126, pp. 5652-5657,
2014.
[171] M. J. Sever and J. J. Wilker, "Visible absorption spectra of metal–
catecholate and metal–tironate complexes," Dalton Transactions, pp.
1061-1072, 2004.
[172] S. U. Islam, A. Shehzad, M. B. Ahmed, and Y. S. Lee, "Intranasal
Delivery of Nanoformulations: A Potential Way of Treatment for
Neurological Disorders," Molecules, vol. 25, p. 1929, 2020.
[173] W. Zhang, A. J. Christofferson, Q. A. Besford, J. J. Richardson, J. Guo,
Y. Ju, et al., "Metal-dependent inhibition of amyloid fibril formation:
synergistic effects of cobalt–tannic acid networks," Nanoscale, vol. 11,
pp. 1921-1928, 2019.
[174] A. Ponce, L. B. Brostoff, S. K. Gibbons, P. Zavalij, C. Viragh, J.
Hooper, et al., "Elucidation of the Fe(III) Gallate Structure in Historical
Iron Gall Ink," Analytical Chemistry, vol. 88, pp. 5152-5158,
2016/05/17 2016.
[175] J. Wei, G. Wang, F. Chen, M. Bai, Y. Liang, H. Wang, et al., "Sol–Gel
Synthesis of Metal–Phenolic Coordination Spheres and Their Derived
Carbon Composites," Angewandte Chemie International Edition, vol.
57, pp. 9838-9843, 2018.
[176] X. Chen, X. Zhou, and J. Hu, "Pt–DNA complexes as peroxidase
mimetics and their applications in colorimetric detection of H2O2 and
glucose," Analytical Methods, vol. 4, pp. 2183-2187, 2012.
[177] J. Guan, J. Peng, and X. Jin, "Synthesis of copper sulfide nanorods as
peroxidase mimics for the colorimetric detection of hydrogen peroxide,"
Analytical Methods, vol. 7, pp. 5454-5461, 2015.
[178] K. Nitinaivinij, T. Parnklang, C. Thammacharoen, S. Ekgasit, and K.
Wongravee, "Colorimetric determination of hydrogen peroxide by
morphological decomposition of silver nanoprisms coupled with
chromaticity analysis," Analytical Methods, vol. 6, pp. 9816-9824, 2014.
[179] T. Chen, L. Tian, Y. Chen, B. Liu, and J. Zhang, "A Facile One-Pot
Synthesis of Au/Cu2O Nanocomposites for Nonenzymatic Detection of

108
Hydrogen Peroxide," Nanoscale Research Letters, vol. 10, p. 252,
2015/06/03 2015.
[180] X. Guo, Y. Ying, and L. Tong, "Photonic Nanowires: From
Subwavelength Waveguides to Optical Sensors," Accounts of Chemical
Research, vol. 47, pp. 656-666, 2014/02/18 2014.
[181] E. B. Guidez and C. M. Aikens, "Diameter Dependence of the
Excitation Spectra of Silver and Gold Nanorods," The Journal of
Physical Chemistry C, vol. 117, pp. 12325-12336, 2013/06/13 2013.
[182] P. G. Falkowski, R. T. Barber, and V. Smetacek, "Biogeochemical
Controls and Feedbacks on Ocean Primary Production," Science, vol.
281, pp. 200-206, 1998.
[183] M. J. Behrenfeld, A. J. Bale, Z. S. Kolber, J. Aiken, and P. G.
Falkowski, "Confirmation of iron limitation of phytoplankton
photosynthesis in the equatorial Pacific Ocean," Nature, vol. 383, pp.
508-511, 1996/10/01 1996.
[184] M. A. Smith, P. L. Harris, L. M. Sayre, and G. Perry, "Iron
accumulation in Alzheimer disease is a source of redox-generated free
radicals," Proceedings of the National Academy of Sciences of the
United States of America, vol. 94, pp. 9866-9868, 1997.
[185] X. Liu and E. C. Theil, "Ferritins: Dynamic Management of Biological
Iron and Oxygen Chemistry," Accounts of Chemical Research, vol. 38,
pp. 167-175, 2005/03/01 2005.
[186] M. P. Mattson, "Pathways towards and away from Alzheimer's disease,"
Nature, vol. 430, pp. 631-639, 2004/08/01 2004.
[187] O. BLOKHINA, E. VIROLAINEN, and K. V. FAGERSTEDT,
"Antioxidants, Oxidative Damage and Oxygen Deprivation Stress: a
Review," Annals of Botany, vol. 91, pp. 179-194, 2003.
[188] D. G. Georganopoulou, L. Chang, J.-M. Nam, C. S. Thaxton, E. J.
Mufson, W. L. Klein, et al., "Nanoparticle-based detection in cerebral
spinal fluid of a soluble pathogenic biomarker for Alzheimer's disease,"
Proceedings of the National Academy of Sciences of the United States of
America, vol. 102, pp. 2273-2276, 2005.
[189] D. Chakraborty, T. S. Viveka, K. Arvind, V. Shyamsundar, M.
Kanchan, S. A. Alex, et al., "A facile gold nanoparticle-based ELISA
system for detection of osteopontin in saliva: Towards oral cancer
diagnostics," Clin Chim Acta, vol. 477, pp. 166-172, Feb 2018.
[190] C. N. Loynachan, A. P. Soleimany, J. S. Dudani, Y. Lin, A. Najer, A.
Bekdemir, et al., "Renal clearable catalytic gold nanoclusters for in vivo
disease monitoring," Nature Nanotechnology, vol. 14, pp. 883-890,
2019/09/01 2019.
[191] N. Ajdari, C. Vyas, S. L. Bogan, B. A. Lwaleed, and B. G. Cousins,
"Gold nanoparticle interactions in human blood: a model evaluation,"
Nanomedicine: Nanotechnology, Biology and Medicine, vol. 13, pp.
1531-1542, 2017/05/01/ 2017.
[192] D. Caputo and G. Caracciolo, "Nanoparticle-enabled blood tests for
early detection of pancreatic ductal adenocarcinoma," Cancer Letters,
vol. 470, pp. 191-196, 2020/02/01/ 2020.
[193] T. Zheng, N. Pierre-Pierre, X. Yan, Q. Huo, A. J. O. Almodovar, F.
Valerio, et al., "Gold Nanoparticle-Enabled Blood Test for Early Stage

109
Cancer Detection and Risk Assessment," ACS Applied Materials &
Interfaces, vol. 7, pp. 6819-6827, 2015/04/01 2015.
[194] S. Dominguez-Medina, J. Blankenburg, J. Olson, C. F. Landes, and S.
Link, "Adsorption of a Protein Monolayer via Hydrophobic Interactions
Prevents Nanoparticle Aggregation under Harsh Environmental
Conditions," ACS Sustainable Chemistry & Engineering, vol. 1, pp.
833-842, 2013/07/01 2013.
[195] Y. Wei, A. Brandazza, and P. Pelosi, "Binding of polycyclic aromatic
hydrocarbons to mutants of odorant-binding protein: A first step
towards biosensors for environmental monitoring," Biochimica et
Biophysica Acta (BBA) - Proteins and Proteomics, vol. 1784, pp. 666-
671, 2008/04/01/ 2008.
[196] M. Larisika, C. Kotlowski, C. Steininger, R. Mastrogiacomo, P. Pelosi,
S. Schütz, et al., "Electronic Olfactory Sensor Based on A. mellifera
Odorant-Binding Protein 14 on a Reduced Graphene Oxide Field-Effect
Transistor," Angewandte Chemie International Edition, vol. 54, pp.
13245-13248, 2015.
[197] M. Y. Mulla, E. Tuccori, M. Magliulo, G. Lattanzi, G. Palazzo, K.
Persaud, et al., "Capacitance-modulated transistor detects odorant
binding protein chiral interactions," Nature Communications, vol. 6, p.
6010, 01/16/online 2015.
[198] H. Assenmacher‐Maiworm, J.-U. Hahn, B. Heinrich, C. Schuh, R.
Hebisch, T. Brock, et al., "Polycyclic aromatic hydrocarbons (PAHs) –
Method for the determination of semi‐volatile PAHs in workplace air
using high performance liquid chromatography (HPLC) [Air Monitoring
Methods, 2018]," The MAK‐Collection for Occupational Health and
Safety, vol. 3, pp. 902-917, 04/27 2018.
[199] M. Aznar, R. López, J. F. Cacho, and V. Ferreira, "Identification and
Quantification of Impact Odorants of Aged Red Wines from Rioja.
GC−Olfactometry, Quantitative GC-MS, and Odor Evaluation of HPLC
Fractions," Journal of Agricultural and Food Chemistry, vol. 49, pp.
2924-2929, 2001/06/01 2001.
[200] M. Brattoli, E. Cisternino, P. R. Dambruoso, G. de Gennaro, P.
Giungato, A. Mazzone, et al., "Gas chromatography analysis with
olfactometric detection (GC-O) as a useful methodology for chemical
characterization of odorous compounds," Sensors (Basel, Switzerland),
vol. 13, pp. 16759-16800, 2013.
[201] D.-A. Sess-Tchotch, K. B. D. Kedjebo, B. M. Faulet, A. Fontana-
Tachon, P. Alter, N. Durand, et al., "Analytical Method Validation and
Rapid Determination of Polycyclic Aromatic Hydrocarbons (PAHs) in
Cocoa Butter Using HPLC-FLD," Food Analytical Methods, vol. 11, pp.
3138-3146, 2018/11/01 2018.
[202] G. M. Titato and F. M. Lanças, "Optimization and validation of HPLC-
UV-DAD and HPLC-APCI-MS methodologies for the determination of
selected PAHs in water samples," J Chromatogr Sci, vol. 44, pp. 35-40,
Jan 2006.
[203] N. Misawa, S. Fujii, K. Kamiya, T. Osaki, T. Takaku, Y. Takahashi, et
al., "Construction of a Biohybrid Odorant Sensor Using Biological
Olfactory Receptors Embedded into Bilayer Lipid Membrane on a
Chip," ACS Sensors, vol. 4, pp. 711-716, 2019/03/22 2019.

110
[204] H. Yang, D. Kim, J. Kim, D. Moon, H. S. Song, M. Lee, et al.,
"Nanodisc-Based Bioelectronic Nose Using Olfactory Receptor
Produced in Escherichia coli for the Assessment of the Death-
Associated Odor Cadaverine," ACS Nano, vol. 11, pp. 11847-11855,
2017/12/26 2017.
[205] H. Yoon, S. H. Lee, O. S. Kwon, H. S. Song, E. H. Oh, T. H. Park, et
al., "Polypyrrole Nanotubes Conjugated with Human Olfactory
Receptors: High-Performance Transducers for FET-Type Bioelectronic
Noses," Angewandte Chemie International Edition, vol. 48, pp. 2755-
2758, 2009/03/30 2009.
[206] M. Perduca, F. Mancia, R. Del Giorgio, and H. L. Monaco, "Crystal
structure of a truncated form of porcine odorant-binding protein,"
Proteins: Structure, Function, and Bioinformatics, vol. 42, pp. 201-209,
2001.
[207] D. R. Flower, A. C. T. North, and T. K. Attwood, "Structure and
sequence relationships in the lipocalins and related proteins," Protein
Science, vol. 2, pp. 753-761, 1993.
[208] R. E. Bishop, "The bacterial lipocalins," Biochimica et Biophysica Acta
(BBA) - Protein Structure and Molecular Enzymology, vol. 1482, pp.
73-83, 2000/10/18/ 2000.
[209] P. Pelosi, I. Iovinella, J. Zhu, G. Wang, and F. R. Dani, "Beyond
chemoreception: diverse tasks of soluble olfactory proteins in insects,"
Biological Reviews, vol. 93, pp. 184-200, 2018.
[210] M. A. Bianchet, G. Bains, P. Pelosi, J. Pevsner, S. H. Snyder, H. L.
Monaco, et al., "The three-dimensional structure of bovine odorant
binding protein and its mechanism of odor recognition," Nature
Structural Biology, vol. 3, pp. 934-939, 1996/11/01 1996.
[211] S. Spinelli, R. Ramoni, S. Grolli, J. Bonicel, C. Cambillau, and M.
Tegoni, "The Structure of the Monomeric Porcine Odorant Binding
Protein Sheds Light on the Domain Swapping Mechanism,"
Biochemistry, vol. 37, pp. 7913-7918, 1998/06/01 1998.
[212] G. Gutiérrez, M. a. D. Ganfornina, and D. Sánchez, "Evolution of the
lipocalin family as inferred from a protein sequence phylogeny,"
Biochimica et Biophysica Acta (BBA) - Protein Structure and Molecular
Enzymology, vol. 1482, pp. 35-45, 2000/10/18/ 2000.
[213] P. Pelosi, I. Iovinella, A. Felicioli, and F. R. Dani, "Soluble proteins of
chemical communication: an overview across arthropods," Frontiers in
Physiology, vol. 5, 2014-August-27 2014.
[214] M. Tegoni, R. Ramoni, E. Bignetti, S. Spinelli, and C. Cambillau,
"Domain swapping creates a third putative combining site in bovine
odorant binding protein dimer," Nature Structural Biology, vol. 3, pp.
863-867, 1996/10/01 1996.
[215] R. Ramoni, F. Vincent, A. E. Ashcroft, P. Accornero, S. Grolli, C.
Valencia, et al., "Control of domain swapping in bovine odorant-binding
protein," The Biochemical journal, vol. 365, pp. 739-748, 2002.
[216] C. E. Sansom, A. C. T. North, and L. Sawyer, "Structural analysis and
classification of lipocalins and related proteins using a profile-search
method," Biochimica et Biophysica Acta (BBA) - Protein Structure and
Molecular Enzymology, vol. 1208, pp. 247-255, 1994/10/19/ 1994.

111
[217] D. A. Dartt, "Tear Lipocalin: structure and Function," The Ocular
Surface, vol. 9, pp. 126-138, 2011/07/01/ 2011.
[218] D. E. Timm, L. J. Baker, H. Mueller, L. Zidek, and M. V. Novotny,
"Structural basis of pheromone binding to mouse major urinary protein
(MUP-I)," Protein science : a publication of the Protein Society, vol.
10, pp. 997-1004, 2001.
[219] P. Chamero, T. F. Marton, D. W. Logan, K. Flanagan, J. R. Cruz, A.
Saghatelian, et al., "Identification of protein pheromones that promote
aggressive behaviour," Nature, vol. 450, p. 899, 12/06/online 2007.
[220] S. Marchese, D. Pes, A. Scaloni, V. Carbone, and P. Pelosi, "Lipocalins
of boar salivary glands binding odours and pheromones," European
Journal of Biochemistry, vol. 252, pp. 563-568, 1998.
[221] S. Spinelli, F. Vincent, P. Pelosi, M. Tegoni, and C. Cambillau, "Boar
salivary lipocalin," European Journal of Biochemistry, vol. 269, pp.
2449-2456, 2002.
[222] P. Pelosi, N. E. Baldaccini, and A. M. Pisanelli, "Identification of a
specific olfactory receptor for 2-isobutyl-3-methoxypyrazine,"
Biochemical Journal, vol. 201, pp. 245-248, 1982.
[223] P. Pelosi, C. Maremmani, and A. Muratorio, "Purification of an Odorant
Binding Protein from Human Nasal Mucosa," Berlin, Heidelberg, 1990,
pp. 125-130.
[224] K. C. Persaud, P. Pelosi, and G. H. Dodd, "Binding and metabolism of
the urinous odorant 5α-androstan-3-one in sheep olfactory mucosa,"
Chemical Senses, vol. 13, pp. 231-245, 1988.
[225] M. Dal Monte, I. Andreini, R. Revoltella, and P. Pelosi, "Purification
and characterization of two odorant-binding proteins from nasal tissue
of rabbit and pig," Comparative Biochemistry and Physiology Part B:
Comparative Biochemistry, vol. 99, pp. 445-451, 1991/01/01/ 1991.
[226] D. Pes, M. Dal Monte, M. Ganni, and P. Pelosi, "Isolation of two
odorant-binding proteins from mouse nasal tissue," Comparative
Biochemistry and Physiology Part B: Comparative Biochemistry, vol.
103, pp. 1011-1017, 1992/12/01/ 1992.
[227] J. Zhu, S. Arena, S. Spinelli, D. Liu, G. Zhang, R. Wei, et al., "Reverse
chemical ecology: Olfactory proteins from the giant panda and their
interactions with putative pheromones and bamboo volatiles,"
Proceedings of the National Academy of Sciences of the United States of
America, vol. 114, pp. E9802-E9810, 2017.
[228] R. R. H. Anholt, "Primary events in olfactory reception," Trends in
Biochemical Sciences, vol. 12, pp. 58-62, 1987/01/01/ 1987.
[229] D. Lancet and U. Pace, "The molecular basis of odor recognition,"
Trends in Biochemical Sciences, vol. 12, pp. 63-66, 1987/01/01/ 1987.
[230] D. Krautwurst, K.-W. Yau, and R. R. Reed, "Identification of Ligands
for Olfactory Receptors by Functional Expression of a Receptor
Library," Cell, vol. 95, pp. 917-926, 1998.
[231] L. Buck and R. Axel, "A novel multigene family may encode odorant
receptors: A molecular basis for odor recognition," Cell, vol. 65, pp.
175-187, 1991.
[232] T. V. Getchell and M. L. Getchell, "Regulatory factors in the vertebrate
olfactory mucosa," Chemical Senses, vol. 15, pp. 223-231, 1990.
112
[233] P. R. Schofield, "Carrier-bound odorant delivery to olfactory receptors,"
Trends in Neurosciences, vol. 11, pp. 471-472, 1988/01/01/ 1988.
[234] M. Genva, T. Kenne Kemene, M. Deleu, L. Lins, and M. L. Fauconnier,
"Is It Possible to Predict the Odor of a Molecule on the Basis of its
Structure?," Int J Mol Sci, vol. 20, Jun 20 2019.
[235] P. Pelosi, "The role of perireceptor events in vertebrate olfaction,"
Cellular and Molecular Life Sciences CMLS, vol. 58, pp. 503-509, April
01 2001.
[236] A. Schiefner, R. Freier, A. Eichinger, and A. Skerra, "Crystal structure
of the human odorant binding protein, OBPIIa," Proteins: Structure,
Function, and Bioinformatics, vol. 83, pp. 1180-1184, 2015.
[237] M. D. Monte, M. Centini, C. Anselmi, and P. Pelosi, "Binding of
selected odorants to bovine and porcine odorant-binding proteins,"
Chemical Senses, vol. 18, pp. 713-721, 1993.
[238] F. Vincent, S. Spinelli, R. Ramoni, S. Grolli, P. Pelosi, C. Cambillau, et
al., "Complexes of porcine odorant binding protein with odorant
molecules belonging to different chemical classes11Edited by R.
Huber," Journal of Molecular Biology, vol. 300, pp. 127-139,
2000/06/30/ 2000.
[239] R. Mastrogiacomo, I. Iovinella, and E. Napolitano, "New fluorescent
probes for ligand-binding assays of odorant-binding proteins,"
Biochemical and Biophysical Research Communications, vol. 446, pp.
137-142, 2014/03/28/ 2014.
[240] S. Paolini, F. Tanfani, C. Fini, E. Bertoli, and P. Paolo, "Porcine
odorant-binding protein: structural stability and ligand affinities
measured by Fourier-transform infrared spectroscopy and fluorescence
spectroscopy," Biochimica et Biophysica Acta (BBA) - Protein Structure
and Molecular Enzymology, vol. 1431, pp. 179-188, 1999/04/12/ 1999.
[241] M. Y. Mulla, E. Tuccori, M. Magliulo, G. Lattanzi, G. Palazzo, K.
Persaud, et al., "Capacitance-modulated transistor detects odorant
binding protein chiral interactions," Nature Communications, vol. 6, p.
6010, 2015/01/16 2015.
[242] V. Zaremska, J. Tan, S. Lim, W. Knoll, and P. Pelosi, "Isoleucine
Residues Determine Chiral Discrimination of Odorant-Binding Protein,"
Chemistry – A European Journal, vol. n/a, 2020/03/13 2020.
[243] G. P. Moss, P. A. S. Smith, and D. Tavernier, "Glossary of class names
of organic compounds and reactivity intermediates based on structure
(IUPAC Recommendations 1995)," in Pure and Applied Chemistry vol.
67, ed, 1995, p. 1307.
[244] R. A. Young, "RNA POLYMERASE II," Annual Review of
Biochemistry, vol. 60, pp. 689-715, 1991.
[245] F. Crick, "Central Dogma of Molecular Biology," Nature, vol. 227, pp.
561-563, 1970/08/01 1970.
[246] G. E. Palade, "A small particulate component of the cytoplasm," The
Journal of biophysical and biochemical cytology, vol. 1, pp. 59-68,
1955.
[247] V. Amarnath and A. D. Broom, "Chemical synthesis of
oligonucleotides," Chemical Reviews, vol. 77, pp. 183-217, 1977/04/01
1977.
113
[248] B. Roy, A. Depaix, C. Périgaud, and S. Peyrottes, "Recent Trends in
Nucleotide Synthesis," Chemical Reviews, vol. 116, pp. 7854-7897,
2016/07/27 2016.
[249] S. Kosuri and G. M. Church, "Large-scale de novo DNA synthesis:
technologies and applications," Nature Methods, vol. 11, p. 499,
04/29/online 2014.
[250] T. U. Consortium, "UniProt: a worldwide hub of protein knowledge,"
Nucleic Acids Research, vol. 47, pp. D506-D515, 2018.
[251] A. Filloux, "A Variety of Bacterial Pili Involved in Horizontal Gene
Transfer," Journal of Bacteriology, vol. 192, pp. 3243-3245, 2010.
[252] D. R. Gill, I. A. Pringle, and S. C. Hyde, "Progress and Prospects: The
design and production of plasmid vectors," Gene Therapy, vol. 16, p.
165, 01/08/online 2009.
[253] T. Watanabe and T. Fukasawa, "Episome-mediated transfer of drug
resistance in Enterobacteriaceae. I. Transfer of resistance factors by
conjugation," Journal of bacteriology, vol. 81, pp. 669-678, 1961.
[254] M. L. Mott and J. M. Berger, "DNA replication initiation: mechanisms
and regulation in bacteria," Nature Reviews Microbiology, vol. 5, p. 343,
05/01/online 2007.
[255] R. Yoshimori, D. Roulland-Dussoix, and H. W. Boyer, "R factor-
controlled restriction and modification of deoxyribonucleic acid:
restriction mutants," Journal of bacteriology, vol. 112, pp. 1275-1279,
1972.
[256] H. O. Smith and K. W. Welcox, "A Restriction enzyme from
Hemophilus influenzae: I. Purification and general properties," Journal
of Molecular Biology, vol. 51, pp. 379-391, 1970/07/28/ 1970.
[257] M. F. Au - Gonzales, T. Au - Brooks, S. U. Au - Pukatzki, and D. Au -
Provenzano, "Rapid Protocol for Preparation of Electrocompetent
Escherichia coli and Vibrio cholerae," JoVE, p. e50684, 2013/10/08/
2013.
[258] R. Green and E. J. Rogers, "Chapter Twenty Eight - Transformation of
Chemically Competent E. coli," in Methods in Enzymology. vol. 529, J.
Lorsch, Ed., ed: Academic Press, 2013, pp. 329-336.
[259] I. R. Lehnman, "DNA Ligase: Structure, Mechanism, and Function,"
Science, vol. 186, pp. 790-797, 1974.
[260] F. R. Bryant, "Construction of a recombinase-deficient mutant recA
protein that retains single-stranded DNA-dependent ATPase activity,"
Journal of Biological Chemistry, vol. 263, pp. 8716-8723, June 25, 1988
1988.
[261] J. W. Dubendorf and F. W. Studier, "Controlling basal expression in an
inducible T7 expression system by blocking the target T7 promoter with
lac repressor," Journal of Molecular Biology, vol. 219, pp. 45-59,
1991/05/05/ 1991.
[262] F. W. Studier and B. A. Moffatt, "Use of bacteriophage T7 RNA
polymerase to direct selective high-level expression of cloned genes,"
Journal of Molecular Biology, vol. 189, pp. 113-130, 1986/05/05/ 1986.
[263] F. William Studier, A. H. Rosenberg, J. J. Dunn, and J. W. Dubendorff,
"[6] Use of T7 RNA polymerase to direct expression of cloned genes,"
in Methods in Enzymology. vol. 185, ed: Academic Press, 1990, pp. 60-
89.

114
[264] F. W. Studier, "Use of bacteriophage T7 lysozyme to improve an
inducible T7 expression system," Journal of Molecular Biology, vol.
219, pp. 37-44, 1991/05/05/ 1991.
[265] P. T. Wingfield, "Preparation of Soluble Proteins from Escherichia
coli," Current Protocols in Protein Science, vol. 41, pp. 6.2.1-6.2.22,
2005.
[266] R. S. Singh, "A comparative study on cell disruption methods for
release of aspartase from E. coli K-12," Indian J Exp Biol, vol. 51, pp.
997-1003, Nov 2013.
[267] J. T. Sockolosky and F. C. Szoka, "Periplasmic production via the pET
expression system of soluble, bioactive human growth hormone,"
Protein Expression and Purification, vol. 87, pp. 129-135, 2013/02/01/
2013.
[268] R. Kunin and F. X. McGarvey, "Ion Exchange Chromatography,"
Analytical Chemistry, vol. 34, pp. 48R-50r, 1962/04/01 1962.
[269] S. Fekete, J.-L. Veuthey, A. Beck, and D. Guillarme, "Hydrophobic
interaction chromatography for the characterization of monoclonal
antibodies and related products," Journal of Pharmaceutical and
Biomedical Analysis, vol. 130, pp. 3-18, 2016/10/25/ 2016.
[270] R. R. Burgess, "A brief practical review of size exclusion
chromatography: Rules of thumb, limitations, and troubleshooting,"
Protein Expression and Purification, vol. 150, pp. 81-85, 2018/10/01/
2018.
[271] H. G. Barth, B. E. Boyes, and C. Jackson, "Size Exclusion
Chromatography," Analytical Chemistry, vol. 68, pp. 445-466,
1996/01/01 1996.
[272] S. Harper and D. W. Speicher, "Purification of Proteins Fused to
Glutathione S-Transferase," in Protein Chromatography: Methods and
Protocols, D. Walls and S. T. Loughran, Eds., ed Totowa, NJ: Humana
Press, 2011, pp. 259-280.
[273] S. Goutelle, M. Maurin, F. Rougier, X. Barbaut, L. Bourguignon, M.
Ducher, et al., "The Hill equation: a review of its capabilities in
pharmacological modelling," Fundamental & Clinical Pharmacology,
vol. 22, pp. 633-648, 2008.
[274] "PROCEEDINGS OF THE PHYSIOLOGICAL SOCIETY: January 22,
1910," The Journal of Physiology, vol. 40, pp. i-vii, 1910.
[275] R. R. Neubig, M. Spedding, T. Kenakin, and A. Christopoulos,
"International Union of Pharmacology Committee on Receptor
Nomenclature and Drug Classification. XXXVIII. Update on Terms and
Symbols in Quantitative Pharmacology," Pharmacological Reviews,
vol. 55, pp. 597-606, 2003.
[276] C. Yung-Chi and W. H. Prusoff, "Relationship between the inhibition
constant (KI) and the concentration of inhibitor which causes 50 per
cent inhibition (I50) of an enzymatic reaction," Biochemical
Pharmacology, vol. 22, pp. 3099-3108, 1973/12/01/ 1973.
[277] H. Kida, Y. Fukutani, J. D. Mainland, C. A. de March, A. Vihani, Y. R.
Li, et al., "Vapor detection and discrimination with a panel of odorant
receptors," Nature Communications, vol. 9, p. 4556, 2018/11/01 2018.
[278] M. J. Schultz, "Why Equilibrium? Understanding Entropy of Mixing,"
Journal of Chemical Education, vol. 76, p. 1391, 1999/10/01 1999.

115
[279] J. N. Weiss, "The Hill equation revisited: uses and misuses," The
FASEB Journal, vol. 11, pp. 835-841, 1997.
[280] R. Z. Cer, U. Mudunuri, R. Stephens, and F. J. Lebeda, "IC50-to-Ki: a
web-based tool for converting IC50 to Ki values for inhibitors of
enzyme activity and ligand binding," Nucleic Acids Research, vol. 37,
pp. W441-W445, 2009.
[281] J.-J. Zhou, G.-A. Zhang, W. Huang, M. A. Birkett, L. M. Field, J. A.
Pickett, et al., "Revisiting the odorant-binding protein LUSH of
Drosophila melanogaster: evidence for odour recognition and
discrimination," FEBS Letters, vol. 558, pp. 23-26, 2004/01/30/ 2004.
[282] S. W. Kruse, R. Zhao, D. P. Smith, and D. N. M. Jones, "Structure of a
specific alcohol-binding site defined by the odorant binding protein
LUSH from Drosophila melanogaster," Nature Structural & Molecular
Biology, vol. 10, pp. 694-700, 2003/09/01 2003.
[283] R. Heinrich, B. G. Neel, and T. A. Rapoport, "Mathematical Models of
Protein Kinase Signal Transduction," Molecular Cell, vol. 9, pp. 957-
970, 2002.
[284] Q. Gui, T. Lawson, S. Shan, L. Yan, and Y. Liu, "The Application of
Whole Cell-Based Biosensors for Use in Environmental Analysis and in
Medical Diagnostics," Sensors (Basel, Switzerland), vol. 17, p. 1623,
2017.
[285] F. Caliendo, M. Dukhinova, and V. Siciliano, "Engineered Cell-Based
Therapeutics: Synthetic Biology Meets Immunology," Frontiers in
Bioengineering and Biotechnology, vol. 7, 2019-March-18 2019.
[286] B. Angelici, E. Mailand, B. Haefliger, and Y. Benenson, "Synthetic
Biology Platform for Sensing and Integrating Endogenous
Transcriptional Inputs in Mammalian Cells," Cell Reports, vol. 16, pp.
2525-2537, 2016.
[287] J. Selberg, M. Gomez, and M. Rolandi, "The Potential for Convergence
between Synthetic Biology and Bioelectronics," Cell Systems, vol. 7, pp.
231-244, 2018.
[288] B. Saltepe, E. Ş. Kehribar, S. S. Su Yirmibeşoğlu, and U. Ö. Şafak
Şeker, "Cellular Biosensors with Engineered Genetic Circuits," ACS
Sensors, vol. 3, pp. 13-26, 2018/01/26 2018.
[289] W. Si, C. Li, and P. Wei, "Synthetic immunology: T-cell engineering
and adoptive immunotherapy," Synthetic and Systems Biotechnology,
vol. 3, pp. 179-185, 2018/09/01/ 2018.
[290] V. Siciliano, B. DiAndreth, B. Monel, J. Beal, J. Huh, K. L. Clayton, et
al., "Engineering modular intracellular protein sensor-actuator devices,"
Nature Communications, vol. 9, p. 1881, 2018/05/14 2018.
[291] Z. L. Chang, M. H. Lorenzini, X. Chen, U. Tran, N. J. Bangayan, and Y.
Y. Chen, "Rewiring T-cell responses to soluble factors with chimeric
antigen receptors," Nature Chemical Biology, vol. 14, p. 317,
01/29/online 2018.
[292] K. A. Schwarz, N. M. Daringer, T. B. Dolberg, and J. N. Leonard,
"Rewiring human cellular input–output using modular extracellular
sensors," Nature Chemical Biology, vol. 13, p. 202, 12/12/online 2016.
[293] L. Scheller, T. Strittmatter, D. Fuchs, D. Bojar, and M. Fussenegger,
"Generalized extracellular molecule sensor platform for programming
116
cellular behavior," Nature Chemical Biology, vol. 14, pp. 723-729,
2018/07/01 2018.
[294] A. Alassi, M. Benammar, and D. Brett, "Quartz Crystal Microbalance
Electronic Interfacing Systems: A Review," Sensors (Basel), vol. 17,
Dec 5 2017.
[295] T. Do, F. Ho, B. Heidecker, K. Witte, L. Chang, and L. Lerner, "A rapid
method for determining dynamic binding capacity of resins for the
purification of proteins," Protein Expr Purif, vol. 60, pp. 147-50, Aug
2008.
[296] W. Fu, T. F. van Dijkman, L. M. C. Lima, F. Jiang, G. F. Schneider, and
E. Bouwman, "Ultrasensitive Ethene Detector Based on a Graphene–
Copper(I) Hybrid Material," Nano Letters, vol. 17, pp. 7980-7988,
2017/12/13 2017.
[297] H. R. Gwon and S. H. Lee, "Spectral and Angular Responses of Surface
Plasmon Resonance Based on the Kretschmann Prism Configuration,"
MATERIALS TRANSACTIONS, vol. 51, pp. 1150-1155, 2010.
[298] B. Liedberg, C. Nylander, and I. Lunström, "Surface plasmon resonance
for gas detection and biosensing," Sensors and Actuators, vol. 4, pp.
299-304, 1983/01/01/ 1983.
[299] V. K. Kodali, J. Scrimgeour, S. Kim, J. H. Hankinson, K. M. Carroll,
W. A. de Heer, et al., "Nonperturbative Chemical Modification of
Graphene for Protein Micropatterning," Langmuir, vol. 27, pp. 863-865,
2011/02/01 2011.
[300] M. Larisika, C. Kotlowski, C. Steininger, R. Mastrogiacomo, P. Pelosi,
S. Schütz, et al., "Electronic Olfactory Sensor Based on A. mellifera
Odorant-Binding Protein 14 on a Reduced Graphene Oxide Field-Effect
Transistor," Angew Chem Int Ed Engl, vol. 54, pp. 13245-8, Nov 2
2015.
[301] K. Park, J. M. Lee, Y. Jung, T. Habtemariam, A. W. Salah, C. D.
Fermin, et al., "Combination of cysteine- and oligomerization domain-
mediated protein immobilization on a surface plasmon resonance (SPR)
gold chip surface," Analyst, vol. 136, pp. 2506-11, Jun 21 2011.
[302] E. Pensa, E. Cortés, G. Corthey, P. Carro, C. Vericat, M. H. Fonticelli,
et al., "The Chemistry of the Sulfur–Gold Interface: In Search of a
Unified Model," Accounts of Chemical Research, vol. 45, pp. 1183-
1192, 2012/08/21 2012.
[303] R. L. Petersen, "Strategies Using Bio-Layer Interferometry Biosensor
Technology for Vaccine Research and Development," Biosensors
(Basel), vol. 7, Oct 31 2017.
[304] A. Sultana and J. E. Lee, "Measuring protein-protein and protein-nucleic
Acid interactions by biolayer interferometry," Curr Protoc Protein Sci,
vol. 79, pp. 19.25.1-19.25.26, Feb 2 2015.
[305] S. K. Vashist, "Comparison of 1-Ethyl-3-(3-Dimethylaminopropyl)
Carbodiimide Based Strategies to Crosslink Antibodies on Amine-
Functionalized Platforms for Immunodiagnostic Applications,"
Diagnostics (Basel), vol. 2, pp. 23-33, Aug 27 2012.
[306] S. K. Vashist, C. K. Dixit, B. D. MacCraith, and R. O'Kennedy, "Effect
of antibody immobilization strategies on the analytical performance of a
surface plasmon resonance-based immunoassay," Analyst, vol. 136, pp.
4431-4436, 2011.

117
[307] J. E. Contreras-Naranjo and O. Aguilar, "Suppressing Non-Specific
Binding of Proteins onto Electrode Surfaces in the Development of
Electrochemical Immunosensors," Biosensors (Basel), vol. 9, Jan 18
2019.
[308] A. Jain and K. Cheng, "The principles and applications of avidin-based
nanoparticles in drug delivery and diagnosis," Journal of Controlled
Release, vol. 245, pp. 27-40, 2017/01/10/ 2017.
[309] E. M. Muñoz, H. Yu, J. Hallock, R. E. Edens, and R. J. Linhardt,
"Poly(ethylene glycol)-based biosensor chip to study heparin-protein
interactions," Anal Biochem, vol. 343, pp. 176-8, Aug 1 2005.
[310] T. Pasinszki, M. Krebsz, T. T. Tung, and D. Losic, "Carbon
Nanomaterial Based Biosensors for Non-Invasive Detection of Cancer
and Disease Biomarkers for Clinical Diagnosis," Sensors, vol. 17, p.
1919, 2017.
[311] P. P. Vachali, B. Li, A. Bartschi, and P. S. Bernstein, "Surface plasmon
resonance (SPR)-based biosensor technology for the quantitative
characterization of protein-carotenoid interactions," Arch Biochem
Biophys, vol. 572, pp. 66-72, Apr 15 2015.
[312] J. Visentin, L. Couzi, C. Dromer, M. Neau-Cransac, G. Guidicelli, V.
Veniard, et al., "Overcoming non-specific binding to measure the active
concentration and kinetics of serum anti-HLA antibodies by surface
plasmon resonance," Biosens Bioelectron, vol. 117, pp. 191-200, Oct 15
2018.
[313] S. M. Foord, T. I. Bonner, R. R. Neubig, E. M. Rosser, J.-P. Pin, A. P.
Davenport, et al., "International Union of Pharmacology. XLVI. G
Protein-Coupled Receptor List," Pharmacological Reviews, vol. 57, pp.
279-288, 2005.
[314] T. K. Attwood and J. B. C. Findlay, "Fingerprinting G-protein-coupled
receptors," Protein Engineering, Design and Selection, vol. 7, pp. 195-
203, 1994.
[315] C. A. de March, S.-K. Kim, S. Antonczak, W. A. Goddard, 3rd, and J.
Golebiowski, "G protein-coupled odorant receptors: From sequence to
structure," Protein science : a publication of the Protein Society, vol.
24, pp. 1543-1548, 2015.
[316] T. K. Bjarnadóttir, D. E. Gloriam, S. H. Hellstrand, H. Kristiansson, R.
Fredriksson, and H. B. Schiöth, "Comprehensive repertoire and
phylogenetic analysis of the G protein-coupled receptors in human and
mouse," Genomics, vol. 88, pp. 263-273, 2006/09/01/ 2006.
[317] C. Munk, E. Mutt, V. Isberg, L. F. Nikolajsen, J. M. Bibbe, T. Flock, et
al., "An online resource for GPCR structure determination and
analysis," Nature Methods, vol. 16, pp. 151-162, 2019/02/01 2019.
[318] W. Wang, Y. Qiao, and Z. Li, "New Insights into Modes of GPCR
Activation," Trends in Pharmacological Sciences, vol. 39, pp. 367-386,
2018/04/01/ 2018.
[319] W. I. Weis and B. K. Kobilka, "The Molecular Basis of G Protein–
Coupled Receptor Activation," Annual Review of Biochemistry, vol. 87,
pp. 897-919, 2018.
[320] A. Manglik and A. C. Kruse, "Structural Basis for G Protein-Coupled
Receptor Activation," Biochemistry, vol. 56, pp. 5628-5634, 2017/10/24
2017.

118
[321] V. Syrovatkina, K. O. Alegre, R. Dey, and X.-Y. Huang, "Regulation,
Signaling, and Physiological Functions of G-Proteins," Journal of
molecular biology, vol. 428, pp. 3850-3868, 2016.
[322] K. Araki and K. Nagata, "Protein Folding and Quality Control in the
ER," Cold Spring Harbor Perspectives in Biology, vol. 3, November 1,
2011 2011.
[323] I. Braakman and D. N. Hebert, "Protein folding in the endoplasmic
reticulum," Cold Spring Harbor perspectives in biology, vol. 5, pp.
a013201-a013201, 2013.
[324] C. Dong, C. M. Filipeanu, M. T. Duvernay, and G. Wu, "Regulation of
G protein-coupled receptor export trafficking," Biochimica et
Biophysica Acta (BBA) - Biomembranes, vol. 1768, pp. 853-870,
2007/04/01/ 2007.
[325] Y.-X. Tao and P. M. Conn, "Chaperoning G Protein-Coupled Receptors:
From Cell Biology to Therapeutics," Endocrine Reviews, vol. 35, pp.
602-647, 2014.
[326] S. Génier, J. Degrandmaison, P. Moreau, P. Labrecque, T. E. Hébert,
and J.-L. Parent, "Regulation of GPCR expression through an
interaction with CCT7, a subunit of the CCT/TRiC complex,"
Molecular Biology of the Cell, vol. 27, pp. 3800-3812, 2016.
[327] M. Reth, "Antigen receptor tail clue," Nature, vol. 338, pp. 383-384,
1989/03/01 1989.
[328] Q. Liu, C. Wu, H. Cai, N. Hu, J. Zhou, and P. Wang, "Cell-Based
Biosensors and Their Application in Biomedicine," Chemical Reviews,
vol. 114, pp. 6423-6461, 2014/06/25 2014.
[329] J. P. Kao, A. T. Harootunian, and R. Y. Tsien, "Photochemically
generated cytosolic calcium pulses and their detection by fluo-3,"
Journal of Biological Chemistry, vol. 264, pp. 8179-8184, May 15, 1989
1989.
[330] A. Minta, J. P. Kao, and R. Y. Tsien, "Fluorescent indicators for
cytosolic calcium based on rhodamine and fluorescein chromophores,"
Journal of Biological Chemistry, vol. 264, pp. 8171-8178, May 15, 1989
1989.
[331] K. R. Gee, K. A. Brown, W. N. U. Chen, J. Bishop-Stewart, D. Gray,
and I. Johnson, "Chemical and physiological characterization of fluo-4
Ca2+-indicator dyes," Cell Calcium, vol. 27, pp. 97-106, 2000/02/01/
2000.
[332] M. Mues, I. Bartholomäus, T. Thestrup, O. Griesbeck, H. Wekerle, N.
Kawakami, et al., "Real-time in vivo analysis of T cell activation in the
central nervous system using a genetically encoded calcium indicator,"
Nature Medicine, vol. 19, p. 778, 05/12/online 2013.
[333] J. Au - Caers, K. Au - Peymen, N. Au - Suetens, L. Au - Temmerman,
T. Au - Janssen, L. Au - Schoofs, et al., "Characterization of G Protein-
coupled Receptors by a Fluorescence-based Calcium Mobilization
Assay," JoVE, p. e51516, 2014/07/28/ 2014.
[334] H. Sheth, C. Gorey, N. Roush, S. Smallman, E. Collantes, M. Santoro,
et al., "A Multiplexed Fluorescent Calcium and NFAT Reporter Gene
Assay to Identify GPCR Agonists," Current chemical genomics and
translational medicine, vol. 7, pp. 1-8, 2013.

119
[335] H. Khalaf, J. Jass, and P.-E. Olsson, "The role of calcium, NF-κB and
NFAT in the regulation of CXCL8 and IL-6 expression in Jurkat T-
cells," International journal of biochemistry and molecular biology, vol.
4, pp. 150-156, 2013.
[336] James W. Putney, "Calcium Signaling: Deciphering the
Calcium–NFAT Pathway," Current Biology, vol. 22, pp. R87-
R89, 2012.
[337] W. G. Fisher, P.-C. Yang, R. K. Medikonduri, and M. S. Jafri, "NFAT
and NFkappaB activation in T lymphocytes: a model of differential
activation of gene expression," Annals of biomedical engineering, vol.
34, pp. 1712-1728, 2006.
[338] E. Hooijberg, A. Q. Bakker, J. J. Ruizendaal, and H. Spits, "NFAT-
controlled expression of GFP permits visualization and isolation of
antigen-stimulated primary human T cells," Blood, vol. 96, pp. 459-466,
2000.
[339] W. Zhang, T. Takahara, T. Achiha, H. Shibata, and M. Maki,
"Nanoluciferase Reporter Gene System Directed by Tandemly Repeated
Pseudo-Palindromic NFAT-Response Elements Facilitates Analysis of
Biological Endpoint Effects of Cellular Ca2+ Mobilization,"
International Journal of Molecular Sciences, vol. 19, p. 605, 2018.
[340] J. Yang, G. Hu, S.-W. Wang, Y. Li, R. Martin, K. Li, et al.,
"Calcineurin/Nuclear Factors of Activated T Cells (NFAT)-activating
and Immunoreceptor Tyrosine-based Activation Motif (ITAM)-
containing Protein (CNAIP), a Novel ITAM-containing Protein That
Activates the Calcineurin/NFAT-signaling Pathway," Journal of
Biological Chemistry, vol. 278, pp. 16797-16801, May 9, 2003 2003.
[341] A. Rinne and L. A. Blatter, "TECHNIQUES FOR PHYSIOLOGY: A
fluorescence-based assay to monitor transcriptional activity of NFAT in
living cells," The Journal of Physiology, vol. 588, pp. 3211-3216, 2010.
[342] A. Adeniran, M. Sherer, and K. E. J. Tyo, "Yeast-based biosensors:
design and applications," FEMS Yeast Research, vol. 15, pp. 1-15, 2015.
[343] N. Ostrov, M. Jimenez, S. Billerbeck, J. Brisbois, J. Matragrano, A.
Ager, et al., "A modular yeast biosensor for low-cost point-of-care
pathogen detection," Science Advances, vol. 3, p. e1603221, 2017.
[344] B. R. Conklin, E. C. Hsiao, S. Claeysen, A. Dumuis, S. Srinivasan, J. R.
Forsayeth, et al., "Engineering GPCR signaling pathways with
RASSLs," Nature Methods, vol. 5, p. 673, 07/30/online 2008.
[345] Lei S. Qi, Matthew H. Larson, Luke A. Gilbert, Jennifer A. Doudna,
Jonathan S. Weissman, Adam P. Arkin, et al., "Repurposing CRISPR as
an RNA-Guided Platform for Sequence-Specific Control of Gene
Expression," Cell, vol. 152, pp. 1173-1183, 2013.
[346] A. G. Recchia, A. M. Musti, M. Lanzino, M. L. Panno, E. Turano, R.
Zumpano, et al., "A cross-talk between the androgen receptor and the
epidermal growth factor receptor leads to p38MAPK-dependent
activation of mTOR and cyclinD1 expression in prostate and lung
cancer cells," The International Journal of Biochemistry & Cell Biology,
vol. 41, pp. 603-614, 2009/03/01/ 2009.
[347] F. Hao, Q. Xu, Y. Zhao, J. V. Stevens, S. H. Young, J. Sinnett-Smith, et
al., "Insulin Receptor and GPCR Crosstalk Stimulates YAP via PI3K

120
and PKD in Pancreatic Cancer Cells," Molecular Cancer Research, vol.
15, pp. 929-941, 2017.
[348] T. A. Baeumler, A. A. Ahmed, and T. A. Fulga, "Engineering Synthetic
Signaling Pathways with Programmable dCas9-Based Chimeric
Receptors," Cell Reports, vol. 20, pp. 2639-2653, 2017.
[349] C. Kiel, E. Yus, and L. Serrano, "Engineering Signal Transduction
Pathways," Cell, vol. 140, pp. 33-47, 2010/01/08/ 2010.
[350] W. A. Lim, "Designing customized cell signalling circuits," Nature
reviews. Molecular cell biology, vol. 11, pp. 393-403, 2010.
[351] Kole T. Roybal, Levi J. Rupp, L. Morsut, Whitney J. Walker, Krista A.
McNally, Jason S. Park, et al., "Precision Tumor Recognition by T Cells
With Combinatorial Antigen-Sensing Circuits," Cell, vol. 164, pp. 770-
779, 2016.
[352] V. Singh, "Recent advances and opportunities in synthetic logic gates
engineering in living cells," Systems and synthetic biology, vol. 8, pp.
271-282, 2014.
[353] M. A. Dwyer and H. W. Hellinga, "Periplasmic binding proteins: a
versatile superfamily for protein engineering," Current Opinion in
Structural Biology, vol. 14, pp. 495-504, 2004/08/01/ 2004.
[354] P. Jayaraman, M. B. Holowko, J. W. Yeoh, S. Lim, and C. L. Poh,
"Repurposing a Two-Component System-Based Biosensor for the
Killing of Vibrio cholerae," ACS Synth Biol, vol. 6, pp. 1403-1415, Jul
21 2017.
[355] A. Kumari, P. Pasini, S. K. Deo, D. Flomenhoft, H. Shashidhar, and S.
Daunert, "Biosensing systems for the detection of bacterial quorum
signaling molecules," Anal Chem, vol. 78, pp. 7603-9, Nov 15 2006.
[356] N. Mao, A. Cubillos-Ruiz, D. E. Cameron, and J. J. Collins, "Probiotic
strains detect and suppress cholera in mice," Science Translational
Medicine, vol. 10, p. eaao2586, 2018.
[357] J. Marvin, E. Schreiter, I. Echevarria, and L. Looger, "A genetically
encoded, high-signal-to-noise maltose sensor," Proteins, vol. 79, pp.
3025-36, 11/01 2011.
[358] K. Papenfort and B. L. Bassler, "Quorum sensing signal-response
systems in Gram-negative bacteria," Nat Rev Microbiol, vol. 14, pp.
576-88, Aug 11 2016.
[359] D. B. Pedrolli, N. V. Ribeiro, P. N. Squizato, V. N. de Jesus, and D. A.
Cozetto, "Engineering Microbial Living Therapeutics: The Synthetic
Biology Toolbox," Trends Biotechnol, vol. 37, pp. 100-115, Jan 2019.
[360] N. Vyas, M. Vyas, and F. Quiocho, "Sugar and signal-transducer
binding sites of the Escherichia coli galactose chemoreceptor protein,"
Science, vol. 242, pp. 1290-1295, 1988.
[361] C. P. Zschiedrich, V. Keidel, and H. Szurmant, "Molecular Mechanisms
of Two-Component Signal Transduction," J Mol Biol, vol. 428, pp.
3752-75, Sep 25 2016.
[362] N. Dahmen, H. L. Wang, and F. L. Margolis, "Expression of olfactory
receptors in Xenopus oocytes," J Neurochem, vol. 58, pp. 1176-9, Mar
1992.
[363] C. Flegel, F. Vogel, A. Hofreuter, B. S. P. Schreiner, S. Osthold, S.
Veitinger, et al., "Characterization of the Olfactory Receptors Expressed

121
in Human Spermatozoa," Frontiers in molecular biosciences, vol. 2, pp.
73-73, 2016.
[364] V. Singh, N. R. Murphy, V. Balasubramanian, and J. D. Mainland,
"Competitive binding predicts nonlinear responses of olfactory receptors
to complex mixtures," Proceedings of the National Academy of
Sciences, vol. 116, pp. 9598-9603, 2019.
[365] C. Trimmer, L. L. Snyder, and J. D. Mainland, "High-throughput
analysis of mammalian olfactory receptors: measurement of receptor
activation via luciferase activity," J Vis Exp, Jun 2 2014.
[366] A. L. Brown, B. E. Johnson, and M. B. Goodman, "Patch clamp
recording of ion channels expressed in Xenopus oocytes," Journal of
visualized experiments : JoVE, p. 936, 2008.
[367] G. Zhang and J. Cui, "Patch-Clamp and Perfusion Techniques to Study
Ion Channels Expressed in Xenopus Oocytes," Cold Spring Harbor
protocols, vol. 2018, pp. pdb.prot099051-pdb.prot099051, 2018.
[368] V. de Lorenzo, "Recombinant bacteria for environmental release: what
went wrong and what we have learnt from it," Clinical Microbiology
and Infection, vol. 15, pp. 63-65, 2009/01/01/ 2009.
[369] T. V. Plavec and A. Berlec, "Safety Aspects of Genetically Modified
Lactic Acid Bacteria," Microorganisms, vol. 8, p. 297, 2020.
[370] S. Feins, W. Kong, E. F. Williams, M. C. Milone, and J. A. Fraietta,
"An introduction to chimeric antigen receptor (CAR) T-cell
immunotherapy for human cancer," American Journal of Hematology,
vol. 94, pp. S3-S9, 2019.
[371] M.-R. Benmebarek, C. H. Karches, B. L. Cadilha, S. Lesch, S. Endres,
and S. Kobold, "Killing Mechanisms of Chimeric Antigen Receptor
(CAR) T Cells," International Journal of Molecular Sciences, vol. 20, p.
1283, 2019.
[372] H. J. Jackson, S. Rafiq, and R. J. Brentjens, "Driving CAR T-cells
forward," Nature Reviews Clinical Oncology, vol. 13, p. 370,
03/22/online 2016.
[373] S. J. C. van der Stegen, M. Hamieh, and M. Sadelain, "The
pharmacology of second-generation chimeric antigen receptors," Nature
reviews. Drug discovery, vol. 14, pp. 499-509, 2015.
[374] A. D. Fesnak, C. H. June, and B. L. Levine, "Engineered T cells: the
promise and challenges of cancer immunotherapy," Nature Reviews
Cancer, vol. 16, p. 566, 08/23/online 2016.
[375] K. W. Wucherpfennig, E. Gagnon, M. J. Call, E. S. Huseby, and M. E.
Call, "Structural Biology of the T-cell Receptor: Insights into Receptor
Assembly, Ligand Recognition, and Initiation of Signaling," Cold
Spring Harbor Perspectives in Biology, vol. 2, April 1, 2010 2010.
[376] G. Gross, T. Waks, and Z. Eshhar, "Expression of immunoglobulin-T-
cell receptor chimeric molecules as functional receptors with antibody-
type specificity," Proceedings of the National Academy of Sciences, vol.
86, pp. 10024-10028, 1989.
[377] J. Goverman, S. M. Gomez, K. D. Segesman, T. Hunkapiller, W. E.
Laug, and L. Hood, "Chimeric immunoglobulin-T cell receptor proteins
form functional receptors: Implications for T cell receptor complex
formation and activation," Cell, vol. 60, pp. 929-939, 1990.

122
[378] Z. Eshhar, T. Waks, G. Gross, and D. G. Schindler, "Specific activation
and targeting of cytotoxic lymphocytes through chimeric single chains
consisting of antibody-binding domains and the gamma or zeta subunits
of the immunoglobulin and T-cell receptors," Proceedings of the
National Academy of Sciences, vol. 90, pp. 720-724, 1993.
[379] T. Brocker, A. Peter, A. Traunecker, and K. Karjalainen, "New
simplified molecular design for functional T cell receptor," European
Journal of Immunology, vol. 23, pp. 1435-1439, 1993.
[380] E. J. Cheadle, D. G. Rothwell, J. S. Bridgeman, V. E. Sheard, R. E.
Hawkins, and D. E. Gilham, "Ligation of the CD2 co-stimulatory
receptor enhances IL-2 production from first-generation chimeric
antigen receptor T cells," Gene Therapy, vol. 19, p. 1114, 12/01/online
2011.
[381] C. Carpenito, M. C. Milone, R. Hassan, J. C. Simonet, M. Lakhal, M.
M. Suhoski, et al., "Control of large, established tumor xenografts with
genetically retargeted human T cells containing CD28 and CD137
domains," Proceedings of the National Academy of Sciences, vol. 106,
pp. 3360-3365, 2009.
[382] M. T. Stephan, V. Ponomarev, R. J. Brentjens, A. H. Chang, K. V.
Dobrenkov, G. Heller, et al., "T cell–encoded CD80 and 4-1BBL induce
auto- and transcostimulation, resulting in potent tumor rejection,"
Nature Medicine, vol. 13, p. 1440, 11/18/online 2007.
[383] M. Martinez and E. K. Moon, "CAR T Cells for Solid Tumors: New
Strategies for Finding, Infiltrating, and Surviving in the Tumor
Microenvironment," Frontiers in Immunology, vol. 10, 2019-February-
05 2019.
[384] P. A. Baeuerle, J. Ding, E. Patel, N. Thorausch, H. Horton, J. Gierut, et
al., "Synthetic TRuC receptors engaging the complete T cell receptor for
potent anti-tumor response," Nature Communications, vol. 10, p. 2087,
2019/05/07 2019.
[385] D. Pettitt, Z. Arshad, J. Smith, T. Stanic, G. Holländer, and D. Brindley,
"CAR-T Cells: A Systematic Review and Mixed Methods Analysis of
the Clinical Trial Landscape," Molecular Therapy, vol. 26, pp. 342-353,
2018.
[386] Z. Zhao, Y. Chen, N. M. Francisco, Y. Zhang, and M. Wu, "The
application of CAR-T cell therapy in hematological malignancies:
advantages and challenges," Acta Pharmaceutica Sinica B, vol. 8, pp.
539-551, 2018/07/01/ 2018.
[387] P.-P. Zheng, J. M. Kros, and J. Li, "Approved CAR T cell therapies: ice
bucket challenges on glaring safety risks and long-term impacts," Drug
Discovery Today, vol. 23, pp. 1175-1182, 2018/06/01/ 2018.
[388] K. Newick, S. O'Brien, E. Moon, and S. M. Albelda, "CAR T Cell
Therapy for Solid Tumors," Annual Review of Medicine, vol. 68, pp.
139-152, 2017.
[389] C. E. Brown and C. L. Mackall, "CAR T cell therapy: inroads to
response and resistance," Nature Reviews Immunology, vol. 19, pp. 73-
74, 2019/02/01 2019.
[390] C. H. June and M. Sadelain, "Chimeric Antigen Receptor Therapy,"
New England Journal of Medicine, vol. 379, pp. 64-73, 2018.

123
[391] E. J. M. Grigor, D. A. Fergusson, F. Haggar, N. Kekre, H. Atkins, R.
Shorr, et al., "Efficacy and safety of chimeric antigen receptor T-cell
(CAR-T) therapy in patients with haematological and solid
malignancies: protocol for a systematic review and meta-analysis," BMJ
Open, vol. 7, p. e019321, 2017.
[392] R. Müller, J. Wienands, and M. Reth, "The serine and threonine residues
in the Ig-α cytoplasmic tail negatively regulate immunoreceptor
tyrosine-based activation motif-mediated signal transduction,"
Proceedings of the National Academy of Sciences, vol. 97, pp. 8451-
8454, 2000.
[393] L. Matsuuchi, M. R. Gold, A. Travis, R. Grosschedl, A. L. DeFranco,
and R. B. Kelly, "The membrane IgM-associated proteins MB-1 and Ig-
beta are sufficient to promote surface expression of a partially functional
B-cell antigen receptor in a nonlymphoid cell line," Proc Natl Acad Sci
U S A, vol. 89, pp. 3404-8, Apr 15 1992.
[394] W. W. A. Schamel and M. Reth, "Monomeric and Oligomeric
Complexes of the B Cell Antigen Receptor," Immunity, vol. 13, pp. 5-
14, 2000/07/01/ 2000.
[395] T. L. Stevens, J. H. Blum, S. P. Foy, L. Matsuuchi, and A. L. DeFranco,
"A mutation of the mu transmembrane that disrupts endoplasmic
reticulum retention. Effects on association with accessory proteins and
signal transduction," The Journal of Immunology, vol. 152, pp. 4397-
4406, 1994.
[396] F. W. Alt, E. M. Oltz, F. Young, J. Gorman, G. Taccioli, and J. Chen,
"<em>VDJ</em> recombination," Immunology Today, vol. 13, pp. 306-
314, 1992.
[397] J. Mizuguchi, W. Tsang, S. L. Morrison, M. A. Beaven, and W. E. Paul,
"Membrane IgM, IgD, and IgG act as signal transmission molecules in a
series of B lymphomas," The Journal of Immunology, vol. 137, pp.
2162-2167, 1986.
[398] M. L. Thomas, "Of ITAMs and ITIMs: turning on and off the B cell
antigen receptor," The Journal of experimental medicine, vol. 181, pp.
1953-1956, 1995.
[399] S. Tonegawa, "Somatic generation of antibody diversity," Nature, vol.
302, pp. 575-581, 1983/04/01 1983.
[400] G. M. Siegers, J. Yang, C. U. Duerr, P. J. Nielsen, M. Reth, and W. W.
A. Schamel, "Identification of disulfide bonds in the Ig-α/Ig-β
component of the B cell antigen receptor using the Drosophila S2 cell
reconstitution system," International Immunology, vol. 18, pp. 1385-
1396, 2006.
[401] T. Nakamura, M. C. Sekar, H. Kubagawa, and M. D. Cooper, "Signal
transduction in human B cells initiated via Igβ ligation," International
Immunology, vol. 5, pp. 1309-1315, 1993.
[402] R. M. Young and L. M. Staudt, "Targeting pathological B cell receptor
signalling in lymphoid malignancies," Nature Reviews Drug Discovery,
vol. 12, pp. 229-243, 2013/03/01 2013.
[403] M. Sanchez, Z. Misulovin, A. L. Burkhardt, S. Mahajan, T. Costa, R.
Franke, et al., "Signal transduction by immunoglobulin is mediated
through Ig alpha and Ig beta," The Journal of experimental medicine,
vol. 178, pp. 1049-1055, 1993.

124
[404] S. A. Grupp, K. Campbell, R. N. Mitchell, J. C. Cambier, and A. K.
Abbas, "Signaling-defective mutants of the B lymphocyte antigen
receptor fail to associate with Ig-alpha and Ig-beta/gamma," Journal of
Biological Chemistry, vol. 268, pp. 25776-9, December 5, 1993 1993.
[405] R. N. Mitchell, A. C. Shaw, Y. K. Weaver, P. Leder, and A. K. Abbas,
"Cytoplasmic tail deletion converts membrane immunoglobulin to a
phosphatidylinositol-linked form lacking signaling and efficient antigen
internalization functions," Journal of Biological Chemistry, vol. 266, pp.
8856-8860, May 15, 1991 1991.
[406] M. D. Cooper, "The early history of B cells," Nature Reviews
Immunology, vol. 15, p. 191, 02/06/online 2015.
[407] M. Ho, S. Nagata, and I. Pastan, "Isolation of anti-CD22 Fv with high
affinity by Fv display on human cells," Proceedings of the National
Academy of Sciences of the United States of America, vol. 103, pp.
9637-9642, 2006.
[408] Z. Eshhar, G. Gross, T. Waks, J. Lustgarten, N. Bach, A. Ratner, et al.,
"T-Bodies: Chimeric T-Cell Receptors with Antibody-Type
Specificity," Methods, vol. 8, pp. 133-142, 1995/10/01/ 1995.
[409] R. N. Mitchell, A. C. Shaw, Y. K. Weaver, P. Leder, and A. K. Abbas,
"Cytoplasmic tail deletion converts membrane immunoglobulin to a
phosphatidylinositol-linked form lacking signaling and efficient antigen
internalization functions," J Biol Chem, vol. 266, pp. 8856-60, May 15
1991.
[410] P. J. Thul, L. Åkesson, M. Wiking, D. Mahdessian, A. Geladaki, H. Ait
Blal, et al., "A subcellular map of the human proteome," Science, vol.
356, p. eaal3321, 2017.
[411] J. M. Dal Porto, S. B. Gauld, K. T. Merrell, D. Mills, A. E. Pugh-
Bernard, and J. Cambier, "B cell antigen receptor signaling 101,"
Molecular Immunology, vol. 41, pp. 599-613, 2004/07/01/ 2004.
[412] B. J. Burbach, R. B. Medeiros, K. L. Mueller, and Y. Shimizu, "T-cell
receptor signaling to integrins," Immunological Reviews, vol. 218, pp.
65-81, 2007.
[413] K. Fracchia, C. Pai, and C. Walsh, "Modulation of T Cell Metabolism
and Function through Calcium Signaling," Frontiers in Immunology,
vol. 4, 2013-October-11 2013.
[414] B. Heizmann, M. Reth, and S. Infantino, "Syk is a dual-specificity
kinase that self-regulates the signal output from the B-cell antigen
receptor," Proceedings of the National Academy of Sciences, vol. 107,
pp. 18563-18568, 2010.
[415] N. Bhalla, P. Jolly, N. Formisano, and P. Estrela, "Introduction to
biosensors," Essays in biochemistry, vol. 60, pp. 1-8, 2016.
[416] J. I. Njagi and S. M. Kagwanja, "The Interface in Biosensing: Improving
Selectivity and Sensitivity," in Interfaces and Interphases in Analytical
Chemistry. vol. 1062, ed: American Chemical Society, 2011, pp. 225-
247.
[417] W. K. Ward, "How to design a biosensor," Journal of diabetes science
and technology, vol. 1, pp. 201-204, 2007.
[418] S. delle Noci, M. Frasconi, G. Favero, M. Tosi, T. Ferri, and F. Mazzei,
"Electrochemical Kinetic Characterization of Redox Mediated Glucose
125
Oxidase Reactions: A Simplified Approach," Electroanalysis, vol. 20,
pp. 163-169, 2008.
[419] R. Tipnis, S. Vaddiraju, F. Jain, D. J. Burgess, and F.
Papadimitrakopoulos, "Layer-by-Layer Assembled Semipermeable
Membrane for Amperometric Glucose Sensors," Journal of Diabetes
Science and Technology, vol. 1, pp. 193-200, 2007.
[420] L. Vial and P. Dumy, "Artificial enzyme-based biosensors," New
Journal of Chemistry, vol. 33, pp. 939-946, 2009.
[421] M. V. Miniaev, M. B. Belyakova, N. V. Kostiuk, D. V. Leshchenko, and
T. A. Fedotova, "Non-obvious Problems in Clark Electrode Application
at Elevated Temperature and Ways of Their Elimination," Journal of
Analytical Methods in Chemistry, vol. 2013, p. 8, 2013.
[422] D. R. Thévenot, K. Toth, R. A. Durst, and G. S. Wilson,
"Electrochemical biosensors: recommended definitions and
classification1International Union of Pure and Applied Chemistry:
Physical Chemistry Division, Commission I.7 (Biophysical Chemistry);
Analytical Chemistry Division, Commission V.5 (Electroanalytical
Chemistry).1," Biosensors and Bioelectronics, vol. 16, pp. 121-131,
2001/01/01/ 2001.
[423] P. Chen, X. Liu, G. Goyal, N. T. Tran, J. C. Shing Ho, Y. Wang, et al.,
"Nanoplasmonic Sensing from the Human Vision Perspective,"
Analytical Chemistry, vol. 90, pp. 4916-4924, 2018/04/03 2018.
[424] M. Sabela, S. Balme, M. Bechelany, J.-M. Janot, and K. Bisetty, "A
Review of Gold and Silver Nanoparticle-Based Colorimetric Sensing
Assays," Advanced Engineering Materials, vol. 19, p. 1700270, 2017.
[425] F. Nasrollahi, Y. R. Koh, P. Chen, J. Varshosaz, A. A. Khodadadi, and
S. Lim, "Targeting graphene quantum dots to epidermal growth factor
receptor for delivery of cisplatin and cellular imaging," Materials
Science and Engineering: C, vol. 94, pp. 247-257, 2019/01/01/ 2019.
[426] L. Yang, H. Mao, Y. A. Wang, Z. Cao, X. Peng, X. Wang, et al.,
"Single Chain Epidermal Growth Factor Receptor Antibody Conjugated
Nanoparticles for in vivo Tumor Targeting and Imaging," Small, vol. 5,
pp. 235-243, 2009.

126
Appendix I
Supplementary information of Chapter Three
Amino Acid Sequence for pOBPM2
M QEPQPEQDPF ELSGKWITSY IGSSDLEKIG ENAPFQVFMR
SIEFDDKESK VYLNFFSKEN GICEEFSLIG TKQEGNTYDV
NYAGNNKWVV SYASETALII SNINVDEEGD KTIMTGLLGK
GTDIEDQDLE KFKEVTRENG IPEENIVNII ERDDCPA
Bold and underlined Tryptophan is Phenylalanine in wild type pOBP.
Green highlights are beta barrel antiparallel strands.
Yellow highlight is the alpha helix in the pOBPM2 tail.
Amino Acid Sequence for pOBPM2Δ121
M QEPQPEQDPF ELSGKWITSY IGSSDLEKIG ENAPFQVFMR
SIEFDDKESK VYLNFFSKEN GICEEFSLIG TKQEGNTYDV
NYAGNNKWVV SYASETALII SNINVDEEGD KTIMTGLLG
Green highlights are beta barrel antiparallel strands.
Amino Acid Sequence for pOBPMM2
M QRASPEQDPF ELSGKFITSY IGSSDLEKIG ENAPFQVFMR
SIEFDDKESK VYLNFFSKEN GICEEFSLIG TKQEGNTYDA
NYAGNNKWVA SYASETALII SNIKVDEEGD KTIMTGLLGK
GTDIEDQDLE KFKEVTRENG IPEENIVNII ERDDCPA
Green highlights are beta barrel antiparallel strands.
Yellow highlight is the alpha helix in the pOBPM2 tail.

127
Amino Acid Sequence for pOBPMM2Δ121
M QEPQPEQDPF ELSGKFITSY IGSSDLEKIG ENAPFQVFMR
SIEFDDKESK VYLNFFSKEN GICEEFSLIG TKQEGNTYDA
NYAGNNKWVA SYASETALII SNIKVDEEGD KTIMTGLLG
Green highlights are beta barrel antiparallel strands.
Formula derivation of model:
[𝑃. 𝐹] ⇋ 𝑃 + 𝐹
Formula derivation of model:
[𝑃. 𝐹] + 𝑂 ⇋ 𝑃 + 𝐹 + 𝑂 ⇋ [𝑃. 𝑂] + 𝐹
𝐾𝐹 =[𝑃][𝐹]
[𝑃.𝐹] 𝐾𝑂 =
[𝑃][𝑂]
[𝑃.𝑂] [𝑃]𝑇𝑜𝑡𝑎𝑙 = [𝑃. 𝐹] + [𝑃. 𝑂] + [𝑃]
𝐾𝐹𝐾𝑂
=
[𝑃][𝐹][𝑃. 𝐹]
[𝑃][𝑂][𝑃. 𝑂]
𝐾𝐹[𝑃. 𝐹][𝑂] = 𝐾𝑂[𝑃. 𝑂][𝐹]
𝐾𝐹[𝑃. 𝐹][𝑂] = 𝐾𝑂{[𝑃]𝑇𝑜𝑡𝑎𝑙 − [𝑃] − [𝑃. 𝐹]}[𝐹]
𝐾𝐹[𝑃. 𝐹][𝑂] = 𝐾𝑂[𝐹][𝑃]𝑇𝑜𝑡𝑎𝑙 − 𝐾𝑂[𝐹][𝑃] − 𝐾𝑂[𝐹][𝑃. 𝐹]
[𝑂]
[𝐾𝑂][𝑃. 𝐹] =
[𝐹]
[𝐾𝐹][𝑃]𝑇𝑜𝑡𝑎𝑙 −
[𝐹]
[𝐾𝐹][𝑃] −
[𝐹]
[𝐾𝐹][𝑃. 𝐹]
𝐾𝐹 =[𝑃][𝐹]
[𝑃.𝐹] [𝑃]𝑇𝑜𝑡𝑎𝑙 = [𝑃. 𝐹] + [𝑃]
𝐾𝐹 ={[𝑃]𝑇𝑜𝑡𝑎𝑙 − [𝑃. 𝐹]}[𝐹]
[𝑃. 𝐹]
𝐾𝐹[𝑃. 𝐹] = [𝐹][𝑃]𝑇𝑜𝑡𝑎𝑙 − [𝐹][𝑃. 𝐹]
𝐾𝐹[𝑃. 𝐹] + [𝐹][𝑃. 𝐹] = [𝐹][𝑃]𝑇𝑜𝑡𝑎𝑙
[𝑃. 𝐹]{𝐾𝐹 + [𝐹]} = [𝐹][𝑃]𝑇𝑜𝑡𝑎𝑙
[𝑃. 𝐹] = [𝑃]𝑇𝑜𝑡𝑎𝑙[𝐹]
𝐾𝐹 + [𝐹]

128
[𝑃. 𝐹] =[𝐹][𝑃]𝑇𝑜𝑡𝑎𝑙
[𝐾𝐹]{[𝑂]
[𝐾𝑂]+ 1} + [𝐹]
[𝑃. 𝐹] =[𝐹][𝑃]𝑇𝑜𝑡𝑎𝑙
[𝐾𝐹]{[𝑂]
[𝐾𝑂]+ 1} + [𝐹]
[𝑃. 𝐹] = [𝑃]𝑇𝑜𝑡𝑎𝑙[𝐹]
[𝐾𝐹] +[𝐾𝐹][𝑂]
[𝐾𝑂]+ [𝐹]
[𝑃. 𝐹] = [𝑃]𝑇𝑜𝑡𝑎𝑙[𝐹]
{[𝐾𝐹] + [𝐹]}{1 +
[𝐾𝐹] [𝐾𝑂]
[𝐾𝐹] + [𝐹][𝑂]}
[𝑃. 𝐹] = [𝑃]𝑇𝑜𝑡𝑎𝑙
[𝐹] [𝐾𝐹] + [𝐹]
{1 +[𝐾𝐹]
[𝐾𝑂]([𝐾𝐹] + [𝐹])[𝑂]}
Fitting into Reciprocal curve:
y =𝐴
1 + 𝐵𝑥
B =[𝐾𝐹]
[𝐾𝑂]([𝐾𝐹] + [𝐹])
[𝐾𝑂] =[𝐾𝐹]
𝐵 ([𝐾𝐹] + [𝐹])
[𝑂]
[𝐾𝑂]=
[𝐹]
[𝐾𝐹][𝑃]𝑇𝑜𝑡𝑎𝑙 − [𝑃. 𝐹] −
[𝐹]
[𝐾𝐹][𝑃. 𝐹]
[𝑂]
[𝐾𝑂][𝑃. 𝐹] =
[𝐹]
[𝐾𝐹][𝑃]𝑇𝑜𝑡𝑎𝑙 −
[𝐹]
[𝐾𝐹][𝑃] −
[𝐹]
[𝐾𝐹][𝑃. 𝐹]
[𝑂]
[𝐾𝑂][𝑃. 𝐹] + [𝑃. 𝐹] +
[𝐹]
[𝐾𝐹][𝑃. 𝐹] =
[𝐹]
[𝐾𝐹][𝑃]𝑇𝑜𝑡𝑎𝑙
{[𝑂]
[𝐾𝑂]+ 1 +
[𝐹]
[𝐾𝐹]}[𝑃. 𝐹] =
[𝐹]
[𝐾𝐹][𝑃]𝑇𝑜𝑡𝑎𝑙
{[𝐾𝐹][𝑂]
[𝐾𝑂]+ [𝐾𝐹] + [𝐹]}[𝑃. 𝐹] = [𝐹][𝑃]𝑇𝑜𝑡𝑎𝑙
[𝑃. 𝐹] =[𝐹][𝑃]𝑇𝑜𝑡𝑎𝑙
{[𝐾𝐹][𝑂]
[𝐾𝑂]+ [𝐾𝐹] + [𝐹]}
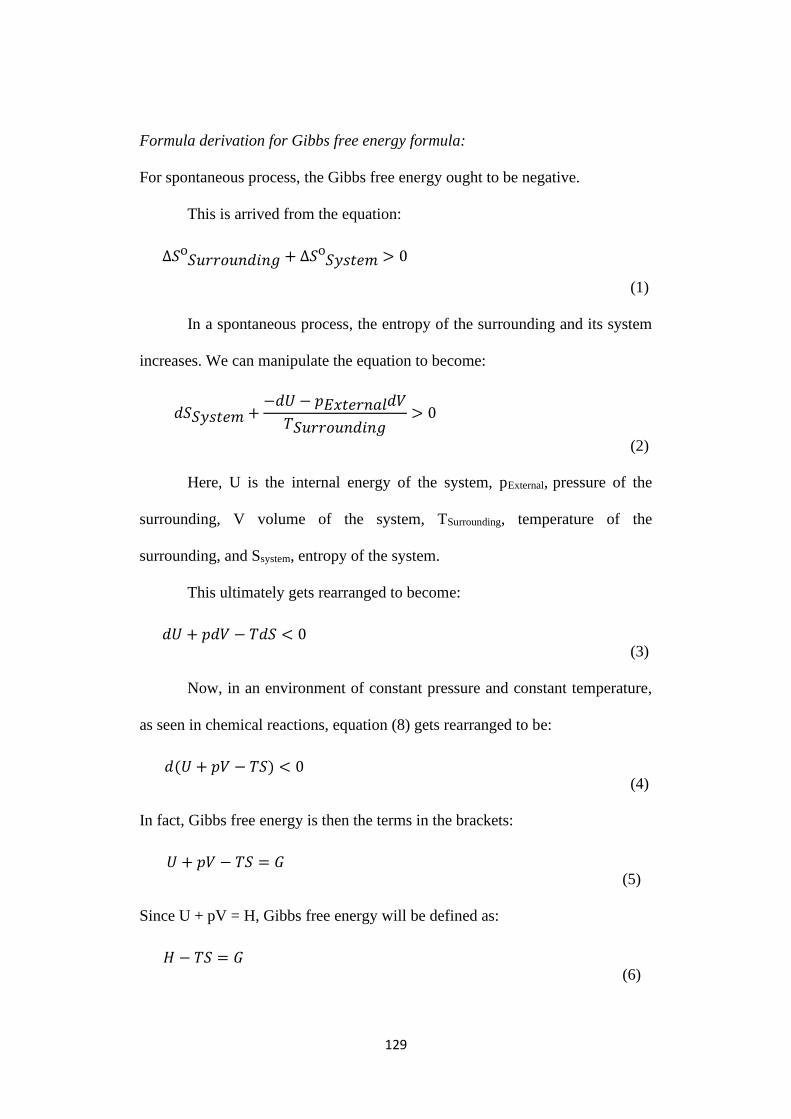
129
Formula derivation for Gibbs free energy formula:
For spontaneous process, the Gibbs free energy ought to be negative.
This is arrived from the equation:
(1)
In a spontaneous process, the entropy of the surrounding and its system
increases. We can manipulate the equation to become:
(2)
Here, U is the internal energy of the system, pExternal, pressure of the
surrounding, V volume of the system, TSurrounding, temperature of the
surrounding, and Ssystem, entropy of the system.
This ultimately gets rearranged to become:
(3)
Now, in an environment of constant pressure and constant temperature,
as seen in chemical reactions, equation (8) gets rearranged to be:
(4)
In fact, Gibbs free energy is then the terms in the brackets:
(5)
Since U + pV = H, Gibbs free energy will be defined as:
(6)
∆𝑆ᴼ𝑆𝑢𝑟𝑟𝑜𝑢𝑛𝑑𝑖𝑛𝑔 + ∆𝑆ᴼ𝑆𝑦𝑠𝑡𝑒𝑚 > 0
𝑑𝑆𝑆𝑦𝑠𝑡𝑒𝑚 +−𝑑𝑈 − 𝑝𝐸𝑥𝑡𝑒𝑟𝑛𝑎𝑙𝑑𝑉
𝑇𝑆𝑢𝑟𝑟𝑜𝑢𝑛𝑑𝑖𝑛𝑔> 0
𝑑𝑈 + 𝑝𝑑𝑉 − 𝑇𝑑𝑆 < 0
𝑑(𝑈 + 𝑝𝑉 − 𝑇𝑆) < 0
𝑈 + 𝑝𝑉 − 𝑇𝑆 = 𝐺
𝐻 − 𝑇𝑆 = 𝐺

130
Appendix II
Supplementary information of Chapter Four
Amino Acid Sequence for EGFP
MVSKGEELFT GVVPILVELD GDVNGHKFSV SGEGEGDATY
GKLTLKFICT TGKLPVPWPT LVTTLTYGVQ CFSRYPDHMK
QHDFFKSAMP EGYVQERTIF FKDDGNYKTR AEVKFEGDTL
VNRIELKGID FKEDGNILGH KLEYNYNSHN VYIMADKQKN
GIKVNFKIRH NIEDGSVQLA DHYQQNTPIG DGPVLLPDNH
YLSTQSALSK DPNEKRDHMV LLEFVTAAGI TLGMDELYK
Amino Acid Sequence for mCherry
MVSKGEEDNM AIIKEFMRFK VHMEGSVNGH EFEIEGEGEG
RPYEGTQTAK LKVTKGGPLP FAWDILSPQF MYGSKAYVKH
PADIPDYLKL SFPEGFKWER VMNFEDGGVV TVTQDSSLQD
GEFIYKVKLR GTNFPSDGPV MQKKTMGWEA SSERMYPEDG
ALKGEIKQRL KLKDGGHYDA EVKTTYKAKK PVQLPGAYNV
NIKLDITSHN EDYTIVEQYE RAEGRHSTGG MDELYK
Amino Acid Sequence for B10 Design One
METDTLLLWV LLLWVPGSTG DHHHHHHMAQ LQLQESGPGL
VKPSQTLSLT CTVSGGSISS GDYYWSWIRQ PPGKGLEWIG
YIYYSGSTNY NPPLKSRVTM SVDTSKNQFS LKLSSVTAAD
TAVYYCARVK IVVGAFDIWG QGTMVTVSSS ASGAELGGGG
SGGGGSGGGG STSEIVMTQS PATLSLSPGE RATLSCRASQ
SVSSYLAWYQ QKPGQAPRLL IYDASNRATG IPARFSGSGS
GTDFTLTISR LEPEDFAVYY CQQYGSSPIT FGQGTRLEIK
RSENEGYYFC SVISNSVMYF SSVVPVLQKV NSTTTKPVLR

131
TPSPVNLWAT ASTFIVLFLL SLFVVTTVTL FRKRWQNEKF
GVDMPDDYED ENLYEGLNLD DCSMYEDISR GLQGTYQDVG
NLHIGDAQLE KP
Amino Acid Sequence for B10 Design Two
METDTLLLWV LLLWVPGSTG DQLQLQESGP GLVKPSQTLS
LTCTVSGGSI SSGDYYWSWI RQPPGKGLEW IGYIYYSGST
NYNPPLKSRV TMSVDTSKNQ FSLKLSSVTA ADTAVYYCAR
VKIVVGAFDI WGQGTMVTVS SSASGAELGG GGSGGGGSGG
GGSTSEIVMT QSPATLSLSP GERATLSCRA SQSVSSYLAW
YQQKPGQAPR LLIYDASNRA TGIPARFSGS GSGTDFTLTI
SRLEPEDFAV YYCQQYGSSP ITFGQGTRLE IKRSSEQKLI
SEEDLENEGY YFCSVISNSV MYFSSVVPVL QKVNSTTTKP
VLRTPSPVNL WATASTFIVL FLLSLFVVTT VTLFRKRWQN
EKFGVDMPDD YEDENLYEGL NLDDCSMYED ISRGLQGTYQ
DVGNLHIGDA QLEKP
Amino Acid Sequence for L21C
METDTLLLWV LLLWVPGSTG DEVKLQQSGA ELVRPEASVK
LSCKTSGYIF TNYWIHWVKQ RSGQGLEWIA RIYPGNGSTY
YNEKFKGKAT LTADKSSSTA YMQLSSLKSE DSAVYFCARS
TSDSSLPYWY FDVWGQGTTV TVSSGGGGSG GGGSGGGGSD
IELTQSPTIL STSPGEKVTV TCRATLGVSY MHWYQQKPGS
SPKPWIYATS NLASGVPARF SGSGSGTSYS LTISRVEAED
AATYYCQQWI SNPPTFGGGT KLEIKRAEQK LISEEDLENE
GYYFCSVISN SVMYFSSVVP VLQKVNSTTT KPVLRTPSPV
NLWATASTFI VLFLLSLFVV TTVTLFRKRW QNEKFGVDMP
DDYEDENLYE GLNLDDCSM YEDISRGLQG TYQDVGNLHI GDAQLEKP
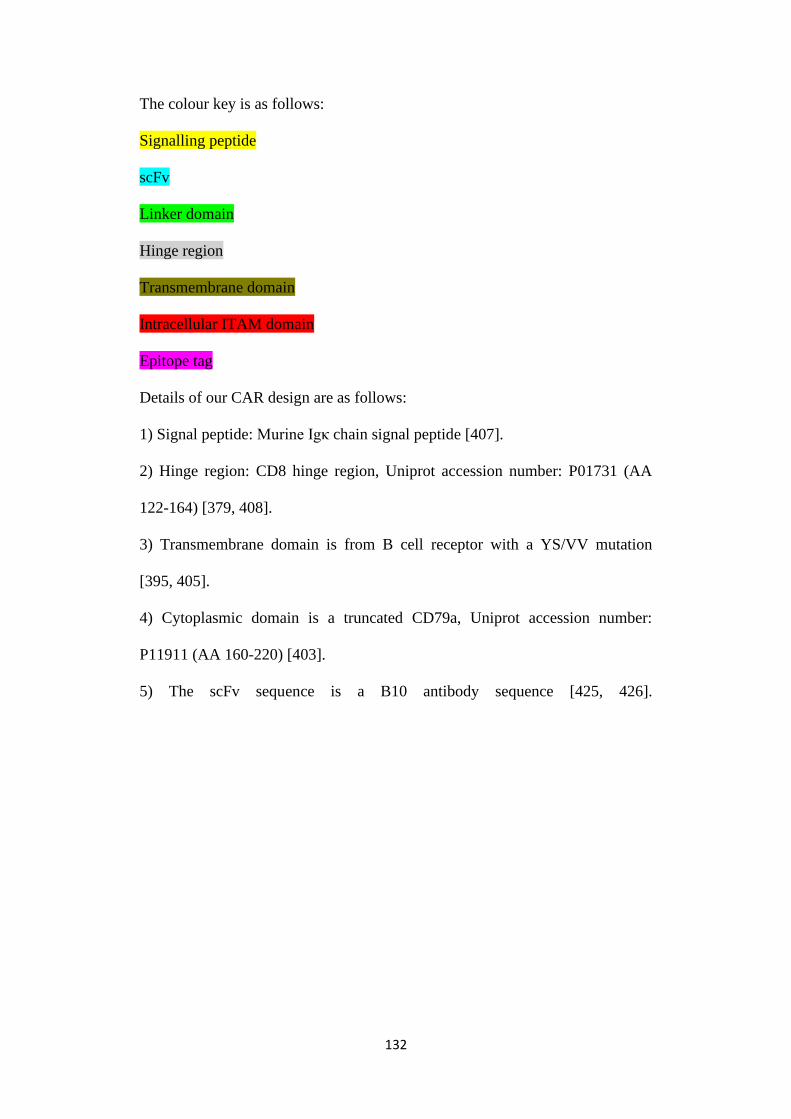
132
The colour key is as follows:
Signalling peptide
scFv
Linker domain
Hinge region
Transmembrane domain
Intracellular ITAM domain
Epitope tag
Details of our CAR design are as follows:
1) Signal peptide: Murine Igκ chain signal peptide [407].
2) Hinge region: CD8 hinge region, Uniprot accession number: P01731 (AA
122-164) [379, 408].
3) Transmembrane domain is from B cell receptor with a YS/VV mutation
[395, 405].
4) Cytoplasmic domain is a truncated CD79a, Uniprot accession number:
P11911 (AA 160-220) [403].
5) The scFv sequence is a B10 antibody sequence [425, 426].

“What I cannot
create, I do not
understand”
– Richard Feynman