assessing drought in agricultural area of central u.s...
TRANSCRIPT
Assessing Drought in Agricultural Area of central U.S.
with the MODIS sensor
Oct 17th, 2012
Di Wu
George Mason University

2
Introduction:
• Drought is one of the major natural hazards which has devastating
effects on environmental, social and economic sectors
• Among many human-related sectors, agriculture is often the first and
most vulnerable sector to be affected by drought events.
• Drought events can reduce productivity of desirable crops. The
variations of precipitation pattern can increase short-run crop failures
and long-run production declines (Nelson et al., 2009). Drought can
also cause death of livestock, increase crop diseases and aggravate
crop growing environment.
3
Introduction:
• Factors affecting agricultural drought:
- climate/ weather (evaporation, precipitation, temperature)
- soil (type, moisture)
- crops (species, stage of growth)
- irrigation
Traditional agricultural drought monitoring
• Agricultural drought can be monitored effectively based on in-situ
meteorological data from weather stations.
• Drought indices aid in agricultural drought detection
(PDSI, SPI, precipitation percentiles…)
• models considers soil AWC, crop water deficiency, irrigation...

4
USDM drought map
• Created in 1999, the weekly USDM (The U.S. Drought Monitor) was a composite index
which combines information from many existing drought indicators, including the PDSI
and the SPI, along with local reports from state climatologists and observers across the
country.
• USDM are using a simple D0-D4 scheme and a percentile ranking methodology to
monitor drought occurrence across the country
http://droughtmonitor.unl.edu/
Introduction:
5
Limitation of current drought monitoring methods
• Traditional drought monitoring is mostly based on meteorological data derived from
weather station which is not adequate for characterization of drought conditions at
regional scale, especially where current networks of weather stations are sparse
• Limited to topographic condition, it is not possible to set up an intensive weather
monitoring network at complex terrain.
• Using interpolation to estimate meteorological variables often produce some uncertainties
• Drought information provided by USDM drought map is at coarse level of spatial detail
which limits drought study at finer scale
Introduction:
6
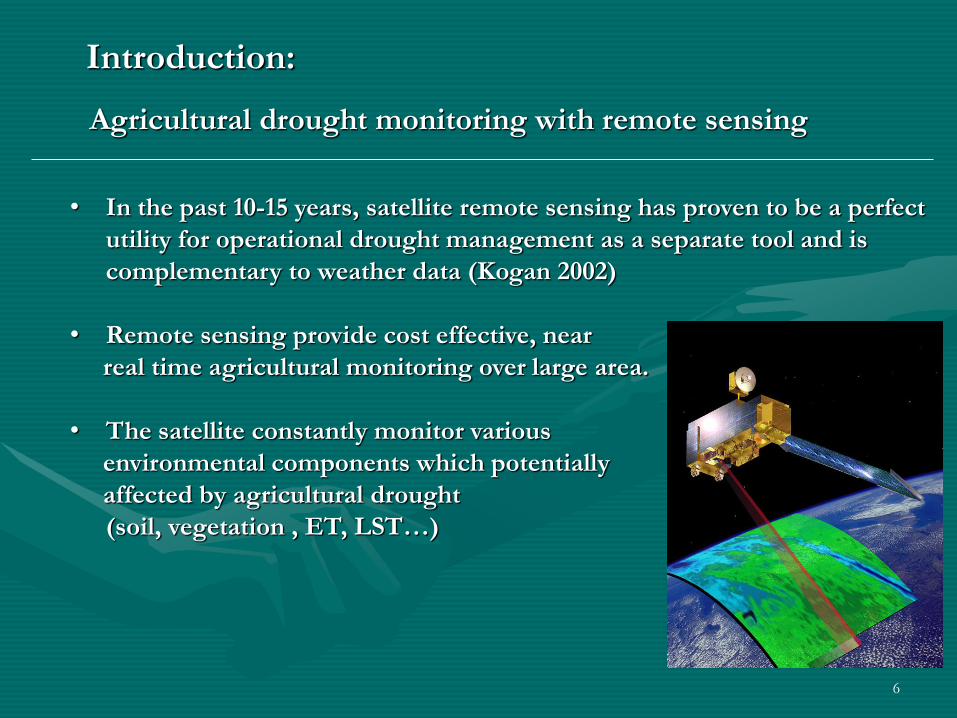
• In the past 10-15 years, satellite remote sensing has proven to be a perfect
utility for operational drought management as a separate tool and is
complementary to weather data (Kogan 2002)
• Remote sensing provide cost effective, near
real time agricultural monitoring over large area.
• The satellite constantly monitor various
environmental components which potentially
affected by agricultural drought
(soil, vegetation , ET, LST…)
Introduction:
Agricultural drought monitoring with remote sensing
7
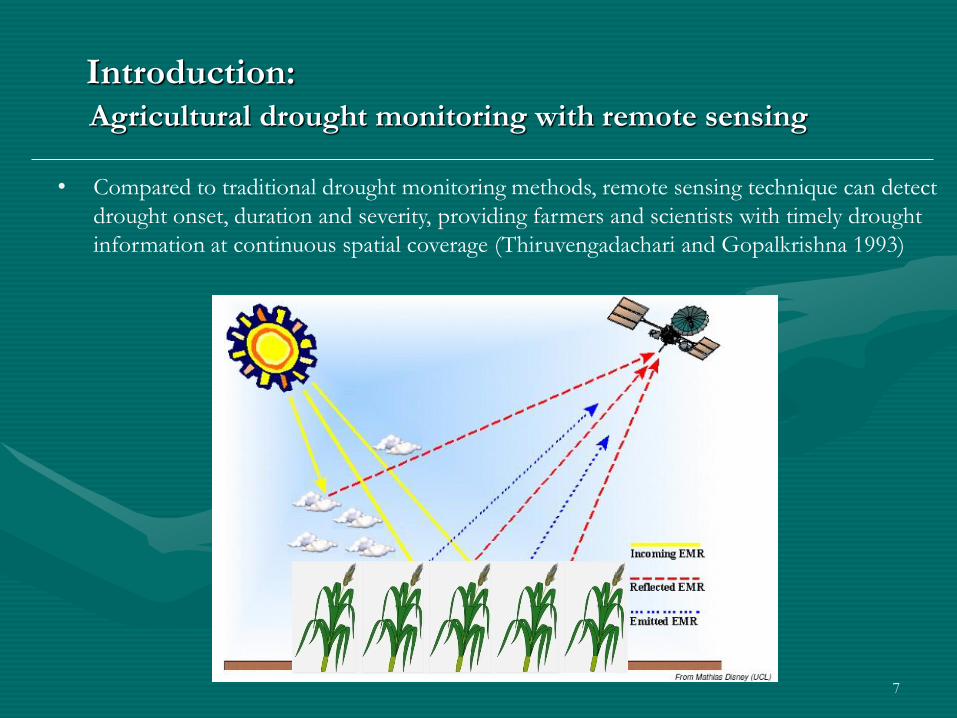
Agricultural drought monitoring with remote sensing
• Compared to traditional drought monitoring methods, remote sensing technique can detect
drought onset, duration and severity, providing farmers and scientists with timely drought
information at continuous spatial coverage (Thiruvengadachari and Gopalkrishna 1993)
Introduction:

8
Different contributions of Remote Sensing for drought monitoring
• Vegetation Status
• Soil moisture
• Temperature
• Evapotranspiration
• Precipitation
Agricultural drought monitoring with remote sensing
Introduction:
9
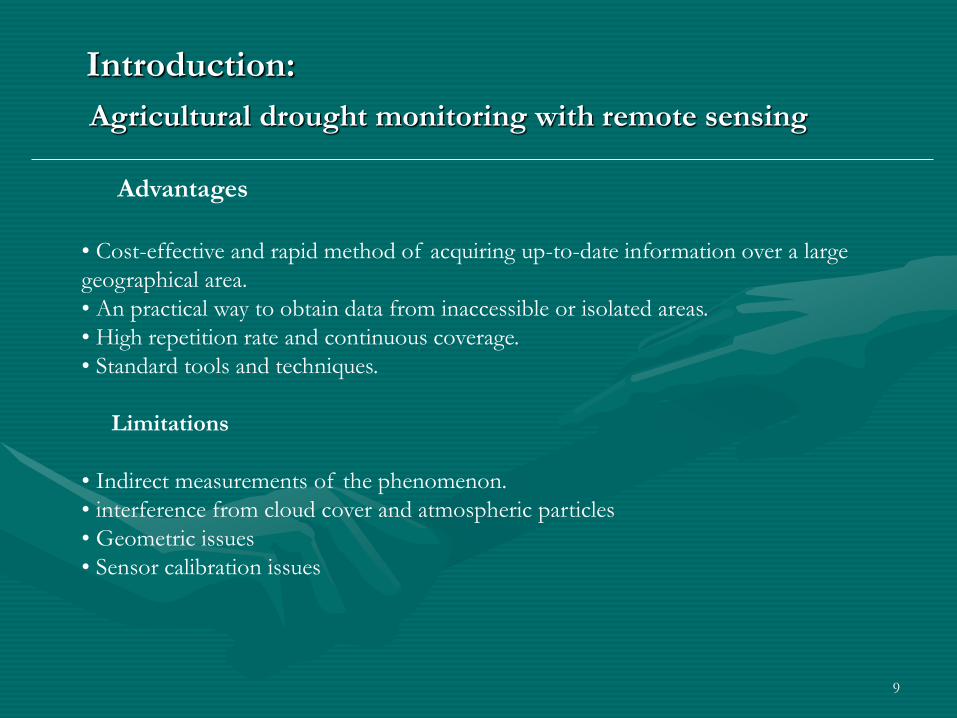
Advantages
• Cost-effective and rapid method of acquiring up-to-date information over a large
geographical area.
• An practical way to obtain data from inaccessible or isolated areas.
• High repetition rate and continuous coverage.
• Standard tools and techniques.
Limitations
• Indirect measurements of the phenomenon.
• interference from cloud cover and atmospheric particles
• Geometric issues
• Sensor calibration issues
Agricultural drought monitoring with remote sensing
Introduction:
10
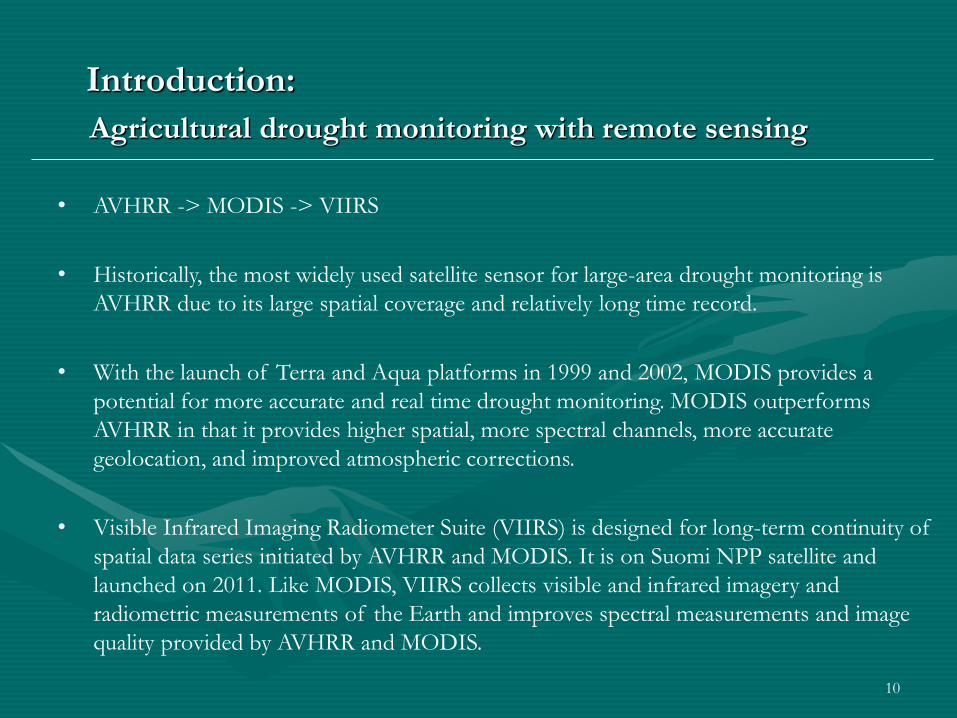
• AVHRR -> MODIS -> VIIRS
• Historically, the most widely used satellite sensor for large-area drought monitoring is
AVHRR due to its large spatial coverage and relatively long time record.
• With the launch of Terra and Aqua platforms in 1999 and 2002, MODIS provides a
potential for more accurate and real time drought monitoring. MODIS outperforms
AVHRR in that it provides higher spatial, more spectral channels, more accurate
geolocation, and improved atmospheric corrections.
• Visible Infrared Imaging Radiometer Suite (VIIRS) is designed for long-term continuity of
spatial data series initiated by AVHRR and MODIS. It is on Suomi NPP satellite and
launched on 2011. Like MODIS, VIIRS collects visible and infrared imagery and
radiometric measurements of the Earth and improves spectral measurements and image
quality provided by AVHRR and MODIS.
Agricultural drought monitoring with remote sensing
Introduction:
11
12
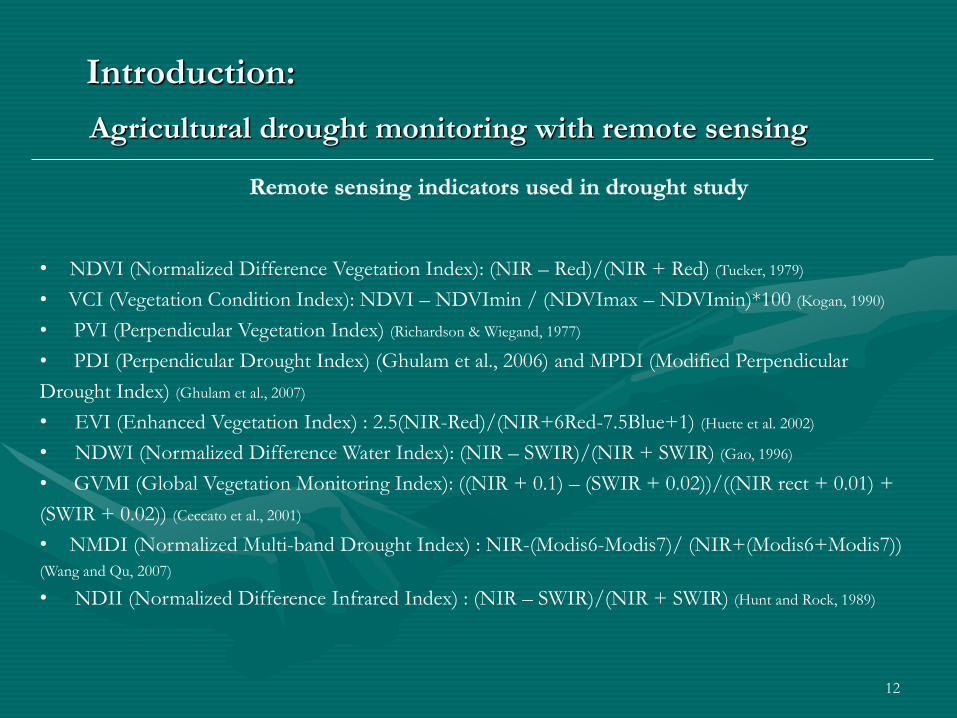
• NDVI (Normalized Difference Vegetation Index): (NIR – Red)/(NIR + Red) (Tucker, 1979)
• VCI (Vegetation Condition Index): NDVI – NDVImin / (NDVImax – NDVImin)*100 (Kogan, 1990)
• PVI (Perpendicular Vegetation Index) (Richardson & Wiegand, 1977)
• PDI (Perpendicular Drought Index) (Ghulam et al., 2006) and MPDI (Modified Perpendicular
Drought Index) (Ghulam et al., 2007)
• EVI (Enhanced Vegetation Index) : 2.5(NIR-Red)/(NIR+6Red-7.5Blue+1) (Huete et al. 2002)
• NDWI (Normalized Difference Water Index): (NIR – SWIR)/(NIR + SWIR) (Gao, 1996)
• GVMI (Global Vegetation Monitoring Index): ((NIR + 0.1) – (SWIR + 0.02))/((NIR rect + 0.01) +
(SWIR + 0.02)) (Ceccato et al., 2001)
• NMDI (Normalized Multi-band Drought Index) : NIR-(Modis6-Modis7)/ (NIR+(Modis6+Modis7))
(Wang and Qu, 2007)
• NDII (Normalized Difference Infrared Index) : (NIR – SWIR)/(NIR + SWIR) (Hunt and Rock, 1989)
Agricultural drought monitoring with remote sensing
Introduction:
13
Agricultural Drought assessment with MODIS
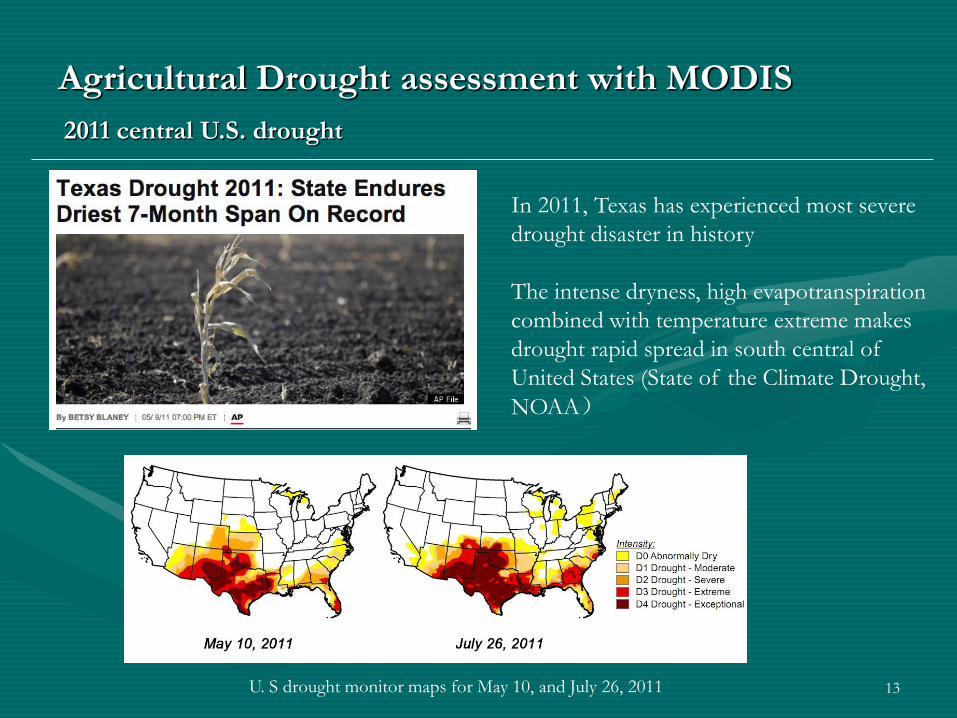
U. S drought monitor maps for May 10, and July 26, 2011
2011 central U.S. drought
In 2011, Texas has experienced most severe
drought disaster in history
The intense dryness, high evapotranspiration
combined with temperature extreme makes
drought rapid spread in south central of
United States (State of the Climate Drought,
NOAA)
14
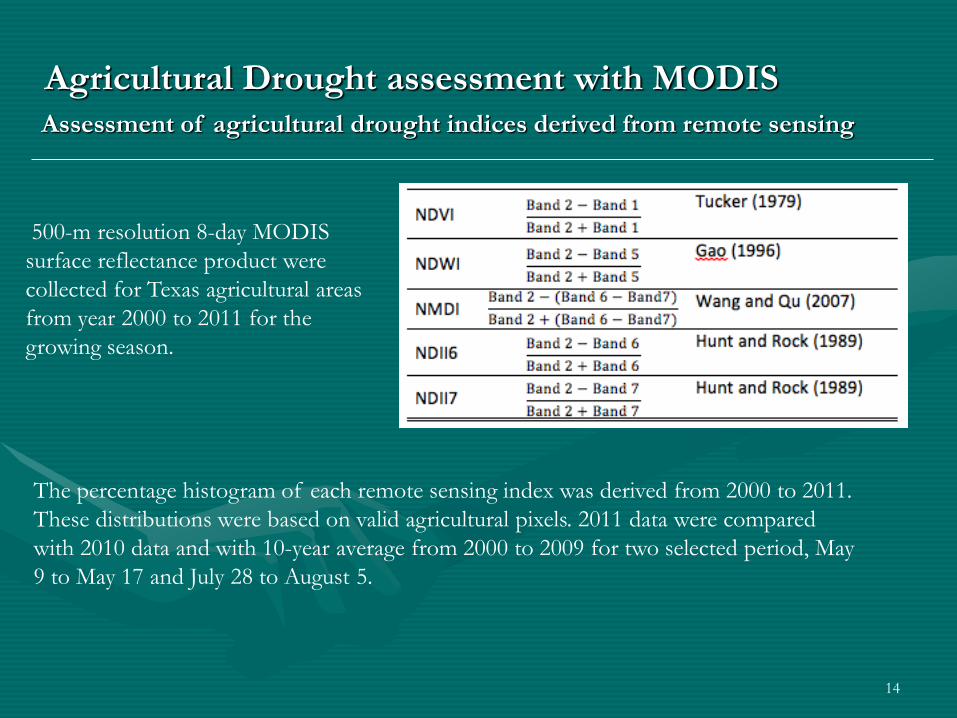
500-m resolution 8-day MODIS
surface reflectance product were
collected for Texas agricultural areas
from year 2000 to 2011 for the
growing season.
The percentage histogram of each remote sensing index was derived from 2000 to 2011.
These distributions were based on valid agricultural pixels. 2011 data were compared
with 2010 data and with 10-year average from 2000 to 2009 for two selected period, May
9 to May 17 and July 28 to August 5.
Assessment of agricultural drought indices derived from remote sensing
Agricultural Drought assessment with MODIS

15
The dotted and solid black lines
are the percentage histogram of
2011 and 2010 data, respectively
and histogram of 2000-2009
mean is presented in red line.
Compared with 2010 and 10-year
mean, 2011 indices variable has
significant left shift. The shift
amplitude was directly related to
sensitivity of indices to drought
events.
Percentage histogram, during May 9 and May 17 for 2000-2009 mean, 2010 and 2011
Percentage histogram, during July28 and August 5 for 2000-2009 mean, 2010 and 2011
16
• An indicator with a larger shift provides a better discrimination between drought
and non-drought situations.
• As shown in the figure, for Texas, agricultural area, NDVI, NDII6 and NDII7
have larger statistical dispersion than NDWI and NMDI which is indicative of
stronger capability of these three indices to detect drought.
Agricultural Drought assessment with MODIS
17
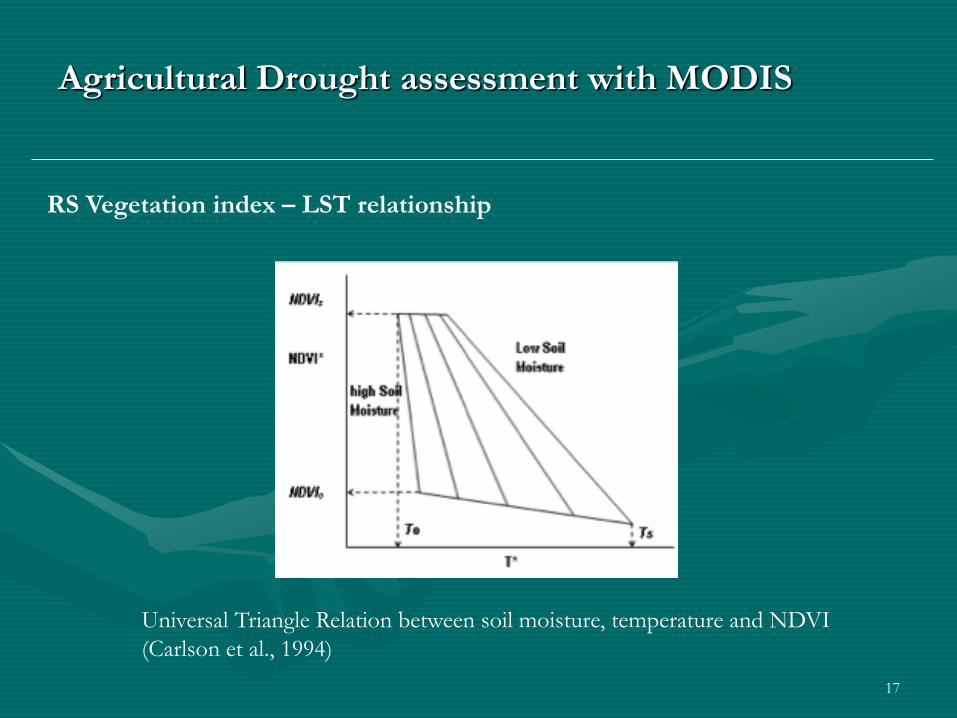
RS Vegetation index – LST relationship
Universal Triangle Relation between soil moisture, temperature and NDVI
(Carlson et al., 1994)
Agricultural Drought assessment with MODIS
18
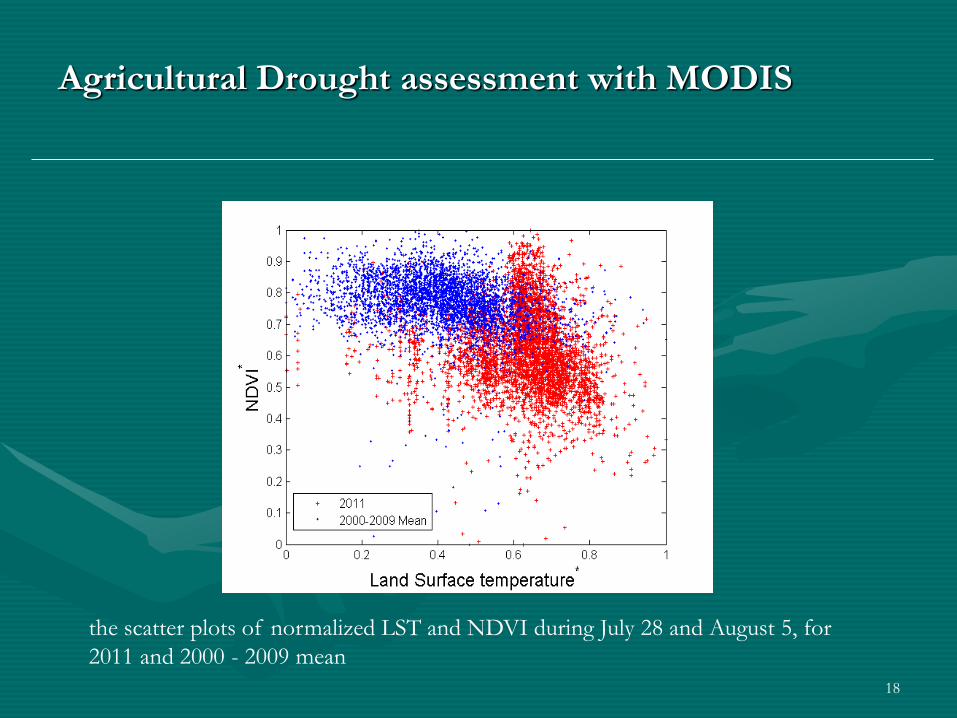
the scatter plots of normalized LST and NDVI during July 28 and August 5, for
2011 and 2000 - 2009 mean
Agricultural Drought assessment with MODIS
19
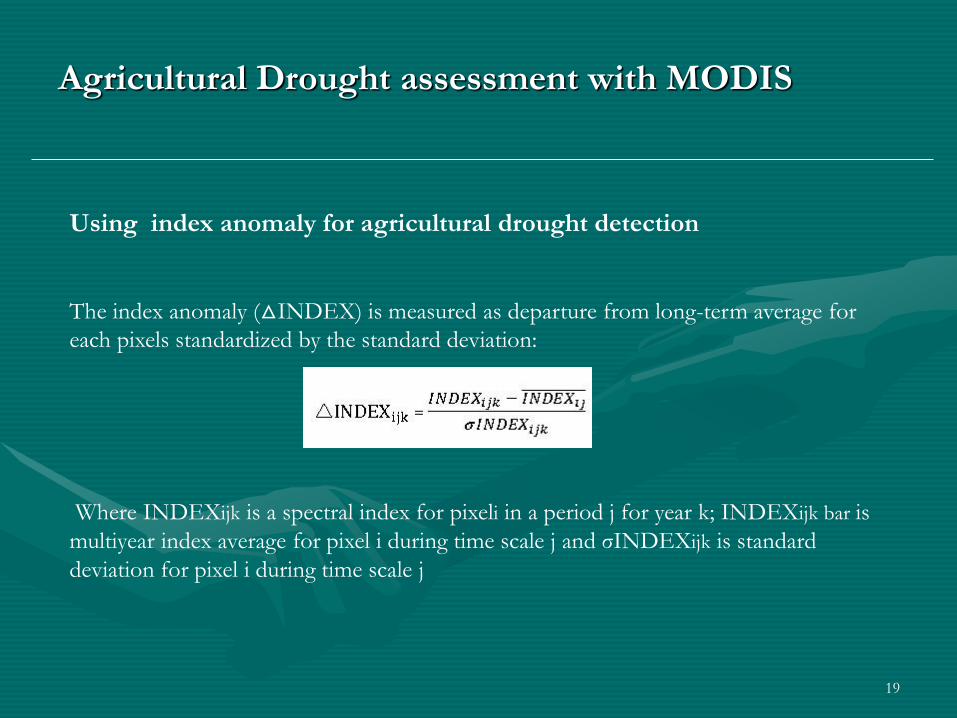
Using index anomaly for agricultural drought detection
The index anomaly (△INDEX) is measured as departure from long-term average for
each pixels standardized by the standard deviation:
Where INDEXijk is a spectral index for pixeli in a period j for year k; INDEXijk bar is
multiyear index average for pixel i during time scale j and σINDEXijk is standard
deviation for pixel i during time scale j
Agricultural Drought assessment with MODIS
20
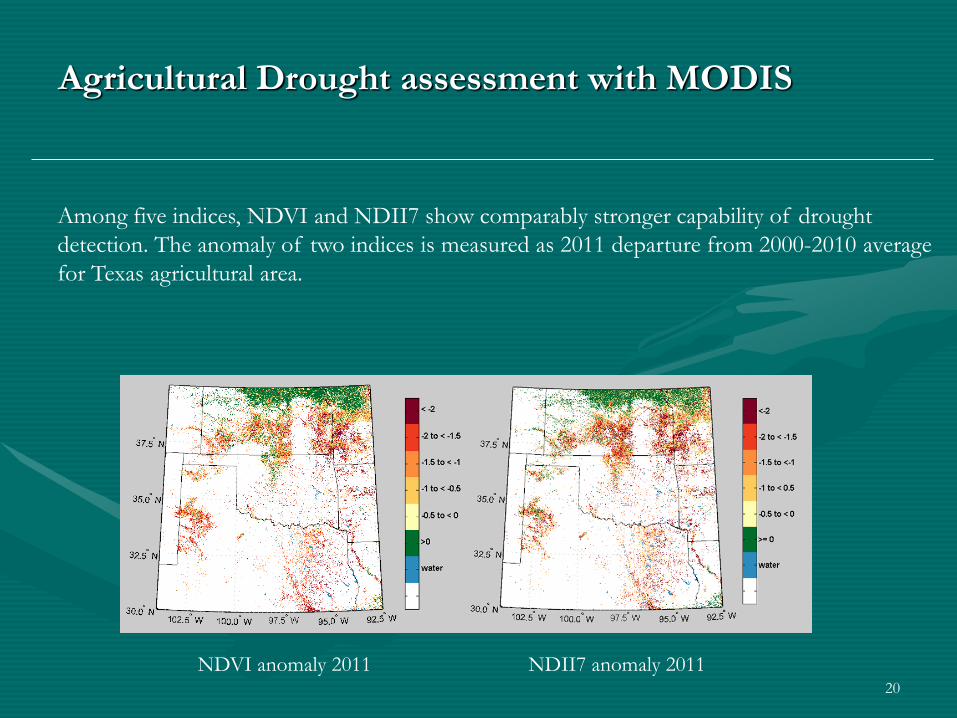
Among five indices, NDVI and NDII7 show comparably stronger capability of drought
detection. The anomaly of two indices is measured as 2011 departure from 2000-2010 average
for Texas agricultural area.
NDVI anomaly 2011 NDII7 anomaly 2011
Agricultural Drought assessment with MODIS

21
• Large part of drought region could be
captured on anomaly drought maps.
• Some regions show discrepancies in
drought distribution between anomaly
map and USDM map.
• Moderate drought pattern in Kansas is
exaggerated in anomaly maps
NDVI anomaly 2011
NDVI anomaly 2011 NDII7 anomaly 2011
USDM drought map
July 26, 2011
22
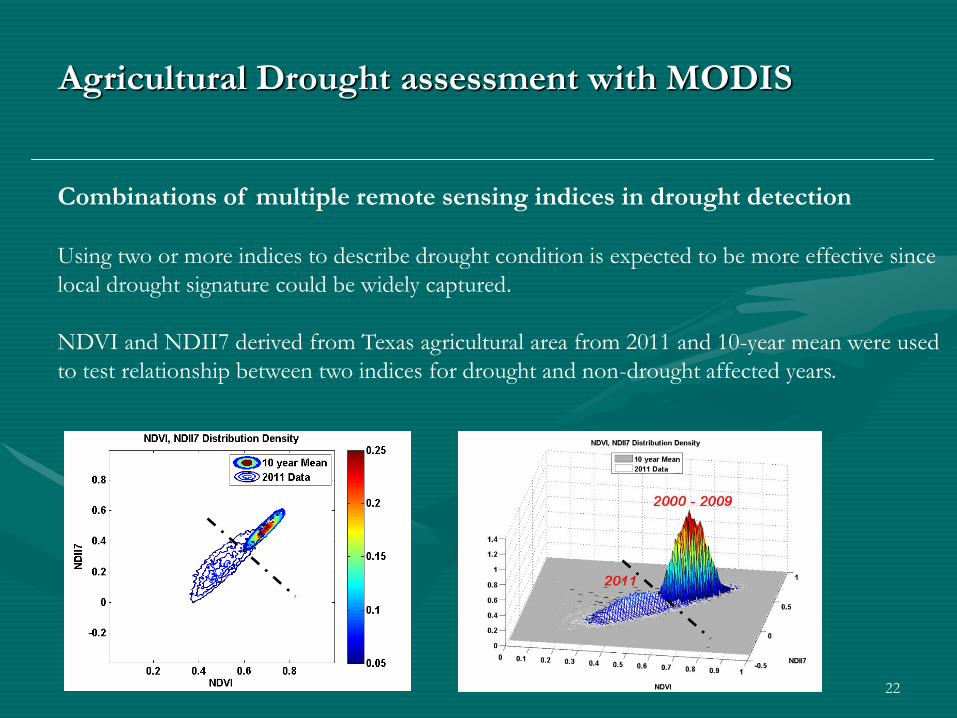
Combinations of multiple remote sensing indices in drought detection
Using two or more indices to describe drought condition is expected to be more effective since
local drought signature could be widely captured.
NDVI and NDII7 derived from Texas agricultural area from 2011 and 10-year mean were used
to test relationship between two indices for drought and non-drought affected years.
Agricultural Drought assessment with MODIS
23
Summary :
This study explores the use of remote sensing in agricultural drought monitoring for
central U.S.
1) For Texas agricultural area, NDVI, NDII6 and NDII7 shows comparably stronger
capability of drought detection.
1) Central U.S. Agricultural drought pattern can be captured by index anomaly map while
discrepancies exist between index anomaly map and USDM map
2) Vegetation index - LST relationship
1) The potential of using multiple drought indices for agricultural drought study.

24
Thank You!