assessing future rainfall projections using multiple gcms and a
TRANSCRIPT

Journal of Hydrology 488 (2013) 84–100
Contents lists available at SciVerse ScienceDirect
Journal of Hydrology
journal homepage: www.elsevier .com/locate / jhydrol
Assessing future rainfall projections using multiple GCMs and a multi-sitestochastic downscaling model
R. Mehrotra a,⇑, Ashish Sharma a, D. Nagesh Kumar b, T.V. Reshmidevi b
a Water Research Centre, School of Civil and Env. Engineering, UNSW, 2052 Sydney, Australiab Water Resources and Environmental Engineering, Department of Civil Engineering, Indian Institute of Science, Bangalore 560 012, India
a r t i c l e i n f o s u m m a r y
Article history:Received 27 March 2012Received in revised form 6 November 2012Accepted 23 February 2013Available online 6 March 2013This manuscript was handled byKonstantine P. Georgakakos, Editor-in-Chief,with the assistance of Ana P. Barros,Associate Editor
Keywords:Climate changeDaily rainfallStatistical downscalingMultiple GCMsMalaprabha catchmentModified Markov model
0022-1694/$ - see front matter Crown Copyright � 2http://dx.doi.org/10.1016/j.jhydrol.2013.02.046
⇑ Corresponding author. Tel.: +61 293855140; fax:E-mail addresses: [email protected] (R.
edu.au (A. Sharma), [email protected] (D. Nageiisc.ernet.in (T.V. Reshmidevi).
Impact of global warming on daily rainfall is examined using atmospheric variables from five GeneralCirculation Models (GCMs) and a stochastic downscaling model. Daily rainfall at eleven raingauges overMalaprabha catchment of India and National Center for Environmental Prediction (NCEP) reanalysis dataat grid points over the catchment for a continuous time period 1971–2000 (current climate) are used tocalibrate the downscaling model. The downscaled rainfall simulations obtained using GCM atmosphericvariables corresponding to the IPCC-SRES (Intergovernmental Panel for Climate Change – Special Reporton Emission Scenarios) A2 emission scenario for the same period are used to validate the results.Following this, future downscaled rainfall projections are constructed and examined for two 20 year timeslices viz. 2055 (i.e. 2046–2065) and 2090 (i.e. 2081–2100). The model results show reasonable skill insimulating the rainfall over the study region for the current climate. The downscaled rainfall projectionsindicate no significant changes in the rainfall regime in this catchment in the future. More specifically, 2%decrease by 2055 and 5% decrease by 2090 in monsoon (JJAS) rainfall compared to the current climate(1971–2000) under global warming conditions are noticed. Also, pre-monsoon (JFMAM) and post-monsoon (OND) rainfall is projected to increase respectively, by 2% in 2055 and 6% in 2090 and, 2% in2055 and 12% in 2090, over the region. On annual basis slight decreases of 1% and 2% are noted for2055 and 2090, respectively.
Crown Copyright � 2013 Published by Elsevier B.V. All rights reserved.
1. Introduction
The climate of India is dominated by monsoon and about75–90% of the annual rainfall is received during four monsoonmonths, June–September. The Indian monsoon is one of the mostdominant circulation systems and plays an important role in thegeneral circulation of the atmosphere through the transport of heatand moisture from the tropics. More importantly, monsoon hasgreat importance for the agrarian economy of India (Gadgil et al.,1999; Gadgil and Gadgil, 2006). Therefore, it is essential tounderstand the nature of climate change over regional India andits influence on different sectors like agriculture, human health,water resources, forestry, etc.
Several recent studies have focused on the possible influence ofclimate change on the Asian summer monsoon (Meehl andArblaster, 2003; May, 2002; Solomon et al., 2007; Turner et al.,2007; Ashrit et al., 2003). Using a doubled CO2 experiment dataof the HadCM3 coupled model, Turner et al. (2007) observed
013 Published by Elsevier B.V. All
+61 293856139.Mehrotra), [email protected] Kumar), reshmidevi@civil.
3.5% increase in the mean summer (JJAS) rainfall over the Indianland surface in the future. These increases mainly confined overnorth India, the southern peninsula and the Bay of Bengal. Usinga transient green-house warming integration with the ECHAM4/OPYC3 CGCM, Hu et al. (2000) noted intensification of the Asiansummer monsoon beyond 2030. Ashrit et al. (2003) used a CNRMocean–atmosphere coupled model driven by changes inconcentrations of greenhouse gases and sulphate aerosols andreported increased rainfall over northwest and far south regionsduring the second half of the 21st century. Krishna Kumar et al.(2011) examined the changes in the summer monsoon over Indiacorresponding to the IPCC-SRES A1B emission scenarios. Threesimulations from a 17-member Perturbed Physics Ensemblegenerated using Hadley Center Coupled Model (HadCM3) for theQUMP project, were used to drive PRECIS (Providing REgionalClimates for Impact Studies). The results suggested 9–16% increasein the summer monsoon precipitation over India in 2080scompared to 1961–1990 period under global warming conditions.The fourth assessment report of the IPCC (2007) suggests nosignificant change in the Indian monsoon rainfall until about2050s and about 8–10% increase towards the end of 21st Century.Also, projected future increase in the monsoon rainfall appears tobe caused by an increase in the total moisture content in the
rights reserved.

R. Mehrotra et al. / Journal of Hydrology 488 (2013) 84–100 85
atmosphere rather than an increase in the strength of monsoon cir-culation (IPCC, 2007; Stephenson et al., 2001). The report also sug-gests of an increase in the variability of monsoon rainfall from thecurrent levels in the future; possibility of the stretching of mon-soon season with an increase in the rainfall during May and Octo-ber. However, the large inter-model differences in the simulationof Indian summer monsoon by the current GCMs and their low skillin representing the present-day Indian summer monsoon climatelead to lesser confidence in these projections. Meehl et al. (2007)examined June, July and August mean rainfall projections overthe Indian region for 2080–2099 using the GCM rainfall projectionsfor A1B emissions scenario and found that the inter-model spreadof projections (noise) was larger than the mean rainfall increase(signal). Similarly, Meehl et al. (2008) reported a shift in seasonal-ity (increasing the pre-monsoon at the expense of rainfall duringsummer if the effects of increasing black carbon and other aerosolforcings are considered. Hence there still remains considerableuncertainty among GCMs in mean projections of Indian monsoonrainfall.
Majority of the studies mentioned above deal with the assess-ment of climate change over India in the continental context, andas such provide very limited information on a local scale. More-over, as GCMs provide only limited representation of topographicalfeatures, for example, the Himalayas in the north and WesternGhats along the west coast of India (Krishna Kumar et al., 2011);they fail to capture the dominant regional distribution of the mon-soon rainfall patterns. Therefore, in order to understand the extentto which water balances in specific catchments will be affected inchanged climate conditions, it is important to study the plausiblechanges in the frequency and magnitude of rainfall with a majorfocus on the regional distribution over localised catchments.
A diverse range of statistical and dynamical downscaling tech-niques have been developed and proposed in the literature totransfer the GCM output from coarse spatial scales to local or re-gional scales. In majority of statistical downscaling approaches, re-sponses (precipitation/temperature) are either directly related topredictors (coarse scale atmospheric and local scale time-laggedvariables), or to a discrete or continuous state, which is modelledas a function of the atmospheric and local scale predictors (Hewit-son and Crane, 1996; Wilby and Wigley, 1997; Hughes et al., 1999;Charles et al., 2004; Stehli9k and Bárdossy, 2002; Mehrotra andSharma, 2005; Vrac and Naveau, 2007).
Till date we have come across only one study that deals withdownscaling of rainfall to a catchment scale (Anandhi et al.,2008) across the Indian subcontinent. In this study, a Support Vec-tor Machine (SVM) based model was used to downscale monthlyrainfall over the Malaprabha catchment using the simulations fromthe third generation Canadian General Circulation Model (CGCM3)for SRES emission scenarios A1B, A2, B1 and COMMIT for the period1971–2100. They reported substantial increase in annual rainfall inthe future for almost all the scenarios considered.
This study attempts to examine the implications of climatechange on the occurrence and distribution of daily rainfall overMalaprabha river catchment, India, which is considered to be a cli-matically sensitive region (Anandhi et al., 2008). A proper assess-ment of probable future rainfall and its temporal and spatialvariability is necessary to study the impact of climate change onhydrology, water resources management, agriculture and floodsover the study region. It may be noted that the statistical down-scaling of multi-site daily rainfall using outputs of multiple GCMsis the first of its kind in India and therefore provides informationuseful to the researchers and professionals working in the waterand agriculture sector.
The remainder of this paper is structured as follows. Section 2presents an overview of downscaling model used in this study to
translate information from GCM to local scale. Section 3 providesa description of the study region, data used and atmospheric pre-dictor variables considered in the study. Section 4 presents the re-sults and Section 5 provides a summary of the results andconclusions drawn from the study.
2. Downscaling model
The daily multi-site rainfall downscaling model (MMM-KDE)as described in Mehrotra and Sharma (2010) is used in thisstudy. The MMM-KDE model has been used recently in manymultisite daily rainfall generation as well as downscaling appli-cations (for example, Mehrotra and Sharma, 2007b, 2010; Frostet al., 2011).
The model operates in two steps, first the simulation of rainfalloccurrences (wet or dry days; a wet day is defined as a day withrainfall P0.3 mm) and simulation of rainfall amounts on the wetdays, thereafter. In the following discussions rainfall occurrenceat a location k and time t is defined as Rot(k) and at the pth timestep before the current as Rot�p(k). The following describe in briefthe rainfall occurrence and amount models, and the procedure thatis used to incorporate the spatial dependence in the occurrenceand amount simulations (Mehrotra and Sharma, 2010).
2.1. Rainfall occurrence downscaling model – MMM
The general structure of a rainfall occurrence downscalingmodel could be expressed as RotðkÞjZtðkÞ, where Zt(k) representsa vector of conditioning variables at a location k and at time tand can include previous time steps states (wet or dry) of rainfallto assign daily or short term persistence (Markovian dependence),atmospheric predictors to include influence of changing climateconditions and other variables to represent specific rainfall char-acteristics. If Zt(k) contains Rot�1(k) only then the model reducesto a simple Markov order one model whereas inclusion of vari-ables representing higher time scale persistence also, would re-duce it to a rainfall generator of Mehrotra and Sharma (2007b).Addition of atmospheric variables in the conditioning vectorforms the Modified Markov Model (MMM) of Mehrotra and Shar-ma (2010).
Ignoring the site notations, the parameters of a stochastic modelexpressing the order one Markovian dependence are defined byPðRot jRot�1Þ with Zt consisting of Rot�1 only. Inclusion of additionalcontinuous predictors Xt in the conditioning vector Zt modifies theorder one conditional dependence as PðRot jRot�1;XtÞ. Expandingthe conditional expression and rearranging the terms leads to thefollowing:
PðRot ¼ 1jRot�1 ¼ i;XtÞ
¼ PðRot ¼ 1;Rot�1 ¼ iÞPðRot�1 ¼ iÞ � f ðXtjRot ¼ 1;Rot�1 ¼ iÞ
f ðXt jRot�1 ¼ iÞ ð1Þ
The first expression on the right of (1) defines the transition prob-abilities PðRot jRot�1Þ of a first order Markov model (representing or-der one dependence) whereas the second expression signifies theeffect of inclusion of predictor set Xt in the conditioning vector Zt.As Xt usually consists of atmospheric variables and may also includethe number of wet days in pre-specified aggregation time periods(as explained later), the second expression can be approximatedas a multivariate normal which, when expanded, leads to thefollowing simplification for PðRotjRot�1;XtÞ:
PðRot ¼ 1jRot�1 ¼ i;XtÞ ¼ P1;i
� f ðXtjRot ¼ 1;Rot�1 ¼ iÞ½f ðXt jRot ¼ 1;Rot�1 ¼ iÞP1;i� þ ½f ðXt Rot ¼ 0;Rot�1 ¼ ij ÞP0;i�
ð2aÞ

¼ p1i
1ffiffiffiffiffiffiffiffiffiffiffiffiffidetðV1;iÞp exp � 1
2 ðXt � l1;iÞV�11;i ðXt � l1;iÞ
0n o
1ffiffiffiffiffiffiffiffiffiffiffiffiffidetðV1;iÞp exp � 1
2 ðXt � l1;iÞV�11;i ðXt � l1;iÞ
0n o
p1i
� �þ 1ffiffiffiffiffiffiffiffiffiffiffiffiffi
detðV0;iÞp exp � 1
2 ðXt � l0;iÞV�10;i ðXt � l0;iÞ
0n o
p0i
� � ð2bÞ
86 R. Mehrotra et al. / Journal of Hydrology 488 (2013) 84–100
where p1i is the baseline transition probability of the first orderMarkov model defined by PðRot ¼ 1jRot�1 ¼ iÞ with p0i being equalto 1 � p1i, l1,i represents the mean vector E(Xt|Rot = 1, Rot�1 = i)and V1,i is the corresponding variance–covariance matrix. Similarly,l0,i and V0,i represent, respectively, the mean vector and thevariance–covariance matrix of X when (Rt�1 = i) and (Rt = 0) anddet() represents the determinant operation.
Under specific instances where the assumption of a multivari-ate normal may not hold true, appropriate data transformation oruse of appropriate distributions such as one described in Mehrotraand Sharma (2010) may be adopted.
In the present application, the vector X consists of variables rep-resenting aggregated wetness over the recent past and the selectedatmospheric variables. Parameters of the MMM are estimated on adaily basis. The aggregated wetness over the recent past, Xrt, is for-mulated as (following Harrold et al., 2003; Sharma and O’Neill,2002; Mehrotra and Sharma, 2010):
Xrt 2 Xrj1 ;t ;Xrj2 ;t ; . . . ;Xrjm ;t� �
; Xrji ;t ¼1ji
Xji
l¼1
Rot�l ð3Þ
where m is the number of such predictors, Rot�l is the rainfall occur-rence on the preceding lth day and Xrji ;t describes how wet it hasbeen over the preceding ji days. The MMM is applied at each sitein isolation and spatially correlated random numbers are used toreproduce the observed spatial dependence across the stations asdiscussed later.
2.2. Downscaling of rainfall amounts – KDE
The rainfall amount downscaling model is based on the kerneldensity estimation (KDE) procedure (Mehrotra and Sharma,2007a,b, 2010). The model simulates rainfall amount for each dayand at each location that the MMM occurrence downscaling modelsimulates as wet. The model is formulated to reproduce the tempo-ral structure of the observed rainfall record in the simulations. On agiven day, the model simulates rainfall at individual stations con-ditional on selected atmospheric variables as well as the previousday’s rainfall. The observed spatial dependence across the stationsis maintained by making use of spatially correlated random num-bers. The use of rainfall amounts on the previous day as a condi-tioning variable imparts a Markov order one dependence to thedownscaled series.
Similar to rainfall occurrences, the rainfall amount at time t andat station (k) is expressed as Rt(k) and the associated conditioningvector as Xt(k). Dropping the site notation, k, the conditional kernelmultivariate probability density for day t, f ðRt jXtÞ for each site isdefined as:
f ðRt jXtÞ ¼XN
i¼1
1
ð2pk2S0Þ1=2 wi exp �ðRt � biÞ2
2k2S0
!ð4Þ
where k is a measure of spread of density around each data point,known as a kernel bandwidth, bi is the conditional mean associatedwith each kernel, expressed as, bi ¼ Ri � ½SXR�T ½SXX ��1f½Xt � Xi�wg andS0 is the measure of spread of the conditional density, estimated in
terms of covariances of R and X series as, S0 ¼ SRR � STXRS�1
XX SXR.Thecovariance of [Rt, Xt] is written as:
Cov ½Rt;Xt � ¼SRR ST
XR
SXR SXX
" #ð5Þ
In Eq. (4), wi is the weight associated with each kernel and rep-resents the contribution of the kernel in forming the conditionalprobability density:
wi ¼exp � 1
2k2 f½Xt � Xi�wgT ½SXX ��1f½Xt � Xi�wg� �
PNj¼1 exp � 1
2k2 f½Xt � Xj�wgT ½SXX ��1f½Xt � Xj�wg� � ð6Þ
The relative influence of each predictor in the conditional prob-ability density is incorporated through w that represents a diago-nal matrix of influence weights (Mehrotra and Sharma, 2007a).These influence weights can be calculated at the parameter estima-tion stage for each day using the observations of the moving win-dow and multiple linear regression as described in Mehrotra andSharma (2007b).
If the underlying probability density is Gaussian, the Gaussianreference bandwidth (Scott, 1992) may provide a reasonable esti-mate of the conditional probability density. However, the assump-tion of Gaussian distribution may not be appropriate for variableshaving skewed distributions, such as rainfall amounts. For thesecases, varying the bandwidth with data points provides better esti-mate of the probability density more specifically at the lowerboundary of the distribution. The local bandwidth, kgt
for eachobservation of Xt and Rt and at the tth data point of a given g seriesis written as:
kgt ¼f ðgtÞ
2ffiffiffiffipp
f 00ðgtÞ2
!1=ðqþ4Þ
Nð�1=ðqþ4ÞÞ ð7Þ
where f ðgtÞ and f 00ðgtÞ respectively, are density and the secondderivative of the density at data point t of the assumed distributionof g series, q is number of predictor variables and N is total numberof observations. Assuming series g to be Gamma distributed, furthersimplification of (7) leads to the following:
kgt ¼1
2ffiffiffiffipp
f ðgtÞ k2 � 2kðg�1Þgtþ ðg�1Þðg�2Þ
g2t
h i2
0B@
1CA
1=ðqþ4Þ
Nð�1=ðqþ4ÞÞ ð8Þ
where k and g, respectively, are scale and shape parameters of theGamma distribution. The derivation of Eq. (8) is discussed inMehrotra and Sharma (2007b).
2.3. Modelling spatial dependences in rainfall occurrence and amounts
As discussed in the previous sections, stochastic downscaling ofrainfall occurrences or amounts is carried out individually at eachlocation. The spatial dependence in the downscaled simulationsover many point locations is incorporated by using uniform ran-dom variates that are independent in time, but exhibit appropriateobserved spatial dependence across the multiple point locations

Fig. 1. Location of the Malaprabha river catchment in Karnataka, India. Raingauge station locations are shown in numbers with details provided in Table 1.
R. Mehrotra et al. / Journal of Hydrology 488 (2013) 84–100 87
considered. For the case of S stations, let ut be a vector of uniform[0,1] variates of length S at time step t. Our aim here is to define thevector ut (� utð1Þ;utð2Þ; . . . utðnsÞ) in such a way that for locations kand l, corr[ut(k), ut+1(l)] = 0 (or, random numbers are independentacross time), but corr[ut(k), ut(l)] – 0 (or, random numbers arecorrelated across space). As a result, there is spatial dependencebetween individual elements of the vector ut, this dependence isused to reproduce the observed spatial dependence across stationsin the downscaled rainfall. More details on this rationale areavailable in Wilks (1998) and Mehrotra et al. (2006).
3. Datasets, study area and variables
This section presents the details on the data, study area and theselection of atmospheric variables.
3.1. Study area
The Malaprabha sub-basin lies in the extreme western part ofthe Krishna basin. It extends between 74�130 and 75�100E
Table 1Details of raingauge stations used in the study.
Index number Station name Station code Elevation (m)
1 Bailhongal TQ Off 30201 6982 Belwadi 30204 6903 MK Hubli 30207 6584 Desur 30304 7505 Zadshapur 30308 6546 Asoga 30702 670.57 Bidi 30703 6648 Gunji 30706 6869 Jamagaon 30707 692
10 Khanapur 30710 66811 Soundatti SF 31003 658.8
longitudes and 15�280 and 15�550N latitude in Belgaum district ofKarnataka (Fig. 1). Malaprabha river originates from the ChorlaGhats (a section of the western Ghats) about 35 km south-westof Belgaum district in Karnataka, at an elevation of 792 m. The totalcatchment area is 2564 km2. Malaprabha is one of the majortributaries of river Krishna (India) and the main source of waterfor irrigation in Belgaum, Dharwad, Bagalkot and Bijapur districtsin Karnataka state. The Malaprabha catchment terrain is flat togently undulating except for a few hillocks and valleys. Thenorthern boundary is the common ridge between Malaprabhaand Ghataprabha river catchments and the eastern ridge isseparated between Malaprabha, Krishna and Tungabhadra rivercatchments. The southern and western boundaries are thecommon ridge between the Malaprabha and catchments of westflowing rivers.
3.2. Rainfall
For this study, a 30-year continuous record (from 1971 to 2000)of daily rainfall at 11 stations is used (Table 1). The climate of the
Latitude (�North) Longitude (�East) Average annual rainfall (mm)
15.82447 74.86911 62815.71575 74.917 45915.71783 74.70297 80915.74128 74.50242 124215.76375 74.49056 117415.62544 74.48325 173615.56539 74.65558 95715.53772 74.49189 147615.55314 74.38194 328515.63717 74.51075 187715.75393 75.132 534

Table 2Identified atmospheric predictorsa on seasonal basis for occurrence and amountdownscaling models.
Season Rainfall occurrences Rainfall amounts
JFMAM (January–May)
N–S gradient of MSLP N–S gradient of GPH at700 h Pa
TD at 700 h Pa MSLPN–S gradient of GPH at700 h Pa
E–W gradient of SPH at850 h Pa
TD at 850 h Pa N–S gradient of SPH at500 h Pa
JJAS (June–September)
N–S gradient of MSLP U-wind at 850 h Pa
E–W gradient of MSLP E–W gradient of MSLPTD at 500 h Pa EPT at 850 h PaTD at 700 h Pa V-wind at 850 h Pa
OND (October–December)
TD at 500 h Pa N–S gradient of SPH at500 h Pa
TD at 850 h Pa SPH at 500 h PaMSLPN–S gradient of TD at850 h Pa
a TD: temperature depression (difference of air and dew-point temperatures),MSLP: mean sea level pressure; GPH: geopotential height; EPT: equivalent potentialtemperature; SPH: specific humidity.
Table 3Observed and model simulated means and standard deviations of average number ofwet days in a year and average annual rainfall over the study area for the currentclimate.
Conditioning variables Number of wetdays
Rainfall in mm
Mean Standarddeviation
Mean Standarddeviation
Observed 81 14 1289 415Atmospheric variables only 83 10 1285 309Atmospheric variables and
previous 90 days wetnessstate
82 11 1282 325
Atmospheric variables andprevious 180 days wetnessstate
83 12 1283 319
Atmospheric variables andprevious 270 days wetnessstate
83 12 1289 326
Atmospheric variables andprevious 365 days wetnessstate
84 13 1308 333
88 R. Mehrotra et al. / Journal of Hydrology 488 (2013) 84–100
region is dominated by the monsoon and major part of the annualrainfall is received during four monsoon months, June–September.Recognising this and the fact that divergent rainfall generationmechanisms may prevalent during different parts of the year, morespecifically in a changing climate, three seasons namely pre-mon-soon (January–May, JFMAM), monsoon (June–September, JJAS) andpost-monsoon (October–December, OND) are considered in thisstudy. The study region shows considerable variation in spatial dis-tribution of annual rainfall with upstream reaches (which is a partof the Western Ghats) recording more than 3000 mm, to around400 mm near the Malaprabha reservoir. It receives an average an-nual rainfall of 1051 mm and the annual averages of maximum andminimum temperatures are 32 �C and 18 �C, respectively.
3.3. Large scale observed atmospheric variables
The required observed atmospheric variables at nine grid pointsover the study area are extracted from the National Center for
Environmental Prediction (NCEP) reanalysis data provided by theNOAA-CIRES Climate Diagnostics Centre, Boulder, Colorado, USA,from their web site at http://www.cdc.noaa.gov/. These variablesare available on 2.5� latitude � 2.5� longitude grids on a daily basisfor the same period as the rainfall record (Fig. 1). As an observedrainfall value represents the total rainfall over a 24-h period endingat 0900 h (local time) in the morning, the available atmosphericmeasurements on the preceding day are considered as representa-tive of today’s rainfall.
3.4. Large scale GCM variables
The World Climate Research Programme’s Coupled Model Inter-comparison Project phase 3 (CMIP3) multimodel dataset containsresults from more than 20 major global climate models developedaround the world (Meehl et al., 2007). This information has beenwidely utilised for climate research and prediction. Although GCMsare capable of reproducing the many important aspects of the cur-rent climate at regional and continental scales including thechanges in the patterns of different climate variables over time,their predictive skill varies considerably from model to modeland over regions of interest. Thus, climate scientists often use mul-ti-model information as a method for dealing with inter-modelvariability in future projections (Fordham et al., 2012; Pierce etal., 2009).
The limited data availability of the required daily atmosphericvariables at the CMIP3 archive controlled the selection of fiveGCMs for the present study. These include: (a) Bjerknes Centrefor Climate Research (BCCR), Univ. of Bergen, Norway, BCCR-BCM2.0; (b) Meteorological Research Institute (MRI), Japan, MRI-CGCM2; (c) Commonwealth Scientific and Industrial ResearchOrganisation (CSIRO), Australia, CSIRO-mk3.5; (d) Max PlanckInstitute for Meteorology (MPI), Germany, MPI-ECHAM5; and (e)Institute Pierre Simon Laplace (IPSL), France, IPSL-CM4.
GCM datasets of atmospheric variables for the baseline period(covering a 30-year period between 1971 and 2000 and represent-ing the current climate) and the future climates by 2055 (2046–2065) and 2090 (2081–2100) periods are considered in the analy-sis. Again, the selection of future time slices is limited by the dataavailability for these time periods. These variables are extractedfrom a single continuous (transient) run (corresponding to A2 SRESemission scenarios) for the grid nodes over the study region. TheA2 scenario is at the higher end of the SRES emissions scenarios(but not the highest), and this is preferred because a low emissionsscenario potentially provides less information from an impacts andadaptation point of view. In addition, the current trajectory ofemissions (1990 to present) corresponds to a relatively high emis-sions scenario similar to A2. As an observed rainfall value repre-sents the total rainfall over a 24-h period ending at 0900 h (localtime) in the morning, similar to the reanalysis data, the availableatmospheric measurements on the preceding day are consideredas representative of today’s rainfall.
Since the resolution of GCMs varies, output of each GCM isinterpolated back onto the nine NCEP grids (2.5� latitude by 2.5�longitude). For defining a grid averaged value and north–southand east–west gradients, all nine grid point values are used tosmoothen out the bias and spatial shifts, if any, at an individualgrid point values.
3.5. Adjustment of GCM data
Limitations and assumptions in the modelling of the energy andmoisture cycles and, the simulation of clouds in GCMs contributesignificant uncertainties in GCM outputs (Solomon et al., 2007). Be-cause of these limitations, a GCM may not simulate climate vari-ables accurately and there is a difference between the

Fig. 2. Observed and model simulated monthly wet days, rainfall amounts and perwet day rainfall in a month for the current climate (1971–2000) over the study area.
R. Mehrotra et al. / Journal of Hydrology 488 (2013) 84–100 89
observations and simulations, known as bias and this limits the di-rect application of GCM simulations in downscaling and hydrolog-ical modelling studies.
An examination of the means and standard deviations of cur-rent climate GCM and corresponding reanalysis atmospheric fields(1971–2000) at daily, monthly, seasonal and annual time scalessuggest subtle differences in these characteristics. This requiressome scaling correction to be carried out on the GCM data before
use in the downscaling application. The GCM overall climatologicalmean bias over the future period includes GCM systematic bias (asobserved for the current climate) and the climate change shift(from the current to the future). We aim to correct the formerone in the bias correction approach under the assumption thatthe bias is stationary i.e. does not change with time and does notaffect the overall climate dynamics.
We adjust the GCM data for the baseline (1971–2000) and fu-ture climate periods (2046–2065 and 2081–2100) by adopting anested bias correction (NBC) procedure (Johnson and Sharma,2012). In the approach, the GCM series (current and future cli-mates) is corrected for biases in the mean, standard deviationand LAG 1 auto-correlation at daily, monthly, seasonal and annualtime scales simultaneously by ensuring that systematic biases inthe GCM atmospheric fields are removed before their use fordownscaling while the mean shift from current to future climateis maintained.
Sharma et al. (in press) and Johnson and Sharma (2011) haveshown that the use of NBC for bias correction of atmospheric vari-ables helps reproducing the observed low frequency variability inthe rainfall simulations, and offers a better representation thanthe use of alternative bias formulations such as quantile correction.When the intent is to simulate the ‘‘sustained extremes’’ that are ofconsiderable importance in water resources planning and design,the use of such an approach leads to improved results. Daily meansand standard deviations for the standardization procedure are esti-mated by considering a moving window of 31 days centred on thecurrent day.
3.6. Identification of significant predictors
Atmospheric circulation and moisture strongly influence themonsoon climate. Sea level pressure (SLP), geo-potential height,air temperature, wind speed and other variables have been usedto define atmospheric circulation (e.g. Harpham and Wilby, 2005;Buishand et al., 2004; Charles et al., 1999). A warmer climate is ex-pected to accelerate evaporation and release more moisture in theatmosphere, leading to higher rainfall rates and greater intervalsbetween rain events (Trenberth et al., 2003). Different forms ofatmospheric moisture have been used by the researchers in thepast (Crane and Hewitson, 1998; Cavazos, 1999; Charles et al.,1999; Easterling, 1999; Harpham and Wilby, 2005; Buishandet al., 2004; Evans et al., 2004). It may be noted that the absoluteform of moisture such as relative humidity does not really carrythe ‘true climate signal’ as a warmer climate can hold more mois-ture and therefore additional information about temperature isneeded to know the amount of moisture that can precipitate in awarmer climate. Following this, Charles et al. (1999) suggest usingdifference of air and dew point temperatures whereas Evans et al.(2004) advocate using equivalent potential temperature as one ofthe predictors. On the basis of the results of earlier downscalingstudies, we pick a large set of atmospheric predictors comprisingof circulation and moisture variables at various levels and theirhorizontal and vertical gradients, as the potential predictors. Anonparametric stepwise predictor identification analysis is carriedout at daily time scale to identify sets of significant atmosphericpredictors for each season and for occurrence and amounts models.A partial correlation analysis is carried out at each time step toanalyse the predictive capability of the additional variable beingincluded. As some of these predictors might be highly correlatedamong themselves, at each stage of predictor identification exer-cise, a screening is carried out to see whether identified predictorat current stage is highly correlated with predictors picked up atprevious stages (predictors having absolute linear correlation high-er than 0.85 are ignored). To account for the short term persistencein the rainfall downscaling process, previous day rainfall is in-

Table 4Observed and model simulated seasonal and annual means and standard deviations of wet days and rainfall totals over the study area for current climate (1971–2000).
Data set/season Wet days Rainfall amount
Pre-monsoon Monsoon Post-monsoon Annual Pre-monsoon Monsoon Post-monsoon Annual
MeansObserved 6.3 65.6 9.2 81.1 72.1 1093.1 123.7 1288.8Reanalysis 6.9 66.2 10.9 84.0 80.9 1090.0 137.4 1308.3BCCR 7.1 66.0 10.8 84.0 85.0 1043.5 137.2 1265.7MRI 7.1 66.9 10.7 84.7 83.0 1042.6 134.3 1259.9CSIRO 6.9 65.9 10.7 83.5 80.6 1053.9 135.9 1270.3MPI 7.2 66.3 10.9 84.3 85.3 1062.0 139.3 1286.7IPSL 6.9 66.3 10.7 83.9 81.3 1010.7 135.8 1227.8
Standard deviationsObserved 2.4 6.6 3.3 7.7 29.2 280.3 58.7 289.1Reanalysis 2.3 7.7 3.1 9.0 32.1 240.9 49.2 249.4BCCR 2.3 7.3 3.3 8.7 35.1 226.1 52.2 238.2MRI 2.3 6.1 3.2 8.2 32.9 205.0 49.3 219.2CSIRO 2.4 7.5 3.6 9.9 35.1 240.5 55.5 263.4MPI 2.5 7.6 3.8 9.8 37.6 235.1 57.6 254.8IPSL 2.2 7.5 2.8 9.2 31.8 219.2 44.9 235.6
90 R. Mehrotra et al. / Journal of Hydrology 488 (2013) 84–100
cluded as a pre-identified predictor in the conditioning vector foreach season before carrying out the predictor identificationexercise. For rainfall occurrences, one additional pre-identifiedpredictor, namely, previous 365 days area averaged wetness stateis also included. Table 2 provides a list of atmospheric predictorsidentified as significant for occurrence and amount processes forall the seasons.
4. Application of downscaling model and discussion of results
For the rainfall occurrence downscaling model (MMM), weconsider individual at-site Markov order one models conditionalon pre-identified atmospheric variables (common across all sta-tions) and previous 365 days (at individual station) wetness state.The 365 days wetness state predictor is identified based on asensitivity analysis. The analysis is performed using current cli-mate data and varying the aggregated wetness state from 90 daysto 365 days with 30 days interval. As shown in Table 3, the365 days aggregated wetness state predictor is found to providebetter representation of the observed standard deviation of annualnumber of wet days and rainfall amount in the current climatesimulations. Thus, the short term persistence in the downscaledrainfall is maintained through order one Markovian structure,while long-term persistence is introduced through previous365 days wetness state and nested bias corrected atmosphericvariables. Nonzero precipitation amounts are downscaledconditional on atmospheric variables and previous day’s rainfall,for each day and station, defined as wet by the MMM occurrencedownscaling model. The inter-station spatial correlations indownscaled occurrence and amounts are induced through spatiallycorrelated random numbers as discussed in Section 3.2.
The model is calibrated using observed rainfall and reanalysisdata for the time period (1971–2000) and is evaluated using theGCM data for the same time period. The calibrated model is runfor two 20 years time windows (2046–2065 and 2080–2100) to ob-tain rainfall predictions around 2055 and 2090, respectively.
4.1. Results
A range of spatial and temporal characteristics of observed andmodel simulated rainfall on daily, monthly, seasonal and annualbasis are calculated, compared and evaluated to assess theperformance of downscaling model for the current climate and,to examine the impact of changed climate on rainfall in the future.The statistics of downscaled rainfall time series are derived from
100 realisations and the median value is used to compare theresults. Results of spatial correlations, average number of wet daysand rainfall amounts are presented for all stations whereas forsome statistics catchment area averaged values are presented.The year to year distributional behaviour of the observed andsimulated series of rainfall occurrence and amounts is analysedat individual locations and, presented and discussed at tworepresentative stations.
First, results of model calibration and verification for the cur-rent climate are presented and discussed. This is followed by thepresentation and discussion of changes in few important rainfallstatistics in years 2055 and 2090.
4.2. Model results for the current climate
4.2.1. Average rainfall statisticsFor downscaling applications planned for use in agriculture, res-
ervoir operation and flood management strategies, accurate simu-lation of the number of wet days and rainfall amounts assumesignificance. Fig. 2 presents the plots of area averaged observedand model simulated median values of number of wet days (topplot) and rainfall amounts (middle plot) and, amount per wetday (bottom plot) in each month for model calibration (usingreanalysis data) and evaluation (using GCM data) phases. As canbe seen from these plots, the model provides a good fit to themonthly number of wet days and rainfall amount for calibrationand evaluation phases for all months. A slight underestimation ofrainfall amounts for July month by the IPSL model is noted. Theamount per wet day is over simulated by all the models duringDecember and pre-monsoon period and under simulated duringmonsoon period.
Similar to Fig. 2, Table 4 presents the seasonal and annualmeans and standard deviations of observed and model simulatednumber of wet days and rainfall amounts averaged over the studyarea. In general, reanalysis and GCM data based simulations over-simulate the mean number of wet days and rainfall amount duringpre-monsoon and post-monsoon seasons and under-simulate thestandard deviation of rainfall amount during monsoon season.However, these differences are minor and overall performance ofthe downscaling model for calibration and evaluation phases atmonthly, seasonal and annual level is deemed satisfactory.
Scatter plots of observed and model simulated median values ofannual number of wet days, annual rainfall and amount per wetday at individual stations are presented in Fig. 3. In these plots, ob-served statistics is plotted on the horizontal while simulated one is

Fig. 3. Observed and model simulated annual wet days, rainfall amounts and perwet day rainfall in a year for the current climate (1971–2000) over the study area.Symbols on the graphs indicate stations.
R. Mehrotra et al. / Journal of Hydrology 488 (2013) 84–100 91
shown on the vertical axis. Filled circles on these plots representstations with colors used to differentiate amongst the GCM datasets used to derive these statistics. In general, all GCMs simulatesimilar annual number of wet days and rainfall amounts (top andmiddle plots) at all stations with IPSL and MRI models slightly un-der simulating rainfall at a few locations. These differences aremore pronounced in the bottom plot where scatter plot of amount
per wet day is shown. The stations with noticeable differences arelocated in the upper forested region of the catchment which is apart of the Western Ghats. Although, the model grid resolution,proximity to the coast, land use and representation of topographyin the model might have some bearing on the results, the exact rea-son behind such differences is quite complex and requires furtherinvestigation.
4.2.2. Distribution of average annual wet days and rainfall amountsProper simulation of year-to-year distribution of annual num-
ber of wet days and rainfall amount in the downscaled series isimportant for efficient design and management of water resourceprojects. Fig. 4 compares the distribution plots of number of wetdays in a year and annual rainfall amounts of the observed anddownscaled rainfall series for two representative stations (Bailhon-gal and Asoga with index number 1 and 6 of Table 1, respectively).The top row shows the distribution of annual number of wet days,middle annual rainfall while the bottom row presents the distribu-tion of average rainfall amount per wet day in a year. In general,the performance of the downscaling model in reproducing theyear-to-year distribution of observed (black) number of wet daysin a year and annual rainfall amounts using reanalysis (red) andGCMs data (other colors) at both stations is satisfactory (first tworows). The year-to-year distribution of amount per wet day is sim-ulated reasonably well by the model using reanalysis data at bothstations while GCM data derived results show under simulation ofthis statistic for low exceedance probabilities at Asoga stations(bottom row). These differences are more pronounced for IPSLand MRI data derived results. It may be noted that Asoga is locatedin the upper forested part of the catchment while Bailhongal is lo-cated in the lower region with flat topography (Fig. 1). It appearsthat GCMs have limitations in simulating the climate in the Wes-tern Ghats region. Similar results are obtained for other stationsas well and are not presented here for the space limitation.
4.2.3. Number of wet and dry spells and daily maximum rainfallContinuous wet and dry spells, and daily rainfall peaks form the
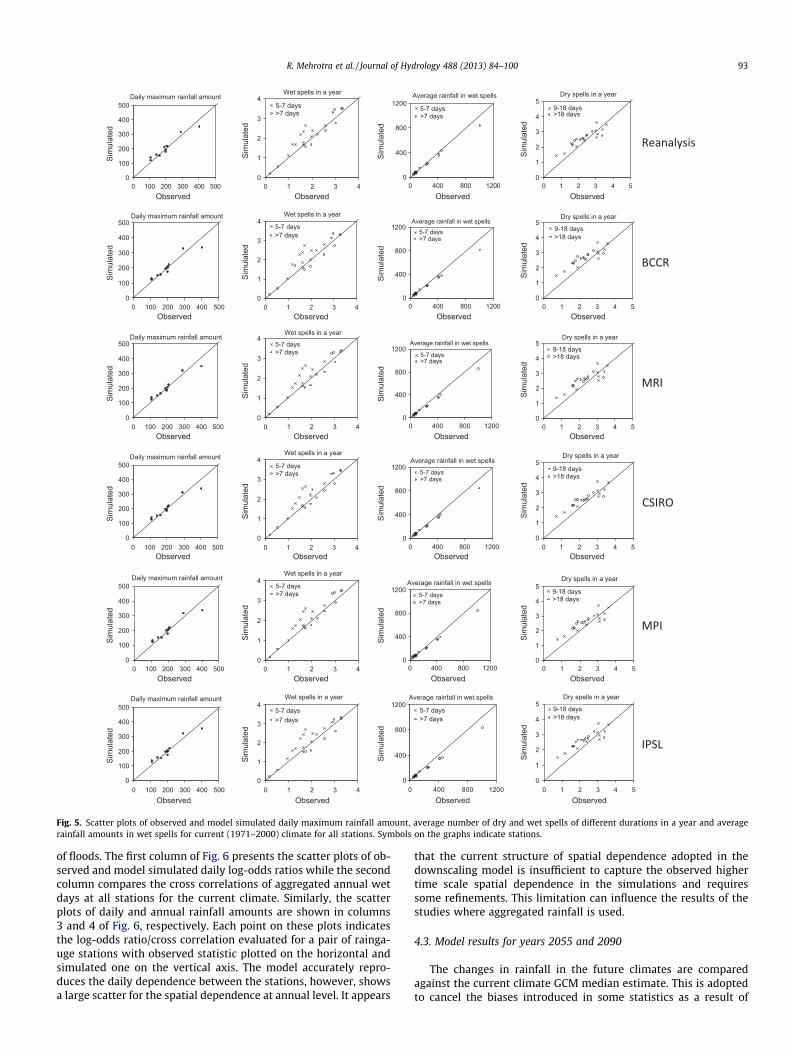
basis of reservoir design and operation, flood estimation and agri-cultural studies. Therefore, proper simulation of these rainfall char-acteristics is of significance in catchment studies. Table 5 presentsthe statistics of observed and models simulated average number ofwet and dry spells of varying durations, associated rainfall in wetspells and number of days with heavy rainfall (3rd percentile dailyrainfall). Wet and dry spells of shorter durations are, in general,oversimulated while rainfall amount in longer duration wet spellsis under simulated by all the models. Other statistics includingnumber of days with heavy rainfall are reasonably well simulatedby all the models.
Similar to Table 5, the first column of Fig. 5 compares the ob-served and model simulated maximum daily rainfall while the sec-ond and third columns present the average occurrences of wetspells of 5–7 days and >7 days in a year and associated averagerainfall in these wet spells at all stations. Finally, the last columnpresents the average occurrences of dry spells of 9–18 and>18 days in a year. In these plots observed statistics is shown onthe horizontal while simulated one is shown on the vertical axisand symbols are shown for individual stations. For a perfect match,all symbols should align along the diagonal dotted line. The down-scaled simulations from all the GCMs largely reproduce these rain-fall attributes at all stations albeit some scatter for average numberof wet and dry spells. In general, the wet spells of 5–7 days and dryspells of greater than 18 days are over simulated at all stations byall the models. Average rainfall in the wet spells is reasonably wellsimulated with the exception of under simulation at Jamagaon sta-tion (index number 9) which receives substantial amount of an-nual rainfall (Table 1) and is located in the upper region of the

Fig. 4. Year to year distribution of observed and model simulated (median values) annual wet days and rainfall totals for current climate (1971–2000) at two representativestations, Asoga (30702) and Bailhongal (30201).
92 R. Mehrotra et al. / Journal of Hydrology 488 (2013) 84–100
catchment which is a part of the Western Ghats (Table 1 andFig. 1).
4.2.4. Spatial dependence of rainfallA log-odds ratio provides a measure of evaluation of the spatial
dependence of binary rainfall across stations (Edwards, 1963).
Table 5Observed and models simulated extreme rainfall characteristics for current climate (1971
Statistics/model Observed Reanaly
No of dry spells of 2–9 days (nos.) 11.3 13.7No dry spells of 10–18 days (nos.) 2.5 2.6No of dry spells of >18 days (nos.) 2.2 2.6No of wet spells of 2–4 days (nos.) 7.5 9.0No of wet spells of 5–7 days (nos.) 1.7 2.1No of wet spells of >7 days (nos.) 2.2 2.2Average rainfall in wet spells of 2–4 days (mm) 28.7 27.8Average rainfall in wet spells of 5–7 days (mm) 69.1 68.3Average rainfall in wet spells of >7 days (mm) 309 275No of days with heavy rainfall (nos.) 24.7 25.4
Similarly, cross correlation provides a measure of spatial depen-dence of continuous time series such as aggregated number ofwet days or rainfall amounts at a station pair. Accurate reproduc-tion of spatial correlation of rainfall is often necessary to evaluatethe hydrological or agricultural behaviour of a region and caninfluence significantly the discharge of a river and the formation
–2000).
sis BCCR MRI CSIRO MPI IPSL
14.0 13.8 13.6 13.6 13.92.7 2.6 2.7 2.6 2.62.6 2.6 2.5 2.6 2.69.3 9.1 9.0 9.0 9.22.2 2.2 2.1 2.1 2.12.1 2.2 2.2 2.3 2.228.0 28.1 27.8 28.2 28.367.6 67.4 67.6 68.4 67.0259 248 268 260 24624.6 24.4 24.7 25.0 23.8
Daily maximum rainfall amount
0
100
200
300
400
500
Observed
Sim
ulat
ed
Wet spells in a year
0
1
2
3
4
Observed
Sim
ulat
ed
5-7 days>7 days
Average rainfall in wet spells
0
400
800
1200
Observed
Sim
ulat
ed
5-7 days>7 days
Dry spells in a year
0
1
2
3
4
5
0 100 200 300 400 500 0 1 2 3 4 0 400 800 1200 0 1 2 3 4 5Observed
Sim
ulat
ed
9-18 days>18 days
Fig. 5. Scatter plots of observed and model simulated daily maximum rainfall amount, average number of dry and wet spells of different durations in a year and averagerainfall amounts in wet spells for current (1971–2000) climate for all stations. Symbols on the graphs indicate stations.
R. Mehrotra et al. / Journal of Hydrology 488 (2013) 84–100 93
of floods. The first column of Fig. 6 presents the scatter plots of ob-served and model simulated daily log-odds ratios while the secondcolumn compares the cross correlations of aggregated annual wetdays at all stations for the current climate. Similarly, the scatterplots of daily and annual rainfall amounts are shown in columns3 and 4 of Fig. 6, respectively. Each point on these plots indicatesthe log-odds ratio/cross correlation evaluated for a pair of rainga-uge stations with observed statistic plotted on the horizontal andsimulated one on the vertical axis. The model accurately repro-duces the daily dependence between the stations, however, showsa large scatter for the spatial dependence at annual level. It appears
that the current structure of spatial dependence adopted in thedownscaling model is insufficient to capture the observed highertime scale spatial dependence in the simulations and requiressome refinements. This limitation can influence the results of thestudies where aggregated rainfall is used.
4.3. Model results for years 2055 and 2090
The changes in rainfall in the future climates are comparedagainst the current climate GCM median estimate. This is adoptedto cancel the biases introduced in some statistics as a result of

0
2
4
6
Observed
Sim
ulat
ed
Cross correlationsof annual wet days
-0.25
0
0.25
0.5
0.75
1
ObservedSi
mul
ated
-0.2
0
0.2
0.4
0.6
0.8
1
Observed
Sim
ulat
ed
0
0.2
0.4
0.6
0.8
1
0 2 4 6 -0.25 0 0.25 0.5 0.75 1 -0.2 0 0.2 0.4 0.6 0.8 1 0 0.2 0.4 0.6 0.8 1
Observed
Sim
ulat
ed
0
2
4
6
Observed
Sim
ulat
ed
-0.25
0
0.25
0.5
0.75
1
Observed
Sim
ulat
ed
-0.2
0
0.2
0.4
0.6
0.8
1
Observed
Sim
ulat
ed
0
0.2
0.4
0.6
0.8
1
0 2 4 6 -0.25 0 0.25 0.5 0.75 1 -0.2 0 0.2 0.4 0.6 0.8 1 0 0.2 0.4 0.6 0.8 1
Observed
Sim
ulat
ed
0
2
4
6
Observed
Sim
ulat
ed
-0.25
0
0.25
0.5
0.75
1
Observed
Sim
ulat
ed
-0.2
0
0.2
0.4
0.6
0.8
1
Observed
Sim
ulat
ed
0
0.2
0.4
0.6
0.8
1
0 2 4 6 -0.25 0 0.25 0.5 0.75 1 -0.2 0 0.2 0.4 0.6 0.8 1 0 0.2 0.4 0.6 0.8 1
Observed
Sim
ulat
ed
0
2
4
6
Observed
Sim
ulat
ed
-0.25
0
0.25
0.5
0.75
1
Observed
Sim
ulat
ed
-0.2
0
0.2
0.4
0.6
0.8
1
Observed
Sim
ulat
ed
0
0.2
0.4
0.6
0.8
1
0 2 4 6 -0.25 0 0.25 0.5 0.75 1 -0.2 0 0.2 0.4 0.6 0.8 1 0 0.2 0.4 0.6 0.8 1
Observed
Sim
ulat
ed
0
2
4
6
Observed
Sim
ulat
ed
-0.25
0
0.25
0.5
0.75
1
Observed
Sim
ulat
ed
-0.2
0
0.2
0.4
0.6
0.8
1
Observed
Sim
ulat
ed
0
0.2
0.4
0.6
0.8
1
0 2 4 6 -0.25 0 0.25 0.5 0.75 1 -0.2 0 0.2 0.4 0.6 0.8 1 0 0.2 0.4 0.6 0.8 1
Observed
Sim
ulat
ed
0
2
4
6
Observed
Sim
ulat
ed
-0.25
0
0.25
0.5
0.75
1
Observed
Sim
ulat
ed
-0.2
0
0.2
0.4
0.6
0.8
1
Observed
Sim
ulat
ed
0
0.2
0.4
0.6
0.8
1
0 2 4 6 -0.25 0 0.25 0.5 0.75 1 -0.2 0 0.2 0.4 0.6 0.8 1 0 0.2 0.4 0.6 0.8 1
Observed
Sim
ulat
ed
Fig. 6. Observed and modelled log-odds ratios and cross correlations of wet days and rainfall amounts for current climate.
94 R. Mehrotra et al. / Journal of Hydrology 488 (2013) 84–100
model structure limitations. These results also include a modelweighted average estimate. As all the models provide a reasonableestimate of the important observed statistics for the current cli-mate, a simple model weighting procedure is adopted. The proce-
dure evaluates the models on the basis of their performance inreproducing the observed number of wet days, rainfall amountand amount per wet day in a season in the current climate and as-signs a weight on the basis of magnitude of sum of squared differ-

Fig. 7. Projected changes in monthly wet days, rainfall totals and amount per wetday in 2055 (2046–2065). Fig. 8. Projected changes in monthly wet days, rainfall totals and amount per wet
day in 2090 (2081–2100).
R. Mehrotra et al. / Journal of Hydrology 488 (2013) 84–100 95
ences in these statistics. On the basis of this criterion, the modelsBCCR, CSIRO, IPSL, MPI and MRI are assigned weights as 0.15,0.25, 0.231, 0.14 and 0.22, respectively.
4.3.1. Area averaged rainfall statisticsFigs. 7 and 8 present the changes in monthly wet days and rain-
fall amounts in years 2055 and 2090 whereas the percent changesin seasonal and annual number of wet days and rainfall totals arepresented in Table 6. By 2055, simulations from all GCMs projectno appreciable changes in rainfall in all seasons. Please note that,for non-monsoon seasons (JFMAM and OND) slight variation innumber of wet days or rainfall amount may show up as a large per-centage change. The projected changes in rainfall are quite consis-tent across the GCMs for monsoon season. The CSIRO modelprojects a reduction in number of wet days and rainfall amountin all seasons and months whereas projections from MPI indicate
some decreases in pre-monsoon season (first row, Fig. 7 and Table6). The increases in the number of wet days and rainfall amountduring pre-monsoon season by the IPSL model (first and secondplots, Fig. 7), although appear large, accounts for differences of lessthan a day and 2 mm, respectively. Other models project small in-creases in number of wet days and rainfall amount during non-monsoon seasons. There is no appreciable change in the amountper wet day with all the models projecting heavy rainy days duringJune (bottom plot, Fig. 7). The models weighted average indicatesno appreciable changes in the number of wet days and rainfallamount in year 2055. By 2090, CSIRO predicts appreciable dryingin all months with about 15% decrease in monsoon rainfall andwet days (Fig. 8 and Table 6). No changes in seasonal shifts are no-ticed, however, a weak tendency of the monsoon extending toOctober is observed (Fig. 8). Considering model averaged statistics,
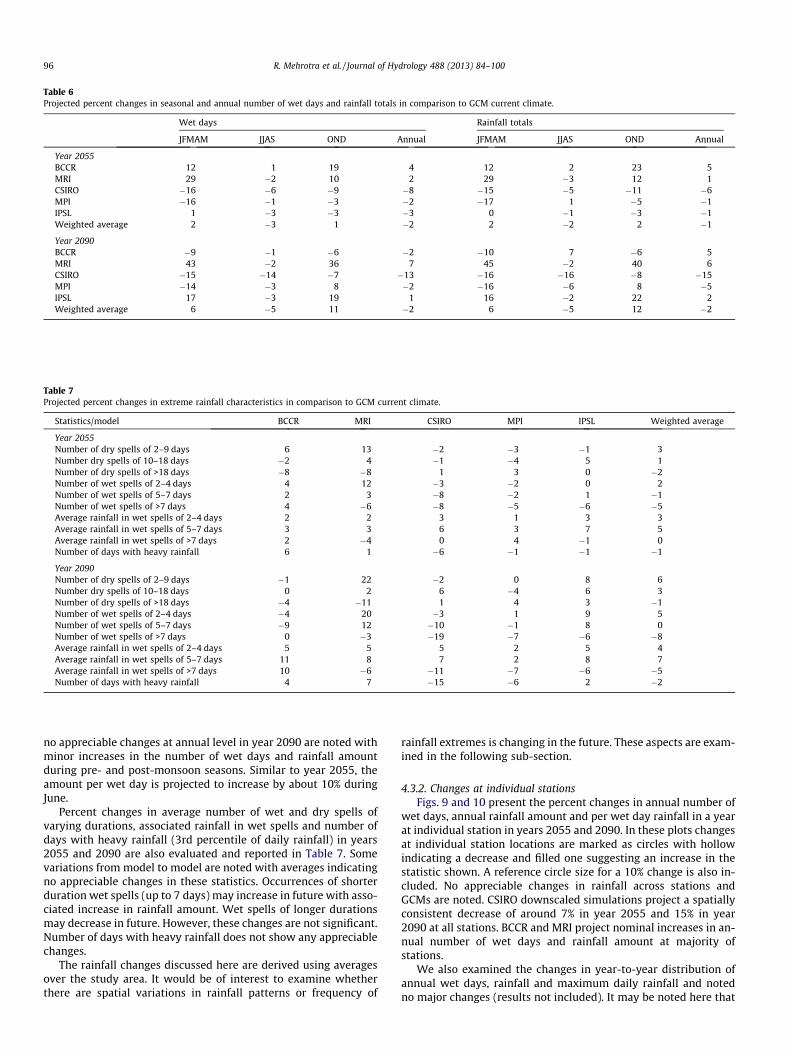
Table 6Projected percent changes in seasonal and annual number of wet days and rainfall totals in comparison to GCM current climate.
Wet days Rainfall totals
JFMAM JJAS OND Annual JFMAM JJAS OND Annual
Year 2055BCCR 12 1 19 4 12 2 23 5MRI 29 �2 10 2 29 �3 12 1CSIRO �16 �6 �9 �8 �15 �5 �11 �6MPI �16 �1 �3 �2 �17 1 �5 �1IPSL 1 �3 �3 �3 0 �1 �3 �1Weighted average 2 �3 1 �2 2 �2 2 �1
Year 2090BCCR �9 �1 �6 �2 �10 7 �6 5MRI 43 �2 36 7 45 �2 40 6CSIRO �15 �14 �7 �13 �16 �16 �8 �15MPI �14 �3 8 �2 �16 �6 8 �5IPSL 17 �3 19 1 16 �2 22 2Weighted average 6 �5 11 �2 6 �5 12 �2
Table 7Projected percent changes in extreme rainfall characteristics in comparison to GCM current climate.
Statistics/model BCCR MRI CSIRO MPI IPSL Weighted average
Year 2055Number of dry spells of 2–9 days 6 13 �2 �3 �1 3Number dry spells of 10–18 days �2 4 �1 �4 5 1Number of dry spells of >18 days �8 �8 1 3 0 �2Number of wet spells of 2–4 days 4 12 �3 �2 0 2Number of wet spells of 5–7 days 2 3 �8 �2 1 �1Number of wet spells of >7 days 4 �6 �8 �5 �6 �5Average rainfall in wet spells of 2–4 days 2 2 3 1 3 3Average rainfall in wet spells of 5–7 days 3 3 6 3 7 5Average rainfall in wet spells of >7 days 2 �4 0 4 �1 0Number of days with heavy rainfall 6 1 �6 �1 �1 �1
Year 2090Number of dry spells of 2–9 days �1 22 �2 0 8 6Number dry spells of 10–18 days 0 2 6 �4 6 3Number of dry spells of >18 days �4 �11 1 4 3 �1Number of wet spells of 2–4 days �4 20 �3 1 9 5Number of wet spells of 5–7 days �9 12 �10 �1 8 0Number of wet spells of >7 days 0 �3 �19 �7 �6 �8Average rainfall in wet spells of 2–4 days 5 5 5 2 5 4Average rainfall in wet spells of 5–7 days 11 8 7 2 8 7Average rainfall in wet spells of >7 days 10 �6 �11 �7 �6 �5Number of days with heavy rainfall 4 7 �15 �6 2 �2
96 R. Mehrotra et al. / Journal of Hydrology 488 (2013) 84–100
no appreciable changes at annual level in year 2090 are noted withminor increases in the number of wet days and rainfall amountduring pre- and post-monsoon seasons. Similar to year 2055, theamount per wet day is projected to increase by about 10% duringJune.
Percent changes in average number of wet and dry spells ofvarying durations, associated rainfall in wet spells and number ofdays with heavy rainfall (3rd percentile of daily rainfall) in years2055 and 2090 are also evaluated and reported in Table 7. Somevariations from model to model are noted with averages indicatingno appreciable changes in these statistics. Occurrences of shorterduration wet spells (up to 7 days) may increase in future with asso-ciated increase in rainfall amount. Wet spells of longer durationsmay decrease in future. However, these changes are not significant.Number of days with heavy rainfall does not show any appreciablechanges.
The rainfall changes discussed here are derived using averagesover the study area. It would be of interest to examine whetherthere are spatial variations in rainfall patterns or frequency of
rainfall extremes is changing in the future. These aspects are exam-ined in the following sub-section.
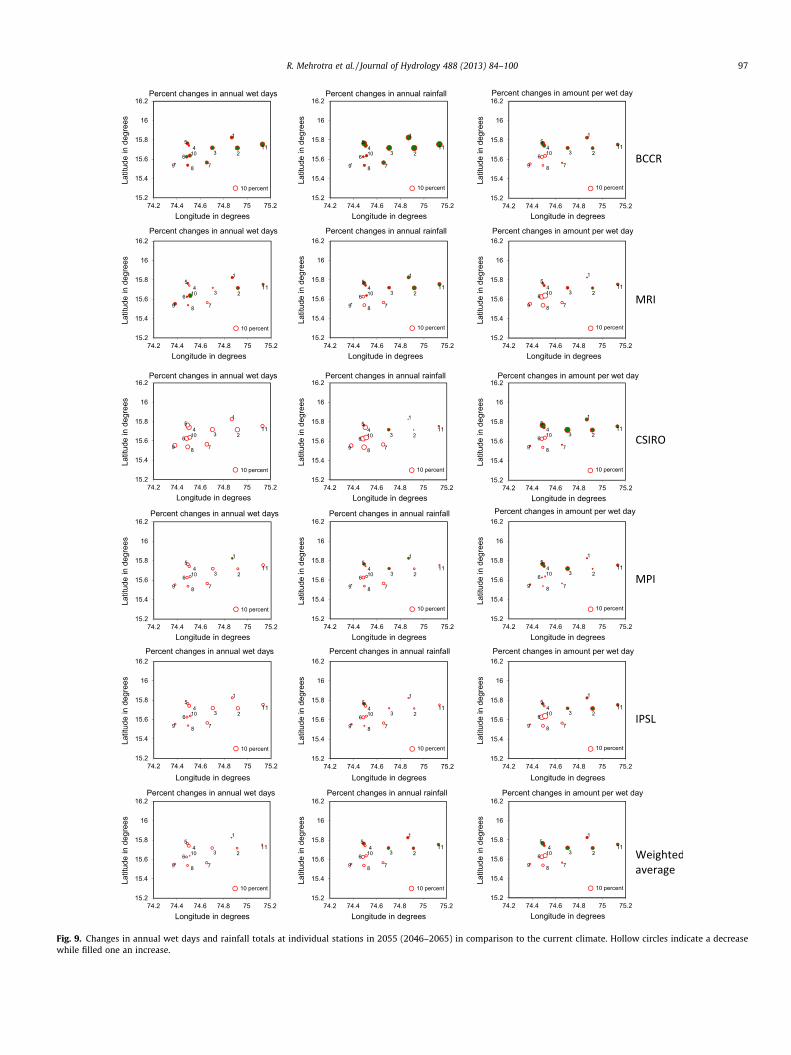
4.3.2. Changes at individual stationsFigs. 9 and 10 present the percent changes in annual number of
wet days, annual rainfall amount and per wet day rainfall in a yearat individual station in years 2055 and 2090. In these plots changesat individual station locations are marked as circles with hollowindicating a decrease and filled one suggesting an increase in thestatistic shown. A reference circle size for a 10% change is also in-cluded. No appreciable changes in rainfall across stations andGCMs are noted. CSIRO downscaled simulations project a spatiallyconsistent decrease of around 7% in year 2055 and 15% in year2090 at all stations. BCCR and MRI project nominal increases in an-nual number of wet days and rainfall amount at majority ofstations.
We also examined the changes in year-to-year distribution ofannual wet days, rainfall and maximum daily rainfall and notedno major changes (results not included). It may be noted here that
15.2
15.4
15.6
15.8
16
16.2
Latit
ude
in d
egre
es
Longitude in degrees
Percent changes in annual wet days
211
1
3
5
789
106
10 percent
4
15.2
15.4
15.6
15.8
16
16.2
Latit
ude
in d
egre
es
Longitude in degrees
Percent changes in annual rainfall
211
1
3
5
789
106
10 percent
4
15.2
15.4
15.6
15.8
16
16.2
Latit
ude
in d
egre
es
Longitude in degrees
Percent changes in amount per wet day
211
1
3
5
789
106
10 percent
4
15.2
15.4
15.6
15.8
16
16.2
Latit
ude
in d
egre
es
Longitude in degrees
Percent changes in annual wet days
211
1
3
5
789
106
10 percent
4
15.2
15.4
15.6
15.8
16
16.2
Latit
ude
in d
egre
es
Longitude in degrees
Percent changes in annual rainfall
211
1
3
5
789
106
10 percent
4
15.2
15.4
15.6
15.8
16
16.2
74.2 74.4 74.6 74.8 75 75.2 74.2 74.4 74.6 74.8 75 75.2 74.2 74.4 74.6 74.8 75 75.2
74.2 74.4 74.6 74.8 75 75.2 74.2 74.4 74.6 74.8 75 75.2 74.2 74.4 74.6 74.8 75 75.2
74.2 74.4 74.6 74.8 75 75.2 74.2 74.4 74.6 74.8 75 75.2 74.2 74.4 74.6 74.8 75 75.2
74.2 74.4 74.6 74.8 75 75.2 74.2 74.4 74.6 74.8 75 75.2 74.2 74.4 74.6 74.8 75 75.2
74.2 74.4 74.6 74.8 75 75.2 74.2 74.4 74.6 74.8 75 75.2 74.2 74.4 74.6 74.8 75 75.2
74.2 74.4 74.6 74.8 75 75.2 74.2 74.4 74.6 74.8 75 75.2 74.2 74.4 74.6 74.8 75 75.2
Latit
ude
in d
egre
es
Longitude in degrees
Percent changes in amount per wet day
211
1
3
5
789
106
10 percent
4
Fig. 9. Changes in annual wet days and rainfall totals at individual stations in 2055 (2046–2065) in comparison to the current climate. Hollow circles indicate a decreasewhile filled one an increase.
R. Mehrotra et al. / Journal of Hydrology 488 (2013) 84–100 97

15.2
15.4
15.6
15.8
16
16.2
Latit
ude
in d
egre
es
Longitude in degrees
Percent changes in annual wet days
211
1
3
5
789
106
10 percent
4
15.2
15.4
15.6
15.8
16
16.2
Latit
ude
in d
egre
es
Longitude in degrees
Percent changes in annual rainfall
211
1
3
5
789
106
10 percent
4
15.2
15.4
15.6
15.8
16
16.2
Latit
ude
in d
egre
es
Longitude in degrees
Percent changes in amount per wet day
211
1
3
5
789
106
10 percent
4
15.2
15.4
15.6
15.8
16
16.2
Latit
ude
in d
egre
es
Longitude in degrees
Percent changes in annual wet days
211
1
3
5
789
106
10 percent
4
15.2
15.4
15.6
15.8
16
16.2
Latit
ude
in d
egre
es
Longitude in degrees
Percent changes in annual rainfall
211
1
3
5
789
106
10 percent
4
15.2
15.4
15.6
15.8
16
16.2
74.2 74.4 74.6 74.8 75 75.2 74.2 74.4 74.6 74.8 75 75.2 74.2 74.4 74.6 74.8 75 75.2
74.2 74.4 74.6 74.8 75 75.2 74.2 74.4 74.6 74.8 75 75.2 74.2 74.4 74.6 74.8 75 75.2
74.2 74.4 74.6 74.8 75 75.2 74.2 74.4 74.6 74.8 75 75.2 74.2 74.4 74.6 74.8 75 75.2
74.2 74.4 74.6 74.8 75 75.2 74.2 74.4 74.6 74.8 75 75.2 74.2 74.4 74.6 74.8 75 75.2
Latit
ude
in d
egre
es
Longitude in degrees
Percent changes in amount per wet day
211
1
3
5
789
106
10 percent
4
15.2
15.4
15.6
15.8
16
16.2
Latit
ude
in d
egre
es
Longitude in degrees
Percent changes in annual wet days
211
1
3
5
789
106
10 percent
4
15.2
15.4
15.6
15.8
16
16.2
Latit
ude
in d
egre
es
Longitude in degrees
Percent changes in annual rainfall
211
1
3
5
789
106
10 percent
4
15.2
15.4
15.6
15.8
16
16.2
74.2 74.4 74.6 74.8 75 75.2 74.2 74.4 74.6 74.8 75 75.2 74.2 74.4 74.6 74.8 75 75.2
Latit
ude
in d
egre
es
Longitude in degrees
Percent changes in amount per wet day
211
1
3
5
789
106
10 percent
4
Fig. 10. Changes in annual wet days and rainfall totals at individual stations in 2090 (2081–2100) in comparison to the current climate. Hollow circles indicate a decreasewhile filled one an increase.
98 R. Mehrotra et al. / Journal of Hydrology 488 (2013) 84–100

R. Mehrotra et al. / Journal of Hydrology 488 (2013) 84–100 99
the results drawn hare are based on single ensemble of five GCMsand addition or omission of one or more GCM and ensembles maychange the predictions.
5. Summary and conclusions
This paper has demonstrated the applicability of a stochasticdownscaling framework for simulation of multi-site rainfall infuture climate settings. The coarse spatial resolution of GCMs(�300 km) provides only a limited representation of the realistictopographical features like the Western Ghats (along the westcoast of India) in the model structure and consequently fails toreproduce their predominant influence on the regional rainfall pat-terns (Krishna Kumar et al., 2011). The downscaling approaches,similar to the one used in the study, allow to consider theseinfluences on the simulated rainfall.
Downscaling models like MMM-KDE used in this application,are capable of simulating rainfall at a network of stations whilstmaintaining the spatial dependence attributes and therefore bestsuited for use in catchment management practice, where the nat-ure of spatial variations in rainfall has important influences onthe streamflows and flooding. Also, important temporal attributesof rainfall like distribution of wet and dry spells, number of wetdays and rainfall amounts at individual stations have significantimpacts in crop simulation studies and drought managementapplications. Such spatio-temporal rainfall attributes assume evenmore importance when the downscaling procedure is applied forinvestigating possible changes that might be experienced byhydrological, agricultural and ecological systems in futureclimates.
The comparison of standard rainfall attributes such as the num-ber of wet days, average rainfall amounts, maximum daily rainfallamount, wet and dry spells and other diagnostics indicate thatdownscaled results of MMM-KDE model agree fairly well withthe observed record for the current climate. Rainfall simulationsover the study region for years 2055 and 2090 using projectionsof five different GCMs indicate CSIRO to be a fairly dry model incomparison to the other GCMs used in the study. Combined resultsof all GCMs indicate slight decrease in monsoon rainfall over thestudy region however, it is not statistically significant. Addition-ally, the results of investigations carried out on extreme relatedstatistics and spatial rainfall distribution indicate no significantchanges in these rainfall attributes.
While none of the downscaling studies mentioned in the intro-duction have focused over the study area, an interpretation of theirresults over the study region may provide some insight into thelikely changes that are expected in a warmer climate. Krishna Ku-mar et al. (2011) examined the changes in the summer monsoonover India corresponding to the IPCC-SRES A1B emission scenariosusing three simulations from Hadley Center Coupled Model andprojected �20% to +20% changes in the monsoon rainfall by theyear 2080 over the study region across the three simulations. Sim-ilarly, results of Turner and Slingo (2009) indicated �1 to +1 mm/day changes in the mean rainfall in the future over the study re-gion. Rajendran and Kitoh (2008) used a global super high-resolu-tion GCM with a spatial grid size of about 20 km over India. Theirresults suggested a decrease of 2 mm/day in the monsoon rainfallover the catchment by 2080. The outcomes of these studies arelargely dependent on the selection of a GCM and scenario andshow no conclusive pattern of the likely changes in the rainfall inthe future over the study area.
A significant issue in downscaling applications relates to theincorporation of uncertainty in the climate projections as simu-lated by different GCMs. This uncertainty is typically included byconsidering an ensemble of models, with an important example
being the Coupled Model Intercomparison Project phase 3 (CMIP3)of GCMs (Meehl et al., 2007). Even very recently, many studieshave only used a single GCM output (Austin et al., 2010; Mehrotraand Sharma, 2010; Holman et al., 2009; Mileham et al., 2009;Toews and Allen, 2009; van Roosmalen et al., 2009). Findings of arecent study suggest that the greatest source of the uncertaintyin the downscaled results comes from the differences in theclimate projections (Crosbie et al., 2011). The use of climate projec-tions from multiple GCMs in the study has enabled to incorporatethe uncertainty in the downscaled rainfall results that arisesthrough the use of single GCM. Although, the selection of GCMsis influenced by the availability of atmospheric variables at dailytime scale at the CMEP3 archive, the selected five GCMs areexpected to explain a major part of the variability across GCMs.In a recent study, Ojha et al. (in press) assessed the performanceof 17 GCMs using the CMIP3 data and assigned a ranking to thesemodels on the basis of their ability in reproducing the monthly andannual rainfall statistics over India. On the basis of this ranking cri-terion, the models used in the study are ranked as 2, 5, 6, 10 and13. Although, not a robust measure, these rankings cover a broadrange and suggest that the models used in the study roughly coverthe GCMs uncertainty spectrum.
Acknowledgements
This research is supported by the Australia India Strategic Re-search Fund (AISRF-ST030111). We acknowledge the modelinggroups, the Program for Climate Model Diagnosis and Intercompar-ison (PCMDI) and the WCRP’s Working Group on Coupled Model-ling (WGCM) for their roles in making available the WCRP CMIP3multi-model dataset. Support of this dataset is provided by the Of-fice of Science, US Department of Energy.
References
Anandhi, A., Srinivas, V.V., Nanjundiah, Ravi S., Nagesh Kumar, D., 2008.Downscaling precipitation to river basin in India for IPCC SRES scenariosusing support vector machine. Int. J. Climatol. 28, 401–420.
Ashrit, R., Douville, H., Kumar, K.K., 2003. Response of the Indian monsoon andENSO-monsoon teleconnection to enhanced greenhouse effect in the CNRMcoupled model. J. Meteorol. Soc. Jpn. 81, 779–803. http://dx.doi.org/10.2151/jmsj.81.779.
Austin, J., Zhang, L., Jones, R., Durack, P., Dawes, W., Hairsine, P., 2010. Climatechange impact on water and salt balances: an assessment of the impact ofclimate change on catchment salt and water balances in the Murray-DarlingBasin, Australia. Clim. Change 100 (3–4), 607–631. http://dx.doi.org/10.1007/s10584-009-9714-z.
Buishand, T.A., Shabalova, M.V., Brandsma, T., 2004. On the choice of the temporalaggregation level for statistical downscaling of precipitation. J. Clim. 17 (9),1816–1827.
Cavazos, T., 1999. Large-scale circulation anomalies conducive to extremeprecipitation events and derivation of daily rainfall in Northeastern Mexicoand Southeastern Texas. J. Clim. 12, 1506–1523.
Charles, S.P., Bates, B.C., Hughes, J.P., 1999. A spatio-temporal model fordownscaling precipitation occurrence and amounts. J. Geophys. Res. 104(D24), 31657–31669.
Charles, S.P., Bates, B.C., Smith, I.N., Hughes, J.P., 2004. Statistical downscaling ofdaily precipitation from observed and modelled atmospheric fields. Hydrol.Process. 18, 1373–1394.
Crane, R.G., Hewitson, B.C., 1998. Doubled CO2 precipitation changes for theSusquehanna Basin: down-scaling from the GENESIS general circulation model.Int. J. Climatol. 18, 65–76.
Crosbie, R.S., Dawes, W.R., Charles, S.P., Mpelasoka, F.S., Aryal, S., Barron, O.,Summerell, G.K., 2011. Differences in future recharge estimates due to GCMs,downscaling methods and hydrological models. Geophys. Res. Lett. 38, L11406.http://dx.doi.org/10.1029/2011GL047657.
Easterling, D., 1999. Development of regional climate change scenarios using adownscaling approach. Clim. Change 41, 615–634.
Edwards, A.W.F., 1963. The measure of association in a 2 � 2 table. J. R. Stat. Soc. A126 (1), 109–114.
Evans, J.P., Ronald, B.S., Robert, J.O., 2004. Middle east climate simulation anddominant precipitation processes. Int. J. Climatol. 24, 1671–1694.
Fordham, D.A., Wigley, T.M.L., Watts, M.J., Brook, B.W., 2012. Strengtheningforecasts of climate change impacts with multi-model ensemble averaged

100 R. Mehrotra et al. / Journal of Hydrology 488 (2013) 84–100
projections using MAGICC/SCENGEN 5.3. Ecography 35, 4–8. http://dx.doi.org/10.1111/j.1600-0587.2011.07398.
Frost, A.J., Charles, S.P., Timbal, B., Chiew, F.H.S., Mehrotra, R., Nguyen, K.C.,Chandler, R.E., McGregor, J.L., Fu, G., Kirono, D.G.C., Fernandez, E., Kent, D.M.,2011. A comparison of multisite daily rainfall downscaling techniques underAustralian conditions. J. Hydrol. 408 (12). http://dx.doi.org/10.1016/j.jhydrol.2011.06.021.
Gadgil, S., Abrol, Y.P., Rao, S., 1999. On growth and fluctuation of Indian food grainproduction. Curr. Sci. 76, 548–556.
Gadgil, S., Gadgil, S., 2006. The Indian monsoon, GDP and agriculture. Econ. Polit.Wkly 11, 4887–4895.
Harpham, C., Wilby, R.L., 2005. Multi-site downscaling of heavy daily precipitationoccurrence and amounts. J. Hydrol. 312, 1–21.
Harrold, T.I., Sharma, A., Sheather, S.J., 2003. A nonparametric model for stochasticgeneration of daily rainfall occurrence. Water Resour. Res. 39 (12), 1343. http://dx.doi.org/10.1029/2003WR002570.
Hewitson, B.C., Crane, R.G., 1996. Climate downscaling: techniques and application.Clim. Res. 7, 85–95.
Holman, I.P., Tascone, D., Hess, T.M., 2009. A comparison of stochastic anddeterministic downscaling methods for modelling potential groundwaterrecharge under climate change in East Anglia, UK: implications forgroundwater resource management. Hydrogeol. J. 17 (7), 1629–1641. http://dx.doi.org/10.1007/s10040-009-0457-8.
Hu, Z.Z., Latif, M., Roeckner, E., Bengtsson, L., 2000. Intensified Asian summermonsoon and its variability in a coupled model forced by increasing greenhousegas concentrations. Geophys. Res. Lett. 27, 2618–2684. http://dx.doi.org/10.1029/2000GL011550.
Hughes, J.P., Guttorp, P., Charles, S.P., 1999. A non-homogeneous hidden Markovmodel for precipitation occurrence. Appl. Stat. 48 (1), 15–30.
IPCC, 2007. Climate change 2007: the physical science basis. In: Solomon, S., Qin, D.,Manning, M., Chen, Z., Marquis, M., Averyt, K.B., Tignor, M., Miller, H.L. (Eds.),Contribution of Working Group I to the Fourth Assessment Report of theIntergovernmental Panel on Climate Change. Cambridge University Press,Cambridge, United Kingdom and New York, NY, USA, 996 pp.
Johnson, F., Sharma, A., 2011. Accounting for interannual variability: a comparisonof options for water resources climate change impact assessments. WaterResour. Res. 47 (4).
Johnson, F., Sharma, A., 2012. A nesting model for bias correction of variability atmultiple time scales in general circulation model precipitation simulations.Water Resour. Res. 48, W01504. http://dx.doi.org/10.1029/2011WR010464.
Krishna Kumar, K., Patwardhan, S.K., Koteswara Rao, K., Jones, R., 2011. Simulatedprojections for summer monsoon climate over India by a high-resolutionregional climate model (PRECIS). Curr. Sci. 101 (3), 312–326.
May, W., 2002. Simulated changes of the Indian summer monsoon under enhancedgreenhouse gas conditions in a global time-slice experiment. Geophys. Res. Lett.29, 1118.
Meehl, G.A., Arblaster, J.M., 2003. Mechanisms for projected future changes in SouthAsian monsoon precipitation. Clim. Dynam. 21, 659–675.
Meehl, G., Stocker, T., Collins, W., Friedlingstein, P., Gaye, A., Gregory, J., Kitoh, A.,Knutti, R., Murphy, J., Noda, A., Raper, S., Watterson, I., Weaver, A., Zhao, Z.-C.,2007. Climate Change 2007: The Physical Science Basis. Working Group I tothe Fourth Assessment Report of the Intergovernmental Panel on ClimateChange.
Meehl, G.A., Arblaster, J.M., Collins, W.D., 2008. Effects of black carbon aerosols onthe Indian monsoon. J. Clim. 21, 2869–2882.
Mehrotra, R., Sharma, A., 2005. A nonparametric nonhomogeneous hidden Markovmodel for downscaling of multi-site daily rainfall occurrences. J. Geophys. Res.110, D16108. http://dx.doi.org/10.1029/2004JD005677.
Mehrotra, R., Srikanthan, R., Sharma, A., 2006. A comparison of three stochasticmulti-site precipitation occurrence generators. J. Hydrol. 331, 280–292. http://dx.doi.org/10.1016/j.jhydrol.2006.05.016.
Mehrotra, R., Sharma, A., 2007a. A semi-parametric model for stochastic generationof multi-site daily rainfall exhibiting low frequency variability. J. Hydrol. 335,180–193. http://dx.doi.org/10.1016/j.jhydrol.2006.11.011.
Mehrotra, R., Sharma, A., 2007b. Preserving low-frequency variability in generateddaily rainfall sequences. J. Hydrol. 345, 102–120. http://dx.doi.org/10.1016/j.jhydrol.2007.08.003.
Mehrotra, R., Sharma, A., 2010. Development and application of a multisite rainfallstochastic downscaling framework for climate change impact assessment.Water Resour. Res. 46 (W07526), 17. http://dx.doi.org/10.1029/2009WR008423.
Mileham, L., Taylor, R.G., Todd, M., Tindimugaya, C., Thompson, J., 2009. The impactof climate change on groundwater recharge and runoff in a humid, equatorialcatchment: sensitivity of projections to rainfall intensity. Hydrol. Sci. J. 54 (4),727–738. http://dx.doi.org/10.1623/hysj.54.4.727.
Ojha, R., Nagesh Kumar, D., Sharma, A., Mehrotra, R., 2012. Assessing severe droughtand wet events over India in a future climate using nested bias correctionapproach. J. Hydrol. Eng., Am. Soc. Civ. Eng. (ASCE). http://dx.doi.org/10.1061/(ASCE)HE.1943-5584.0000585.
Pierce, D.W., Barnett, T.P., Santer, B.D., Gleckler, P.J., 2009. Selecting global climatemodels for regional climate change studies. Proc. Natl. Acad. Sci. USA 106,8441–8446.
Rajendran, K., Kitoh, A., 2008. Indian summer monsoon in future climate projectionby a super high-resolution global model. Curr. Sci. 95 (11), 1560–1569.
Scott, D.W., 1992. Multivariate Density Estimation: Theory, Practice andVisualization. John Wiley, New York.
Sharma, A., O’Neill, R., 2002. A nonparametric approach for representinginterannual dependence in monthly streamflow sequences. Water Resour.Res. 38 (7), 5.1–5.10.
Sharma, A., Mehrotra, R., Johnson, F., in press. A new framework for modellingfuture hydrologic extremes: nested bias correction as a precursor to stochasticrainfall downscaling. In: Surampalli, Rao Y., Ojha, C.S.P. (Eds.), Green House GasEmissions and Climate Change. American Society of Civil Engineers (ASCE), USA.
Solomon, S., Qin, D., Manning, M., et al., 2007. ‘‘Technical summary’’ in climatechange 2007: physical science basis. In: Solomon, S., Qin, D., Manning, M., Chen,Z., Marquis, M., Averyt, K.B., Tignor, M., Miller, H.L. (Eds.), Contribution ofWorking Group I to the Fourth Assessment Report of the IntergovernmentalPanel on Climate Change. Cambridge University Press, Cambridge, UnitedKingdom and New York, NY, USA.
Stehli9k, J., Bárdossy, A., 2002. Multivariate stochastic downscaling model forgenerating daily precipitation series based on atmospheric circulation. J.Hydrol. 256, 120.
Stephenson, D.B., Douville, H., Rupa Kumar, K., 2001. Searching for a fingerprint ofglobal warming in the Asian summer monsoon. Mausam 52, 213–220.
Toews, M.W., Allen, D.M., 2009. Simulated response of groundwater to predictedrecharge in a semi-arid region using a scenario of modeled climate change.Environ. Res. Lett. 4 (3), 035003. http://dx.doi.org/10.1088/1748- 9326/4/3/035003.
Trenberth, K.E., Dai, A., Rasmussen, R.M., Parsons, D.B., 2003. The changing characterof precipitation. Bull. Am. Meteorol. Soc. 2003 (September), 1205–1217. http://dx.doi.org/10.1175/BAMS-84-9-1205.
Turner, A.G., Inness, P.M., Slingo, J.M., 2007. The effect of doubled CO2 and modelbasic state biases on the monsoon-ENSO system. I: mean response andinterannual variability. Q. J. R. Meteorol. Soc. 133, 1143–1157. http://dx.doi.org/10.1002/qj.82.
Turner, A.G., Slingo, J.M., 2009. Uncertainties in future projections of extremeprecipitation in the Indian monsoon region. Atmos. Sci. Lett. 10(3), 152–158.http://dx.doi.org/10.1002/asl.223. ISSN 1530–261X.
van Roosmalen, L., Sonnenborg, T.O., Jensen, K.H., 2009. Impact of climate and landuse change on the hydrology of a large-scale agricultural catchment. WaterResour. Res. 45, W00A15. http://dx.doi.org/10.1029/2007WR006760.
Vrac, M., Naveau, P., 2007. Stochastic downscaling of precipitation: from dry toheavy rainfalls. Water Resour. Res. 43, W07402. http://dx.doi.org/10.1029/2006WR005308.
Wilby, R.L., Wigley, T.M.L., 1997. Downscaling general circulation model output: areview of methods and limitations. Prog. Phys. Geogr. 21, 530–548.
Wilks, D.S., 1998. Multisite generalization of a daily stochastic precipitationgeneration model. J. Hydrol. 210, 178–191.