assessing liquid calcium as temporary amelioration for ... · assessing liquid calcium as temporary...
TRANSCRIPT
Assessing Liquid Calcium as Temporary Amelioration for
Soil Acidity CLG -1205953-632
2014
Department of Agriculture, Fisheries and Forestry Grant: Caring for Country – Community Landcare Grants 2013/14 Grantee: Dumbleyung Land Conservation District Committee Report Written By: Fiona Martin Trial Location: Nyabing WA
pg. 2
Summary and Background
Liquid calcium products were investigated that could be used within current cropping systems and would not need aggressive incorporation, such as mouldboard ploughing or spading which can potentially expose soils to wind erosion. Liquid calcium products, Calsap and Calbud, were assessed as a temporary amelioration for soil acidity when banded below the seed with Flexi N and granular fertiliser as compared to limesand broadcast prior to seeding.
It was found that Calsap and Calbud did not change the soil pH at 12 weeks after seeding at 0-10cm or 10-20cm. Sampling was conducted where the product was placed (in the furrow under the seed) and also in the interrow as a comparison. Limesand (83.5% neutralising value) when broadcast prior to seeding at 4t/ha increased soil pH at 0-10cm signficiantly at 3 months and 9 months (0.37 to 0.92) after application as compared to the untreated at pH 4.5. Limesand at 2t/ha increased the pH by 0.3 and 0.5 units at the 0-10cm depth, but was only significantly different 9 months after application. Initial findings suggested greater pH change in the interrow (area between furrows) using limesand at 3 month sampling compared to the furrow, likely due to soil movement from the tyned machine. However, at the end of the year the soil pH was higher in the furrow than the interrow which was signficant using limesand at 4t/ha. There was no increase in grain yield, screenings or protein from any applied treatments as liquid products or broadcast limesand, despite a lift in pH by 0.58 and 0.92 in the seeded furrow. Limesand treatments produced the greatest short term economic losses (-$98 to -$202/ha), if all the upfront costs were attributed to year 1. The subsurface pH values in the 10-20cm layer remain below the DAFWA mimimum recommended target of pH 4.8. Further monitoring is planned for the 2015 season to determine pH changes in the top soil and sub soil.

pg. 3
Contents Summary and Background ............................................................................................................................. 2
Aims ................................................................................................................................................................. 4
Methodology ................................................................................................................................................... 4
Treatment List ............................................................................................................................................. 4
Site map ....................................................................................................................................................... 5
Experimental Design .................................................................................................................................... 5
Site Details ................................................................................................................................................... 5
Crop and Sowing Details .............................................................................................................................. 6
Methodology and Assessment Data Scoring Systems ..................................................................................... 7
Results ............................................................................................................................................................. 8
Soil Tests ...................................................................................................................................................... 8
Product Evaluation .................................................................................................................................... 10
Plant Stand Counts .................................................................................................................................... 11
Yield and Return ........................................................................................................................................ 11
Discussion ...................................................................................................................................................... 11
Site comments ........................................................................................................................................... 12
Appendix ........................................................................................................................................................ 13
pg. 4
Aims 1 To investigate the use of liquid calcium in seeding furrows as a short term solution
to addressing soil acidity as compared to surface applied limesand
2 To further monitor after the Caring for Country project completion to identify the
long term benefits of this practice which will include data collection of soil tests,
yield data and surveys.
Methodology
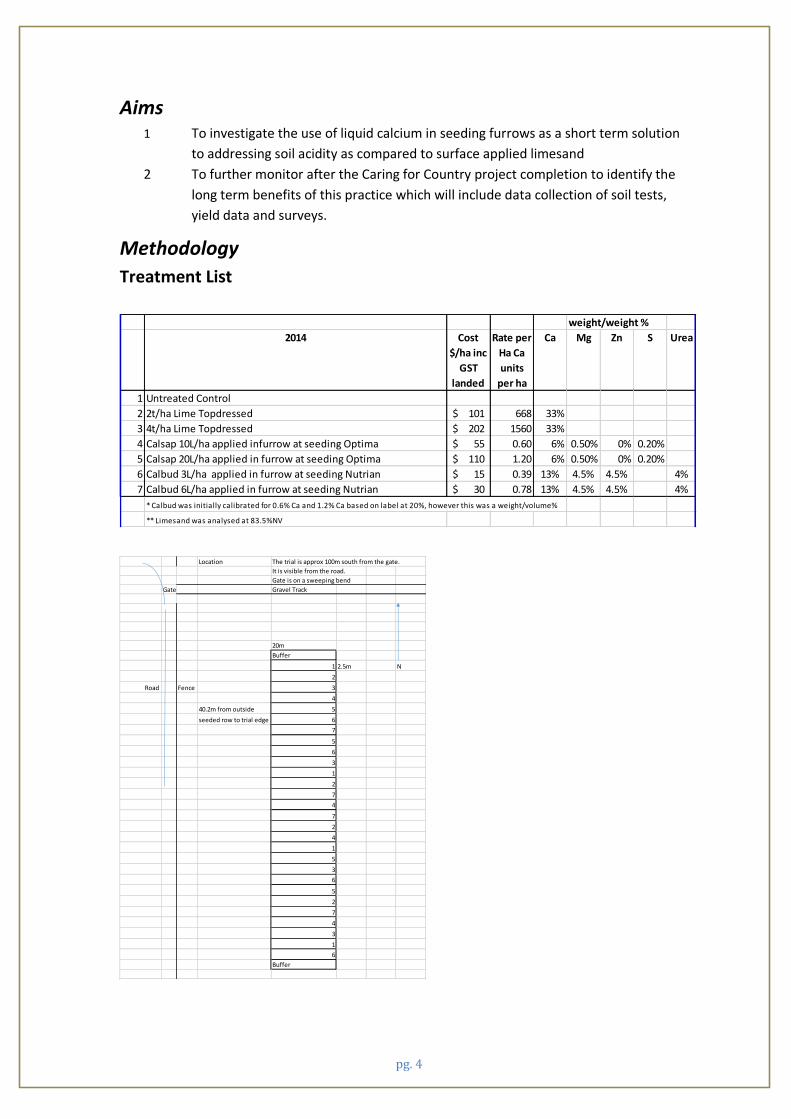
Treatment List
weight/weight %
2014 Cost
$/ha inc
GST
landed
Rate per
Ha Ca
units
per ha
Ca Mg Zn S Urea
1 Untreated Control
2 2t/ha Lime Topdressed 101$ 668 33%
3 4t/ha Lime Topdressed 202$ 1560 33%
4 Calsap 10L/ha applied infurrow at seeding Optima 55$ 0.60 6% 0.50% 0% 0.20%
5 Calsap 20L/ha applied in furrow at seeding Optima 110$ 1.20 6% 0.50% 0% 0.20%
6 Calbud 3L/ha applied in furrow at seeding Nutrian 15$ 0.39 13% 4.5% 4.5% 4%
7 Calbud 6L/ha applied in furrow at seeding Nutrian 30$ 0.78 13% 4.5% 4.5% 4%
* Calbud was initially calibrated for 0.6% Ca and 1.2% Ca based on label at 20%, however this was a weight/volume%
** Limesand was analysed at 83.5%NV
Location The trial is approx 100m south from the gate.
It is visible from the road.
Gate is on a sweeping bend
Gate Gravel Track
20m
Buffer
1 2.5m N
2
Road Fence 3
4
40.2m from outside 5
seeded row to trial edge 6
7
5
6
3
1
2
7
4
7
2
4
1
5
3
6
5
2
7
4
3
1
6
Buffer
pg. 5
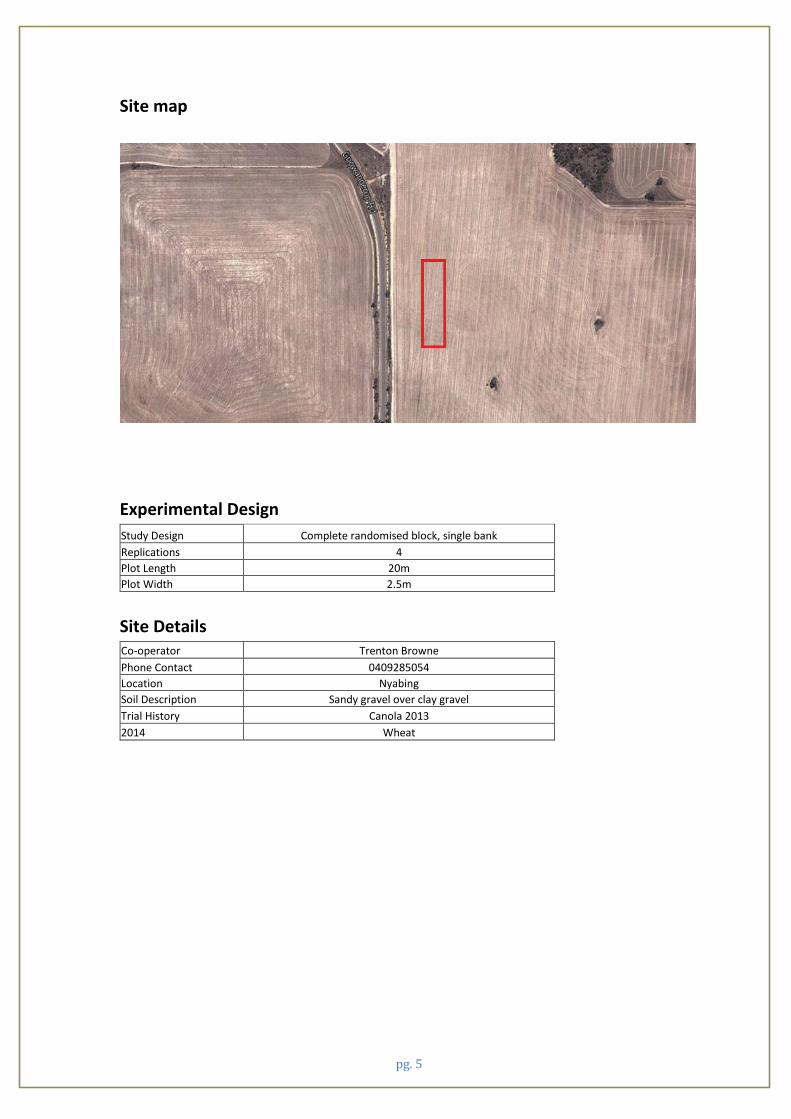
Site map
Experimental Design
Study Design Complete randomised block, single bank
Replications 4
Plot Length 20m
Plot Width 2.5m
Site Details Co-operator Trenton Browne
Phone Contact 0409285054
Location Nyabing
Soil Description Sandy gravel over clay gravel
Trial History Canola 2013
2014 Wheat
pg. 6
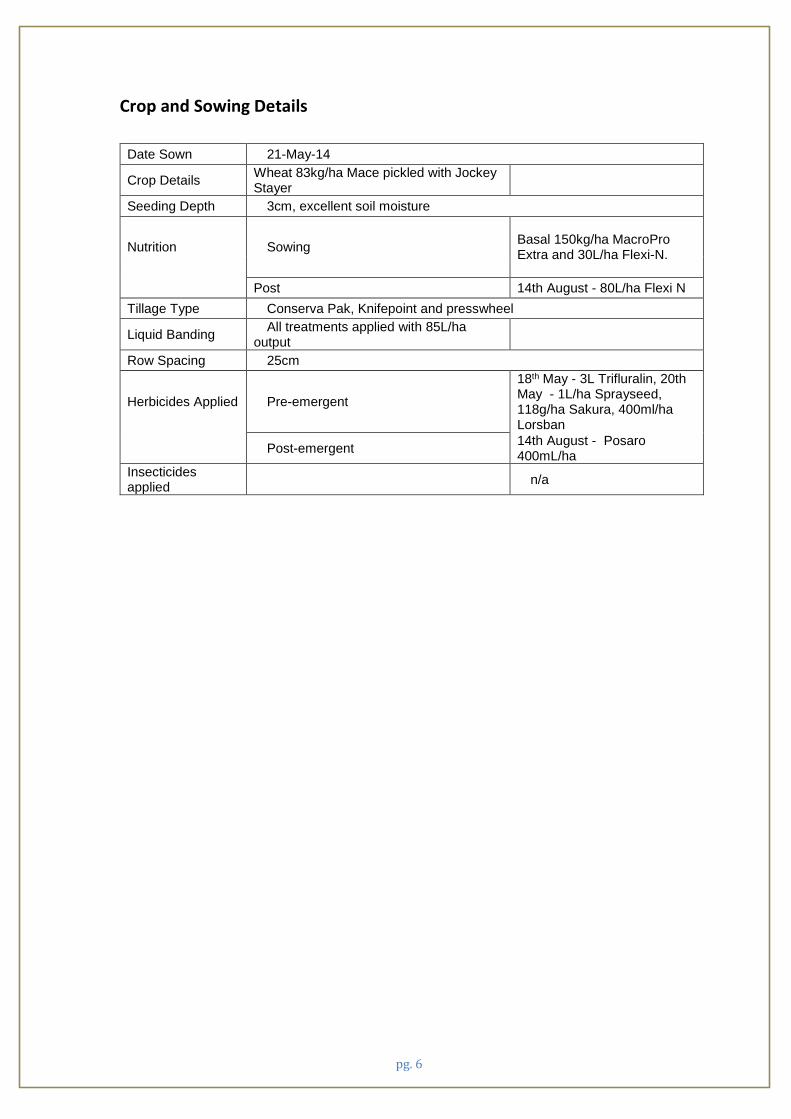
Crop and Sowing Details
Date Sown 21-May-14
Crop Details Wheat 83kg/ha Mace pickled with Jockey Stayer
Seeding Depth 3cm, excellent soil moisture
Nutrition Sowing Basal 150kg/ha MacroPro Extra and 30L/ha Flexi-N.
Post 14th August - 80L/ha Flexi N
Tillage Type Conserva Pak, Knifepoint and presswheel
Liquid Banding All treatments applied with 85L/ha
output
Row Spacing 25cm
Herbicides Applied Pre-emergent
18th May - 3L Trifluralin, 20th May - 1L/ha Sprayseed, 118g/ha Sakura, 400ml/ha Lorsban
Post-emergent 14th August - Posaro 400mL/ha
Insecticides applied
n/a

pg. 7
Methodology and Assessment Data Scoring Systems Notations Used:
UTC= Untreated Check, DAA = Days After Application, DAS = Days After Sowing
Limesand Top dressed Calibrated spreader
Treatment applied Banded Calibrated banded liquid nozzles 3cm below seed
Radio Metric Mapping
Dual EM (Electromagnetic) with inferred soil property depth to clay and water holding capacity (PAWC).
Soil test prior to treatments Air drill with vacuum sampling at 0-10, 10-20, 20-30 and 30-40cm.
Soil test post treatments
Pipe cores 80mm diameter 4 per sample in each plot. Interrow is the ridge between each seeded furrow. The furrow is the lowest point where the machine has placed the seed. Samples taken at 0-10cm and 10-20cm from the ground height.
Plant stand counts 2m row counts x 5 per plot
Harvest Cuts Small plot trial harvester 1 cut per plot
Statistical Analysis DAFWA Genstat
Product Application
All liquid products mixed well and applied in solution with water, then liquid calcium product and Flexi N
at 30L/ha to total an output of 85L/ha. Products were added to water, agitated and then Flexi N was
added. Limesand was spread with a calibrated spreader that was driven over plots approximately 5 weeks
prior to seeding.
Photograph 1: Seeding Equipment utilized for banding liquid products Calsap and Calbud and basal Flexi N.
pg. 8
Results
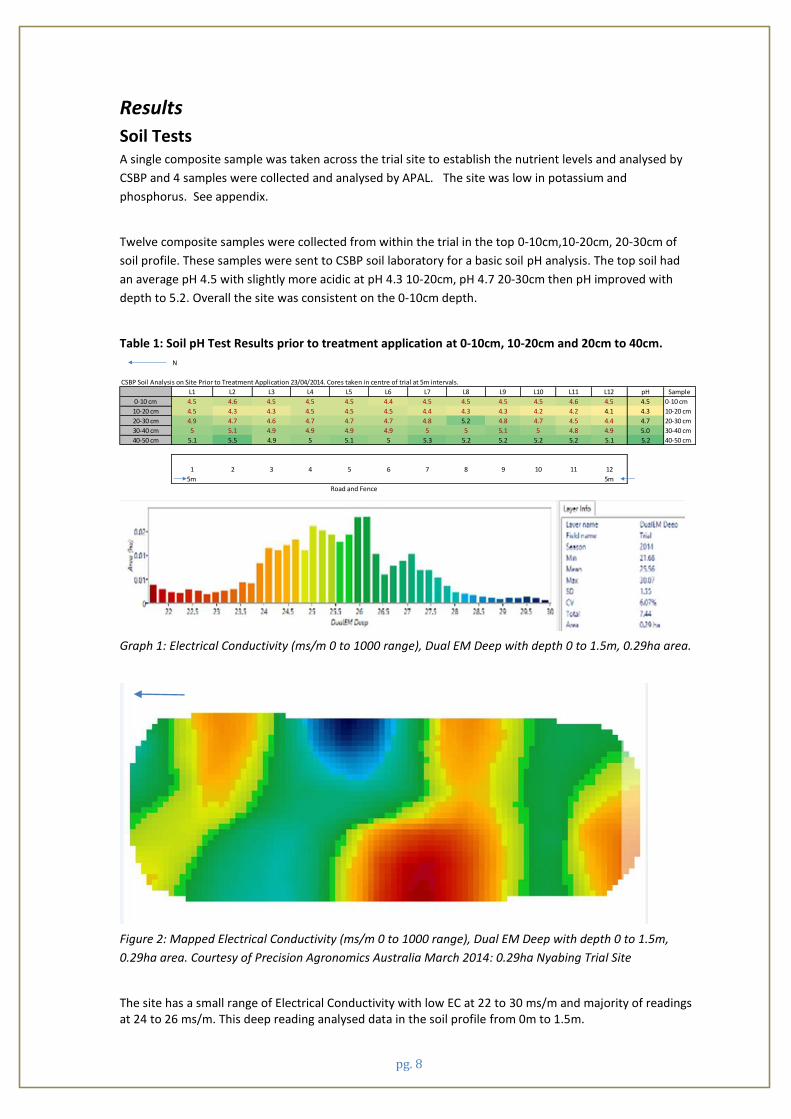
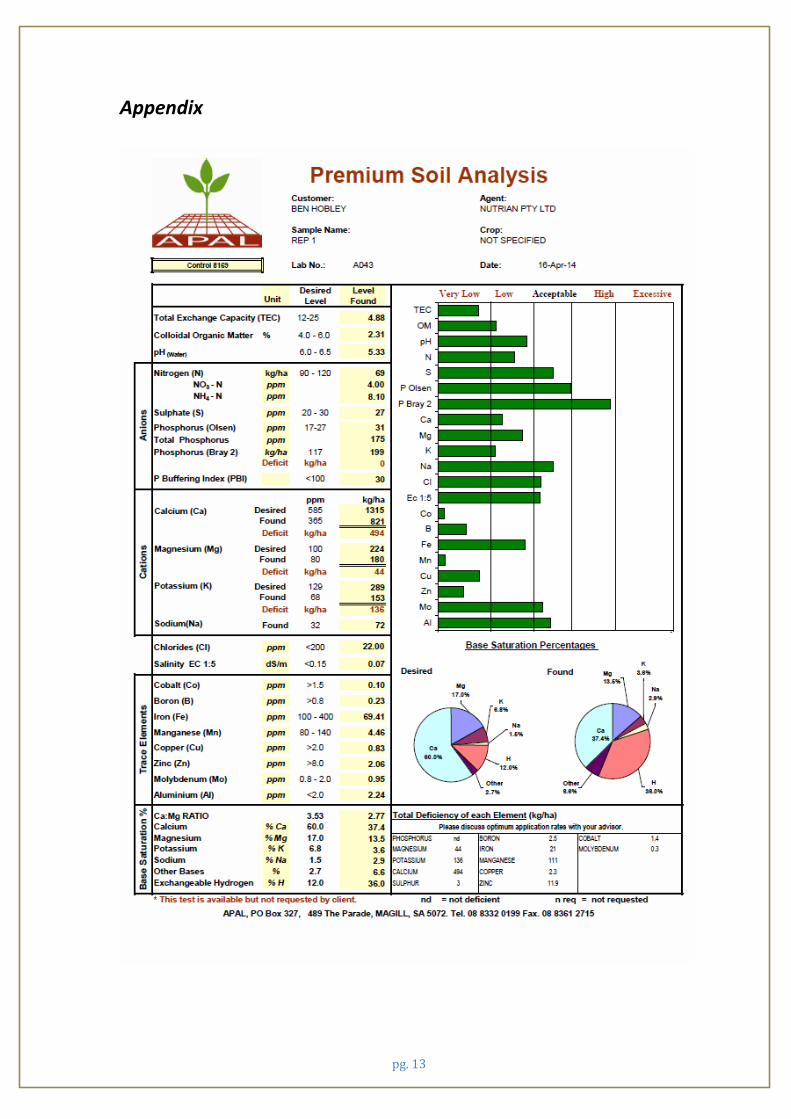
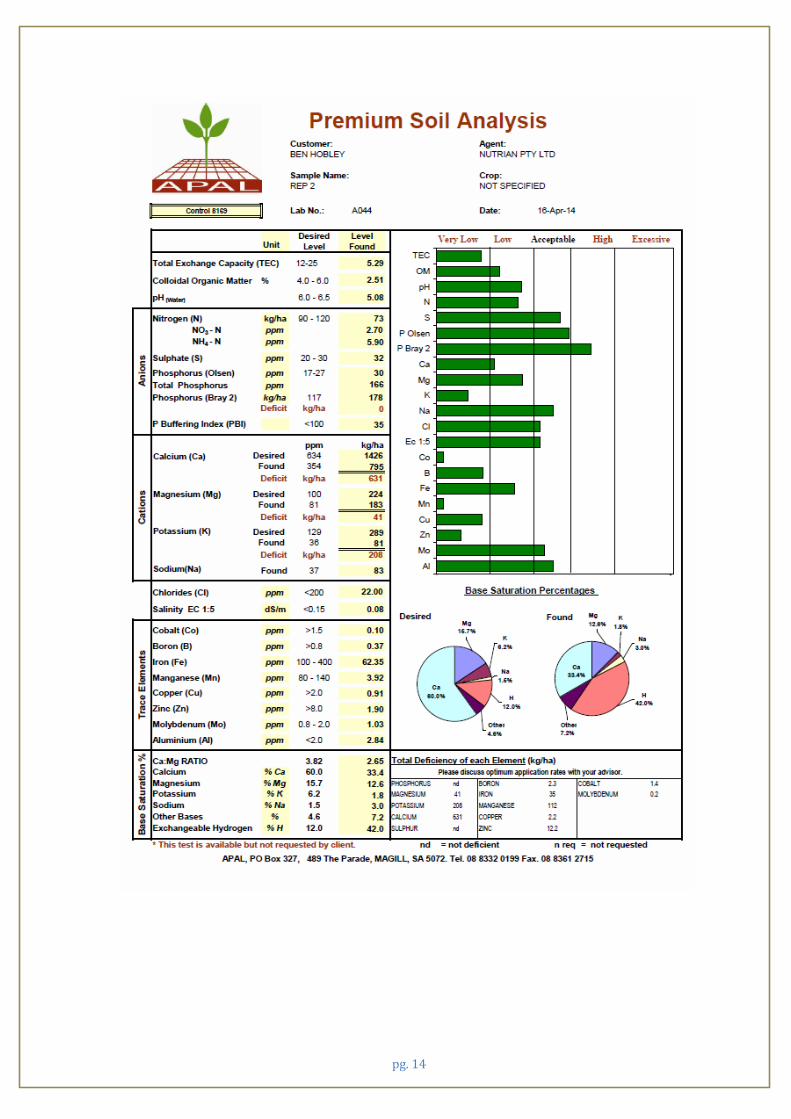
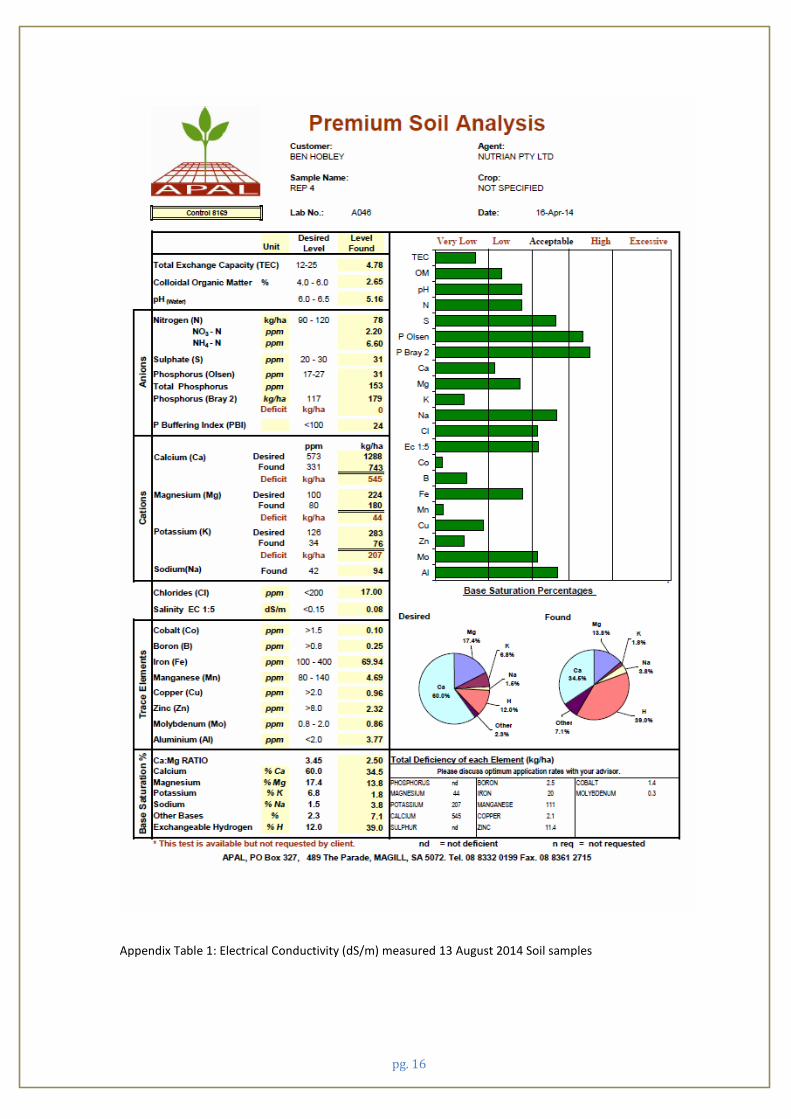
Soil Tests A single composite sample was taken across the trial site to establish the nutrient levels and analysed by
CSBP and 4 samples were collected and analysed by APAL. The site was low in potassium and
phosphorus. See appendix.
Twelve composite samples were collected from within the trial in the top 0-10cm,10-20cm, 20-30cm of
soil profile. These samples were sent to CSBP soil laboratory for a basic soil pH analysis. The top soil had
an average pH 4.5 with slightly more acidic at pH 4.3 10-20cm, pH 4.7 20-30cm then pH improved with
depth to 5.2. Overall the site was consistent on the 0-10cm depth.
Table 1: Soil pH Test Results prior to treatment application at 0-10cm, 10-20cm and 20cm to 40cm.
Graph 1: Electrical Conductivity (ms/m 0 to 1000 range), Dual EM Deep with depth 0 to 1.5m, 0.29ha area.
Figure 2: Mapped Electrical Conductivity (ms/m 0 to 1000 range), Dual EM Deep with depth 0 to 1.5m,
0.29ha area. Courtesy of Precision Agronomics Australia March 2014: 0.29ha Nyabing Trial Site
The site has a small range of Electrical Conductivity with low EC at 22 to 30 ms/m and majority of readings at 24 to 26 ms/m. This deep reading analysed data in the soil profile from 0m to 1.5m.
N
CSBP Soil Analysis on Site Prior to Treatment Application 23/04/2014. Cores taken in centre of trial at 5m intervals.
L1 L2 L3 L4 L5 L6 L7 L8 L9 L10 L11 L12 pH Sample
0-10 cm 4.5 4.6 4.5 4.5 4.5 4.4 4.5 4.5 4.5 4.5 4.6 4.5 4.5 0-10 cm
10-20 cm 4.5 4.3 4.3 4.5 4.5 4.5 4.4 4.3 4.3 4.2 4.2 4.1 4.3 10-20 cm
20-30 cm 4.9 4.7 4.6 4.7 4.7 4.7 4.8 5.2 4.8 4.7 4.5 4.4 4.7 20-30 cm
30-40 cm 5 5.1 4.9 4.9 4.9 4.9 5 5 5.1 5 4.8 4.9 5.0 30-40 cm
40-50 cm 5.1 5.5 4.9 5 5.1 5 5.3 5.2 5.2 5.2 5.2 5.1 5.2 40-50 cm
1 2 3 4 5 6 7 8 9 10 11 12
5m 5m
Road and Fence
pg. 9
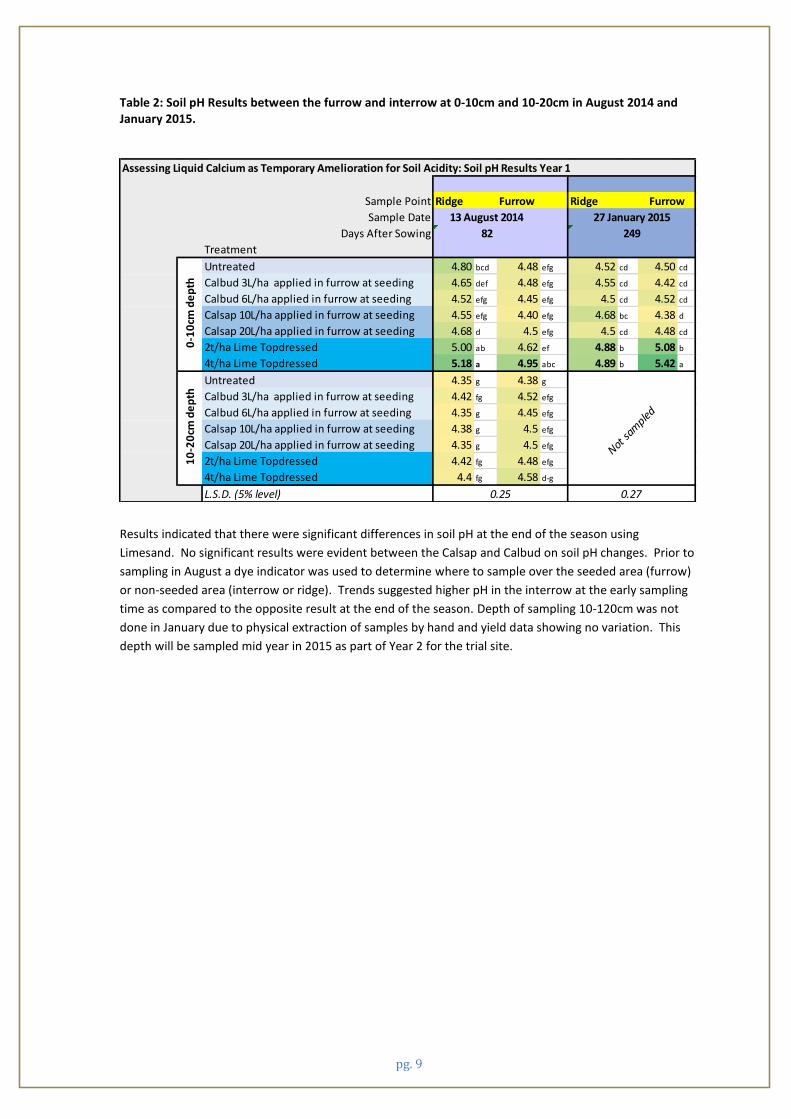
Table 2: Soil pH Results between the furrow and interrow at 0-10cm and 10-20cm in August 2014 and January 2015.
Results indicated that there were significant differences in soil pH at the end of the season using
Limesand. No significant results were evident between the Calsap and Calbud on soil pH changes. Prior to
sampling in August a dye indicator was used to determine where to sample over the seeded area (furrow)
or non-seeded area (interrow or ridge). Trends suggested higher pH in the interrow at the early sampling
time as compared to the opposite result at the end of the season. Depth of sampling 10-120cm was not
done in January due to physical extraction of samples by hand and yield data showing no variation. This
depth will be sampled mid year in 2015 as part of Year 2 for the trial site.
Assessing Liquid Calcium as Temporary Amelioration for Soil Acidity: Soil pH Results Year 1
Sample Point Ridge Furrow Ridge
Sample Date
Days After Sowing
Treatment
Untreated 4.80 bcd 4.48 efg 4.52 cd 4.50 cd
Calbud 3L/ha applied in furrow at seeding 4.65 def 4.48 efg 4.55 cd 4.42 cd
Calbud 6L/ha applied in furrow at seeding 4.52 efg 4.45 efg 4.5 cd 4.52 cd
Calsap 10L/ha applied in furrow at seeding 4.55 efg 4.40 efg 4.68 bc 4.38 d
Calsap 20L/ha applied in furrow at seeding 4.68 d 4.5 efg 4.5 cd 4.48 cd
2t/ha Lime Topdressed 5.00 ab 4.62 ef 4.88 b 5.08 b
4t/ha Lime Topdressed 5.18 a 4.95 abc 4.89 b 5.42 a
Untreated 4.35 g 4.38 g
Calbud 3L/ha applied in furrow at seeding 4.42 fg 4.52 efg
Calbud 6L/ha applied in furrow at seeding 4.35 g 4.45 efg
Calsap 10L/ha applied in furrow at seeding 4.38 g 4.5 efg
Calsap 20L/ha applied in furrow at seeding 4.35 g 4.5 efg
2t/ha Lime Topdressed 4.42 fg 4.48 efg
4t/ha Lime Topdressed 4.4 fg 4.58 d-g
L.S.D. (5% level)
10
-20
cm d
ep
th
Not sa
mpled
0.25 0.27
Furrow
13 August 2014 27 January 2015
82 249
0-1
0cm
de
pth
pg. 10
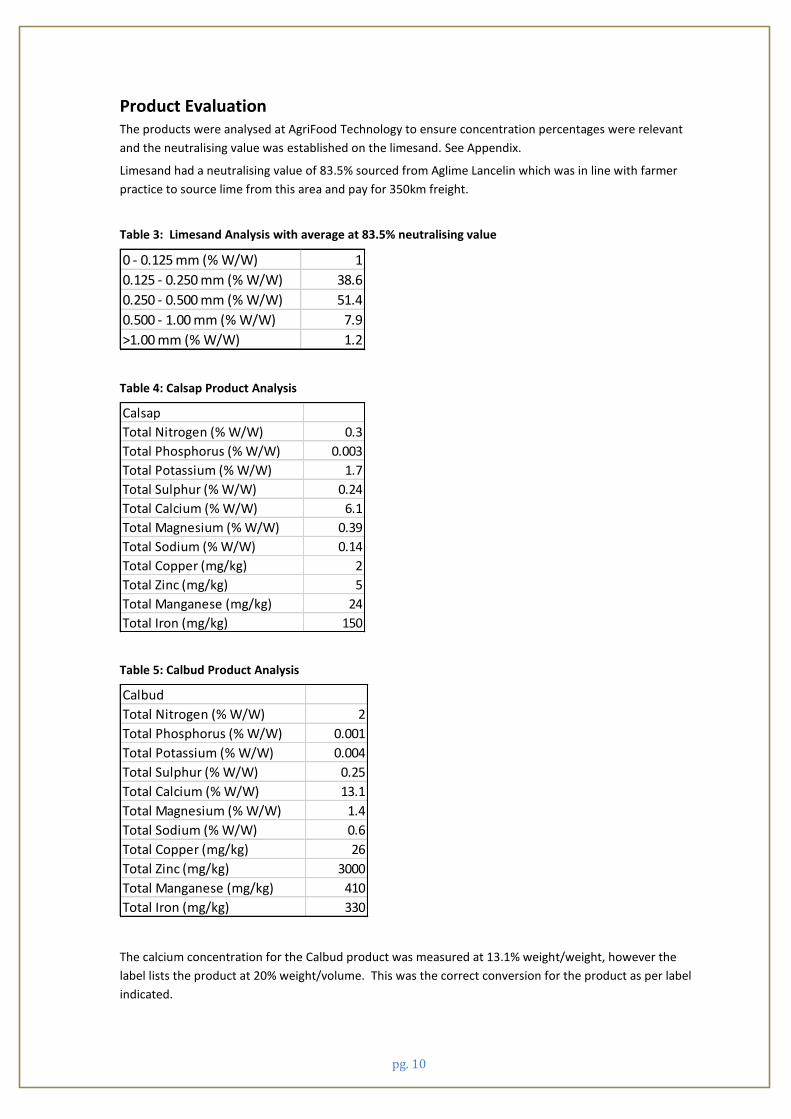
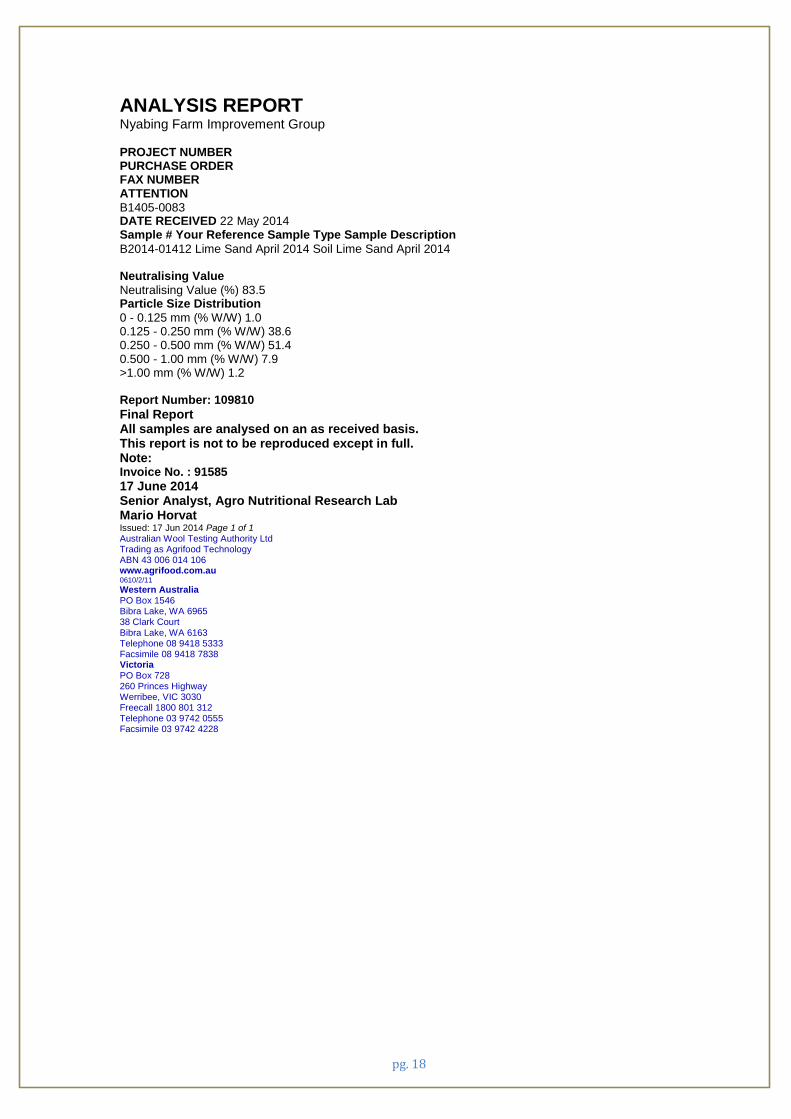
Product Evaluation The products were analysed at AgriFood Technology to ensure concentration percentages were relevant
and the neutralising value was established on the limesand. See Appendix.
Limesand had a neutralising value of 83.5% sourced from Aglime Lancelin which was in line with farmer
practice to source lime from this area and pay for 350km freight.
Table 3: Limesand Analysis with average at 83.5% neutralising value
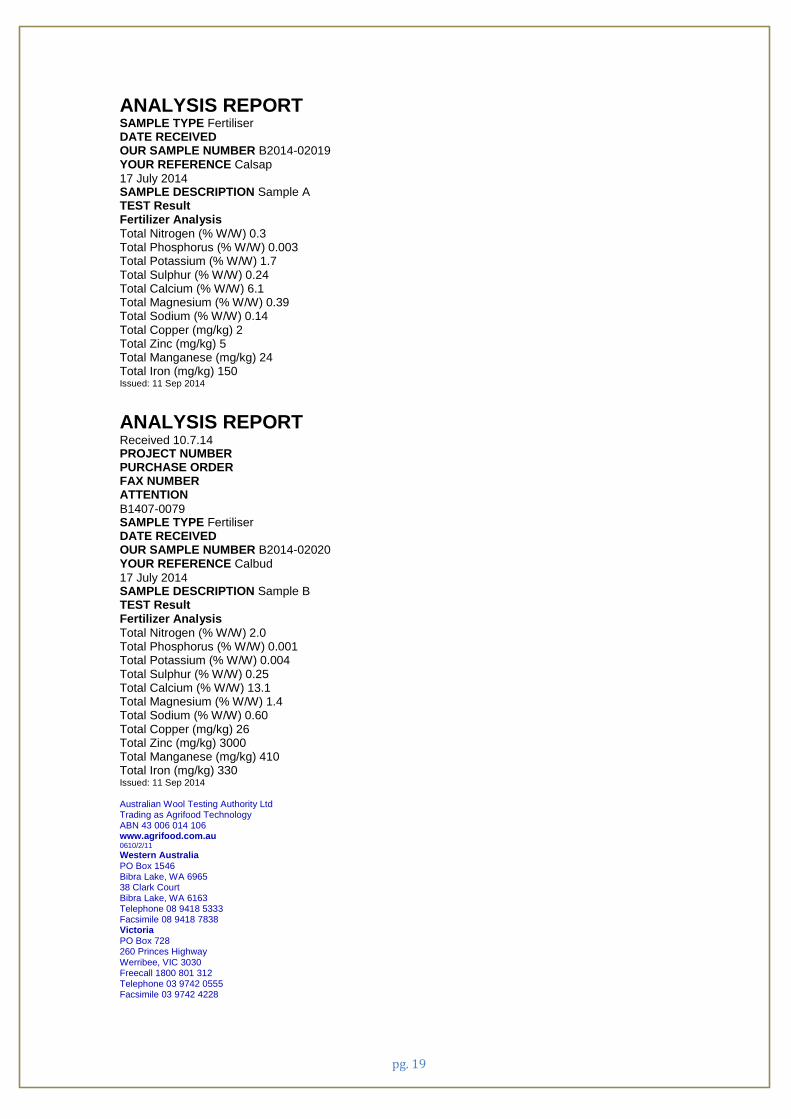
Table 4: Calsap Product Analysis
Table 5: Calbud Product Analysis
The calcium concentration for the Calbud product was measured at 13.1% weight/weight, however the
label lists the product at 20% weight/volume. This was the correct conversion for the product as per label
indicated.
0 - 0.125 mm (% W/W) 1
0.125 - 0.250 mm (% W/W) 38.6
0.250 - 0.500 mm (% W/W) 51.4
0.500 - 1.00 mm (% W/W) 7.9
>1.00 mm (% W/W) 1.2
Calsap
Total Nitrogen (% W/W) 0.3
Total Phosphorus (% W/W) 0.003
Total Potassium (% W/W) 1.7
Total Sulphur (% W/W) 0.24
Total Calcium (% W/W) 6.1
Total Magnesium (% W/W) 0.39
Total Sodium (% W/W) 0.14
Total Copper (mg/kg) 2
Total Zinc (mg/kg) 5
Total Manganese (mg/kg) 24
Total Iron (mg/kg) 150
Calbud
Total Nitrogen (% W/W) 2
Total Phosphorus (% W/W) 0.001
Total Potassium (% W/W) 0.004
Total Sulphur (% W/W) 0.25
Total Calcium (% W/W) 13.1
Total Magnesium (% W/W) 1.4
Total Sodium (% W/W) 0.6
Total Copper (mg/kg) 26
Total Zinc (mg/kg) 3000
Total Manganese (mg/kg) 410
Total Iron (mg/kg) 330

pg. 11
Plant Stand Counts Five x two metre row plant stand counts were conducted at each tiny tag location throughout the trial.
These numbers were then converted to plants/m2. There was no treatment effect on plant establishment.
Table 6: Plant stand counts 23 June 2014
Treatment Plant Counts
(m2)
Untreated 203
Calbud 3L/ha applied in furrow at seeding 219
Calbud 6L/ha applied in furrow at seeding 218
Calsap 10L/ha applied in furrow at seeding 212
Calsap 20L/ha applied in furrow at seeding 207
2t/ha Lime Topdressed 210
4t/ha Lime Topdressed 204
LSD (5% level) 17
nsd
Yield and Return Table 7: Treatment Benefit/Loss with full costing to Year 1 based on product purchase and freight by
yield (excludes application cost)
The trial yields were similar to yields experienced in the grower’s paddock, having seeded the trial 4 days
after the grower. There were no significant differences in yield results. Due to the cost of lime upfront,
there was considerable loss in year 1 in the wheat rotation if all costs were attributed to year 1 opposed to
dividing over 3 to 5 years.
Discussion Findings suggested that there was no change on soil pH at 12 weeks after seeding at 0-10cm or 10-20cm using liquid products that contain calcium. Limesand (83.5% neutralising value) when broadcast prior to seeding at 2t/ha and 4t/ha increased soil pH signficiantly upto pH 5.19 at the early soil sampling and pH 5.42 at the end of season sampling.
Treatment Cost
Net
Benefit/Loss
from Treatment
in Year 1
Treatment
$/ha inc
Freight, GST
exc
Variance from
UTC: $661 gross
= UTC t/ha Protein % Screenings %
Untreated -$ -$ 2.28 10.12% 1.96%
Calbud 3L/ha applied in furrow at seeding 15.18$ -$ 2.33 10.06% 1.99%
Calbud 6L/ha applied in furrow at seeding 30.36$ (10.00)$ 2.35 10.12% 1.93%
Calsap 10L/ha applied in furrow at seeding 55.00$ (52.00)$ 2.29 10.22% 1.95%
Calsap 20L/ha applied in furrow at seeding 110.00$ (95.00)$ 2.33 10.15% 1.88%
2t/ha Lime Topdressed 101.20$ (98.00)$ 2.29 10.05% 1.88%
4t/ha Lime Topdressed 202.40$ (202.00)$ 2.28 10.12% 1.90%
LSD (5% level) 0.075 0.22 0.25%
Treatments costed to Nyabing, Lime Freight $/t nsd nsd nsd
* Grain Cash price assumption FIS $290/t
Yield Data
pg. 12
Limesand applied at 4t/ha increased the soil pH to 5.42, which was signficiantly greater than 2t/ha at pH 5.08 when sampled infurrow at the end of the season. There were notable differences between sampling in the interrow or the furrow surface profile which was dependant on sampling time. Early soil samples showed greater pH change in the interrow using limesand at 12 weeks after seeding compared to the furrow, which is likely due to soil movement from the tyned machine throwing the limesand into the interrow. However, at the end of the year the soil pH was signficantly higher using limesand at 4t/ha in the furrow which could be attributed to soil movement back into the lower part of the surface profile. There was no increase in grain yield, screenings or protein from any treatment. The limesand was the most expensive soil ameliorate option at $101/t and $202/t for 2t/ha and 4t/ha (which includes freight but not application cost), despite a lift in pH by in the furrow. Soil pH was measured prior to trial establishment showing the acidic topsoil and improvement with pH at
depth. The 10-20cm band was the most acidic layer at pH 4.3 but at depth the site was pH 5.2. The site
was also low in potassium which was addressed using a starter fertiliser.
Site comments The site was well maintained throughout the year with minimal weeds. A fungicide application on ear
emergence was applied. The site lacked fertility in particular phosphorus and potassium however this was
considered consistent across all treatments. The rainfall was above average (350.4mm April til October)
for the year and the plants were not under moisture stress for any lengthy duration of the growing season.
pg. 13
Appendix
pg. 14

pg. 15
pg. 16
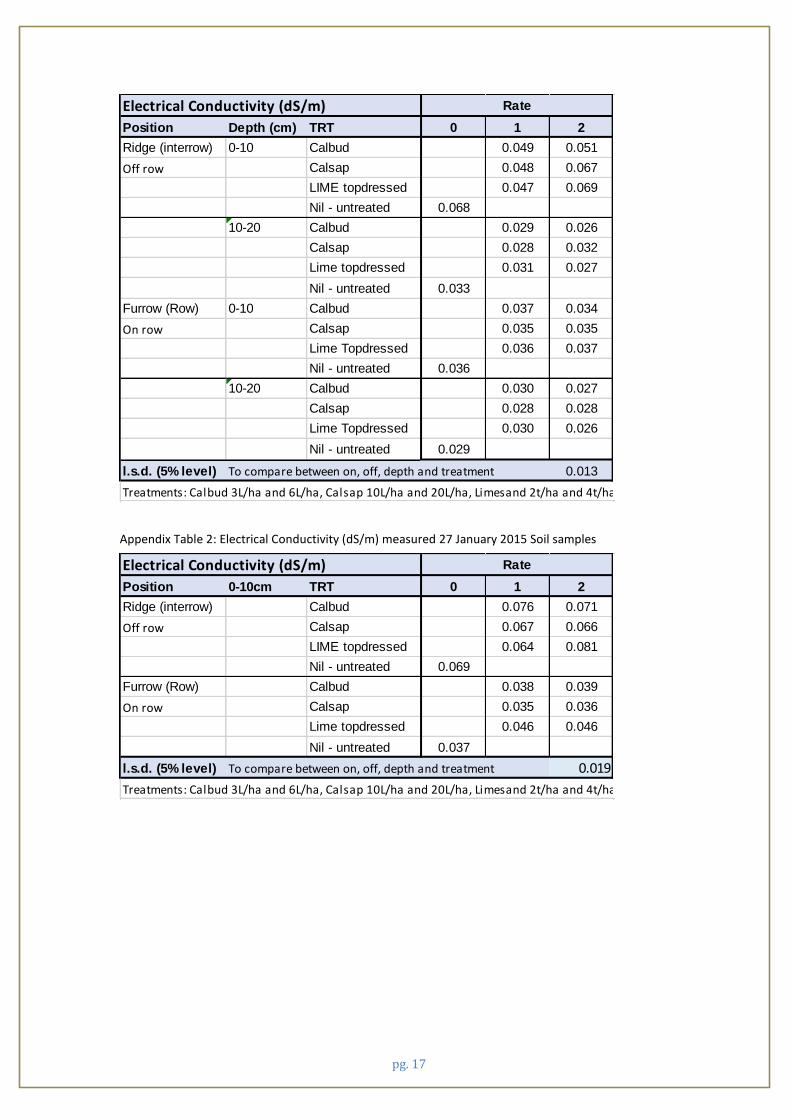
Appendix Table 1: Electrical Conductivity (dS/m) measured 13 August 2014 Soil samples
pg. 17
Appendix Table 2: Electrical Conductivity (dS/m) measured 27 January 2015 Soil samples
Electrical Conductivity (dS/m)
Position Depth (cm) TRT 0 1 2
Ridge (interrow) 0-10 Calbud 0.049 0.051
Off row Calsap 0.048 0.067
LIME topdressed 0.047 0.069
Nil - untreated 0.068
10-20 Calbud 0.029 0.026
Calsap 0.028 0.032
Lime topdressed 0.031 0.027
Nil - untreated 0.033
Furrow (Row) 0-10 Calbud 0.037 0.034
On row Calsap 0.035 0.035
Lime Topdressed 0.036 0.037
Nil - untreated 0.036
10-20 Calbud 0.030 0.027
Calsap 0.028 0.028
Lime Topdressed 0.030 0.026
Nil - untreated 0.029
l.s.d. (5% level) To compare between on, off, depth and treatment 0.013
Treatments: Calbud 3L/ha and 6L/ha, Calsap 10L/ha and 20L/ha, Limesand 2t/ha and 4t/ha.
Rate
Electrical Conductivity (dS/m)
Position 0-10cm TRT 0 1 2
Ridge (interrow) Calbud 0.076 0.071
Off row Calsap 0.067 0.066
LIME topdressed 0.064 0.081
Nil - untreated 0.069
Furrow (Row) Calbud 0.038 0.039
On row Calsap 0.035 0.036
Lime topdressed 0.046 0.046
Nil - untreated 0.037
l.s.d. (5% level) To compare between on, off, depth and treatment 0.019
Treatments: Calbud 3L/ha and 6L/ha, Calsap 10L/ha and 20L/ha, Limesand 2t/ha and 4t/ha.
Rate
pg. 18
ANALYSIS REPORT Nyabing Farm Improvement Group PROJECT NUMBER PURCHASE ORDER FAX NUMBER ATTENTION
B1405-0083 DATE RECEIVED 22 May 2014 Sample # Your Reference Sample Type Sample Description
B2014-01412 Lime Sand April 2014 Soil Lime Sand April 2014 Neutralising Value
Neutralising Value (%) 83.5 Particle Size Distribution
0 - 0.125 mm (% W/W) 1.0 0.125 - 0.250 mm (% W/W) 38.6 0.250 - 0.500 mm (% W/W) 51.4 0.500 - 1.00 mm (% W/W) 7.9 >1.00 mm (% W/W) 1.2 Report Number: 109810
Final Report All samples are analysed on an as received basis. This report is not to be reproduced except in full. Note: Invoice No. : 91585
17 June 2014 Senior Analyst, Agro Nutritional Research Lab Mario Horvat Issued: 17 Jun 2014 Page 1 of 1 Australian Wool Testing Authority Ltd Trading as Agrifood Technology ABN 43 006 014 106 www.agrifood.com.au 0610/2/11
Western Australia PO Box 1546 Bibra Lake, WA 6965 38 Clark Court Bibra Lake, WA 6163 Telephone 08 9418 5333 Facsimile 08 9418 7838 Victoria PO Box 728 260 Princes Highway Werribee, VIC 3030 Freecall 1800 801 312 Telephone 03 9742 0555 Facsimile 03 9742 4228
pg. 19
ANALYSIS REPORT SAMPLE TYPE Fertiliser DATE RECEIVED OUR SAMPLE NUMBER B2014-02019 YOUR REFERENCE Calsap
17 July 2014 SAMPLE DESCRIPTION Sample A TEST Result Fertilizer Analysis
Total Nitrogen (% W/W) 0.3 Total Phosphorus (% W/W) 0.003 Total Potassium (% W/W) 1.7 Total Sulphur (% W/W) 0.24 Total Calcium (% W/W) 6.1 Total Magnesium (% W/W) 0.39 Total Sodium (% W/W) 0.14 Total Copper (mg/kg) 2 Total Zinc (mg/kg) 5 Total Manganese (mg/kg) 24 Total Iron (mg/kg) 150 Issued: 11 Sep 2014
ANALYSIS REPORT Received 10.7.14 PROJECT NUMBER PURCHASE ORDER FAX NUMBER ATTENTION
B1407-0079 SAMPLE TYPE Fertiliser DATE RECEIVED OUR SAMPLE NUMBER B2014-02020 YOUR REFERENCE Calbud
17 July 2014 SAMPLE DESCRIPTION Sample B TEST Result Fertilizer Analysis
Total Nitrogen (% W/W) 2.0 Total Phosphorus (% W/W) 0.001 Total Potassium (% W/W) 0.004 Total Sulphur (% W/W) 0.25 Total Calcium (% W/W) 13.1 Total Magnesium (% W/W) 1.4 Total Sodium (% W/W) 0.60 Total Copper (mg/kg) 26 Total Zinc (mg/kg) 3000 Total Manganese (mg/kg) 410 Total Iron (mg/kg) 330 Issued: 11 Sep 2014 Australian Wool Testing Authority Ltd Trading as Agrifood Technology ABN 43 006 014 106 www.agrifood.com.au 0610/2/11
Western Australia PO Box 1546 Bibra Lake, WA 6965 38 Clark Court Bibra Lake, WA 6163 Telephone 08 9418 5333 Facsimile 08 9418 7838 Victoria PO Box 728 260 Princes Highway Werribee, VIC 3030 Freecall 1800 801 312 Telephone 03 9742 0555 Facsimile 03 9742 4228

pg. 20