assessing local minimum income programmes in brazil · assessing local minimum income programmes in...
TRANSCRIPT

Assessing Local Minimum Income Programmes in Brazil
ILO# - World Bank Agreement
by
By Lena Lavinas (Coordinator, IFP/SES) Maria Lígia Barbosa (IFCS-UFRJ)
Octávio Tourinho (IPEA)
With the collaboration of : Mariana Bittar Eduardo Garcia Daniele Manão Marcelo Nicoll
International Labour Office, Geneva
June 2001
# ILO: Brazil Regional Office, InFocus Programme on Socio -Economic Security
For more information on the InFocus Programme on Socio -Economic Security, please see the related web page http://www.ilo.org/ses or contact the Secretariat at Tel: +41.22.799.8893, Fax: +41.22.799.7123 or E-mail: [email protected]

ii
Copyright © International Labour Organization 2001
Publications of the International Labour Office enjoy copyright under Protocol 2 of the Universal Copyright Convention. Nevertheless, short excerpts from them may be reproduced without authorization, on condition that the source is indicated. For rights of reproduction or translation, application should be made to the ILO Publications Bureau (Rights and Permissions), International Labour Office, CH-1211 Geneva 22, Switzerland. The International Labour Office welcomes such applications.
Libraries, institutions and other users registered in the United Kingdom with the Copyright Licensing Agency, 90 Tottenham Court Road, London W1P 9HE (Fax: +44 171436 3986), in the United States with the Copyright Clearance Center, 222 Rosewood Drive, Danvers, MA 01923 (Fax: +1 508 750 4470), or in other countries with associated Reproduction Rights Organizations, may make photocopies in accordance with the licences issued to them for this purpose.
ISBN 92-2-112536-X
First published 2001
The designations employed in ILO publications, which are in conformity with United Nations practice, and the presentation of material therein do not imply the expression of any opinion whatsoever on the part of the International Labour Office concerning the legal status of any country, area or territory or of its authorities, or concerning the delimitation of its frontiers.
The responsibility for opinions expressed in signed articles, studies and other contributions rests solely with their authors, and publication does not constitute an endorsement by the International Labour Office of the opinions expressed in them.
Reference to names of firms and commercial products and processes does not imply their endorsement by the International Labour Office, and any failure to mention a particular firm, commercial product or process is not a sign of disapproval.
ILO publications can be obtained through major booksellers or ILO local offices in many countries, or direct from ILO Publications, International Labour Office, CH-1211 Geneva 22, Switzerland. Catalogues or lists of new publications are available free of charge from the above address.
Printed by the International Labour Office. Geneva, Switzerland

iii
Acknowledgements
We wish to thank the Recife Municipal Department of Education, responsible for the Bolsa-Escola (Scholarship) Programme. Its staff participated actively in all phases of the work, facilitating and guaranteeing access to the necessary information and speeding up its processing. Our very special thanks go to Maria Carmelita Passo da Rosa and to Carlos Antonio Oliveira Machado, whose dedication to the Programme and to the poor children of Recife have made this work a reality.
We also thank Octávio Tourinho, Co-ordinator of the Macro-Economics Department at IPEA, who once again contributed all his talent and rigorous discipline to the scientific quality this survey of a crucial social programme.
Special acknowledgements are due to the Brazil Office of the International Labour Organisation and the World Bank, both of which funded this research and to Christopher Peterson for the English translation.


v
Contents
Acknowledgements ................................ ................................ ................................ ............... iii
Executive Summary................................ ................................ ................................ .............. vii
Do Bolsa-Escola programmes have positive impact on poverty reduction? ..................... vii
1. Introduction................................ ................................ ................................ ..................1
2. The Recife Scholarship Programme ................................ ................................ ...............4
2.1 Design and legislation ................................ ................................ ..........................4 2.2 Coverage of the target population ................................ ................................ .........7 2.3 Coverage of schools ................................ ................................ ............................ 9 2.4 The Programme’s cost................................ ................................ .......................11
3. Evaluation of the programme’s impact on beneficiary families ................................ ......18 3.1 Objectives of the evaluation ................................ ................................ ...............18 3.2 Universe of analysis for the evaluation ................................ ................................ 19 3.3 Evaluation of the programme’s impact on beneficiary families .............................21 3.4 Educational impacts................................ ................................ ...........................25 3.5 Social impacts................................ ................................ ................................ ...42 3.6 Impacts in reducing child labour and expanding citizenship ................................ .47
4. Conclusions and Recommendations ................................ ................................ ............ 50 4.1 Conclusions ................................ ................................ ................................ ......50 4.2 Recommendations for action by the Recife City Government:..............................53 4.3 Recommendations for a national programme ................................ .......................54
References ................................ ................................ ................................ ...........................56
Appendices ................................ ................................ ................................ ..........................57 Appendix 1. Registration form................................ ................................ .....................57 Appendix 2. Information on schools in the sample ................................ ........................ 64 Appendix 3. Survey to evaluate the Scholarship Programme Office of the Mayor,
Recife Questionnaire for School Administrators ................................ .......67 Appendix 4. Survey to Evaluate Scholarship Programme Office of the Mayor,
Recife Questionnaire for Teachers................................ ...........................71 Appendix 5. Mathematic Test – 3rd Grade................................ ................................ .....74 Appendix 6. Cultural practices and values related to schools ................................ ..........77
List of tables
Table 1. Number of poor families in Recife................................ ................................ ...........8 Table 2. Coverage of the Recife Scholarship Programme ................................ .......................9 Table 3. Repetition rates and drop-out (%) in Recife, by political and administrative
sub-division (RPA). ................................ ................................ ..............................11 Table 4. Trend in social spending and total budget spending, Recife City Government ...........12 Table 5. Social spending with impact on poverty ................................ ................................ .13 Table 6. Distribution of budget spending with an impact on poverty ................................ .....14 Table 7. Indicators of social spending in Recife................................ ................................ ...15 Table 8. Scholarship Programme spending as a percentage of other outlays ...........................15 Table 9. Calculation of uncommitted net revenue (R$)................................ .........................16 Table 10. Simulated effects of different school grants on government revenue ........................ 17

vi
Table 11. Total numbers in the data bases ................................ ................................ .............21 Table 12. Characteristics of beneficiary families (1,515) in Recife Scholarship
Programme at T0 ................................ ................................ ................................ ..22 Table 13. Parents’ situation in work market ................................ ................................ ..........24 Table 14. Test scores by age ................................ ................................ ................................ 28 Table 15. Mean age of pupils with and without school grants in the school sample ..................28 Table 16. Performance by gender: overall and pupils with school grants ................................ .29 Table 17. Mean test scores according to mother’s position in the labour market .......................30 Table 18. Per capita family income ................................ ................................ .......................30 Table 19. Mean test score according to per capit a family income quintile ................................ 31 Table 20. Mean scores according to mother’s level of schooling................................ .............31 Table 21. Mean scores according to participation in Scholarship Programme and
individual school................................ ................................ ................................ ..33 Table 22. Performance according to participation in the Scholarship Programme and
class ................................ ................................ ................................ .................... 34 Table 23. Construction of the “Quality of School” variable ................................ .................... 35 Table 24. Construction of the “Quality of Class” variable ................................ ......................36 Table 25. Construction of the “Pupil’s school record” variable ................................ ...............36 Table 26. Basic statistics on variables in the sample ................................ ..............................38 Table 27. Mean value of variables ................................ ................................ ........................ 39 Table 28. Logit estimation for probability of having a school grant................................ .........40 Table 29. Results of estimation of the regression equation for test score................................ ..41 Table 30. Variation in mean per capita family income ................................ ...........................44 Table 31. Number of families with PCFI < R$40.00 (not including stipend) ............................ 44 Table 32. Mean PCFI gap of families remaining below the R$40.00 line ................................ 44 Table 33. Origin of other benefits ................................ ................................ .........................48 Table 34 Child labour, beneficiary families ................................ ................................ ..........49
List of graphs
Graph 1. Distribution of the poorest 40 per cent of the population in Recife according to per capita family income ................................ ................................ .........................8
Graph 2. Recife : distribution of children ages 7 to 15 years with grants, by grade in primary school and age ................................ ................................ .........................25
Graph 3. Histogram and statistics of the “Pupil’s school record” variable ...............................37 Graph 4. Histogram of the income variable ................................ ................................ .........38 Graph 5. Residuals from the efficacy equation ................................ ................................ .....42 Graph 6. Distribution of beneficiary families in the Recife Scholarship Programme
according to PCFI, at T0 and T1 ................................ ................................ .............43 Graph 7. Distribution of beneficiary families if the Recife Scholarship Programme
according to PCFI T1 : families from common data base, T0 and T1 ..........................46 Graph 8a Child labour: 7-9 year old dependents of beneficiary families at T1 ..........................48 Graph 8b Child labour: 10-14 year old dependents of beneficiary families at T1 ......................49

vii
Executive Summary
Do Bolsa-Escola programmes have positive impact on poverty reduction?
An in-depth evaluation was conducted by the Institute for Applied Economic Research - IPEA, in collaboration with the municipal government of Recife (Pernambuco), the International Labour Organization (ILO) and the World Bank, to assess the impact of the Bolsa-Escola Programme which, created in 1997, currently pays benefits to some 1,600 families. The study consisted of an analysis of the factors which affect learning outcomes among children attending school under the Programme and which impact upon the social vulnerability and economic welfare of the families benefited.
The study sought:
§ to identify the impact of the Programme on the economic activities of adult family members;
§ to assess its contribution to increasing family income (other than the cash benefit itself);
§ to determine how long a family must remain in the Programme in order to escape poverty;
§ to ascertain whether child labour had definitively been eradicated among families participating in the Programme; and
§ to appraise Bolsa-Escola’s real contribution, in terms of the children’s school performance, aside from ensuring high rates of attendance.
The study was based upon a sample of 1,218 beneficiary families and a control group consisting of 268 families with characteristics similar to those of the beneficiaries but which were not participating in the Programme. Two interviews were conducted with each participating family: the first at the time when they entered the Programme, and the second, one year later.
Conclusions
The Bolsa-Escola Programme was well targeted, both in terms of the criteria for selecting children to participate, and in its focus upon the neediest of families. It was found, however, that guidelines were lacking for extending the Programme to other schools, i.e., for the progressive expansion of the Programme.
The Programme was well received: both teachers and school principals consider that the Programme reinforces their work as educators. Teachers also look to the Programme as a source of methodological change, seeing in it an opportunity to enhance their own work, and thereby improve learning performance on the part of the children.
Assessment of individual features - such as age, sex and participation in the Programme - provided no indication of factors to explain differences in school

viii
performance. However, the data indicates that girls from poor families run a higher risk of dropping out of school than boys.
Schools, as institutions, are the central element in the execution of a policy of income transfer. Some schools succeeded in enabling poorer students to achieve similar performance to that of their slightly more affluent colleagues. Furthermore, these schools managed to obtain from the Bolsa-Escola students slightly better results than they would have achieved at other schools. The school and the teachers are the preeminent factors accounting for improved school performance.
The Bolsa-Escola Programme has contributed to the breakdown of mechanisms traditionally used by schools to exclude the poorer students. Bolsa-Escola commits families to ensuring that their children attend school and, at the same time, obliges the schools to keep on students who would otherwise be at high risk of dropping out. Under “normal” circumstances, schools - on the pretext of purely academic criteria - tend to gradually edge out students from deprived socio-economic backgrounds. The Bolsa-Escola students had a lower level of achievement than students in the control group and this, were it not for the Programme, could have led to their dropping out of school. However, the Bolsa-Escola Programme has proved an effective means of breaking one of the most pervasive mechanisms for reproducing and legitimizing inequalities: namely, early exclusion from school.
Recommendations
Its very low coverage is the weakest feature of the Bolsa-Escola Programme in Recife: currently, only 2 per cent of the target public is served. A clear time horizon and objective goals are needed if the Programme is to become consolidated. Despite budgetary constraints and low revenue-raising capacity on the part of the Municipal Government it would, nonetheless, be feasible to extend the Programme to no less than 3,200 families (twice the number currently benefited) if a mere 1 per cent of current municipal revenues were allocated to the project. Were this allocation to be increased to 2 per cent, a cash benefit, worth one minimum wage, could be paid out each month to 6,200 families, i.e., 80 per cent of those families that meet the criteria of the Programme, and 9 per cent of the potential target public.
The law that instituted the Bolsa-Escola Programme in Recife - like most similar programmes elsewhere - does not define deadlines or objectives, thereby tending to undermine the effectiveness of the Programme as a mechanism for combating poverty and reducing social inequalities. Its positive spillovers and strategic potential are thus under-exploited. A programme of this nature could provide the mainspring needed to induce a redefinition of the social protection system in Brazil, since it strengthens universal principles by taking a selective and focused approach.
The study confirmed that establishing the benefit according to the number of dependents at one or at half the minimum wage was correct. Simulations showed that the principal trade-off - and greatest impact - in terms of the increased costs of the Programme, was not so much the value of the benefit, but rather, the scope of programme coverage.

ix
The Programme does not constitute a disincentive to work, but rather, the contrary. Family income (not including the benefit) increased significantly in the first year that families were in enroled in the Programme, despite the difficulty of finding jobs in a weak labour market. More than 50 per cent of the adults in the Programme and/or their spouses were illiterate, or barely literate. Despite such shortcomings, the level of activity among the benefited families rose to a level that fulfilled their basic economic needs, notwithstanding an unfavourable economic environment characterized by recession. Thanks to the monthly cash-benefit received over the period of one year, over two-thirds of the families in the Bolsa-Escola Programme were able to rise above the poverty line and reduce their degree of social deprivation.
The impact of the Bolsa-Escola Programme on eliminating child labour was much smaller than had been expected, indicating that schools must concentrate on providing a better response to this challenge. Since the condition for receiving the Bolsa-Escola benefit is that the child must attend school regularly, its impact is limited to school hours and it cannot be expected to influence the time spent working, or doing household chores, while the child is at home. One positive point worth mentioning, however, is that Bolsa-Escola students tend not to be engaged in paid work.
School resources could be better utilized: ideally, investments should concentrate on improving teaching skills, since teacher performance is the greatest differentiating factor when it comes to achieving better student performance.


1
1. Introduction
Brazil witnessed major social policy developments during the latter half of the 1990s. Elections at the municipal, state, and federal levels strengthened the democratic process. In addition, the decentralization process adopted under the participatory 1988 Constitution provided greater policy, administrative, and fiscal autonomy to the sub-national levels of government. Thus, the debate on Brazil’s social inequalities gained both renewed interest and a new institutional framework.
The idea that poverty derives not only from insufficient income, but also from an acute deficit in the provision of essential public services such as health, education, housing, and basic sanitation, challenges traditional forms of social policy-making. The recognition that although Brazil spends a reasonable amount in the social sphere (19 per cent of its GDP), nevertheless public resources fail to reach the neediest segment of the population, has led to the adoption of innovative experiences, especially by progressive local governments. Thus emerged the participatory budget process in some left-leaning municipal governments,1 where negotiations between organizations from civil society and the municipal administration have increased the social control over allocation of a growing portion of public monies; food security programmes have expanded the focus on subsidized sales of foodstuffs to groups at increased risk whilst regulating food commodity prices; and guaranteed minimum income programmes for the poor population have been adopted as a way of alleviating poverty and attempting to reduce inequality.
The idea of providing a minimum income to the poor segment of the population was introduced into Brazil in the 1970s, but it was not until the 1990s that it became a major issue in the national debate on combating inequalities, when Senator Eduardo Suplicy of the Workers’ Party presented a bill of law providing for a guaranteed minimum income for all Brazilian adults over 25 years of age with a monthly per capita family income le ss than R$240 (US$141).2 Suplicy’s proposal was to allocate a monthly stipend equivalent to 30 per cent of the difference between an individual’s actual income and the above-mentioned figure, serving as a kind of national poverty line.
Contrasting with this approach is another form of monetary income transfer, targeting not poor individuals but rather poor families with school-age children. This initiative, launched by economist José Márcio Camargo, proposes to grant a monthly stipend equivalent to one minimum wage to all families, regardless of income, whose children are enrolled in the public primary school system. The argument for this targeted form of monetary income transfer is that limited schooling is the most important factor explaining the reproduction of poverty. Indeed, there is still a high
1 Such as Porto Alegre (capital of the State of Rio Grande do Sul), Santo André (in the State of São Paulo), and Belo Horizonte (capital of the State of Minas Gerais).
2 To convert the amounts into US$, amounts in current reals (the Brazilian currency) were updated to December 1999, using the INPC-IBGE (National Consumer Price Index), and then divided by the mean exchange rate from that month (R$1.8420=US$1). This procedure was used for all the amounts quoted in this report in Brazilian reals (R$).
2
average age/grade lag in schooling in Brazil, although the figure is declining: according to the 1998 PNAD,3 a 14-year-old Brazilian who should have finished primary school (8 years of schooling) had accumula ted a mean lag of 2.94 years. The Brazilian adult population (over 25 years) has an average of 5.6 years of schooling, and only the national capital, Brasília, performed satisfactorily in 1998 with regard to finishing primary school: on average, residents of Brasília had completed all 8 years of schooling.
When only the poorest fringe of the population is considered, the indicators become dramatic, situated well below the Brazilian mean and displaying severe accumulated disadvantages. By way of example, in Recife (our case study in this article), 14-year-old children from families whose per capita income was below half the monthly minimum wage in 1997 (R$60 or US$37 at the time of the study) lagged 4.3 years behind in school, whilst those from families with per capita incomes below one-third the minimum wage lagged 5 years behind (Lavinas, 2000).
This school grant (Bolsa-Escola) programme, based on a guaranteed minimum income, similar to a family allowance and conditioned on school attendance, was initially implemented successfully during the administration of Federal District Governor Cristóvam Buarque4 beginning in 1994. At the end of his administration in 1998, the Bolsa-Escola Programme covered 26,000 families, some 80 per cent of the potential target public,5 calculated according to the poverty line of one half the minimum wage per capita (US$38). For the first time in Brazil, a social programme had reached the scale and coverage needed to generate a real impact on the poor population historically overlooked by public policies. The monthly allowance of one minimum wage (R$130 or US$76), a direct monetary income transfer and a high figure according to Brazil’s social assistance policy standards (traditionally based on the in-kind distribution of foodstuffs and patronising “protection”), made it possible to retrieve ten thousand families from acute poverty. It also helped target social spending on measures to combat poverty, thus expanding their redistributive impact (between 1995 and 1997, the per capita amount increased from R$113 or US$78 to R$279 or US$168, whilst per capita social spending remained around R$450, or U$$ 281). Finally, it reduced the school drop-out rate to zero among pupils receiving the school grant, and reduced their repetition rate to below the average for the national capital as a whole. All of this was achieved with less than 1 per cent of the Federal District’s annual budget allocation (Lavinas, 1998).
In view of the highly satisfactory results and low operational cost, and in the absence of negative trade-offs that often have an adverse effect on the efficiency of social programmes, the Federal District’s Bolsa-Escola or Scholarship Programme has become something of a model in Brazil.
3 The PNAD, Pesquisa Nacional por Amostra de Domicílios, or National Sample Survey of Households, is conducted annually by the Instituto Brasileiro de Geografia e Estatística (Census Bureau) and covers 20,000 households (national sample).
4 Elected Governor of Brasília in 1994 for the Workers’ Party.
5 This high degree of coverage is due to the fact that eligibility criteria for the Programme excluded families who had lived in Brasília for less than five years, as a way of avoiding “importing poverty” from neighbouring municipalities.

3
Currently, one hundred municipalities6 have replic ated this decentralized approach, yet, unfortunately, they have failed to take important aspects into account in both their design and their implementation, execution, and monitoring. The vast majority of such programmes serve only a tiny portion of the demand, generating inequality among the poor; they adopt a negligible grant, that is when they do not replace the monetary stipend with foodstuffs, cooking gas, or some other type of in-kind assistance, whose impact is virtually nil in reducing poverty in the short term; they fail to guarantee continuity insofar as they are only committed to providing the benefit for one or two years, given that they lack properly defined goals and co-ordination with overall social policy. All this obviously jeopardizes this social policy tool’s impact making poverty reduction difficult. Almost none of the Municipal or State legislation for such scholarship programmes aims to promote completion of primary schooling, rather merely to “keep kids off the streets”, which underscor es the policies’ paternalistic nature, to the detriment of their potential redistributive impact. Some cities even practise a “turn-over” policy with the poor families enrolled in the programmes, due to budget constraints: a given contingent of families is benefited one year, but is obliged to withdraw the following year to make room for a new group. Thus, although some gain, others lose all over again, in a zero-sum game where everything except the families’ poverty is temporary.
On the eve of the 1998 presidential elections, the Ministry of Education itself launched a guaranteed minimum income programme, with a geographical focus: municipalities with a per capita income and tax revenue below the respective State average could work in partnership with the federal government, which would fund half the cost of a scholarship programme, once again linking the stipend to mandatory school attendance. In December 1999, according to Ministry of Education sources, 504,000 families in one-fifth of the Brazilian municipalities (mostly situated in rural areas) were receiving a monthly stipend which varied, but which was estimated on average at R$37 (US$20). More than a million children were reported as enrolled in the programme. However, it is not known how this programme acts to reduce poverty, valorize teaching, or improve school performance among children receiving grants. To date, the federal government has done no consistent evaluation of the programme’s results, although it has proposed to do so in 2001 to deal wit h the budget and operational constraints raised by its extension and coverage to the nation-wide level, forecast for the year 2003.
The scholarship programme has also become an important tool in combating early child labour in hazardous workplaces such as charcoal kilns, sugar cane cutting, sisal harvesting, and other activities jeopardizing children’s physical and social development. The Programme to Eradicate Child Labour (PETI)7 began allocating a monthly stipend to families whose children were involved in heavy, hazardous labour in order to replace the children’s limited yet indispensable supplement to the family’s income. The amount was set at R$50 (US$27) until April 2000, when the government decided that this was too much for rural areas and cut the figure by half. The stipend is currently R$25
6 Brazil has some 5,600 municipalities, or counties.
7 Co-ordinated by the Department of Social Action (SEAS) under the Brazilian Federal government

4
(US$13), which means drastically reducing the potential for decreasing extreme poverty in the short term, the rates of which are alarming in rural areas of Brazil.
What is even more serious is the patronage practised by income transfer programmes in some cities, undermining a potentially valuable tool for combating poverty whose positive impacts have already been demonstrated, as in the case of the Federal District.8 Such distortions occur in Rio de Janeiro, where the state government is simultaneously implementing two types of minimum income programmes. One of them, with an experimental approach, serves a small number of children (a thousand) in two slums in the city of Rio. It is co-ordinated by the State Department of Education. In parallel, the state government, contradicting secular principles of citizenship, transfers to Evangelical churches a so-called “citizen’s check”, serving as a kind of “food stamp”: the “check” is worth R$100 (US$70) and can be redeemed for foodstuffs or other goods at shops registered with the government’s authorized network of suppliers. Meanwhile, the Evangelical churches choose from among their followers those who are to benefit from this gift from the state, using religious, moral, and behavioural criteria, completely distorting a programme whose efficiency and efficacy have been proven as a way to combat poverty and reinvigorate Brazil’s meagre social policy reserve.
In the faced of so many distortions in a social programme whose novelty and effectiveness appear to outweigh its weaknesses, a rigorous, in-depth evaluation of a Scholarship Programme, was required highlighting its innovative potential as compared to the penury of traditional social policy approaches. The Office of the Mayor in Recife rose to the challenge of conducting the present case study. It is important to note that Recife was chosen because of the seriousness and transparency underlying the design, implementation, and execution of the Municipal Scholarship Programme, without which it would have been impossible to undertake this evaluation with the methodology adopted.
The purpose of this research is to produce the first in-depth evaluation of the Recife Municipal Scholarship Programme, investigating the possibilities for expanding the number of its beneficiaries and introducing changes in its design.
2. The Recife Scholarship Programme
2.1 Design and legislation
The Scholarship Programme in Recife was created under Municipal Act no. 16,302 of May 23, 1997, and regulated by Ruling 17.66/97. The agency in charge of the Programme is the Department of Education, acting through an Executive Committee consisting of representatives from the Departments of Education, Health, Social Policy, and Finance and the Co-ordinating Board for Children and Adolescents, in addition to local committees set up in each of the city’s administrative regions or sub-divisions.
8 The only place in Brazil where there was some level of evaluation of the impacts of school grant programmes.

5
The Programme in Recife was also modelled after the successful experience of the Scholarship Programme in the Federal District (Brasília).
Under the above-mentioned legislation, a stipend was granted to families displaying material need and precarious social and family conditions, on the condition that they enrol and keep in school their children ranging in age from seven to fourteen years. The Programme’s target public was defined as families with a monthly per capita income less than one-third the minimum wage (R$40 or US$24 at the time the Programme was established) and with children in mandatory school age (for primary school, seven to fourteen years). The family also must have resided in Recife for at least five years.
In addition to the above criteria, priority was given to families with children not enrolled in school because they have to work, with malnourished children monitored by the public health system, with children under so-called social protection measures (Article 101 of the Statute for Children and Adolescents), or with adolescents subject to socio-educational measures (Article 124 of the Statute). Likewise, preference was given to families with more dependants, elderly members, or disabled members incapable of providing for themselves, and where the head of the household is a woman or one of the grandparents.
As a matching commitment, in addition to the children’s mandatory school attendance, parents or guardians who were not prevented from working had to prove that they were enrolled in a vocational training course and/or employment programme. When selected, the families signed a declaration in which heads of families commit themselves to proper use of the stipend.
As of December 1999, 1,621 families had been selected to participate in the Programme, of whom 1,604 were regularly receiving the monthly stipend. There are two different amounts, based on the number of children. One-half the minimum wage is provided to families with only one school-age child, and one minimum wage to families with two or more children enrolled in and attending school. 9 The stipend lasts for one year and can be renewed for one more year, depending on a reassessment of the family’s socio-economic situation. However, thus far the stipend has been extended automatically, i.e., no families have been left out of the second year. Payment of the school grant is only suspended in fact when attendance drops below 90 per cent by one or more of the children. If attendance returns to normal, payment of the stipend is renewed.10 Payment is always made in the mother’s name, in both female single-parent and nuclear families, as a way of ensuring a more efficient allocation of this resource.
Funds allocated to the Programme come from the municipal budget. Annual spending on the school grant was estimated at some R$1.7 millions, or US$933,000 in 1999. This represents only 0.3 per cent of total budget spending. In Recife, there is no maximum budget limit established by law for spending on the Programme, contrary to
9 The minimum wage in 1997 (R$120) was the equivalent of approximately US$73 in December 1999.
10 However, retroactive payments are not made to cover the period during which the child’s school attendance has dropped below the required minimum.

6
practice in most City Governments 11 (where such maximum limits are a way of avoiding exponential increases in municipal social spending to meet a potentially very high demand).
The Scholarship Programme is a recent and innovative experience aimed not only at filling a short-term income gap, but also at helping break the vicious circle of poverty, insofar as it promotes greater access to education and broader social coverage for marginalized groups. Contrary to guaranteed minimum income programmes, the school grant programmes are not characterized by universalization of the benefit. They target a specific public: needy families with school-age children. The following remarks summarize the strong and weak points of the Pogramme.
Selection criteria
Given the need to restrict the potential public for these programmes because of municipal budget constraints, well-defined selection criteria were adopted. The main criterion was income level. This principle was adopted on the basis of a very strict control mechanism of living conditions and income level for families situated in the lower tail of income distribution.
Another eligibility criterion restricts benefits to families with children ages seven to fourteen years. However, the objective of such a Scholarship Programme should go beyond that of keeping the child in school and guarantee conclusion of primary school. Since children in the poorest families in the municipalities that were surveyed show an age/grade school lag of over three years,12 it would be appropriate to extend the programme to include at least families with children ages fifteen to seventeen years who have not finished primary school. This would constitute a major incentive for finishing primary school among poor adolescents, whose risk of social exclusion becomes acute in this phase of their lives. Ideally, in this case, they should receive an individual school grant.
Finally, applicant families are required to have resided in Recife for at least five years. Although migration is no longer a major problem in Brazil, this criterion is a way of containing population shifts motivated by such income transfers, especially from the poorer municipalities located near Recife.
Matching commitments
According to Article 206 of the Brazilian Federal Constitution, education is “the right of all and the duty of the state and the family”. Thus, the only matching commitment required of families receiving school grants is mandatory school attendance, ratifying the Constitutional provision. Other commitments, such as mandatory enrolment of unemployed parents in vocational training programmes or mandatory attendance in courses should not be imposed as conditions, amongst other reasons because the demand by the poor population for such mechanisms of social inclusion is much greater than the supply of respective programmes and courses.
11 Generally 1 per cent or a maximum of 2 per cent of the budget revenue.
12 In Recife, the mean age/grade lag is 4.32 years, according to the 1997 PNAD.

7
Parents should also be waived from signing a term of commitment to properly use the stipend, since such documents have no legal force and merely serve as an inappropriate and useless form of moral coercion.
Goals
As occurs with similar programmes implemented elsewhere in Brazil, the Recife Scholarship Programme lacks a clear-cut goal of guaranteeing that beneficiaries finish the level of schooling that is mandatory for all children or that they be safeguarded from performing child labour, prejudicial to their schooling. Neither is there a clear-cut commitment to combating poverty in the short term. However, the Programme has apparently been successful in alleviating the acute needs of beneficiary families, albeit for a short space of time.
Duration
Although the stipend is tied to the child’s school attendance, it is limited in time, given the relationship between the large number of poor families and the prevailing budget constraints. The time limit for participating in the Programme (one school year in Recife, renewable under conditions established by law) does not entail a commitment to finish primary school; this limit should be modified so as to provide for conclusion of primary school.
Amount of stipend
The stipend should be carefully calculated on the basis of the respective poverty lines established in the municipalities. For example, the stipend should not be greater than the legal minimum wage, or it runs the risk of affecting the job market; neither should it be too low, or the Programme will fail to reduce poverty in the short term. As for the amount of the stipend, Recife took the important initiative of differentiating it according to the number of children in the family, thereby extending the Programme’s coverage. Once again it is limited funds that determine the size of the stipend, a problem that can only be dealt with satisfactorily when a nation-wide programme is in place.
2.2 Coverage of the target population
Potential demand is estimated by using data from the 1997 National Sample Survey of Households (PNAD) conducted by the Brazilian Institute of Geography and Statistics, or National Census Bureau (IBGE). Graph 1 shows the families in the lowest four-tenths of income distribution in the city of Recife, according to monthly per capita family income (PCFI). Among the poorest 40 per cent, the maximum income on record was R$100.00 or US$61.
Recife has a large contingent of families with per capita income below the one-half minimum wage line - some 23 per cent of all families in the municipality, or in absolute numbers nearly 100,000 families (Table 1). The R$60 or US$37 line was chosen because it was half the minimum wage, which corresponds to the average national monthly cost of purchasing 2,200 kcal/day in 1997, (Lavinas et. al, 2000a). Thus, those 100,000 families below the R$60 line encompasses the city’s indigent population, whose income deficit is so sharp that it places them in a situation of nutritional risk.

8
Among the families below this line, we distinguish those with children in the seven to fourteen year bracket, since the Scholarship Programme targets only families with mandatory school-age children. Thus, if we were to count the Programme’s potential clientele as including families classified as indigent based on a given poverty line, we would have a potential demand of 100,000 families, with this demand dropping to 46,000 using a school stipend as a benefit. Over half (54 per cent) of the poor families with pre-school-age children or consisting exclusively of adults would be ruled out of the Programme.
Graph 1. Distribution of the poorest 40 per cent of the population in Recife according to per capita family income
RECIFE
R$ 0
R$ 10
R$ 20
R$ 30
R$ 40
R$ 50
R$ 60
R$ 70
R$ 80
R$ 90
R$ 100
R$ 110
0% 5% 10% 15% 20% 25% 30% 35% 40%
Per cent of individuals
PE
R C
AP
ITA
FA
MIL
Y IN
CO
ME
Per cent
Source (PNAD, 1997).
Table 1. Number of poor families in Recife
Number Per cent
Families with PCFI <=R$60.00 99 939 27.3 Families with PCFI <= R$60.00 and children 7-14 years 46 016 12.6 Total families in recife 366 435 100.0
Source (PNAD,1997).
However, this over-targeting is even more restrictive to the extent that according to the law, families are only eligible if they have a per capita income of less than R$40, or US$24. If we exclude the criterion of having school-age children, Recife has 64,754 families below this poverty line. But if we apply the Programme’s criterion, limiting the stipend to families with school-age dependants, only 8,800 families qualify.
In short, we can say that overlapping targeting criteria end up undermining the Programme’s initial design, greatly jeopardising its coverage. Only 9 per cent of indigent families qualify for the Programme according to its selection criteria, and of these, in reality less than 2 per cent were actually included as of May 2000 (Table 2).

9
Table 2. Coverage of the Recife Scholarship Programme
Number Per cent
Total poor families (R$60 cut-off) 99 939 100.0 Total poor families with children 7-14 years (R$60 cut-off) 46 016 46.0 Total poor families meeting programme criteria 8 748 9.0 Families included (degree of coverage) 1 604 2.0 Source (PNAD, 1997 and Scholarship Programme Registers for Recife and Belo Horizonte).
2.3 Coverage of schools
Like other similar policies, the Scholarship Programme in Recife follows a concept of citizenship, which includes education as a fundamental right. What is more, it incorporates knowledge produced in the area and attempts to go beyond mere access to schools to guarantee that children remain in school. The correlation between receiving the stipend and attending school is in itself a sign of progress that should be acknowledged, since it is the poor pupils who most frequently drop out of school, and at an earlier stage in their education.
One of the most widely used arguments in favour of the Programme was the extremely high repetition and drop-out rates in the public school systems in Recife, a common trend among the poorer segments of the Brazilian population in general, as witnessed in pioneering studies on school trends (Klein and Ribeiro, 1980; Klein, 1999). Thus, the Programme’s main objective is to foster enrolment and permanence in municipal schools for children of seven to fourteen years of age, from families in poverty conditions and a precarious social and family situation.
Repetition and drop-out rates were used as the criterion to define RPA 1 (Political and Administrative Sub-Division 1) as the initial area for implementing the Scholarship Programme in Recife, beginning in September 1997. In 1997, this area of the city had the highest repetition and drop-out rates in Recife, capital of the State of Pernambuco. Data from Table 3 give an overview of these rates, including the year 1998 (the most recent year with available data from the Municipal Department of Education and the first full year with the Programme under way.
Considering that the drop-out and repetition in very unequal societies are highly correlated with precarious socio-economic conditions, this index was an appropriate choice for decision-making. By choosing urban areas with the highest repetition and/or drop-out rates, those in charge of the Scholarship Programme probably demarcated the most socially deprived areas. This could be confirmed in the future with studies on the human development index currently being carried out by the Municipal Department of Planning.
This procedure focuses on the school as an important institution in the Programme’s implementation. However, a relatively important problem emerges here:

10
despite this central position, school performance is only used as a criterion to legitimate the policy. That is, students’ poor performance justifies granting the stipend,13 but the school system is not required to follow up on the children’s learning process after they begin receiving the grant. Although not turning performance into a criterion for keeping the school grant - justifiable, since techniques for evaluating learning are still the object of considerable doubt, and one should not penalize children with learning difficulties - a closer follow-up on performance standards would have positive results for the students, the teachers, and the school as a whole. Furthermore, this type of follow-up could give a truly central role for the school in the Programme. Following the performance of children receiving school grants should not play a coercive or castigating role, but should serve to monitor the quality of a service provided to children who are expected to benefit from preferential treatment allowing them to catch up with their accumulated lag. Such follow-up would be relevant as an evaluation tool for the Programme.
Another important point is the relationship between the Programme and the schools. The municipal law establishing the Scholarship Programme provides that it should aim to foster access to and permanence of needy children and adolescents in school. Meanwhile, the leaflet produced by the Office of the Mayor refers to keeping these pupils in the municipal school system. Nearly all of the pupils receiving school grants are enrolled in the municipal system, and there are only a few cases of students - in higher grades - in the State school system. This can be explained by a sort of division of labour between the municipal and State school systems, where the municipal school system concentrates on pupils in grades 1 through 4, whilst the grades 5 through 8 are found in higher proportions in the State system.
The law itself also provides that the Municipal Department of Education should define the norms and standards for the municipal school system, especially with regard to monitoring pupil attendance. The teachers and school administration are in charge of encouraging pupils to remain in the classroom to maintain their link with the educational process.
Within the municipal school system, as mentioned, the first selection criterion was the set of school indicators. However, from that point on no criteria were defined to determine whether this or that school would be included in the Programme. Apparently, the entire municipal school system in the respective Sub-Division was eligible and/or encouraged to participate. However, during the expansion of the Programme and even since the beginning, no criteria were established - like school size, repetition rates, or the availability of a school counseling service, etc.- allowing one to identify the direction the work was to take.14
As shown in Table 3, there is a slight downward trend in the drop-out rate and a much stronger upward trend in the repetition rate. Such trends are common to the city
13 From the point of view of social justice, it is easy to show that the proposal was correct. Inside the school, however, things are a little more complicated: there are cases of teachers who consider this criterion extremely unfair, since it “awards” bad pupils.
14 According to the Education Department of the Municipality, there are a total of 234 schools attended by 52,730 pupils. Only 10 per cent (23 schools in all) are involved in the Programme. The major problem, however, is not the number involved but the lack of clearly defined institutional criteria.

11
school system in Recife and are probably the most important factors in producing the overall schooling rate.15
Table 3. Repetition rates and drop-out (%) in Recife, by political and administrative sub-division (RPA).
YR. 1995 1996 1997 1998 RPA Drop-out Rep. Drop-out Rep. Drop-out Rep. Drop-out Rep.
1 16.8 20.1 12.1 27.8 9.2 28.5 8.5 25.9 2 12.3 14.0 10.4 25.8 9.1 27.0 8.9 26.7 3 9.4 10.4 8.6 22.0 7.4 24.5 6.8 22.2 4 10.5 11.7 7.1 23.0 6.3 25.9 6.3 23.7 5 13.0 15.0 8.9 25.1 8.3 25.4 8.7 23.3 6 9.0 9.8 6.9 23.8 6.7 24.5 6.2 22.4
Source: Department of Education - Office of the Mayor, Recife, Pernambuco, Brazil
The choice of school criteria for geographic targeting of the programme was kept in the expansion process, with the choice of RPAs 2, 5, and finally 4, the sub-divisions with the worst indicators next to RPA 1, in the order listed.
2.4 The Programme’s cost
Objectives and methodology
The purpose of this section is to determine whether the development of the Scholarship Programme in Recife is helping to improve the targeting of social spending, increasing transfers in the form of direct income or services to the target public of the social assistance programmes, i.e., the public in greatest need, little-served if not entirely overlooked by public policies. The aim is to evaluate whether Programme spending is compatible with the city’s revenue, since its coverage has proven quite meagre and only 2 per cent of the potential target public benefit from this income transfer.
The relationship between social expenditures and the overall city budget for the years 1997, 1998, and 1999, were analysed with a special emphasis on activities focused on the poorest segment of the local population.
Direct or indirect measures to combat poverty, include those with a non-universal scope, whose benefits directly affect the most vulnerable and under-served segments of the population, as well as those of a universal nature. Both categories comprise initiatives to expand and improve the sanitation and housing systems, health, education
15 However, they deserve to be highlighted because we find a slight change in the 1998 data that could be seen as the first positive result of the implementation of the Scholarship Programme beginning in First Urban Sub-Division (RPA1), which was no longer the city champion in low school performance indicators. In 1998, although the downward trend in drop -outs continued, there was a reversal in the repetition rate. There was a drop in the repetition rate in all of the Urban Sub-Divisions (RPAs). The indicator which may reflect a differential impact from the Scholarship Programme at the school level is that the reduction of this rate in Sub-Division 1 (RPA1) was more significant than in the other Sub-Divisions, with Sub-Division 1 moving to second place. With regard to the drop-out rate, Sub-Division 1 moved to third place. However, we can still not really tell whether there was an actual trend in this direction, since we still lack data on repetition and drop-out in the year 1999.

12
(primary school and adult literacy programmes), food security, and transport. In addition to these expenditures made directly by the administration, we also considered measures funded indirectly and through transfers from the local government.
The basic premise was that the implementation of the Scholarship Programme starting in Recife in mid-1997 would be sufficient to cause both an absolute and a relative increase in the targeted anti-poverty measures within municipal spending as a whole, since, having satisfied the more immediate needs, the public benefited by the Programme would begin to exert pressure to meet suppressed demands. The hypothesis was that closer relations between government and the poorest stratum of the population, favoured by means of the income transfer, would tend to fuel demand for more and better public services and consequently lead to an increase in targeted social spending (Lavinas and Varsano, 1997). This hypothesis was confirmed by the evaluation of the Scholarship Programme in Brasília where a positive correlation was observed between the expansion of the targeted expenditure and the implementation of the income distribution programme (Lavinas, 1998).
After calculating the Scholarship Programme’s share in Recife’s municipal budget spending, we performed several exercises to simulate expanding its coverage (both the number of families served and the value of the stipend) estimating its impact on the municipal public finances. Our idea was to reflect on an optimum Programme design, considering the trade-off between low availability of budget resources, a high incidence of poor people, and the extreme intensity of their poverty.
Distribution of social aid spending by the Recife City Government
Total annual spending by the Recife City Government during the 1997-99 triennium averaged around R$550 million. As noted in Table 4, some 30 per cent of this total was allocated for social programmes, as defined by spreadsheets of the National Treasury.16
Table 4. Trend in social spending and total budget spending, Recife City Government
1997 1998 1999 R$ % R$ % R$ %
Total spending 500 985 100 584 194 100 554 389 100
Social spending 144 762 29 182 080 31 171 276 31
Other spending 356 223 71 402 114 69 383 113 69
However, a major portion of universalist social policies fail to reach those who are repeatedly excluded from basic citizens’ conditions in Brazil, i.e., the indigent population, which is only served in a haphazard, random fashion. Thus, both the efficacy and the purported universalism of social policy are always questioned in Brazil,
16 Social programmes defined by the National Treasury as health and sanitation, housing and urban planning, welfare and social security, labour, education, and culture.

13
in the sense that it fails to effectively solve the great mass of accumulated needs among the poor segment of the population.
In the case of Recife, over 400,000 people (some 100,000 families) fail to earn a per capita family income sufficient to acquire 75 per cent of the minimum daily calorie intake, i.e. 2,200 kcal, thus constituting the potential target public for public programmes to combat poverty (Lavinas, 1999). With their demands virtually overlooked due to the low coverage or inadequacy of such so-called universal policies, this group requires special attention and the allocation of supplementary budget resources in order to reduce the social gap separating them from the rest of society. This is precisely the role of compensatory programmes.
To determine to what extent social spending with a compensatory impact keeps pace with the trend in overall social spending in Recife, Table 5 compares the total resources allocated for these two functions. We may suppose that the case in point in this study, i.e., the use of school grants as an incentive to remain in school, would automatically mean an expansion in the degree of coverage of the policy for universal access to primary education, since it would tend to reduce the school drop-out rate to zero among socially excluded groups. Likewise, increasing per capita social spending on measures to combat poverty should lead to increased efficacy in social policy as a whole, by helping reduce to poverty. Based on these premises, and seeking to interpret the impact of school grants (to the extent that such an impact exists) on the evolution in social spending in the overall Recife municipal government spending, we highlight the measures targeted preferentially to combat poverty. The data in Table 4 show how the amount of funds invested in social programmes with some level of impact on poverty increased from 1997 to 1999, proportionally to budget expenditures as a whole (on the order of 10 per cent a year), representing some three-fourths of total social spending during this three-year period.
Table 5. Social spending with impact on poverty
Table 5 lists the main spending in the adoption of programmes and/or policies with a direct or indirect impact on poverty, whether universal or compensatory. This choice is based on a detailed analysis for the purposes of this study) of the Recife municipal budget spending. In practice, it was necessary to consider the actual physical application of municipal funds to determine this choice because of the strong discrepancy between the previously earmarked budget figure and actual spending. Few programmes actually expended all the funds initially earmarked for them in the budget, and there were many cases in which no outlay whatsoever was made. An example is the vocational training programmes for adolescents in low-income communities and on-the-job training programmes under the Department of Social Development. In 1999, a total
1997 1998 1999 Annual increase (R$ thousand) (R$ thousand) (R$ thousand) Total social spending 144 762 182 080 171 276 9 % Spending with impact on poverty 107 016 151 308 128 660 10 % Share of poverty spending in total social spending 74% 83 % 75% 1 % Source Execução Orçamentária, Prefeitura Municipal do Recife , 1997, 1998 and 1999 Amounts adjusted to December 1999 according to the INPC/IBGE (National Consumer Price Index)

14
of R$900 thousand was earmarked for these programmes, but only 20 per cent of this amount was actually spent. A similar trend was observed in the Scholarship Programme, where nearly R$2.2 millions was earmarked, of which only 75 per cent was actually spent.
In addition, the figures in Table 5 include spending by both the indirect municipal administration (public universities and foundations and non-privatised public utilities) and by institutions and foundations working in decentralized fashion with funds transferred from the City Government for activities to combat poverty.
Due to the great diversity, we chose to classify these scattered actions in three “lines of action”,17 as follows:
Line 1 - Promotion of primary and pre-school education and day-care centres. Line 2 - Activities linked to social assistance in general and emergency aid. Line 3 - Prevention and eradication of diseases, hospital and out-patient medical
care, and food and health inspection.
Table 6 shows how in 1999, nearly 70 per cent of municipal spending with a possible impact on poverty in Recife was concentrated on line 1, i.e., pre-school and primary education. This amount decreased during the period under study, but did not lose its importance in comparison to other budget items. Spending on direct social assistance activities is relatively small (Line 2), considering the size and severity of the problem of poverty in Recife. Since such spending is also quite scattered, one can only imagine how limited its efficacy is as an instrument to combat poverty and inequality.
Table 6. Distribution of budget spending with an impact on poverty
Source: Execução Orçamentária, Prefeitura Municipal do Recife (Recife Municipal Budget Spending), 1997, 1998 and 1999 and PNAD/IBGE
Table 7 shows mean per capita social spending on measures to combat extreme poverty in Recife, as compared to per capita social spending as a whole. We used the National Sample Survey of Households (PNAD) estimation on the number of families living below the poverty line defined as one-half the minimum wage.
Table 7 shows that during the study period the poor population grew faster (2 per cent) than the overall population. Nevertheless, the upward variation both in per capita overall social spending and in per capita anti-poverty social spending was almost
17 The grouping of these activities was based on their common characteristics, and not explicitly according to respective agencies, as adopted in the municipal balance sheets. Thus, health items allocated in the budget of the Department of Social Action were added to programme line 3, together with items under the Department of Health, which in turn had some items included in programme line 2, and so on.
1997 (%)
1998 (%)
1999 (%)
Line 1 71 60 68 Line 2 11 14 11
Line 3 18 26 21

15
identical, showing that there was no increased targeting of spending in such a way as to promote a more equitable redistribution of resources. It seems that probably due to the Scholarship Programme’s low coverage, it failed to produce the expected impact on anti-poverty social spending, given that such focused spending did not increase at a faster rate than overall social spending.
Table 7. Indicators of social spending in Recife
1997 1998 1999 Variation per yr.
Resident population in Recife 1 326 021 1 336 099 1 346 253 0.8 Social spending R$ 144 762 240 R$ 182 080 440 R$ 171 276 000 9.1 Per capita social spending ion) R$ 109 R$ 136 R$ 127 8.2 No. individuals with monthly PCFI less than 1/2 MW 425 322 450 398 443 016 2.1
Anti-poverty spending R$ 107 016 000 R$ 151 308 000 R$ 128 660 000 10.1 Per capita anti-poverty spending (individuals with PCFI <
1/2 MW) R$ 252
R$ 336
R$ 290
7.5
Values adjusted to December 1999 according to the INPC/IBGE (National Consumer Price Index). Notes: PCFI Per capita family income MW Minimum wage prevailing in: 1997 = R$120.00 1998 = R$130.00 1999 = R$136.00 Sources: Execução Orçamentária, Prefeitura Municipal do Recife (Recife Municipal Budget Spending) 1999 and PNAD/IBGE.
The question then is, what is the Scholarship Programme’s weight in the overall municipal budget in Recife? Annual spending on the Scholarship Programme hovered around R$1.6 million. According to Table 8, the amount allocated to the Programme’s implementation was less than 1.5 per cent of the funds earmarked for the Department of Education, and a virtually identical percentage of the funds allocated directly and indirectly to combat poverty. Only 0.3 per cent of the total municipal budget went to the Programme. Considering that other cities that have adopted the same sort of programme have allocated resources up to 1 per cent of their budget, we can interpret this limit as resulting from the Scholarship Programme’s low priority within the Recife City Government’s anti-poverty programmes and activities.
Table 8. Scholarship Programme spending as a percentage of other outlays
1998 1999
Scholarship Programme/budget spending 0.3% 0.3% Scholarship Programme/Department of Education 1.3% 1.4% Scholarship Programme/total social spending 0.9% 1.0%
Scholarship Programme/anti-poverty spending 1.1% 1.3% Sources: Execução orçamentária, Prefeitura Municipal do Recife (Recife Municipal Budget Spending) 1999 and PNAD/IBGE.
Faced with this evidence, we asked to what extent it might be possible to expand the Scholarship Programme in Recife in order for it to steadily occupy a more relevant position in the city government’s overall social policy. We gathered a set of fiscal data furnished by the Municipal Department of Finance to simulate expanding the coverage

16
of the Scholarship Programme and its respective financial impact, in all cases weighed against the fiscal capacity to withstand such expansion.
In order to perform this exercise, we employed the same methodology used by Lavinas and Varsano (1997) based on the availability of net revenue for reallocation of funds for other priorities. Net revenue is traditionally used as a unit’s own funding capacity at a given point in time. This aggregate, obtained directly from the government’s accounts, only includes permanent items from the overall revenue, that is, those which do not require ad hoc decisions to exist and which constitute available funds for that unit.
In practice, a portion of this revenue is earmarked for fixed expenditures and other outlay in anti-poverty activities. In principle, the rest, i.e., uncommitted net revenue, comprises funds that may be re-routed for various purposes, including but not limited to anti-poverty activities.
Therefore, we calculated the uncommitted net revenue for the year 1999 using the methodology presented by the authors and summed up in the following formula (2):
RL = RT – ROP – RTC – RA and, (1) RLñc = RL – DED – GI - GP, where, (2) RL = Net revenue, RT = Total revenue, ROP = Revenue from credit operations, RTC = Revenue from capital transfers, RA = Revenue from amortization and divestiture, RLñc = Uncommitted net revenue, DED = Debt service expenditures, GI = Payments to pensioners, and, GP = Payroll.
Table 9 shows the amounts used in the above formula, as furnished by the Department of Planning in Recife.
Table 9. Calculation of uncommitted net revenue (R$)
1999 Total revenue 566 719 617 Revenue from credit operations 7 124 432 Revenue from capital transfers 24 995 791 Revenue from amortization and divesititure Net revenue 534 599 394 Payment to pensioners 53 607 673 Payroll 146 849 519 Debt service expenditure 21 442 000 Uncommitted net revenue 312 700 202 Note: The uncommitted net revenue in 1999 was approximately R$312 million, representing 55 per cent of the total municipal revenue for that year. Source: Execução Orçamentária, Prefeitura Municipal do Recife (Recife Municipal Budget Expenditure), 1997, 1998, and 1999.
Table 10 shows a simulation exercise we performed to attempt to infer the possible extension of the Programme as compared to the City Government’s disposable budget.

17
We combined two different figures for the school grant: one equivalent to one minimum wage, the maximum limit according to the Programme’s provisions at that time (R$151.00) and the other equivalent to the purchase cost of 75 per cent of monthly calorie expenditure based on a standard foodbasket, or R$113.25. We compared these amounts with the estimated potential universe of families to be served by the Programme, as discussed in the first section of this chapter, which varies from 1,604 to 46,000 families (we excluded the possibility of serving the entire potential demand – 100,000 families - since it was out of the question to design this given the city’s budget constraints).
Table 10. Simulated effects of different school grants on government revenue
Annual cost of grant at R$151 per month Annual cost of grant at R$113.25 per month
Families1 R$ % of income % of total revenue
R$ % of income % of total revenue
1 604 2 906 448 0.9 0.5 2 179 836 0.7 0.4 3 128 5 667 936 1.8 1.0 4 250 952 1.4 0.8 6 255 11 334 060 3.6 2.0 8 500 545 2.7 1.5 8 748 15 851 376 5.1 2.8 11 888 532 3.8 2.1
46 016 83 380 992 26.7
14.7
62 535 744
20.0 11.0
1 1,604: Families served (degree of coverage) 3,128: total beneficiary families corresponding to 1 per cent of total revenue at 100% MW 6,255: total beneficiary families corresponding to 2 per cent of total revenue at 100% MW 8,748: Total poor families meeting Programme criteria 46,016: Total poor families with children aged seven to fourteen years (R$ 60.00 cut-off)
The minimum situation was that prevailing in 1999, where 1,604 families received one-half or one minimum wage (R$75.50 or R$151.00), depending on the number of children eligible to receive the school grant. Setting one single amount for the stipend would increase the expenditure to R$2.9 million, which would represent only 0.5 per cent of the city’s budget revenue and less than 1 per cent of the uncommitted net revenue. By way of curiosity, we kept the number of families constant and varied the stipend by 10 per cent, that is, 20 per cent above the amount legally stipulated for the Programme, and noted that the municipal expenditure Scholarship Programme would increase only marginally, with little variation in terms of its weight in the municipal finances.
In budget terms, as shown in Table 10, there would be a greater impact if we expanded the Programme’s coverage, its most serious shortcoming at present. Let us suppose that 2 per cent of Recife’s budget spending in 1999, some R$11.3 millions, were made available for expanding the Scholarship Programme. In this case, the coverage would be over 6,200 families and the amount spent would be 3.6 per cent of the uncommitted net revenue. It would thus be possible to expand the Programme almost fourfold with out creating unbearable budget pressure on the city.
At the maximum limit, serving 46 thousand families with a single standardized monthly stipend of R$151 would mean spending approximately R$83 million a year, something on the order of 16 per cent of the city’s fiscal revenue in 1999 (almost 27 per cent of its uncommitted net revenue), which would not be a feasible alternative. It would also not be feasible to provide a minimum wage to all poor families (100,000) since it would mean spending approximately 32 per cent of the local fiscal revenue.

18
Table 10 shows that the Programme’s low coverage has no plausible justification from the fiscal point of view. We believe that commitment of public funds to the Programme could be considerably more daring, without imposing severe spending cuts, restrictions, or obstacles in meeting our equally important priorities for the city government. Obviously the question here is whether or not to favour a programme which would appear to entail important externalities so long as it were implemented on a sufficiently broad scale. If the stipend was reduced to R$113.25 a month the coverage, could be expanded to nearly 9 thousand families at barely an extra cost.
The dimension of the budget constraints faced by the Recife City Government is also apparent from Table 10. As one can see, there is no way for a programme like this to serve all the poor unless it is part of a programme with nationwide coverage, led by the Federal government. There is no doubt that increasing the Programme’s coverage should be a goal of the City Government itself, and it could easily improve its performance to the point of reaching some 10,000 families. But this optimum limit from the point of view of municipal finances is insufficient to solve the situation of poverty in the city of Recife, since even so, only 10 per cent of the potential target public would benefit from an income transfer worth one minimum wage. The Recife City Government alone lacks the means to overcome the challenge of poverty, and neither can it be fair and equanimous in distributing welfare to the neediest and most underserved social groups. This is a national challenge, and one should not fail to comprehend it’s magnitude.
3. Evaluation of the programme’s impact on beneficiary families
3.1 Objectives of the evaluation
In order to redefine the programme’s scope, it is necessary to evaluate its impact on the beneficiary familie s, focusing primarily on three aspects:
§ the monthly stipend’s impact on the adults’ work and income levels, so as to estimate whether the programme acts to encourage or deter adults from working;
§ the monthly stipend’s impact in eradicating child labour among those receiving the school grant;
§ the impact on learning among the children receiving school grants, evaluating gains in their acquisition of knowledge and their degree of scholastic and social achievement.
The study also allows an estimation of the programme’s impact in reducing poverty in the short term, both by increasing per capita family income and assimilating families into the basic social protection system.
In short, how does the programme help increase the family’s income level, beyond the stipend itself? How long must a family remain in the Programme to rise above the poverty line? Was child labour eradicated definitively among the beneficiary families? What is the school grant’s real contribution to the children’s school performance, beyond guaranteeing regular school attendance?

19
In order to answer these questions, the method used operates at two different levels: family conditions and school performance.
Level 1 - families’ living conditions
The first concern was to estimate the variation in the families’ work and income rates and reflect on the adoption of mechanisms to promote their financial autonomy, so as to permit them to escape the poverty trap. The main instrument in this stage was the original 1997 register of families drawn up during the selection phase of the potential target public.18 The entire set of beneficiary families was re-registered since it was a relatively small universe (1,604 families). Some questions were added to the original registration form, with the purpose of inferring the participation of beneficiary families in other social programmes, both public and private. The evaluation included a control group consisting of 380 families that had already been selected to participate in the programme, but which had not actually received the stipend.
Level 2 - school performance
The second concern focused on interpreting of the school grant’s effect on school performance. Three dimensions were analyzed: a) the family and its relationship to learning in school; b) the school grant’s impact on the school itself (teachers and school administrators); and c) the performance of children receiving the school grant compared with those not receiving it.
3.2 Universe of analysis for the evaluation
Before the implementation of the Scholarship Programme in Recife, Brasília already had an analogous programme, used as a model by several other Brazilian cities. Recife appears to have been no major exception; the methodology employed there is very similar to that of Brasília, where families apply by filling out a registration form (Appendix 1).
The registration form attempts to gather an extensive set of data on the families, with variables capable of characterizing not only the applicants but also their family setting (spouse, dependants, and other family members living in the same household). Broadly speaking, the information can be aggregated in five groups: personal data; schooling; professional training and situation in the work market; income and family expenses; and living conditions (housing conditions and access to social services). This registration form, employed from late 1997 to early 1999, constitutes what we refer to as the baseline (T0) database, since families were not Programme beneficiaries yet when they filled it out.
The veracity of information reported by the families was confirmed by home visits in order to avoid possible fraud.
18 As in Belo Horizonte, Recife keeps a register of beneficiary families at baseline or time zero (T0), which allows for an evaluation of the Programme’s impact after 1-2 years.

20
In the re-registration of families, conducted during the early months of 2000, several questions were added to the original registration form to allow for an educational evaluation of the children in the programme as well as to map both the family’s participation in other social programmes and child labour. This second registration is referred to as time 1 (T1).
Thus, evaluation of the impact was based on a comparison of the changes observed between two distinct moments in time (T0 and T1) in two distinct groups (beneficiaries and controls). The control group included a set of families with socio-economic conditions quite similar to those of the families benefited by the Programme. The control families had filled out the registration forms at both moments in time but had not received school grants, due primarily to budget constraints in the Programme.
Establishing the database
To evaluate the trajectory of the two groups of families between two moments in time and in order to isolate the effect of income transfer, we built a database using Access.
Due to problems in filling out the registration forms, lapses in keying in data, and other operational difficulties in the database, losses were recorded in the study universe.
At T0, data were obtained for a total of 1,517 beneficiary families and 357 families from the control group.
At T1 , data included 1,285 beneficiary families and 277 families from the control
group.
To be able to analyse families over time, reflecting their progress, we cross-analysed the registration forms for T0 and T1, thus including only the families whose forms were properly filled out for both moments in time. We were left with a new population of 1,218 beneficiary families and 268 families from the control group.
Since one of the study’s objectives was to evaluate the school performance of children receiving grants in order to assess whether provision of the stipend had a positive impact on learning among socially underprivileged children, we opted to give a math test to third grade students from pre-selected schools. The test was given during the first two weeks of May 2000 to children both on and off the school grant. In order to allow for a more rigorous evaluation of the school grant’s effect on the children’s performance, it proved indispensable to gather data on the non-grantees’ social background. To do this we returned to the field to locate these families through the schools where the children had taken the test and applied the T1 form to parents or guardians of children who were not receiving school grants, but who were classmates of children who were. A new database was built up on a group containing 409 families that had not been included initially in either the universe of children receiving school grants or the control group.
The main difficulty in this new stage of the work was to correctly associate the names of children receiving school grants and who had taken the test with those of dependants under 14 years of age who were already included in the database. We observed flaws in the data processing that led once again to reducing the universe of

21
children and families in the sample pertaining to school performance. Finally, of the 354 children that took the test, we succeeded in locating 271 in the database. Of the children not receiving school grants, we have data pertaining to 409.
These stages are summed up below in Table 11:
Table 11. Total numbers in the data bases
Beneficiary
families Family control
group Student
control group
Total registered T0 1 517 357 T1 1 285 277 Comparison, T 0 and T 1 1 218 268 Families of children taking test based on common T0 and T 1 data base 217 409
Variables available in the database
The database contains 2 types of information:
§ Characteristics of the families (number of family members, type of family, access to infrastructure and consumer and durable goods), applicants, spouses (level of schooling, situation in the labour market), and children (with and without school grants).
§ Income distribution of the families, according to family income before and after receiving the stipend. During re-registration (T1), many of the families included the amount corresponding to the stipend (school grant) under “other sources of income”, which hampered the analysis of variation in income over time. In principle there was no way to subtract only the stipend, since we had no way of identifying these families in a non-random fashion. To attempt to minimise this distortion, we chose to calculate the mean weight of the item “other sources of income” under the total income of all the families in T0, where the stipend was not reported, and apply it to the total income, having excluded the value corresponding to the item “other sources of income” in T1, thereby obtaining, based on this calculation, an approximate value for family income in T1.
3.3 Evaluation of the programme’s impact on beneficiary families
Characteristics of the beneficiary families
The first observation based on the database is that nearly all of the applicants (93 per cent) are women, which results from the fact that the mothers of the children eligible for the school grant are generally the family members who apply for registration in the Programme and to whom the stipend is paid directly (Lavinas, 1999).

22
Table 12 shows a summary of the characteristics of families who became Programme beneficiaries at baseline (T0), that is, immediately prior to receiving the stipend.
Table 12. Characteristics of beneficiary families (1,515) in Recife Scholarship Programme at T0
Families selected
Type of family Female single parent 41.0% Male single parent 1.0% Nuclear 58.0%
Mean number of members 5.2 Mean family income (1)
Per capita R$17.12 Total R$102.76
Applicant’s level of schooling Illiterate 17.1% Literate 41.8% Primary 35.3% Second 3.2% Missing 2.6%
Access to basic infrastructure Electricity 95.4% Running water in home 86.8% Sewerage 65.7%
Ownership, durable goods Appliances
Gas stove 90.3% Electric mixer 60.1% Refrigerator 59.8% Colour TV 51.8% Sound system 39.5% Radio 35.6% Black and white TV 28.5% Bicycle 20.6% Sewing machine 8.8% VCR 3.4% Other house 0.4% Additional land 0.2% Auto 0.0%
Note: Excluded from this mean value were 75 families with a per capita income of more than R$40. We thus presuppose an error of some 5 per cent in the selection of families Source: Register, Recife Scholarship Programme
As expected, among the poorest segments of the population, there is a high percentage (41 per cent) of single-parent families headed by women, especially as

23
compared to the Brazilian average (some 24 per cent). This situation is explained by the fact that families headed by single women are more prone to extreme poverty, especially since they depend on a single source of income, almost always unstable and insufficient, and because these women suffer heavy discrimination in the Brazilian labour market.
The beneficiary families have an average of five members. Average monthly per capita family income was estimated at R$17, or US$9, way below minimum subsistence. Note that income is one of the Programme’s main selection criteria; families are only eligible for the stipend if their per capita family income is less than one-third of the minimum wage. In 1997, when one-third of the minimum wage was R$40 (approximately US$24), 5 per cent of the beneficiary families had income above this local poverty line. We thus observe that the income criterion set by the Programme is widely complied with, since the targeting reaches the extremely poor segments of the population, suffering severe deprivation. Thus, its efficiency is associated with the extremely low poverty cut-off line. However, whilst the targeting serves primarily those living in destitution, it is far from serving everyone in that situation.
As for level of schooling, a large proportion of mothers who had not even entered the first grade of primary school; 17 per cent were illiterate and another 42 per cent considered themselves barely literate. It was not surprising that virtually none of the mothers had finished the first grade.
Access to basic public services infrastructure was less precarious than one might imagine, considering that it was such a destitute segment of the population. The only exception was connection to the sewage system, which was only present in 65 per cent of the households. On the other hand, the number of families who reported having running water and electricity at home was 86 per cent and 95 per cent, respectively. Such widespread access to running water and electricity can be explained by the fact that Recife is a metropolitan area, and especially by the fact that clandestine electric wire hook-ups and doubling-up of several households on the same light meter make this public service “free” or at least more affordable.
Another measure of a family’s level of need is the number of durable goods it possesses. The most common durable consumer goods were gas stoves (90 per cent), followed by electric mixers (60 per cent), refrigerators (almost 60 per cent), and colour TV sets (52 per cent). Note that cars and other more expensive durable goods did not appear during the selection process for families applying for the Programme.
Table 13 shows the occupational situation of mothers and fathers in the work market. The percentage of mothers working was 40 per cent, with only 8 per cent employed in the formal labour market. Most economically inactive mothers were housewives. The unemployment rate of mothers was extremely high (46 per cent), over twice that of spouses or fathers (20 per cent). This shows how difficult it is for poor Brazilian women to have a job or even an informal occupation. The right to work is virtually denied to them.
Nearly 70 per cent of the spouses were occupied working, although only a small proportion (16 per cent) were employed in the formal work market. The percentage of inactive spouses was low (6 per cent), whilst the unemployment rate in this almost

24
totally male group was high, at 20 per cent. This Table suggests that work opportunities for beneficiary families, especially for formal jobs, are extremely limited.
Table 13. Parents’ situation in work market
Mother’s situation
Spouses situation
Active 608 40% 599 68% Employed in formal work market 122 8% 139 16% Informal ocupation 486 32% 460 52%
Inactive 155 10% 50 6% Housewives 112 7% 50 6% Retired/Pensioners 43 3% 172 20%
Unemployed 704 46% 59 7%Not reported or missing 48 3% 880 100%Total mothers 1 515 100% 599 68%
Source: Register, Recife Scholarship Programme.
The age/grade lag in schooling indicates the acutely precarious conditions in which the children of these families live.
Graph 2 shows the distribution of 2,990 children in the Programme’s families, according to the primary school grade in which they are enroled.19 In the 7 to 10 year bracket, there is a tendency for the age and grade to match: although pupils may lag somewhat behind, the lag is still small in the first grade and gradually increases in the subsequent grades. Beginning at age 11, the situation gets worse, with a drop in the percentage of pupils in the “proper” grade: thus, only 10 per cent of 11-year-old children are in the fifth grade, 7 per cent of 12-year-olds in sixth, and only 3 per cent of 14-year-olds in eighth. The situation is dramatic, even if one adds the number of children from the grade immediately prior to the “proper” one:
11 years old – 31 per cent in the 4th and 5th grades 12 years old – 27 per cent in the 5th and 6th grades 13 years old – 13 per cent in the 6th and 7th grades 14 years old – 11 per cent in the 7th and 8th grades
These figures show how the school leads progressively to the social exclusion of poor children: they are delayed in their schooling by this growing age/grade lag, and later on they tend to drop out of school entirely. This indicator shows how serious the problem is for children from severely deprived families. As shown in Graph 2, only a tiny proportion of 14 and 15-year-olds finish primary school, i.e., 3 per cent and 2 per cent, respectively.
19 We chose to also include children 15 years old to capture those who reached this age during the year their respective families were registered for the Programme. Thus the total of 2,990 children covers those in the age bracket from 7 to less than 16 years and belonging to the beneficiary families.

25
Graph 2. Recife : distribution of children ages 7 to 15 years with grants, by grade in primary school and age
As we have already seen, the target population’s destitution is critical, suggesting how difficult it will be to solve it once and for all. As we already know, a programme with such a design has no real chance of surmounting the limits imposed by the logic involved in the reproduction of poverty. Nevertheless, it is necessary to estimate the Programme’s impacts, two of which interest us the most: what is the school grant’s effect in mobilising families to keep their children in school? And what is the school grant’s effect in reducing the families’ poverty?
3.4 Educational impacts
In this section we analyse the impact of the Scholarship Programme in Recife from the perspective of education, focusing on the most important factors determining school performance, i.e., the school institution and the families’ socio-economic and cultural conditions.
We will analyse these factors with a view to understanding to what extent the school is well utilized as a resource by the Scholarship Programme and to what extent the schools have the necessary conditions to perform this work. We will also evaluate the possible weight of factors related to family life, highlighting the school grant’s effects in promoting the schooling of poorer children. Note that we do not intend to discuss the individual performance of children with and without school grants. This only interests us as an indicator of the Programme’s quality. In addition, we should recall that the Programme has only been in force for two full years, thus not allowing for a consistent and definitive assessment of its impact on the children’s individual learning.
0%
10%
20%
30%
40%
50%
60%
70%
80%
7 8 9 10 11 12 13 14 15 Age
% o
f chi
ldre
n in
eac
h gr
ade
0 1st grade 2nd grade 3rd grade 4th grade 5th grade 6th grade 7th grade 8th grade
Source: Register, Recife Scholarship Programme - T 0
Total dependents 7-15 yrs. old: 2,990
grade enrolled

26
The first part of the evaluation consists of a comprehensive (or qualitative) analysis of the Programme, in which we examine the type of relation established between the various actors involved in conceiving and executing it. The second is more quantitative, consisting of the analysis of school performance factors.
To conduct the educational evaluation, we constructed a sample with 13 schools participating in the Programme. The sample allowed us to represent the proposals of the Programme’s leaders and the relatively diverse set of social situations characterizing the catchment public of these schools.
Among the schools in the sample, we were able to obtain supplementary information to characterize the nature of the relationship between these institutions and the Programme’s co-ordinating body and to deduce the schools’ perspective towards the pupils receiving the school grant. We should emphasize that the prevailing view of both school administrators (headmistresses) and teachers is positive. The Scholarship Programme is viewed by both as a support measure encouraging the pupils to remain in the classroom, fostering parent participation and interest in the school, raising the families’ awareness of the need for schooling, and improving the children’s behaviour, besides representing a form of financial aid. The basic data on schools (Appendix 2) were collected from the questionnaires (Appendices 3 and 4) filled out by school administrators and third grade teachers from the 13 schools in the sample.
The school performance test
To measure performance and to analyse the factors influencing it, we gave a test to third grade pupils, supplemented by information from the schools (Appendix 5). We used data on the families of children with school grants from the City Government’s register and a questionnaire (with the same format as the registration form) for parents of pupils not receiving school grants.
The performance test was introduced as an objective measure to verify not only whether the school is well-utilized by the Programme as a resource, but also whether participating schools have the necessary conditions for their part in this work, that is, whether they guarantee reasonable learning achievement by children receiving school grants. In addition, use of an objective test offered us the possibility of evaluating to what extent family conditions affect the children’s learning. It is well known that there are two types of social factor which affect a child’s experience in school: those associated with the school as an institution at all its various levels, and those related to the socio-cultural and economic conditions of the pupils’ families.20
Despite provoking serious criticism, the use of a test to measure learning has become increasingly widespread (see Forquin, 1995; Merle, 1998). Furthermore, important knowledge has been produced on tests’ methodology, content, and results, allowing for a more adequate use of this form of evaluation. Note for example the observation that objective tests, by verifying the learning of school-related knowledge per se (like mathematics or science, for example), shows higher performance among
20 It is important to highlight this point: it is the social factors that will be analyzed. School performance also depends on other variables not measured here, like intelligence and diligence.

27
socially less favoured pupils as compared to their classmates from higher socio-economic strata (Duru-Bellat and Van Zanten, 1999). This observation is relevant in that this test’s target consists of extremely poor children. Use of a form of objective evaluation, measuring only school-related knowledge, guarantees the value of this measurement.
The test was a mathematics test drawn up by experts from CIDE/Chile for UNESCO/OREALC, for children in the second grade of primary school in Latin American countries. The test takes into consideration the school curricula in the respective countries, and has been tested successfully for several years. This same test has already been used by the Minas Gerais State Department of Education, as well as in a comparative survey conducted in Belo Horizonte, currently under way. 21 In the case of Recife, 20 questions from this test were used, some with a slightly different format to include suggestions by the Municipal Department of Education, with whom this entire process was discussed step by step. 22
The test was given to 967 third grade pupils from the 13 municipal schools in the sample, making a total of 39 classes, during the first week of May 2000. To give the test, we had the collaboration of two teachers from the Municipal Department of Education itself, as well as from administrators and teachers from the respective schools and classes to mobilize and organize the testing process. All of the pupils in the respective classes took the test, and the pupils receiving school grants were not identified during administration of the test. These children were spread throughout all the classes, totalling 350 pupils. They were identified as Scholarship Programme participants afterward, based on lists provided by the schools. Test response time ranged from an hour to an hour and a half, and the questions were read one by one by the teacher or person in charge of administering the test.
The average score on the test was 5.32 (out of a total of 10), with a standard deviation of 2.03. Distribution of the results followed a normal curve, indicating that the test was adequate for its target public, i.e., that the degree of difficulty was appropriate for the type and amount of knowledge accumulated by these children.
Results of the test
There is a well-known association between age, gender, and school performance. It is known that children outside the age corresponding to the respective grade tend to score worse, and that boys tend to score worse than girls.
Table 14 shows that most of the pupils taking the test were concentrated in the 8 to 10-year age bracket. In this age group, considered appropriate for the third grade, the average score was 5.32. Among the children older than this, there was a slight variation,
21 “Preventing Repetition and Dropout in Latin America: Argentina, Brazil, Chile, and Mexico”, co-ordinated by Laura Randall, Joan Anderson and Maria Ligia de Oliveira Barbosa, with funding by the Ford and Tinker Foundations.
22 The test presupposes knowledge of the subject matter given by the end of the second grade, thus appropriate for children who have at least finished this grade. Such is the case of pupils beginning the third grade.

28
with a mean score of 5.31, despite the extremely low score of 2.55 for the only 17-year-old pupil. The very young pupils also showed a slight variation. This means that age is a not a significant factor for variance in performance. However, note the high concentration of older pupils (32.5 per cent of the third grade students), confirming the previous remarks on the age/grade lag in the Recife school system.
Table 14. Test scores by age
Age Number of pupils Mean score Standard deviation 7 3 5.42 1.28 8 115 5.47 1.99 9 302 5.17 1.93 10 228 5.44 2.04 11 137 5.31 2.02 12 99 5.34 2.18 13 54 5.45 2.26 14 17 5.08 1.82 15 1 1.5 - 16 2 5.67 4.84 17 1 2.55 - 19 1 6 -
Although age was not significant in explaining school performance, the children with school grants showed an age differential which merits attention, since it is a traditional indicator of possibilities for success in school. As noted in Table 15, children with school grants are, on average, older than their classmates. This is one more indication that they need more special attention: in a system characterized by older-than-average pupils, the selection of pupils who are older than their classmates or who have a larger age/grade lag indicates that the Programme was properly targeted.
Table 15. Mean age of pupils with and without school grants in the school sample
Mean age Standard deviation Minimum age Maximum age
Without grant 9.88 1.57 9 19 With grant 10.36 1.47 8 15
Gender is another variable that usually displays relevant differences in test performance. However, in our sample this difference was the opposite of traditional patterns, with girls scoring below boys (Table 16). This could be explained by the fact that we were analysing the results of an external test: as the relevant literature shows (Forquin, 1995; Duru-Bellat, 1990), boys, despite their relatively worse performance in school, end up doing better than girls on external tests specifically.
This reverse trend suggests the need for special attention by the Programme in relation to girls, due to an additional complicating factor. We had already observed that contrary to prevailing patterns in Brazil, where women have more schooling than men, girls showed a larger age/grade lag than boys (Lavinas et. al, 2000b). These
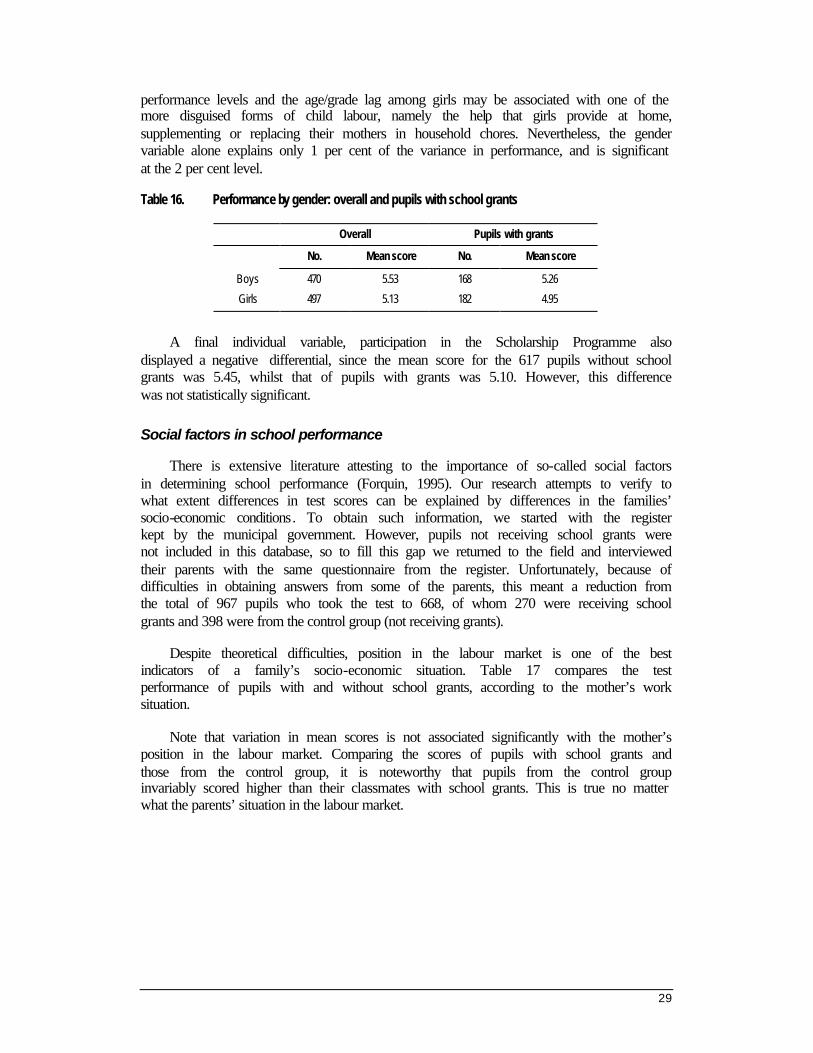
29
performance levels and the age/grade lag among girls may be associated with one of the more disguised forms of child labour, namely the help that girls provide at home, supplementing or replacing their mothers in household chores. Nevertheless, the gender variable alone explains only 1 per cent of the variance in performance, and is significant at the 2 per cent level.
Table 16. Performance by gender: overall and pupils with school grants
Overall Pupils with grants
No. Mean score No. Mean score
Boys 470 5.53 168 5.26 Girls 497 5.13 182 4.95
A final individual variable, participation in the Scholarship Programme also displayed a negative differential, since the mean score for the 617 pupils without school grants was 5.45, whilst that of pupils with grants was 5.10. However, this difference was not statistically significant.
Social factors in school performance
There is extensive literature attesting to the importance of so-called social factors in determining school performance (Forquin, 1995). Our research attempts to verify to what extent differences in test scores can be explained by differences in the families’ socio-economic conditions. To obtain such information, we started with the register kept by the municipal government. However, pupils not receiving school grants were not included in this database, so to fill this gap we returned to the field and interviewed their parents with the same questionnaire from the register. Unfortunately, because of difficulties in obtaining answers from some of the parents, this meant a reduction from the total of 967 pupils who took the test to 668, of whom 270 were receiving school grants and 398 were from the control group (not receiving grants).
Despite theoretical difficulties, position in the labour market is one of the best indicators of a family’s socio-economic situation. Table 17 compares the test performance of pupils with and without school grants, according to the mother’s work situation.
Note that variation in mean scores is not associated significantly with the mother’s position in the labour market. Comparing the scores of pupils with school grants and those from the control group, it is noteworthy that pupils from the control group invariably scored higher than their classmates with school grants. This is true no matter what the parents’ situation in the labour market.

30
Therefore, the variable position in the work market does not explain differences in performance. 23 These results may reflect the absence of real variation in the work positions occupied by parents of these children.
Table 17. Mean test scores according to mother’s position in the labour market
Position of mother in the labour market
Situation vis-à-vis programme
Mean score Standard deviation
Number of pupils
Wage-earner Without grant 5.32 1.83 55 With grant 5.26 2.09 31 Self-employed Without grant 5.30 2.38 61 With grant 4.93 1.87 25 Odd-jobber Without grant 5.89 1.94 72 With grant 5.00 1.88 55 Retired/ pensioner Without grant 5.65 1.81 21 With grant 4.10 - 1 Not working Without grant 5.26 2.01 181 With grant 5.26 1.94 145 No answer Without grant - - -
With grant 3.50 1.85 5
As for per capita family income, Table 18 shows that the difference in this variable between the two groups of pupils in our sample is not very great, when correlated with dispersion in the parents’ income distribution.
Table 18. Per capita family income
Participation No. of families Maximum (R$) Mean (R$) Standard deviation
With grant 269 132.57 25.05 18.43 Without grant 398 560.40 49.65 48.92
Total 667 560.40 39.73 41.34
The group’s homogeneity also appears here: all of the children are extremely poor, and the slight variations in some income measures are insufficient to produce effects in school performance. This homogeneity becomes evident in Table 19, where we present the variation in children’s mean test scores according to the per capita family income quintile, with and without the school grant.
In all the quintiles, school performance of pupils with school grants, as measured by the mean test score, was lower than that of their classmates from the control group. This is the only conclusion allowed by the data, since there is no association between the two variables allowing us to draw an association between increased test scores and higher income.
23 There is only one exception to this rule: for pupils whose mothers are outside the labour market, the average score is identical.

31
Table 19. Mean test score according to per capita family income quintile
Per capita family income Participation Mean Score Standard deviation No.
Income < R$15.41 Without grant 5.40 2.29 53 With grant 5.13 1.93 77 R$15.42 < R$ 25.16 Without grant 5.36 1.86 56
With grant 5.19 2.03 68 R$25.17 < R$37.32 Without grant 5.39 2.17 70
With grant 5.21 2.01 61 R$37.33 < R$55.00 Without grant 5.32 2.06 94
With grant 5.16 1.78 42 > R$55.01 Without grant 5.60 2.00 117
With grant 4.92 1.72 14
The cultural area includes another series of factors that could potentially have an important impact on school performance. One traditional measure of a family’s cultural capital is level of schooling. We analysed the level of schooling for mothers of children who took the test, normally the cultural variable most strongly associated with the child’s performance. Table 20 shows the mean scores by pupils according to the mother’s level of schooling.
Table 20. Mean scores according to mother’s level of schooling
Mother’s schooling Mean score Standard deviation No. of children
Illiterate 5.10 1.90 77
Literate 5.14 2.02 143 Primary school 5.37 2.05 303
Secondary school 5.68 2.08 66 University 5.43 0.81 3 No answer 5.31 1.81 77 Total 5.31 2.00 669
Distribution of schooling among parents of children with school grants and the control group is quite similar, confirming both the social proximity of the two groups and the appropriate selection of the control group. Observed differences in schooling among the parents are so small that they cannot explain the variation in scores. Obviously, such a statement should be interpreted within the overall Brazilian social context, where in general schooling only produces measurable social differences at the secondary or university levels. In the case of the Recife Programme, there were very few parents who had even started secondary school.
To deal with values is to deal with a dimension that is extremely complex and difficult to define or measure. In this study, we added several questions to the re-registration process to evaluate the importance families ascribe to school (questions about the circumstances under which the mother would consider it reasonable for her

32
child to miss school), as well as the nature of relations the family establishes with the school institution (questions about the mother’s vigilance over her child’s performance and homework and the circumstances under which the mother would appear at the school). These variables also failed to prove significant in explaining differences in school performance, as discussed in Appendix 6.
Institutional factors
A major change occurring in the 1990s in educational analysis was the shift in causal relations. Although the family’s socio-economic and cultural conditions continued to be considered as having a considerable influence on school performance, French researchers identified what they refer to as the “establishment effect” (Cousin, 1998). This new research focus demonstrates that the school’s quality has important effects on pupils’ performance.
Although this statement is obvious, consider its corollary: in good schools, performance by economically disadvantaged pupils is close to that of their socially less underprivileged classmates (Barbosa, 1999). In other words, the way schools function may - or may not - allow them to reduce the negative effects of their families’ socio-economic situation, in such a way that socialisation through the school at least partially overcomes the family’s deficiencies, guaranteeing all students the possibility of keeping abreast of their time (as Pierre Bourdieu would put it), or to truly become social agents (see Margaret Archer) or full citizens.
At this stage we focus basically on two variables: the school and the class. Of course each of these encompasses a separate set of factors. However, what interests us, rather than an isolated analysis, is to verify to what extent the school’s organisation as a whole and the functioning of each class may influence performance by pupils.
The school’s importance appears clearly in Table 21. Overall, the “establishment effect” explains 13.4 per cent of variance in test scores and is highly significant.24 Thus far, this was the variable with the strongest single explanatory power in performance differences. It could hypothetically be broken down into different factors, ranging from the school administrator’s (headmistress) work to that of the teaching supervisors, including teachers’ methods and even the size of the school. 25
Table 21 thus shows that the performance of pupils with school grants does not differ systematically from that of their classmates. Significant differences remain between schools, almost in identical proportions. This confirms what school administrators and teachers had already reported: the problems they face are not caused by pupils with school grants, who might potentially be viewed as less prepared; rather, problems result from routine flaws in the school system. This also suggests that the
24 For the regression by which we verify the potential of the school variable, “dummy” variables were used based on school no. 4 (the one with the worst mean performance), thus measuring the differential (as compared to this school 4) that pupils might (hypothetically) achieve because of belonging to each of the other schools.
25 This last factor, specifically, appears not to have an impact in the case of the schools in our sample.

33
school is more important than the Scholarship Programme in differentiating performance.
Table 21. Mean scores according to participation in Scholarship Programme and individual school
All pupils Pupils with grant
School Number Mean score Standard deviation Number Mean score Standard deviation
1 130 5.68 2.00 63 5.15 2.11
2 72 6.06 2.05 26 5.68 1.85 3 36 4.94 1.60 13 4.63 1.43 4 29 3.81 1.84 21 3.85 1.79 5 77 5.75 1.79 42 5.71 1.78 6 85 4.92 1.95 29 4.81 2.02
7 86 5.97 2.32 24 6.13 2.10 8 85 4.65 1.89 44 4.85 1.97
9 99 5.10 1.79 23 4.81 2.02 10 33 3.96 1.62 19 3.96 1.56
11 57 5.39 1.68 15 5.27 2.05 12 82 4.20 1.54 12 3.92 1.68 13 96 6.50 2.01 19 6.27 1.96
Among the factors cited above to characterise the “establishment effect”, one stands out: the class. There is an enormous variation in the mean scores obtained by the 41 classes in the sample (all third grade classes from each school in the sample took the math test). Table 22 shows these variations. The most surprising observation is that this variable explains 25.9 per cent of the variance in test scores and is highly significant statistically.26 This means that this variable has the single greatest explanatory effect.
We interpret “class effect” as mainly the effect of the teacher’s work, including the teaching methods utilised, choice of subject matter and problems, and disciplinary approach. There is some speculation as to the possible effect of contacts with classmates, as reflected for example in the fact that less prepared pupils tend to improve their performance after joining better classes. 27 The social conditions of pupils in our sample aspect do not allow for speculation on this, since they are not sufficiently differentiated for this purpose. Therefore we may speculate that what we are observing is a “teacher effect”.
We should also emphasize the same regularity in mean test scores for pupils with school grants and pupils as a whole from the same class. This is a strong indicator that a
26 Once again, we used “dummies” to verify the differential of each class as compared to the one chosen as the basis (class 41).
27 According to research from the United States, African-American pupils in predominantly white classes tend to perform better than those in all-black classes (Forquin, 1995).
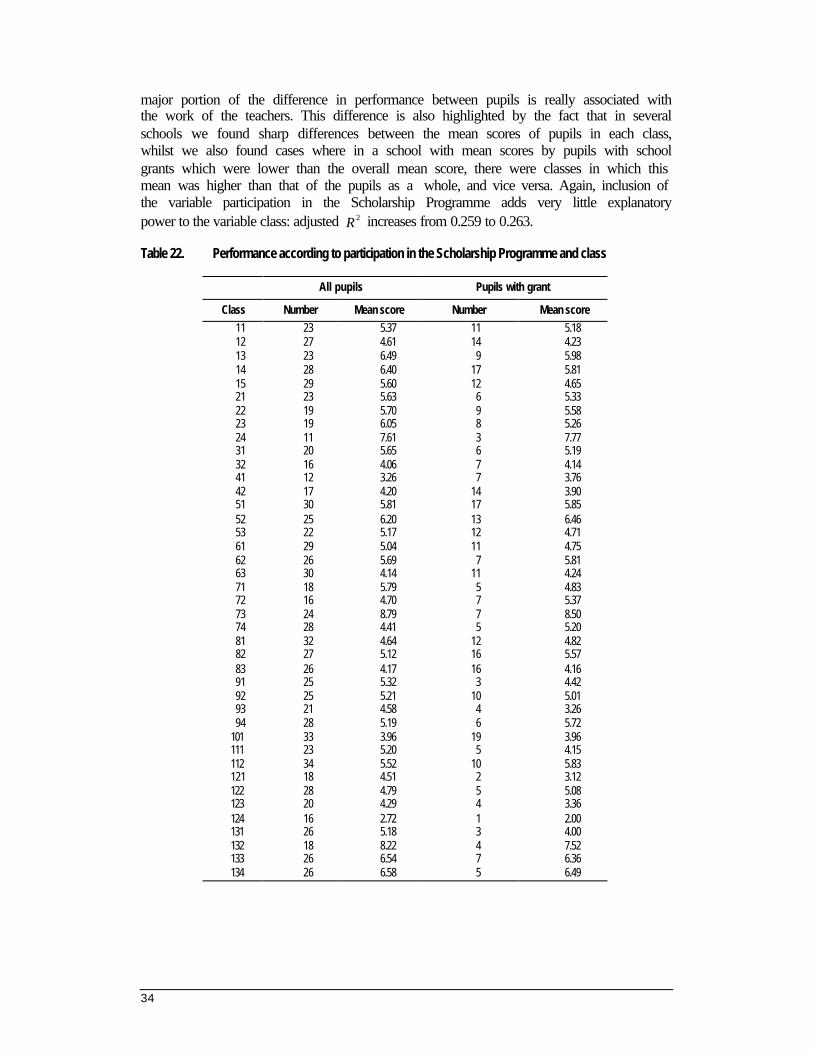
34
major portion of the difference in performance between pupils is really associated with the work of the teachers. This difference is also highlighted by the fact that in several schools we found sharp differences between the mean scores of pupils in each class, whilst we also found cases where in a school with mean scores by pupils with school grants which were lower than the overall mean score, there were classes in which this mean was higher than that of the pupils as a whole, and vice versa. Again, inclusion of the variable participation in the Scholarship Programme adds very little explanatory power to the variable class: adjusted 2R increases from 0.259 to 0.263.
Table 22. Performance according to participation in the Scholarship Programme and class
All pupils Pupils with grant
Class Number Mean score Number Mean score 11 23 5.37 11 5.18 12 27 4.61 14 4.23 13 23 6.49 9 5.98 14 28 6.40 17 5.81 15 29 5.60 12 4.65 21 23 5.63 6 5.33 22 19 5.70 9 5.58 23 19 6.05 8 5.26 24 11 7.61 3 7.77 31 20 5.65 6 5.19 32 16 4.06 7 4.14 41 12 3.26 7 3.76 42 17 4.20 14 3.90 51 30 5.81 17 5.85 52 25 6.20 13 6.46 53 22 5.17 12 4.71 61 29 5.04 11 4.75 62 26 5.69 7 5.81 63 30 4.14 11 4.24 71 18 5.79 5 4.83 72 16 4.70 7 5.37 73 24 8.79 7 8.50 74 28 4.41 5 5.20 81 32 4.64 12 4.82 82 27 5.12 16 5.57 83 26 4.17 16 4.16 91 25 5.32 3 4.42 92 25 5.21 10 5.01 93 21 4.58 4 3.26 94 28 5.19 6 5.72
101 33 3.96 19 3.96 111 23 5.20 5 4.15 112 34 5.52 10 5.83 121 18 4.51 2 3.12 122 28 4.79 5 5.08 123 20 4.29 4 3.36 124 16 2.72 1 2.00 131 26 5.18 3 4.00 132 18 8.22 4 7.52 133 26 6.54 7 6.36 134 26 6.58 5 6.49

35
Compound effects on school performance
Moving on to another level of analysis, we now present the results of multivariate models considering the joint effect of the variables discussed above. This should enable us to distinguish the effect of each of these variables, controlling the effect of the others.
The data
Compiling and processing the collected data produced a database containing the variables listed below and utilised in subsequent analyses. The data are available for a sample of 616 observations corresponding to the set of pupils who took the test (students with school grants and the “control group”), for whom we succeeded in gathering the complete set of supplementary information, as mentioned previously. variables are listed here to facilitate the subsequent presentation.
N = test score α = minimum score E = numerical value indicating the quality of the pupil’s school * T = numerical value indicating the quality of the pupil’s class * X = pupil’s gender (0= male; 1= female) I = pupil’s age (in years) Y = family income (in R$) A = parents’ schooling * Q = number of rooms in home L = electricity in home (0= no; 1= yes) M = number of family members under 14 years of age at home B = school grant (0= no; 1= yes) C = numerical value indicating pupil’s previous performance (school
record) * Variables E and T are numerical values that measure the relative value of the school and the class (teacher), according to the
following arbitrary classification: 0=terrible, 1=bad 2=low average, 3=high average, 4=good and 5=excellent.
Variable E , quality of the school, was constructed on the basis of the pupils’ mean test scores for each school. It was conceded that the schools with the highest mean scores were the best, whilst those with the lowest mean scores were the worst. The choice of ranges for scores corresponding to the various measures of value followed an approximately symmetrical and unimodal distribution of categories. Table 23 shows the ranges chosen and the proportion of each type of school in each one of them.
Table 23. Construction of the “Quality of School” variable
School’s mean score Number of schools* Frequency (%) Classification Quality of school
3.00 0 0.0 0 4.00 2 15.4 Bad 1 5.00 4 30.8 Low average 2 6.00 5 38.5 High average 3 7.00 2 15.4 Good 4 8.00 0 0.0 Excellent 5 Total 13 100.0
* with mean score between this category and the previous one

36
Variable T , quality of the class (teacher) was based on the classification of the difference between the class’s mean score and the mean score of the school to which the class belongs. Again, the classification ranges were to obtain an approximately symmetrical and uni-modal distribution. Table 24 shows the ranges and respective proportions of schools.
Table 24. Construction of the “Quality of Class” variable
Deviation from school mean
Number of classes*
Frequency %
Classification Quality of class
(2.00) 0 0.0 Terrible 0 (1.00) 5 12.2 Bad 1 - 15 36.6 Low average 2 1.00 18 43.9 High average 3 2.00 2 4.9 Good 4 3.00 1 2.4 Excellent 5 Total 41 100.0
* with mean score between this ca tegory and the previous one
Variable C represents the pupil’s performance or school record (intelligence and marks) prior to entering the Scholarship Programme. The Programme’s ability to benefit pupils could thus be measured by identifying systematic differences (among pupils with and without school grants) between test scores, as compared to prior school performance or school record. We used the pupils’ marks for both Portuguese and Mathematics from the years 1998 and 1999, respectively, calculating the mean for these 4 marks, the statistics of which are given in Table 25.
Table 25. Construction of the “Pupil’s school record” variable
Mean marks 1998 and 1999
Record
From To
Absolute frequency
Relative frequency % Classification
0 2 0 0 Bad 0 >2 4 4 3.88 Low average 1 >4 6 32 31.07 High average 2 >6 8 54 52.43 Good 3 >8 10 13 12.62 Excellent 4 Mean 6.5 103 100.0 2.7
Unfortunately these marks in Portuguese and Mathematics (just prior to being given the math test in the study) were only available for some of the pupils (103), and they were only pupils who were receiving school grants. To fill this gap we ascribed a “pupil’s school record” of 3 to the other pupils, which was the modal score of pupils for whom information was available. The mean pupil’s school record in the group was 2.7, but we know that the qualitative information for the pupils with school grants was slightly “worse” than for the others, which justifies ascribing the score 3 to the others. We hope that by adopting this procedure we will have avoided introducing a bias into the estimate. The histogram of the resulting variable is presented in Graph 3, showing

37
the high probability of occurrence of school record 3, a consequence of the nature of the procedure adopted to construct it.
Graph 3. Histogram and statistics of the “Pupil’s school record” variable
*The variable A, parents’ schooling, was calculated as the mean of the index referring to schooling of the pupil’s mother (or guardian) and that of the respective spouse in the survey questionnaire: 0= illiterate, 1= literate, 2= primary school, 3= secondary school, 4= university
As seen previously, the variable I, pupil’s age, can be used to calculate the pupil’s age/grade lag, since theoretically the appropriate age for third grade pupils would be 9 years.
Variable Y, per capita family income, was obtained by dividing total mean family income by the number of family members, both as reported in the questionnaire. Mean income was approximately one-half the minimum wage (R$46.45), with a standard deviation of R$40, but there were several cases of zero income as well as some outliers, with an income much higher than the others (maximum income was R$560.40). The resulting distribution suggests that serious problems occurred with this information that may have jeopardized the usefulness of this variable for analytical purposes. This is illustrated by the histogram, presented in Graph 4. In an attempt to overcome this difficulty, we eliminated from the sample the observations with income below R$5 or above R$300 in the regressions in which this variable was used.
Variables Q, L, and M aim to capture the pupil’s study conditions at home, and the reasoning behind their inclusion was as follows:
Q = reflects room and privacy for studying.
L = is the availability of electric lighting, offering better conditions for study at home and for expanding knowledge through access to information in general.
M = is the number of other children under 14 years of age in the family, reflecting demands on the pupil’s time for joint activities with siblings (including taking care of them).
0
200
400
600
800
1.0 1.5 2.0 2.5 3.0 3.5 4.0
Series: CNOTAP2 Sample 1 700 Observations 700
Mean 2.961429 Median 3.000000 Maximum 4.000000 Minimum 1.000000 Std. Dev. 0.292878 Skewness -2.506855 Kurtosis 19.76847
Jarque-Bera 8934.297 Probability 0.000000

38
Graph 4. Histogram of the income variable
Table 26. Basic statistics on variables in the sample
Mnemonic Variable Mean Median Maximum Minimum Standard deviation
Test score N 5.32 5.3 10.0 1.0 2.00 Grant B 0.38 0.0 1.0 0.0 0.49 Age I 10.02 10.0 14.0 7.0 1.43 Gender X 0.51 1.0 1.0 - 0.50 Sibs M 2.90 3.0 8.0 1.0 1.38 Income Y 46.45 38.0 560.4 0.0 40.87 Rooms Q 4.26 4.0 10.0 1.0 1.54 Electricity L 0.98 1.0 1.0 0.0 0.13 Parents’ School A 2.57 2.5 5.0 0.0 1.26 School E 2.78 3.0 4.0 1.0 0.80 Class T 2.99 3.0 5.0 1.0 1.09
Table 26 show the basic statistics on these variables in the sample indicating that:
§ The mean math test score was 5.3.
§ 38 per cent of the pupils in this sample were receiving school grants.
§ Mean and median age was 10 years, and maximum age was 14 years. Surprisingly, however, there were several 8-year-old third-grade pupils and one only 7 year-old. Standard deviation for age was also high (1.43), indicating great variance in the interval from 8 to 13 years.
§ The mean number of children under 14 years old in the families was almost 3.
§ Mean number of rooms in the home was 4, with a relatively small standard deviation of 1.5.
§ Practically all (98 per cent) of the families had electricity at home, eliminating the possibility that this variable was relevant in distinguishing between pupils in this sample.
0
50
100
150
200
250
300
0 50 100 150 200 250 300 350 400 450 500 550
Series: RENDASample 1 616Observations 616
Mean 46.44982Median 38.00000Maximum 560.4000Minimum 0.000000Std. Dev. 40.86759Skewness 5.009286Kurtosis 49.15101
Jarque-Bera 57244.05Probability 0.000000
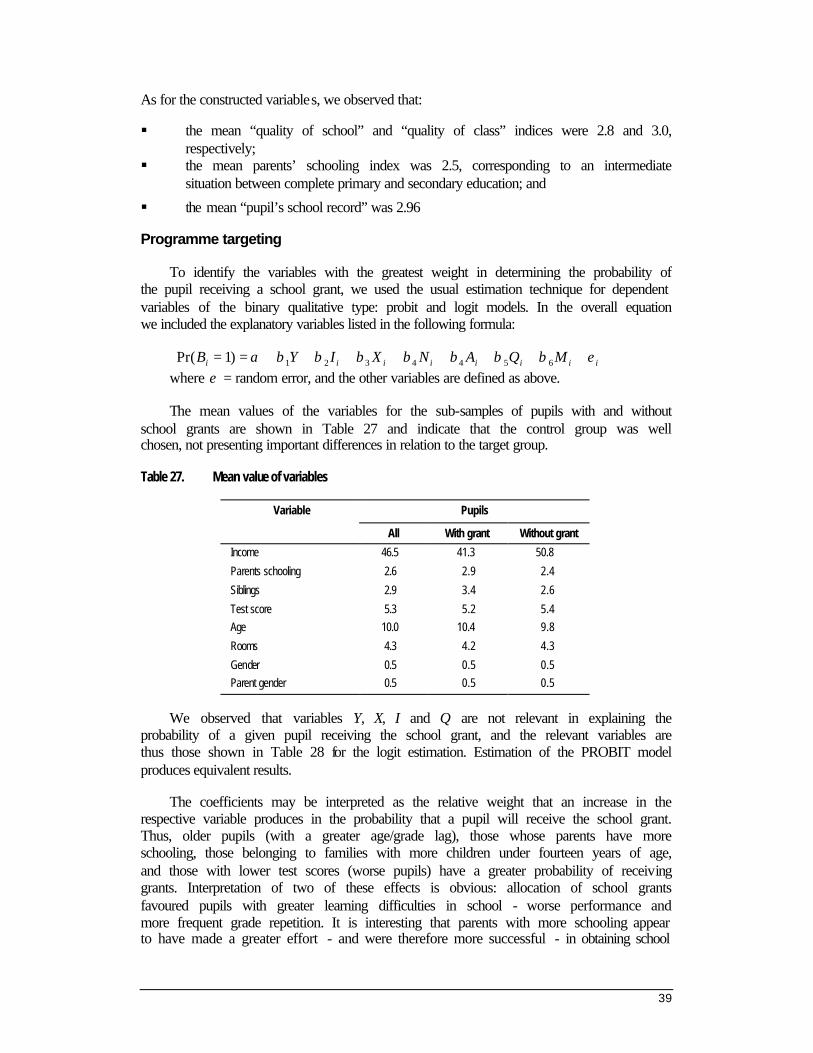
39
As for the constructed variables, we observed that:
§ the mean “quality of school” and “quality of class” indices were 2.8 and 3.0, respectively;
§ the mean parents’ schooling index was 2.5, corresponding to an intermediate situation between complete primary and secondary education; and
§ the mean “pupil’s school record” was 2.96
Programme targeting
To identify the variables with the greatest weight in determining the probability of the pupil receiving a school grant, we used the usual estimation technique for dependent variables of the binary qualitative type: probit and logit models. In the overall equation we included the explanatory variables listed in the following formula:
iiiiiiii MQANXIYB εβββββββα ++++++++== 6544321)1Pr( where ε = random error, and the other variables are defined as above.
The mean values of the variables for the sub-samples of pupils with and without school grants are shown in Table 27 and indicate that the control group was well chosen, not presenting important differences in relation to the target group.
Table 27. Mean value of variables
Variable Pupils
All With grant Without grant
Income 46.5 41.3 50.8 Parents schooling 2.6 2.9 2.4 Siblings 2.9 3.4 2.6 Test score 5.3 5.2 5.4 Age 10.0 10.4 9.8 Rooms 4.3 4.2 4.3 Gender 0.5 0.5 0.5 Parent gender 0.5 0.5 0.5
We observed that variables Y, X, I and Q are not relevant in explaining the probability of a given pupil receiving the school grant, and the relevant variables are thus those shown in Table 28 for the logit estimation. Estimation of the PROBIT model produces equivalent results.
The coefficients may be interpreted as the relative weight that an increase in the respective variable produces in the probability that a pupil will receive the school grant. Thus, older pupils (with a greater age/grade lag), those whose parents have more schooling, those belonging to families with more children under fourteen years of age, and those with lower test scores (worse pupils) have a greater probability of receiving grants. Interpretation of two of these effects is obvious: allocation of school grants favoured pupils with greater learning difficulties in school - worse performance and more frequent grade repetition. It is interesting that parents with more schooling appear to have made a greater effort - and were therefore more successful - in obtaining school

40
grants for their children, perhaps denoting a greater marginal belief in the value of education. The fact that receiving a school grant is more likely when a child comes from a family with more children is consistent with a scenario in which grants are scarce and are thus “raffled” among pupils, meaning that families with more children have a better chance of receiving a grant.
Table 28. Logit estimation for probability of having a school grant
Variable Coefficient Standard error t Statistic Probability
Constant -5.5727 0.7647 -7.2880 0.0000 Parent schooling 0.3476 0.0742 4.6832 0.0000 Siblings 0.4588 0.0692 6.6318 0.0000 Test score -0.0926 0.0456 -2.0288 0.0429 Age 0.3270 0.0640 5.1076 0.0000
Log-verisimilitude -356.733
The estimated coefficient informs the relative weight of increasing each of the variables vis-à-vis the probability of obtaining a school grant. Thus, an increase of 1 in parents’ schooling has approximately the same effect on the probability of receiving a school grant as an increase of 1 year in the pupil’s age/grade lag (coefficients of 0.35 and 0.33, respectively). The impact of having one more sibling (coefficient of 0.46) is some 40 per cent greater than that of a one-year increase in age/grade lag. The effect of getting one point less on the test score is some one-third of the first two variables (coefficient of - 0.09).
However, the equation only succeeds in capturing a relatively small portion of the variance in the probability, since the maximum log-verisimilitude value is low. There are sure to be many other factors affecting variance, some of which are systematic (for example, political and personal factors) and others purely random (for example, raffling the grants).
Efficacy of the Scholarship Programme
To evaluate the Programme’s efficacy as an educational tool, we estimated the following equation to control the impact of socio-economic variables on the math test score. The idea was to isolate the school grant’s possible effect, based on the assumption that the effects of the pupils’ intrinsic ability and those associated with performance at the time of the test could be relegated to the random error term:
iiiiiiiiiiii BCIMQAYXTEN εδβββββββββα +++++++++++= 987654321
where ε = random error, and the other variables defined as above.
Variables Y, A, Q, and M did not prove significant, meaning that the effects we hypothesized in relation to per capita income, parents’ schooling, number of rooms in the home, and number of siblings are not empirically relevant to this sample. Variable I (age) is not significant either, probably because it presents two types of opposite impact on the test score, and which may have resulted in a totally ambiguous effect; on the one hand it is an indicator of age/grade lag, and therefore of a negative “pupil’s school record”; on the other hand, older pupils tend to perform better because they are more

41
mature, and when they have repeated a grade they have already been exposed to that grade’s subject matter.
All of these non-significant results confirm in the multidimensional context what has already been observed in the exploratory analysis of the data in the previous section. The constantα proved non-significant and unnecessary after all the other non-significant variables were eliminated from the regression. The significant effects from an empirical point of view are shown in Table 29, which sums up the statistics from estimation of the above efficacy equation.
The principal positive effects on the math test score result from the quality of the school and the class, and the pupil’s prior school record. The negative effect refers to the pupil’s gender, with girls performing less well than boys.
Table 29. Results of estimation of the regression equation for test score
Mnemonic Variable Coefficient Standard error t Statistic Probability
School E 0.81754 0.08494 9.62484 0.0000 Class T 0.58044 0.06359 9.12659 0.0000 Gender X -0.39187 0.14461 -2.70975 0.0069 Record C 0.51205 0.10325 4.95930 0.0000
R-squared 0.202236 Mean dependent variable 5.319075 Adjusted R-squared 0.198326 Standard deviation dependent
variable 2.003955
S.E. of regression 1.794266 Akaike info criterion 1.175665 Sum squared residual 1970.267 Schwarz criterion 1.204387 Log likelihood -1232.171 F-statistic 51.71486 Durbin-Watson stat 2.208536 Probability (F-statistic) 0
The portion of variance explained by these variables is relatively small (R2=20per cent), which is not surprising, since we are not measuring other important factors in school performance, like the pupil’s intelligence, personal factors that may have affected the pupil while taking the test, and emotional maturity, in addition to purely random factors that no doubt exist in a test of this type. However, the coefficients are all significant at the 1 per cent level, there is no serial correlation, the F regression statistic is quite high, the residuals are approximately Gaussian, as shown in Graph 5, and their standard deviation is 1.79 points.
Interpretation of the equation’s coefficients is quite straightforward. For example, one can obtain a confidence interval for the math test score of a pupil from a low-average quality school (E=2), studying in a bad class (T=1), male (X=0), and with a good scholastic record (C=3). This pupil’s expected test score28 would be 3.75, and considering that the standard deviation is 1.79, the probability of his score ranging from 5.53 to 1.97 is 75 per cent.
Girls tend to score some 0.4 points below boys. This disagrees with the results of other studies, which generally indicate better performance by girls. We were careful to
28 Calculation of expected score: 2*0.817547 + 1*0.580443 – (0*0.391875) + 3*0.51205 = 3.75.

42
verify whether this variable might be correlated with other one, thereby reflecting this other effect (for example, the number of children in the family, or girls’ greater mean age/grade lag), but this proved not to be the case. For some reason, as observed previously, the school performance of girls living in extremely poor homes differs from the traditional gender pattern.
Graph 5. Residuals from the efficacy equation
One of the main questions in this study, i.e., whether the school grant has an impact on school performance, comparing the moment prior to entering the Programme and that of the math test, can be answered by including the school grant variable in the equation. When we include this variable, we find that it is not significant (t statistic = -0.7 and P value = 50 per cent), and we cannot reject the hypothesis that its coefficient is null. The school grant does not affect school performance. In other words, its impact is null in improving children’s learning, even though, as discussed in previous sections of this research, receiving the grant has a positive mobilising effect on both families and schools in favour of the children’s schooling
3.5 Social impacts
With regard to interpreting the effects of the income transfer in reducing poverty in the short term and improving living conditions for the poorer population, who have vir tually no access to social services as a whole, we now present a series of results comparing the control group and beneficiary families at baseline (T0) and T1.
We should also briefly recall the underlying objectives in evaluating the school grant’s social impact, as outlined earlier in this report. Besides attempting to grasp whether the Programme serves to encourage or discourage parents (especially applicants and their spouses) from working, we also seek to infer the Programme’s role in discouraging school-age children from performing paid labour. From a methodological point of view, we re-applied the same registration form used during the initial selection, including some new questions on the families’ participation in other social programmes,
0
20
40
60
80
-4 -2 0 2 4 6
Series: Residuals Sample 1 616 Observations 616
Mean 0.000923 Median -0.001142 Maximum 5.559744 Minimum -5.047668 Std. Dev. 1.789884 Skewness -0.093206 Kurtosis 2.590890
Jarque-Bera 5.187755 Probability 0.074730

43
activities performed by the children both inside and outside the household, etc. The version of the questionnaire used in the re-registration is shown in Appendix 1.
Variations in the incidence of poverty.
An important element in evaluating social programmes, especially compensatory ones, is the adequate selection of beneficiary families, or the programme’s targeting. The issue is to estimate whether all or most of the resources earmarked for the explicit target public actually reach it, or whether they are improperly siphoned off by free-riders, a major characteristic in Brazilian social policy. The Programme’s extremely low coverage, as observed, is a sign of its limited efficacy, since it leaves out nearly the entire potential clientele. What remains to determine is whether the few benefited by this specific income transfer are really those who deserve it, or whether there is resource evasion and thus inefficiency in allocating the funds.
The income distribution curve for the beneficiary families, as shown in Graph 6, suggests good targeting by the Programme, since nearly all of the beneficiary families have a per capita income below the locally defined cut-off line of one-third of the minimum wage at RS40.
Graph 6. Distribution of beneficiary families in the Recife Scholarship Programme according to PCFI, at T0 and T1
Source: Register, Recife Scholarship Programme
Graph 6 also provides other relevant information: after a year of participating in the Programme, the 1,218 families who were present for the initial and second registrations showed an increase in their non-grant per capita family income (upper curve). In fact,
0
40
80
120
160
200
0% 10% 20% 30% 40% 50% 60% 70% 80% 90% 100%
RFPC T1 RFPC T0 R$ 40,00 R$ 60,00
Total families: 1218
1 163 families956
families

44
before entering the Programme, 96 per cent (or 1,163) of the families were below the R$40 line, which is evidence of adequate targeting, and a year later this figure had dropped to 956 (or 78 per cent). The initial observation is that receiving the stipend does not appear to discourage parents from working, since the family income (minus the grant) of the extremely poor and marginalized families increases (upper curve). It only increases a little, but there is no question that it does increase. In fact, Table 30 shows that variation in the non-grant income was 41 per cent for the families benefited by the Programme, as compared to 37.8 per cent for the control group. It is thus clear that the increase in family income was greater for those who received the monthly stipend of one-half to one minimum wage than for the control group.
Table 30. Variation in mean per capita family income
T0 T1 Variation (T1-T0)/T0
Beneficiaries R$18.82 R$26.54 41.0%
Control group R$26.79 R$36.94 37.9%
Note: Income at T0 not including school grant.
Source: Register, Recife Scholarship Programme, T0 and T1
However, as shown in Table 31 the number of families rising above the extreme poverty line was greater in the control group (27.8 per cent) than among those with school grants (17.8 per cent), undoubtedly because at T0 the control group’s per capita family income (R$27) was already higher than that of the school grant group (R$19).
Table 31. Number of families with PCFI < R$40.00 (not including stipend)
T0 T1 Variation (T1-T0)/T0
Beneficiaries 1 163 956 17.8% Control group 245 177 27.8% Source: Register, Recife Scholarship Programme, T0 and T1
Table 32 also shows that the incidence of poverty decreased more rapidly for the group of beneficiary families that did not succeed in crossing the local poverty line than for the control group (- 4.2 per cent as compared to -1.8 per cent, respectively). We can thus state that even before receiving the school grant, these families, the poorest of the poor, had by their own efforts succeeded in reducing the distance separating them from the line between indigence (extreme poverty, or destitution) and poverty.
Table 32. Mean PCFI gap of families remaining below the R$40.00 line
T0 T1 Variation (T1-T0)/T0
Beneficiaries 22.42 21.48 4.2%
Control group 16.22 15.92 1.8% Note: The gap was calculated for families with PCFI R$40.00 as follows: sum of the differences R$40.00 - PCFI / no. of families with PCFI R$40.00.
Source: Register, Recife Scholarship Programme, T0 and T1

45
In short, we can state that there was a relative improvement in the non-grant per capita family income for families covered by the Scholarship Programme. But what remains to be determined is whether this improvement was the result of increased work activity by the adults or the consequence of obtaining other monetary benefits, like retirement benefits or pensions received by individuals in both groups. To verify what actually happened, we compared, at T0 and T1, the work rates for women heading single -parent families, whose difficulty in entering the work market is huge, since they head families with an average of five members; we then proceeded to perform a similar exercise with the inactive population, in order to identify whether there was an increase in benefits received in the form of retirement or pensions.
First, we observed that the occupation rate of female heads of families increased, both in beneficiary families and the control group: among the beneficiaries, it increased from 40 per cent to 47 per cent, comparing T0 and T1, whilst the unemployment rate for these same women dropped from 46 per cent at T0 to 39 per cent at T1 (the percentage of inactive women remained stable at 11 per cent and 12 per cent, respectively). That is, the proportion of occupied women increased, due to a reduction in the unemployment rate. As for the control group, the variation was quite similar, but apparently for different reasons: the share of occupied women increased from 36 per cent at T0 to 43 per cent at T1, whilst the unemployment rate dropped, from 45 per cent at T0 to 43 per cent at T1. In reality, the increase in the percentage of occupied women in this group is due to a reduction in the weight of inactive women. In other words, the possibility of covering an acute deficit in family income occurred in the control group due a decrease in inactivity. Among the women heading families in the control group, there was a drop in inactivity because of the overwhelming need to reduce their income deficit. Among the women heading families receiving school grants, the activity rate remained stable, but there was an increase in the occupation rate, and therefore the family income increased. This result is extremely important in that it invalidates unsubstantiated criticism against a system of transferring a subsistence income to poor families under the argument that such a transfer fosters idleness and dependency, the greatest reasons for poverty.
As we observe, there is no reduction in the activity rate among single-parent families receiving the school grant and headed by women, and there is even an increase in their occupation rate. We may suppose that receiving the monthly stipend contributes significantly to a reduction in the destitution of these families, headed by women who are unable to obtain work, whatever it may be, on the labour market, and that it simultaneously allowed others to expand their scarce opportunities to seek and perform some type of work. Thus not only is the Scholarship Programme’s redistributive impact significant, but it has no negative connotation, that is, it does not discourage work, rather the contrary, it encourages parents to work.
As for the weight of inactive members (except for the applicants and their spouses, in both the beneficiaries and controls groups, the proportion remained unchanged over time, from T0 to T1, around 30 per cent, apparently meaning that it is very unlikely that the increased per capita family income of beneficiary families originated from retirement or pension benefits rather than work. That is, the school grant did not increase the inactivity rate among the poorer and more socially excluded families of Recife.
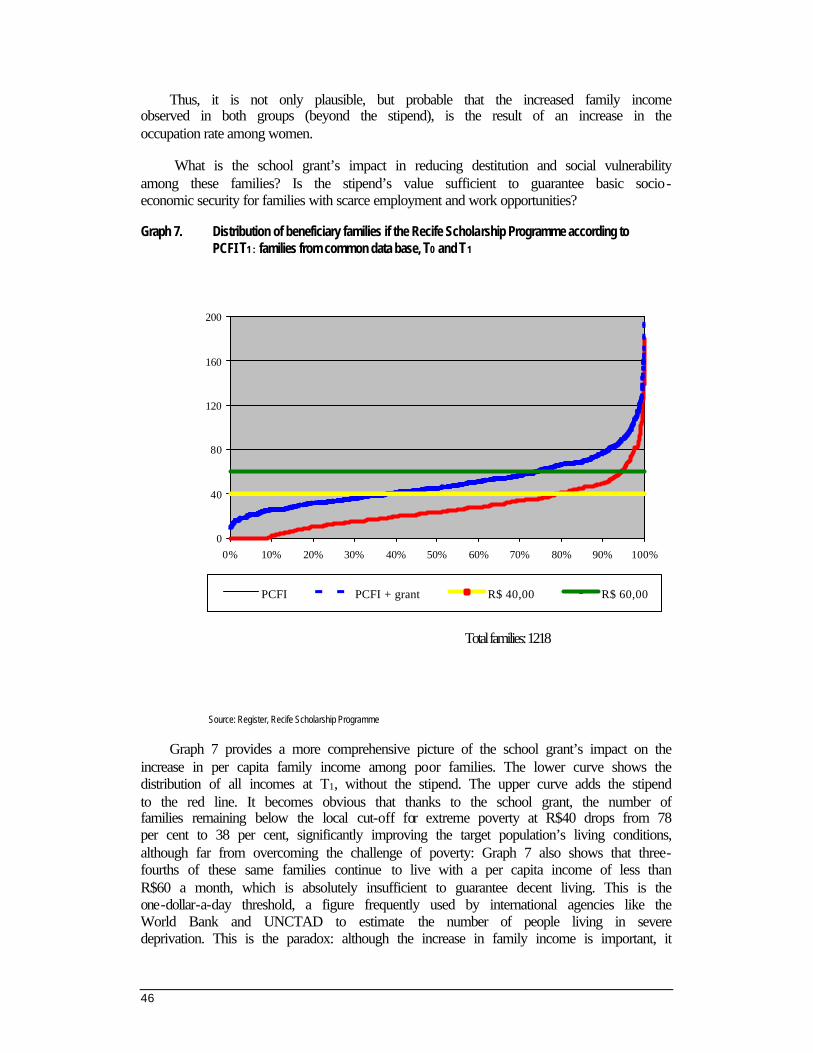
46
Thus, it is not only plausible, but probable that the increased family income observed in both groups (beyond the stipend), is the result of an increase in the occupation rate among women.
What is the school grant’s impact in reducing destitution and social vulnerability among these families? Is the stipend’s value sufficient to guarantee basic socio-economic security for families with scarce employment and work opportunities?
Graph 7. Distribution of beneficiary families if the Recife Scholarship Programme according to PCFI T1 : families from common data base, T0 and T1
Source: Register, Recife Scholarship Programme
Graph 7 provides a more comprehensive picture of the school grant’s impact on the increase in per capita family income among poor families. The lower curve shows the distribution of all incomes at T1, without the stipend. The upper curve adds the stipend to the red line. It becomes obvious that thanks to the school grant, the number of families remaining below the local cut-off for extreme poverty at R$40 drops from 78 per cent to 38 per cent, significantly improving the target population’s living conditions, although far from overcoming the challenge of poverty: Graph 7 also shows that three-fourths of these same families continue to live with a per capita income of less than R$60 a month, which is absolutely insufficient to guarantee decent living. This is the one-dollar-a-day threshold, a figure frequently used by international agencies like the World Bank and UNCTAD to estimate the number of people living in severe deprivation. This is the paradox: although the increase in family income is important, it
0
40
80
120
160
200
0% 10% 20% 30% 40% 50% 60% 70% 80% 90% 100%
PCFI PCFI + grant R$ 40,00 R$ 60,00
Total families: 1218

47
is not enough to solve the problem of poverty. It acts like a kind of safety net that guarantees a minimum subsistence, but only for those covered by the Programme. It is an indispensable minimum, varying from R$15 per capita per month in the larger and more destitute families to over R$ 60 at the top of the distribution.
Even so, the relevance of such a stipend is undeniable as an ultimate social protection mechanism, since it provides the only regular source of income for the most excluded segment of the population in the city of Recife. Without a doubt, the school grant is the only monetary benefit reaching these families, and beyond mere survival it can guarantee some level of autonomy and elementary citizenship. In this sense, it is a fundamental mechanism in reducing social inequalities, more than appropriate for Brazil.
3.6 Impacts in reducing child labour and expanding citizenship
Another relevant impact is on access to public services in general. We suspect that when under-served and unprotected families join a programme like the one in Recife, they expand their access to public services, since the Programme’s design combines an increase in family income with enhanced participation in social programmes in general, democratizing public services by incorporating previously unmet demands and extending it to all citizens. This means democratization of access and thus of the degree of citizenship. Over 50 per cent of the families in both groups reported that they only participated sporadically in social programmes. Only 8 per cent of the beneficiary families and 24 per cent of the control group reported receiving some form of regular aid. Apart from their irregularity, the most commonly available kinds of aid for the extremely poor population in Recife includes food baskets (38 per cent of the school grant beneficiaries and 46 per cent of the control group) and medicines (38 per cent of the school grant beneficiaries and 21 per cent of the control group). The third item that is distributed fairly frequently is construction materials. Based on interviews with the families, we estimated the average monthly value of non-school grant aid at R$19 (for both groups), putting the per capita figure at R$4-5 a month. Such aid is haphazard and random, since it does not reach everyone, and it often hinges on traditional and rather unhealthy political trade-offs, where patronage is rarely void of second intentions which jeopardize individual freedom and reinforce paternalistic, condescending practices.
Table 33 shows some evidence of this, although only for T1 in the survey, since this information was not included in the baseline (T0) registration. In the first place, it becomes clear that only a tiny proportion of the needy families receive some kind of material support or participate in institutional social programmes, signalling a high degree of social exclusion as a whole and limited citizenship. However, if we compare the two groups of families, we note a sharp reversal in the proportions at T1: whilst in the control group, informal aid (71 per cent) prevails over participation in institutional programmes (both public and private), beneficiary families have a greater proportion of links to social policies (46 per cent), undoubtedly reflecting the Scholarship Programme’s very positive indirect impact, a phenomenon also observed in Brasília, with expanded citizenship among the most under-served segment of society. We believe if the Programme is maintained and its coverage extended, the next evaluation will confirm this externality, i.e., the state’s growing role in guaranteeing basic citizens’ rights for the poorest, fostered by the emergence of these new citizens, the needy

48
families of the Scholarship Programme. In this sense, the Programme, although starting from a targeted focus, ends up expanding the principle of universal access.
Table 33. Origin of other benefits
Families with school grant Control group families Number % Number % Family, friends, neighbours, employer and strangers 80 47 42 71 Religious institutions 12 7 6 10 Public and private institutions 1 77 46 11 19 Total 2 169 100 59 100 Note. 1 Hospitals, day-care centers, schools, LBV (Goodwill), military police, health clinic, City Government, Pró-criança, commerce. 2.School grant beneficiaries total 1,218 families; control group families total 268 Source: Register, Recife Scholarship Programme
What is the Programme’s impact in reducing child labour? On this point, the research did not confirm the expected results. In fact, grasping the scope of child labour was difficult, because both beneficiary families and the control group are aware that children are supposed to study, not work. In addition, the baseline registration (T0) did not ask the families whether their children worked, or at what, thus making it impossible to compare the results and measure the school grant’s impact. Thus, we suppose that when asked about their children’s work activities, most of the applicants to a greater or lesser extent under-reported the reality in order to satisfy the Programme’s conditional requirements. Even so, the data gathered at T1 (Graphs 8a and b) show that child labour is far from being eradicated among the children whose families participate in the Programme. This is especially the case of unpaid domestic labour, performed mostly by girls.
Graph 8a Child labour: 7-9 year old dependents of beneficiary families at T1
Work
11%
Do not work
89%
Source: Register, Recife Scholarship Programme. Total dependents 7 to 9 years old: 942.

49
Graph 8b Child labour: 10-14 year old dependents of beneficiary families at T1
Work
18%
Do not work
82%
Source : Register , Recife Scholarship Programme .
Graph by: Lavinas, L., 2000.
Total dependents 10 to 14 years old: 2,142.
Based on Table 34, we note that the mean number of hours worked per week remains high - almost 17 hours a week among the 7-10 year-olds and 20 hours a week in the 10-14 year-olds, which could obviously have a negative impact on the school performance of these children, not to mention jeopardising their overall experience with childhood and adolescence.
Table 34 Child labour, beneficiary families
Dependents 7 to 9 years old Dependents 10 to 14 years old
Number Mean hours per week Number Mean hours per week
Help (1) 38 20.1 152 22.7 Domestic chores (2) 61 14.2 196 17.9
Other work (3) 3 33.3 27 28.7 Total 102 17.0 375 20.6
Notes: (1) “Helping out” at home, helping at relatives’ homes, fetching water. Reported by some families as "playing/helping". (2) Domestic chores, washing dishes, taking care of siblings, cleaning house, etc. (3) Selling popsicles, popcorn, mineral water, washing cars, begging, etc. Total dependents 7 to 9 years old = 942 / Total dependents 10 to 14 years old = 2,142. Source: Register, Recife Scholarship Programme - T1.
However, the most interesting information in Table 33 is the fact that although paid work outside the home involves many hours, its weight is relatively less, whilst the activities classified as “helping out” (and thus not identified as work) are what mobilize the largest contingent of children. A programme like the one in Recife may not be able to affect such a reality to the extent of eliminating it, unless receiving the school grant is conditioned on studying all day. It is true that the Programme seeks to meet the needs of children who have returned to school and who experience learning difficulties, by providing them with booster classes that extend their school day. However, this should not be a privilege for pupils receiving school grants: the approach is only feasible if it becomes universal. The Brazilian Ministry of Education intends to implement full-day

50
schooling nation-wide beginning in 2006. Nothing would be more welcome than to anticipate this date, in keeping with the country’s resources, in order to truly eradicate all forms of child labour. Any measure short of this is fated to have a marginal impact and will never solve the problem once and for all, as observed by other equally relevant studies on the child labour issue (ILO/Brazil, 2000).
Without a doubt, the Scholarship Programme has other positive effects on the beneficiary families, by increasing their degree of autonomy and their access to durable consumer goods, the pattern of which is quite similar between the two groups. By way of example, the two groups identically ranked the importance of ownership of various household appliances at T0 and T1: gas stoves came first (over 95 per cent of the families in both cases), followed by electric mixers and refrigerators (over 70 per cent of the families in both groups), colour TV sets (67 per cent of the beneficiary families and 74 per cent of the control group), and sound systems last.
4. Conclusions and Recommendations
4.1 Conclusions
In this evaluation of the Recife Scholarship Programme’s educational and social impacts, we sought to analyse the factors associated with the Programme that could have an effect on the children’s and the families’ welfare, reducing their social vulnerability.
First, we were able to demonstrate that the Programme is properly targeted, both in the selection of children to receive school grants, and by extension, of the neediest families. Appropriate selection of priority children in terms of coverage was ensured by the choice of the neighbourhoods (i.e., in municipal sub-divisions) with the worst educational indicators. However, we observed the lack of a well-defined institutional standard or well-established rules for the inclusion of other schools, that is, for the Programme’s steady expansion, as well as the lack of a follow-up policy on the schooling and learning of these pupils, which might have provided as parameters for the evaluation of the Scholarship Programme’s school efficacy.
Upon analysing the school institution, we found great receptiveness to the Programme: both teachers and administrators believe that the Programme serves as a booster for their educational work. The teachers see it as a source of methodological change in their own work, which could result in a subsequent improvement in the children’s learning conditions, with extremely important impacts on the public school system as a whole.
However, it is undeniable that the school institution could be better utilized as a resource. Ideally, greater investment should be made in the relationship with teachers, since they were the greatest differentiating factor in the pupils’ test scores. Informally, many teachers identified the return of children who had been excluded because of bad performance as a problem. Their return to school meant overwork for teachers, greater classroom disruption, and even the risk of lower yield by other children, with the so-called bad student seen as a highly disruptive element for the school system. Another possibility would be to identify certain classes, whose teachers showed a greater ability to deal with children receiving school grants, as preferential targets for referring these

51
pupils. In the specific case of these teachers, the suggestion would be to target ones who have succeeded in promoting greater exchange among children on school grants and their classmates at a higher level of performance.
Among such individual factors as age, gender, and participation in the Scholarship Programme, we were not able to identify any variable that could explain the differences in school performance. One outstanding point is the issue of girls. All the data appear to indicate the need for redoubled attention towards the distribution of school grants: based on our observations, girls from poor families are at greater risk of school difficulties than boys. Finally, among social factors, due probably to the real homogeneity or almost non-existent social distance between families with and without school grants, we did not find any variables that could explain the differences in performance.
Two conclusions follow. The first is that the school institution plays a central role in implementing an income transfer policy by making school attendance mandatory. Some schools succeed in bringing the performance of their poorer students up to that of their classmates who are slightly better off socio-economically. In addition, they get better results from pupils with school grants than these same pupils would produce in other schools or with other teachers. Furthermore, the school and teachers stand out as explanatory factors in their performance. This is a crucial issue from the point of view of efficiency in such programmes.
The second conclusion also relates to the school, but in a different sense. All of our data indicate that the Programme’s most important effect is the break in the mechanisms traditionally used by the school to exclude poorer students. The Scholarship Programme commits the families to keeping their children in school, whilst requiring the school to keep pupils with a high probability of dropping out. They only stay because of the stipend. The “normal” functioning of the school as an institution expels students lacking social and economic resources. Pupils with school grants have worse school records than their classmates from the control group, which in the absence of the Programme would certainly lead them to drop out. Without the Programme, they would probably already have turned to other ways of “getting by in life”. Only an initiative like this can allow these students to remain in school. Therefore, the Programme proves effective in interrupting one of the strongest mechanisms reproducing and legitimating inequalities: early exclusion from school. The exclusionary mechanisms operate at an early stage in schooling, and are already present in the third grade. The average age of all the children is high, and even more so among those with school grants. Keeping these children in school is the fundamental change produced by the Programme, which thus generates a more effective possibility of combating social inequalities. Therefore, the state, through the Scholarship Programme, guarantees de facto universalization of primary education by deactivating traditional mechanisms of expulsion.
From the point of view of the Programme’s social dimension, its greatest weakness lies in its very limited coverage, since only 2 per cent of target public benefit. Moreover the Programme is not anchored in a clear time horizon or objective goals. Despite the budget constraints and low fiscal capacity of the Recife City Government, it would be feasible to cover at least 3,200 families, double the current number, by committing only 1 per cent of the current municipal revenue. If the latter figure were increased to 2 per cent, a stipend on the order of one minimum wage could be transferred monthly to 6,200 families, i.e., 80 per cent of families who meet the Programme’s criteria and 9 per cent of the potential target public.

52
We should explain an observation made during the analysis of the City Government’s budget spending, the complete data on which were furnished to us by the Office of the Mayor, with a spirit of accountability worthy of both recognition and praise. From 1997 to 1999 (the latter was a pre-election year), we noticed a reversal of priorities in social spending. In 1997, core teaching activities in the school system consumed over 50 per cent of all municipal anti-poverty spending, whilst by 1999 this figure had dropped to 10 per cent, with priority spending concentrated on building physical infrastructure. This indicates a reversal of priorities in anti-poverty social spending in the city. During the pre-election year, construction and improvements in the physical infrastructure for providing educational and health services captured the largest share of the budget, as opposed to the actual educational and health programmes themselves. Likewise, there was a steady increase in the allocation of funds for low-cost housing construction, heavily focused on socially excluded groups, with an almost proportional drop in direct aid. Thus, during the pre-election year the Office of the Mayor redefined its priorities, emphasizing public buildings, public works, and housing, to the detriment of measures with a more immediate and direct impact on poverty. This further serves to confirm that it would have been possible to allocate more funds to expand the coverage of the Scholarship Programme. The priority was not imposed by fiscal constraints or lack of funds, but rather by policy choice.
In addition, the Municipal Act establishing the Recife Scholarship Programme, like many similar programmes, fails to define time frames and objectives, a shortcoming which tends to limit the Programme’s effectiveness as a mechanism to combat poverty and reduce social inequalities. This is because when it fails to guarantee continuity or to demarcate its objectives, it undermines the role such a programme could play in restructuring the social protection system. Its positive spillovers are overlooked. A fair and appropriate understanding of the Programme’s scope should be translated into an optimum design for it. This has not happened in Recife, as it has failed to happen in other Brazilian cities, with the Recife Programme suffering the same mistakes identified elsewhere: rather than leveraging a reform in compensatory programmes, it ends up serving as a token novelty in the traditional range of anti-poverty policies. Its central reforming strength is jeopardized. A programme like this should be the driving force that is missing to recreate Brazil’s social protection system, since it uses selectivity and targeting to strengthen universal principles. Its impact in keeping low-performance children in school is the undeniable evidence of its place on the agenda of universalist policies and programmes.
As for the stipend, we believe that the City Government was right in establishing two different figures, one-half or one minimum wage, based on the number of dependants. The simulations performed in this study proved that the greatest impact on the Programme’s costs comes not from the amount of the stipend, but from the extent of its coverage. In order to facilitate the Programme’s management, we therefore believe that it would be possible to set a single amount for the stipend, at one minimum wage, regardless of the number of dependants. But this is not the most important aspect, since there are few families with only one school-age child.
We also observed that the Programme does not discourage parents from working, on the contrary. Non-stipend family income increased significantly during the first year the families were in the Programme, despite the fact that these families were dealing with extremely adverse conditions in accessing the labour market. Over 50 per cent of

53
the adults applying for the stipend and their spouses are illiterate or barely literate, which restricts their chances of competing for work. Despite such disadvantages, the occupation rate increased and the minimum economic security threshold of the beneficiary families improved, within an overtly recessive economic context in Brazil. Thanks to the monthly stipend, which the families received for a year, more than two-thirds of the families in the Scholarship Programme were able to rise above the poverty line and reduce their degree of vulnerability. Extreme poverty decreased, although it was not totally eliminated.
However, the Programme’s impact in eliminating child labour fell far short of expectations, indicating that the school system should be more responsible for contributing to the solution of this contradiction. Since regular school attendance is a condition for receiving the school grant, the Programme’s impact is limited to classroom time, and it therefore does not help to reduce the number of hours the children work at home, “helping out” with domestic chores. One positive point worth highlighting is the limited amount of paid work performed by pupils receiving school grants. It is probable that paid child labour decreased from T0 to T1 in this study, but to the extent that child labour persists, it is due to the lack of a full-day classroom schedule. Remedial classes and socio-educational activities are doubtless the best way to combat child labour, whether paid or domestic.
4.2 Recommendations for action by the Recife City Government:
1. A single stipend of R$150 should be adopted, adjusted once a year by using the same index used to update the budget.
2. Up to 2 per cent of the city’s current revenue should be committed to the Scholarship Programme in order to ensure broader coverage, expanding it more than fourfold and benefiting more poor families. This would cover some 80per cent of the potential target public, based on local eligibility criteria. It would also guarantee a scale in the Programme such as to expand its social spillovers, the most important aspect in the struggle to reduce social inequality.
3. All conditions imposed on the adults in beneficiary families should be removed. These have not proven useful: as observed, the stipend has not discouraged adults from working.
4. Time limits for participation by families in the Scholarship Programme should be removed, to guarantee that children continue to receive the school grant until they have finished primary school. This would correct one of the most harmful aspects of compensatory-type social policies, i.e., their lack of continuity.
5. Given the high age/grade lag (three years in Recife), the Municipal Act establishing the Scholarship Programme should mention that the potential target public includes not only children in the 7-14 year age group; but all children attending primary school, regardless of age (to avoid a situation in which 15 or 16-year-olds lose their right to the stipend in the middle of what is already a difficult schooling process, counter-productive to the Programme’s own objectives, in addition to being discriminatory).

54
6. The Recife Scholarship Programme should provide technical and pedagogical support for teachers and administrators of municipal schools to facilitate their relationship with pupils and their families receiving grants, in order to maximize the effectiveness of the stipend’s impact in mobilizing the school institution.
7. Special attention should be given to girls on school grants, since their academic risk is greater than that of the boys. Girls show a greater mean age/grade lag, due to the demands made on them to perform domestic chores, a situation which is at least as serious as the problems necessitating contact with the public agencies dealing with children and adolescents, where boys are the majority.
8. To effectively combat all forms of child labour, remedial classes and socio-educational activities should play a central role in restructuring the Programme, helping comprise a longer school day.
4.3 Recommendations for a national programme
1. The case study of the Recife Scholarship Programme confirms that it is impossible for decentralised, local experiences to guarantee full coverage of the potential target public, given their limited funding capacity. A programme like this should have a nation-wide scope, under the aegis of the Ministry of Education.
2. The results showing the stipend’s zero impact on school performance per se in pupils from poor families shows that the Programme should not be focused only on children with learning difficulties, although this has been extremely positive by ensuring that they stay in school and by deactivating traditional social exclusion mechanisms generated within the public school system itself. This is the school grant’s immediate impact on the schooling of poor children. In the medium and long term, the school grant should lead to a significant change in the relationship between the school and poor students, encouraging better results for all. If the stipend effectively promotes the principle of universalization, it cannot be restricted only to encouraging poor students with learning difficulties, but should also reach other poor children, whose personal efforts towards good school performance cannot and should not be overlooked. Self-merit and self-effort should be encouraged, especially in the numerous social groups living in destitution and severe vulnerability in Brazil. Poverty can and should be reduced through income redistribution. The school grant proved to be an important instrument for income redistribution and expansion of citizenship, with a short-term impact in reducing the ala rming levels of extreme poverty in which millions of Brazilian families live. Access to it should be democratized to include all those who need its benefits, to avoid generating inequity among the most under-served segments of the population.
3. This justifies guaranteeing a minimum income for all poor families with children and adolescents in the 7-17-year age bracket, with the goal of universalizing complete primary education nation-wide. This social justice principle is within our reach through an income distribution and citizenship mechanism, which is simple, proven, and undeniably successful. To effectively universalize primary education - not only through access via enrolment, but by guaranteeing that

55
students finish primary school with minimally decent living conditions for the poor population - means more social and economic democracy, more redistributive justice.
4. If the school grants are necessary as one of the most indispensable investments in the coming generations, whose return for the country is widely acknowledged, minimum income is a social right, the results of which are equally undeniable in combating the poverty of today and the future.

56
References
Barbosa, M.L de O. 1999. Desempenho escolar e desigualdades sociais: resultados preliminares de pesquisa (ANPOCS) mimeo.
Cousin, O. 1998. L’Éfficacité des Collèges: sociologie de l’effet établissement (Paris, PUF).
Duru-Bellat, M. 1990. L’école des filles: quelle formation pour quels rôles sociaux? (Paris, L’Harmattan).
Duru-Bellat, M and Van Zanten, A. 1999. Sociologie de l'école, (Paris, Armand Colin).
Forquin, J. C. 1995. Sociologia da Educação: Dez anos de pesquisa (ed). (Vozes Petrópolis).
ILO/Brazil. 2000. Seminar on Strategies to Eradicate Child Labour in Domestic Work, Brasília,
Klein, R. 1999. “Repetition and Dropout in Brazil: Measurement Issues”, in Randall and Anderson (eds.) Schooling for Success: Preventing Repetition and Dropout in Latin American Primary Schools (New York, M.E. Sharpe).
Klein, R. and Ribeiro, S.C. 1993. “O fluxo dos alunos do 1.º Grau no estado do Paraná na década de 1980”, mimeo, Relatórios de Pesquisa e Desenvolvimento do Laboratório Nacional de Computação Científica, Rio de Janeiro.
Lavinas, L. 1998. “O Barato da Pobreza”, in Inteligência, (Rio de Janeiro) year 1 no. 4, August/September/October/. Rio de Janeiro.
Lavinas, L. 1999. Combining Compensatory and Redistributive Benefits: The Challenge of Social Policies in Brazil (IPEA, TD).
Lavinas, L. (coord). 2000. I Relatório Parcial da Pesquisa “Avaliação de Dois Programmeas Bolsa-Escola (IPEA/ILO/WB) p. 47.
Lavinas, L. and Varsano, R. 1997. Programmeas de garantia de renda mínima e ação coordenada de combate à pobreza (Rio de Janeiro, IPEA) Discussion Text No. 534.
Lavinas, L. et al. 2000a. Combining Compensatory and Redistributive Benefits: The Challenge of Social Policies in Brazil (Rio de Janeiro , IPEA) p. 37.
Lavinas et al. 2000b. Combatendo a Pobreza estimulando a freqüência escolar: o estudo de caso do Programa Bolsa-Escola de Recife mimeo.
Merle, P. 1998. Sociologie de l'évaluation scolaire (Paris, PUF)
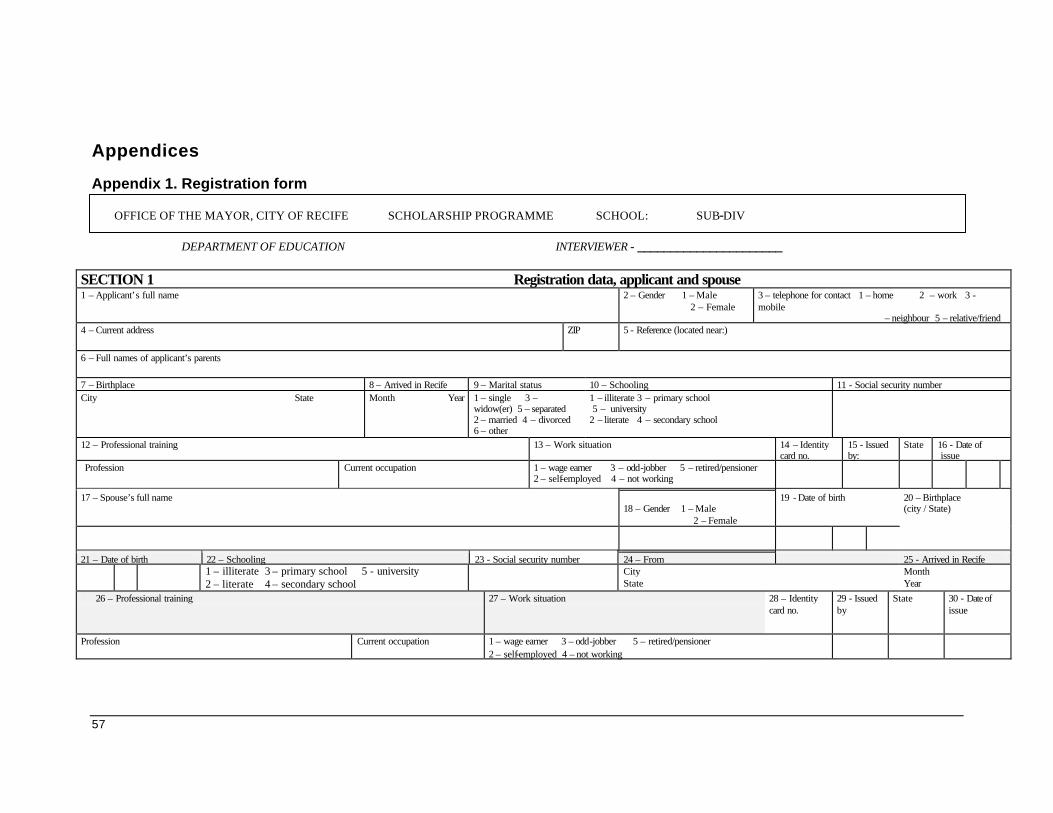
57
Appendices
Appendix 1. Registration form
OFFICE OF THE MAYOR, CITY OF RECIFE SCHOLARSHIP PROGRAMME SCHOOL: SUB-DIV
DEPARTMENT OF EDUCATION INTERVIEWER - ______________________
SECTION 1 Registration data, applicant and spouse 1 – Applicant’s full name
2 – Gender 1 – Male 2 – Female
3 – telephone for contact 1 – home 2 – work 3 - mobile – neighbour 5 – relative/friend
4 – Current address ZIP 5 - Reference (located near:)
6 – Full names of applicant’s parents 7 – Birthplace 8 – Arrived in Recife 9 – Marital status 10 – Schooling 11 - Social security number City State Month Year
1 – single 3 – widow(er) 5 – separated 2 – married 4 – divorced 6 – other
1 – illiterate 3 – primary school 5 – university 2 – literate 4 – secondary school
12 – Professional training 13 – Work situation 14 – Identity card no.
15 - Issued by:
State 16 - Date of issue
Profession Current occupation 1 – wage earner 3 – odd-jobber 5 – retired/pensioner 2 – self-employed 4 – not working
17 – Spouse’s full name 18 – Gender 1 – Male 2 – Female
19 - Date of birth 20 – Birthplace (city / State)
21 – Date of birth 22 – Schooling 23 - Social security number 24 – From 25 - Arrived in Recife 1 – illiterate 3 – primary school 5 - university
2 – literate 4 – secondary school City
State Month Year
26 – Professional training 27 – Work situation 28 – Identity card no.
29 - Issued by
State 30 - Date of issue
Profession Current occupation 1 – wage earner 3 – odd-jobber 5 – retired/pensioner 2 – self-employed 4 – not working

58
SECTION 2 Registration data, dependant(s) of applicant (≤≤ 14 years) 31 – Dependant’s full name 32 - gender 33 – date of birth 34 - State 35 -
relationship 36 – school 37 - grade 38 -
System 1 2 3 4 5 6 7 8
KEY Family relationship 1 – son/daughter 2 – stepchild 3 – grandchild 4 – other School system: - 1 – Municipal 2 – State 3 - Community
SECTION 3 Registration data, dependant(s) of applicant (≥≥ 15 years) 39 – Dependant’s full name 40 – gender 41 – date of birth 42 –
relationship 43 – work
market 44 –
schooling 45 -
school 46 - grade
47 – system
1 2 3 4 5 6 7 8
KEY GENDER M: male F: female
Relationship
1 – son/daughter 2 – stepchild 3 – grandchild 4 – mother/father 5- mother-in-law/father-in-law 6 - other
WORK MARKET
1 – wage earner 2 – self-employed 3 – odd-jobber 4 – not working 5 – retired/pensioner
Schooling 1 – illiterate 2 – literate 3 – primary,
incomplete 4 – primary, complete – secondary ; 6 – university

59
SECTION 4 Living conditions, Social aid, Health
SECTION 6 Family’s financial information (round off to nearest real)
48 - Specification Doc. Section Line 59 - Family’s monthly expenses 60 - Breakdown of family income (members over 18 years of age)
1 – Child or adolescent subject to special protective measures
items Amount (R$) doc. verif. items Amount (R$) doc. verif.
Rent Applicant’s income from work
2 – Adolescent subject to socio-educational measures
Mortgage payment
Spouse’s income from work
Food Income from work by other family members
3 – Child 0-6 years of age in treatment for malnutrition (food supplement programme)
Water Child support or welfare
Electricity Retirement
4 – Person with disability, unable to provide for self
Gas Income from rent
Transportation Unemployment insurance
5 – Elderly, unable to provide for self Other expenses Other
TOTAL
6 – Person with chronic disease TOTAL
Per Capita
SECTION 7 Documents as proof of residence
SECTION 5 Living conditions, housing, and durable goods
61 - Documents presented, registered in Recife 05 years
Current address 5 – Other (specify)
49 – Housing 50 – House lot 51 – Type of Construction 1 – School transcript
Rented Lent by relative Plywood 2 – Immunisation card
Lent Self-owned (lot with deed)
Wood 3 – Working papers
Own Self-owned (adverse possession)
Wattle and daub 4 – Light, water, or telephone bill
Other Squatted Masonry No. of rooms Situation unknown Other SECTION 8 TERM OF RESPONSIBILITY

60
I HEREBY DECLARE THAT ALL INFORMATION PROVIDED BY ME HEREIN FOR MY APPLICATION TO REGISTER IN THE SCHOLARSHIP PROGRAMME IS TRUE, AND IS SUBJECT TO VERIFICATION WHENEVER NECESSARY FOR THE PROPER FUNCTIONING OF THE PROGRAMME. I HEREBY DECLARE THAT I AM AWARE OF THE CONDITIONS UNDER WHICH THE PROGRAMME OPERATES, THAT I AGREE TO ITS TERMS, AND THAT IF SELECTED, I WILL USE THE FUNDS FROM THE CITY OF RECIFE IN ACCORDANCE WITH ACT 16.302 OF MAY 23, 1997, IN AGREEMENT WITH THE PURPOSES AND OBJECTIVES ESTABLISHED THEREIN.
RECIFE, ___________ ___, 1999
APPLICANT _________________________________________
52 – Type of floor 53 - Roofing 54 – Other pro perty Packed earth Plastic / canvas Other house Brick / cement Zinc / asbestos tile Shop Tile Slab Other lot Wood / stone Roofing tile Cart Shack None
55 – Electricity 56 - Running water 57 - Sewerage Yes No Yes No Yes No
58 - Durable consumer goods Colour TV
set Sound
system Sewing
machine Electric
mixer Gas stove
B&W TV Bicycle Refrigerator Radio VCR Automobile SECTION 9 Additional information recorded by interviewer

61
SECTION 10 Data on all family members ≥≥ 15 years of age NOT WORKING
62 – Full name
63 Relationship
64 - IF INACTIVE 65 - IF UNEMPLOYED
Today 1. Yes 2. No
Type
Inactive at start of school grant ?
1. Yes 2. No
Last job
How long looking for job?
Unemployed at start of school grant?
1. Yes 2. No
Took course? (*) 1. Yes 2. No Which
1 2 3 4 5 6 7 8
KEY Relationship 1 – son/daughter 2 – stepchild 3 – grandchild 4 – other INACTIVE (type) : 1 – student 2 – retired/ pensioner/elderly 3 – housewife 4 – disabled (*) state whether before or after school grant
SECTION 11 (CHILD LABOUR) Data on all family member under 14 years of age 66 – Full name 67
relationship 68 age
69 grade / level
70 Work activity /
occupation
71 Places
72 Times/week
73 Hours/days
74 Paid Yes No
75 If paid, how much?
R$ 1 2 3 4 5 6 7 8
NOTE
Include domestic chores and taking care of brothers and sisters

62
SECTION 12 Social benefits / programmes 76 – Does your family receive any type of NON-monetary benefit? YES ( ) NO ( ) 77 - Does your family participate or has it participated in any municipal, State, or Federal
social programme? YES ( ) NO ( )
What?
Who provides it? Approximate value
Frequency
Name of
Program me *
Origin
Relationship
Frequency
Starting
Date
Still belong? 1. Yes 2. No
1 – food basket 2 – transport voucher 3 – building materials 4 – clothing 5 – medicines 6 – other (specify) (*) Name of programme - see attached list Frequency - 1 – daily 2 – weekly 3 – monthly 4 – every other month 5 – every six months 6 – occasionally Origin : 1 – municipal 2 – State 3 – Federal
SECTION 13 For applicant 78 – Under what circumstances do you feel it would be justifiable for your son or daughter to miss school for a few days? Y / N
79 – Under what circumstances would you appear at your child’s school? Before grant Since grant
80 – How are you received at the school? Well Coldly Badly
a) If your child is ill? Yes No Yes No 1 – by the headmaster/headmistress b) If another child is ill at home? School parties/events 2 – by the teachers c) If your child needs to help out at home? To discuss how the school operates 3 – by the other school staff d) If your child needs to take care of brothers and sisters? To attend meetings e) If your child needs to work? To check on child’s performance 81 - Have you been able to check: Y / N f) If your child doesn’t feel like going to school? To check on child’s attendance a) your child’s copybooks? (for example, prefers to play with friends)? To talk with teachers b) whether your child keeps up with his/her homework? g) Some other reason? What? To talk with the headmaster/headmistress c) whether your child reads books, magazines, or newspapers? d) whether your child always takes his/her materials to school?

63
SECTION 14 About the Programme
82 – For your family, the school grant is: 83 – Why? (one answer only)
1 Indispensable 2 Very important 3 Good 4 Not very useful
84 – What do you think could be improved in the school grant programme? 1 2 3 4
SECTION 15 OBSERVATIONS

64
Appendix 2. Information on schools in the sample
Table 1. Characteristics of the schools
Sub-Div.
School Neighbourhood Entered programme
No. of teachers
No. of pupils
1 Centro Social Coelhos Coelhos 09/97 29 1 140 1 Coque Coque 09/97 33 967 1 Reitor João Alfredo Ilha do Leite 09/97 21 905 1 Santo Amaro Santo Amaro 09/97 14 377 1 Sede da Sabedoria Santo Amaro 09/97 28 800 1 N. Senhora do Pilar Recife 03/98 23 458 2 Monsenhor Viana Beberibe 03/99 22 678 2 Olindina Monteiro França Dois Unidos 03/99 31 1 043 2 Alto do Maracanã Dois Unidos 03/99 25 782 2 Ricardo Gama Linha do Tiro 03/99 22 794 5 Antônio Correia Barro 03/99 15 479 5 Dom Bosco Jardim S Paulo 03/99 45 1 614 5 Hugo Gerdau San Martin 03/99 20 649
Source: Recife Municipal Scholarship Programme: Questionnaire for School Administrators
Table 2 provides a summary of the answers given by school administrators regarding difficulties faced by schools in implementing the programme. All the administrators stated that the problems are not related specifically to the Scholarship Programme itself, but rather to routine administrative conditions.1
One answer stood out from the rest: lack of interest by students, the most common answer. Next came low teachers’ wages and limited participation by parents. It is interesting to note that direct pedagogical issues per se did not appear as factors that might interfere with the implementation of the Scholarship Programme (lack of pedagogical support from the Department of Education and a mismatch between national curricular parameters and the students’ reality were mentioned in only 3 cases).
1 Answers were to the following questions:
1. Are the difficulties the same as those already faced by the school? 2. Lack of special experts in the school? 3. Lack of teaching materials? 4. Low teachers’ pay? 5. Lack of training for teachers (original academic training and continuing education)? 6. Lack of motivation in teachers? 7. Limited participation by parents? 8. Difficult relations among teachers? 9. Excess turnover of teachers? 10. Lack of pupils’ interest in studies? 11. Insufficient school attendance? 12. National School Curriculum parameters unrelated to pupils’ reality? 13. Lack of pedagogical support from Municipal Department of Education? 14. Lack of teachers’ knowledge about more appropriate teaching methods? 15. Difficult relations with the School Board or Council? 16. Others. Please specify: ________________________. 17. What are the pedagogical obstacl es or difficulties faced by the school in dealing with children on
school grants?

65
Note that it was asked specifically if a lack of qualification or knowledge in appropriate methods among teachers might cause problems for a programme like the school grant, and the unanimous response was “no”.2
Table 2. Difficulties with the admission of pupils from the Scholarship Programme
School Lack of
specialists Lack of didactic
materials
Low teacher wages
Limited parent participation
Pupil’s lack of interest
Mismatch national
curriculum/ pupil’s reality
Lack of support
from dept. Ed.
1 X X X X X 2 X X X X 3 X X 4 X X X 5 X X X 6 X 7 X X 8 9 X X
10 X X X 11 X X X 12 X X X X 13 X X X X
Source: Questionnaire for School Administrators
This response pattern suggests a perspective that used to be prevalent among educational analysts but which has begun to lose ground: that problems in this area can always be explained by social factors, with the school unprepared or unable to make any fruitful intervention in the functioning of social life, either because the school’s role is merely socially reproductive or because it is absolutely (or nearly) incompetent. This perspective appears both when one points to pupils’ lack of interest as the most relevant problem and when one excludes the didactic/pedagogical dimension from the focus of attention on school problems. In other words, from this angle one always claims that school problems are social, and that there is nothing properly scholastic about them.
However, this interpretation by administrators does not appear to be shared by the teachers, or at least not by all of them. When asked about the changes in their work caused by the inclusion of pupils with school grants, 20 of the 26 teachers reported that there had been an increase in pupil participation in the classroom. Although this may sound like the expected (or let us say “politically correct”) answer, note that other answers next to this one highlighted the methodological problems placed on the teaching agenda when these children join a class. Teachers notice the demand for more collective work among themselves, reorganisation of classroom time, and changes in strategies for evaluating pupil performance and teaching. And whilst teachers also take
2 Note that the order of the schools in Table 2 is random, that the numbers do not correspond to the names in Table 1, in order to ensure anonymity.

66
a positive view of the Programme (considered valid by virtually all of them), they do note that it means for greater complexity in their tasks and greater wor k demands.
It is important to highlight that school administrators also see progress in the social conditions for schooling fostered by the Scholarship Programme - viewed through the interest in the school generated by the Programme - that teachers emphasise the positive pedagogical results, that is, that there is a strong trend among teachers to perceive the pupils’ improved school performance as a substantial gain provided by the Programme.
The different perspectives of administrators and teachers presented here do not aim to emphasize clashes - in reality, they are two perspectives that tend to complement each other, both resulting from different forms of work in the school system. But they are portrayed here because it is important to insist on a point related to the school grant concept and the links between citizenship and the school. In a certain sense, teachers and administrators agree that the Scholarship Programme has the advantage of reducing or even eliminating some of the relative disadvantages experienced by economically disadvantaged students. The teachers’ opinion calls our attention to a dimension which is probably the organizing element underlying modern social policies, i.e., the possibility of reducing social inequalities, in this case through schooling. And why does the teachers’ opinion call attention to this? Because it raises the issue of the effect that pedagogical practices have on target publics other than the pupils.

67
Appendix 3. Survey to evaluate the Scholarship Programme Office of the Mayor, Recife Questionnaire for School Administrators
Date: ___/___/_____ Name of School_______________________________________________ Address: ____________________________________________________ Q1 – How many pupils are enrolled in this school? _______________. Q2 – How many teachers work in this school? ___________________. Q3– How many classrooms are there in this school? ___________________. Q4– How many pupils are enrolled in the third grade? ___________. Q5 – How many pupils with school grants are enrolled in the third grade? _________ Q6 – How many third grade classrooms are there in this school? Q7 – In the school’s administration, do you have the collaboration and/or participation of A – teachers?
(0) No (1) Yes
B – parents? (0) No (1) Yes
C – specialised personnel and/or staff? (0) No (1) Yes
Q8– Does this school have a Teaching Policy Plan or Proposal?
(0) No (1) Yes
Q9– What is the most important objective of your school’s Teaching Policy Plan or
Proposal?
______________________________________________________________________________________________________________
Q10 – Has the enrolment of pupils on school grants changed: A - the administration of the school?
(0) No (1) Yes (2) How? _________________________________________ _______________________________________________________ ______________________________________________________

68
B – the proposals in the school’s Teaching Policy Plan? (0) No (1) Yes (2) How? _________________________________________ ______________________________________________________ _____________________________________________________
Q11 – Minimum criteria for a pupil to pass in this school are according to: (1) official or institutional criteria. (2) individual teacher’s decision. (3) decision by meeting of teachers. (4) other. Specify: _________________.
Q12 - The main criteria to decide whether a pupil should repeat the grade are:
(1)marks. (0) attendance (1) maturity (2) classroom behaviour (3) other. Specify: ______________
Q13 - Is there some type of remedial help for pupils with scholastic/learning problems?
(0) No. (1) Yes. What? ________________________________
Q14 - Is there some type of social/psychological counselling for pupils with problems relating in school? (0) No. (1) Yes. What? __________________________________ Q15 - This year, the text books for the pupils:
(0) did not arrive. (1) arrived during the first week of classes. (2) arrived during the first month of classes. (3) arrived before classes began.
Q16 - In this school, do teachers have part of the day reserved for preparing classes?
(0) No. (1) Yes. How many hours a week? _________________
Q17 - What pedagogical obstacles or difficulties has this school encountered in dealing
with pupils on school grants? (1) Are the difficulties the same as usual (i.e., the same as before the Scholarship
Programme)? (0) No. (1) Yes.
(2) Lack of specialised personnel in the school? (0) No. (1) Yes.
(3) Lack of teaching materials?

69
(0) No. (1) Yes.
(4) Teachers’ low pay? (0) No (1) Yes
(5) Low qualifications of teachers (original training and continuing education)? (0) No. (1) Yes.
(6) Limited motivation among teachers? (0) No. (1) Yes.
(7) Limited participation by parents? (2) No (0) Yes
(8) Difficulties in relations among teachers? (0) No (1) Yes
(9) Excessive turnover of teachers? (0) No. (1) Yes.
(10) Pupils’ lack of interest in studies? (0) No. (1) Yes.
(11) Poor attendance by pupils? (0) No. (1) Yes.
(12) National School Curriculum parameters unrelated to pupils’ reality? (0) No. (1) Yes.
(13)Lack of pedagogical support from the Municipal Department of Education? (0) No. (1) Yes.
(14) Teachers’ lack of knowledge concerning more adequate pedagogical methods?
(0) No (1) Yes
(15) Difficulties in relating to the School Board or Council? (0) No (1) Yes
(16) Other. Specify: ________________________. Q18 - Is there a Parents’ Association in this school?
(0) No (1) Yes
Q19 – Is there a School Board?
(0) No

70
(1) Yes Q20 - Is the School Board active?
(0) No (1) Yes
Q 21 – Has the School Board put up any kind of resistance against pupils on school grants enrolling in the school?
(0) No (1) Yes – (2) What kind? ________________________________
____________________________________________________________ ___________________________________________________________ __________________________________________________________ Q22 – How do you view the enrolment of pupils on school grants in your school?
____________________________________________________________

71
Appendix 4. Survey to Evaluate Scholarship Programme Office of the Mayor, Recife Questionnaire for Teachers
Date: ___/___/_____ School ____________________________________________________ Grade: ________ Class: ___________ Are you the teacher in charge of this class? (0) No. I only teach the subject _____________ (1) Yes. T1. How many pupils are enrolled in this class? _________________. T2 Are any repeating the grade? (0) No. (1) Yes. How many? _________. T3. How many pupils in this class are over nine years old? _________________________. T4 – How many children in this class are on school grants? __________________________. T5. How frequently do you use the following teaching techniques in the classroom?
(A). Lecture by teacher? (0) Never. (1) Sometimes (2) Frequently.
(B). Correcting exercises on the blackboard? (0) Never. (1) Sometimes. (2) Frequently.
(C). Discussion with pupils? (0) Never. (1) Sometimes. (2) Frequently.
(D). Individual work by pupils? (0) Never. (1) Sometimes. (2) Frequently.
(E). Group work by pupils? (0) Never. (1) Sometimes. (2) Frequently.
(F). Other? Specify _________________________. (1) Sometimes. (2) Frequently.

72
T.6 – How many hours do you spend a day focusing only on content (not including time used to explain rules or impose discipline, call attendance, or gather up, put away, and arrange materials, etc.)? ___________. T7. How many hours a week do you spend on reading activities in the classroom? _________. T8. How many hours a week do you spend on writing activities in the classroom? _________. T9. How many hours a week do you spend on practical exercises in mathematics?
__________. T10- What proportion of pupils have a text book?
(0) None. (1) Less than half. (2) Approximately half. (3) Most. (4) All.
T.11 – How often are the text books used?
(0) Never. (1) Very little. (2) Frequently.
T.12 – How often do you use library books, newspapers, and/or magazines?
(0) Never. (1) Very little. (2) Frequently.
T.13- Can the library books be checked out and taken home by pupils? (0) No (1) Yes T14 - How many hours a week do you spend in the classroom, correcting pupils’ exercises? ___________. T15. How many hours a week do you spend discussing the pupils with other teachers? _____________. T16. How many hours a week do you spend discussing the pupils with the headmaster/headmistress? _______________. T.17 – What is your own scholastic background? (0) Primary School through 8th grade (1) Secondary School/Teacher Training (2) Secondary School - other (3) University – Specify course/major: ______________________ (4) Graduate school – Specify: _________________________

73
T18. How many years’ teaching experience do you have? ______________________. T19. How many years have you taught in THIS school? __________________________. T20. How many years have you taught the third grade? __________________________. T21 - Tick the changes that might occur or have occurred in your work due to the inclusion of pupils with school grants: (1) greater complexity in your teaching tasks (2) increase in work load (3) reorganisation of teaching schedule (4) demand for more collective work among teachers (5) changes in the evaluation of pupils (6) changes in the teaching approach (7) improvement in working conditions (8) greater pupil participation in the classroom (9) decrease in teacher’s authority in the classroom (10) others. Specify_________________________________________
T22 - Which of these changes do you consider positive? Why?
T 23- Which of these changes do you consider negative? Why?

74
Appendix 5. Mathematic Test – 3rd Grade
Name: ___________________________________________________
Age: ______years Gender: € male € female
School: ___________________________________________________
1. How do you write the number three hundred fifty-six in Arabic numerals?
2. What is the number preceding (that comes before) 780?
3. Paint ½ of each figure:
4. What is the number following (that comes after) 839?
5. Cross out the largest number in the boxes below.
6. Write the numbers that complete the sequence in the empty boxes:
7. Pedro collected 250 figurines. How many tens of figurines did he collect?
8. Do the following addition (show and solve): 421 + 204 + 256
898 579 899
875 901 799
205 207 209 215

75
8. José worked for two weeks and earned 86 reals. He later worked for two more days
and earned 16 more reals. How much did José earn in all?
9. Marina has 30 reals and wants to buy a bicycle that costs 100 reals. How many
reals is she missing to buy the bicycle?
10. José has 350 bricks and Pedro has 125. But they still need 50 more bricks to build
the wall to their house. How many bricks do they need in all to build the wall?
11. Do the following subtraction (show and solve): 867 – 340 12. Do the following subtraction (show and solve): 560 − 68 13. Joana got 3 packages of chocolates. There were 4 chocolates in each package.
How many chocolates did Joana get? (Embedded image moved to file: pic05558.pcx)
14. Roberto has to take 15 vitamin pills in all. He has to take 3 vitamin pills a day.
How many days will Roberto have to take the vitamins?

76
15. Jorge bought a telephone on 3 equal instalments of 23 reals. How much did the telephone cost? (Embedded image moved to file: pic15953.pcx)
16. The tickets to the football game cost 1 real. How many 25-cent coins does it take to
buy a ticket? (Embedded image moved to file: pic16315.pcx
17. In the bowling game, Lucas knocked down 15 pins. If the game has 28 pins, how
many were left standing?
18. Paint the squares that appear in the drawing of the train:
19. Julia has 2 notes worth 10 reals each and 12 coins worth 1 real. How many reals
does she have?
10 Reais 1 Real

77
Appendix 6. Cultural practices and values related to schools
When we asked parents why they might be called to come in to school, we included a switch: we asked about the pupil’s behaviour prior to receiving the school grant and possible changes since receiving the stipend. Not surprisingly, there was no difference: the answer “adequate” behaviour was given in approximately 95 per cent of the cases both before and after the grant, with no variation over time. The parents (rather, generally the mothers) reported that they recognised the school’s value and were vigilant towards it. This kind of pattern leads one to believe that even if the answers are not true, strictly speaking, they suggest a growing valorization of the school and “scholastic” (or school-related) ways of viewing the world. That is, even though it is because they are responding to the agents in charge of granting the stipend, the mothers know what behaviour is expected of them. Although perhaps opportunistic, such a perception may be seen as a positive result of the Scholarship Programme and others like it, with the persistent hope that such an attitude can be translated into on-going practices by the families in valorizing the school.
As shown next, in Table A.1, variation in responses are minor. We begin with an analysis of the circumstances in which the mother feels it is reasonable for her son or daughter (and there was no difference according to gender) to miss school, comparing the children with and without school grants.
The first noteworthy evidence, certainly a positive effect of the Programme, is the fact that the mothers of children with school grants always gave the most “reasonable” answers, or the expected ones from the school’s point of view, as compared to mothers from the control group. The only cases in which this trend changes is when the child himself/herself is ill. In this case, twice as many mothers of children with school grants felt that the child should not miss class, even when ill. This answer matches the question identified by school administrators according to which mothers of children with stipends force them to attend school even when they are ill, even if they have a contagious illness.
The slight differences in the answers do not allow us to take these variables as an explanatory factor for different levels of performance. However, they do indicate the school’s enhanced importance for poor families. They thus reflect the Programme’s positive result in terms of adherence to universalizing values. Note that the differences between reasons for missing school are greater in precisely two critical points: “to help out at home” or “to work”. As we know, the two answers probably refer to the same problem - the term “to help out” actually means “to work”, a phenomenon associated with disguising child labour among low-income groups - and the lowest rates on these items were for mothers of children with school grants.

78
Table A.1 Reasons given by mothers for pupils to miss school, according to participation in the Scholarship Programme
Reason/situation Justifiable? Participation in programme (%)
Control group With school grant To help out at home No 92.6 97.0
Yes 7.4 3.0 To take care of younger siblings No 91.6 94.7
Yes 8.4 5.3 When ill No 2.8 4.5
Yes 97.2 95.5 When younger sibling is ill No 94.9 96.2
Yes 5.1 3.8 Needs to work No 92.6 96.2
Yes 7.4 3.8 Does not want to go No 97.7 99.6
Yes 2.3 0.4 Source: Parents’ Questionnaire
Moving on to habits, we analyse two types of measures associated with school performance: keeping watch over the children’s homework and participating in school life. As in the previous case, there is very little variation in the answers concerning mothers checking on their children’s school work, as shown in Table A.2.
Table A.2 Checking on homework, copybooks and reading assignments.
Does mother CHECK: Answer Participation (%)
Control group With school grant Copybooks? No 2.8 1.1
Yes 97.2 98.9 Homework? No 2.0 0.8
Yes 98.0 99.2 Reading assignments? No 6.3 10.2
Yes 93.7 89.8 School materials? No 2.0 0.4
Yes 98.0 99.6
We find the same pattern in the differences here. The only exception is not checking on the children’s reading assignments, a more frequent phenomenon among families on the stipend, which may be associated with a slightly higher illiteracy rate in this group, a specific obstacle for these mothers. These variables taken together explain only 0.6 per cent of the variance in test scores, and are only statistically significant at 10 per cent, in other words, they also lack explanatory power.
On the other hand, the variable “participation in school life” provides us with quite different results (Table A.3.).

79
Table A.3 Reasons for Parents Vi siting School
Visits school answer Participation (%)
Control group With school grant To speak with the headmistress (administrator)?
No 6.3 14.2
Yes 93.7 85.8 To speak with the teacher? No 1.8 5.0 Yes 98.2 95.0 For parties or school events? No 27.3 32.2 Yes 72.7 67.8 To discuss how the school operates? No 16.5 26.2 Yes 83.5 73.8 For meetings? No 4.5 1.9 Yes 95.5 98.1 To check child’s performance? No 3.0 4.9 Yes 97.0 95.1 To check attendance? No 2.8 4.6 Yes 97.2 95.4
Table A.3 shows us the level of awareness among mothers of children with and without school grants as members of the school community. With only one exception (meetings, which are mandatory for mothers of children on the stipend), the various forms of participation in school life are less frequent among families with the grant. Although this can be seen as indicating that the Programme is properly targeted (since mothers of children qualifying for school grants would tend to have more difficulty relating to the school), another interpretation is that although the programme has made progress with values and revitalization of practices, it still needs to improve family participation in the school. This is especially true if we recall that the Programme is intended to promote a strong link with the parents at two levels, school and work, shortening the distance in the parent/school relationship. We were not able to find any kind of explanation for these variables.
We are thus led to affirm that cultural factors have no explanatory power in relation to differences in the children’s school performance, a phenomenon which can be ascribed at least partially to the two groups’ cultural homogeneity.