assessing political skill for management selection
TRANSCRIPT

University of South FloridaScholar Commons
Graduate Theses and Dissertations Graduate School
2-6-2015
Assessing Political Skill for Management SelectionNneka JosephUniversity of South Florida, [email protected]
Follow this and additional works at: https://scholarcommons.usf.edu/etd
Part of the Industrial and Organizational Psychology Commons
This Dissertation is brought to you for free and open access by the Graduate School at Scholar Commons. It has been accepted for inclusion inGraduate Theses and Dissertations by an authorized administrator of Scholar Commons. For more information, please [email protected].
Scholar Commons CitationJoseph, Nneka, "Assessing Political Skill for Management Selection" (2015). Graduate Theses and Dissertations.https://scholarcommons.usf.edu/etd/5516

Assessing Political Skill for Management Selection
by
Nneka Joseph
A dissertation submitted in partial fulfillment of the requirements for the degree of
Doctor of Philosophy Industrial and Organizational Psychology Department of Psychology
College of Arts and Sciences University of South Florida
Major Professor: Michael Brannick. Ph.D. Walter Borman, Ph.D. Jennifer Bosson, Ph.D.
Walter Nord, Ph.D. Paul Spector, Ph.D.
Date of Approval: February 6, 2015
Keywords: Test, Recruitment, Employees, Comparison
Copyright © 2015, Nneka Joseph

DEDICATION
I would like to dedicate my dissertation to my family; my parents, Jennifer and Peter Joseph, my
sister, Zahra Gibbons, my grandmother, Dora Gibbons and all other family members for their love,
support and encouragement.
I would also dedicate this project to my close friends who kept my spirits up, provided stress relief
and were there when I needed them.
I dedicate my dissertation work and specially thank my best friend. Shayne Cooper, who reassured
me when I doubted myself, gave words of inspiration and coached me through this process till the
end.

ii
ACKNOWLEDGMENTS
I would like to warmly thank my advisor Michael Brannick, PhD. for his support, guidance and
feedback throughout graduate school. I would also like to acknowledge my dissertation committee
for their spirited discussion, fair evaluation and many suggestions for future studies. Thank you to
Jacob Opadeyi, PhD and Alison Gibbons PhD., though not formerly my advisors they gave me a lot
of guidance to assist with the completion of my dissertation.
To my cohort, Jeff, Jacob, Erin and Jason, we did it. We all completed our Ph.Ds and I know I
would not have made it through my classes, research projects and dissertation without you. I would
like to give a special thank you to my other school friends Soner and Ande who actively got involved
in my project and helped with the paper work. To my friends and work colleagues I would like to
say thank you for your support in participating in pilot tests and the initial stages of test
development for my study.
Finally, I would like to show my appreciation to the UWI-Arthur Lok Jack Graduate School of
Business, Professor Miguel Carrillo, for giving me permission to interview and assess their students
for my dissertation.

i
TABLE OF CONTENTS
LIST OF TABLES ............................................................................................................................................ ii ABSTRACT ....................................................................................................................................................... iii CHAPTER I: INTRODUCTION ................................................................................................................. 1
Current Research .................................................................................................................................. 2 Gaps and Limitations of Current Research ...................................................................................... 4 Current Study ........................................................................................................................................ 6 Selection Measurement Methods ....................................................................................................... 6 Choice of Methods ............................................................................................................................. 11 Hypotheses .......................................................................................................................................... 12 Study Design Overview ..................................................................................................................... 13
CHAPTER II: METHOD ............................................................................................................................. 14
Section 1: Development of Predictors - SJT & Structured Interview ........................................ 14 Political Skill Situational Judgment Test ............................................................................ 14 Political Skill Structured Interview ..................................................................................... 18
Section 2: Development of a Criterion Measure – Other Rating Scale ...................................... 20 Section 3: Measurement Comparison ............................................................................................. 24
Participants ............................................................................................................................ 24 Measures:................................................................................................................................ 26 Procedure: .............................................................................................................................. 26
CHAPTER 3: RESULTS ............................................................................................................................... 28
Section 1: Development of Predictors - SJT & Structured Interview ........................................ 28 Section 2: Development of a Criterion Measure – Other Rating Scale ...................................... 31 Section 3: Measurement Comparison ............................................................................................. 32 Supplemental Analyses ...................................................................................................................... 33
CHAPTER IV - DISCUSSION .................................................................................................................... 39
Summary of Results ........................................................................................................................... 39 Implications ......................................................................................................................................... 43 Limitations ........................................................................................................................................... 43 Future Studies ..................................................................................................................................... 44 Conclusion ........................................................................................................................................... 44
REFERENCES................................................................................................................................................ 45 APPENDIX ..................................................................................................................................................... 51

ii
LIST OF TABLES
Table 1: Participants Demographic Information .............................................................................................. 25 Table 2: Cronbach Alpha for the entire Political Skill Inventory and the test Subscales ............................ 28 Table 3: Intra-class Correlation Coefficient of 5 Experts Ratings of the SJT ................................................ 29 Table 4: Spearman Brown Number of Judges Analysis for ICC (r = 0.80) ................................................... 29 Table 5: Intra-class Correlation Coefficient of 3 Experts Ratings of the SJT ................................................ 30 Table 6: Cronbach Alpha for the 23 Item Situation Judgment Test and the Subscales ............................... 30 Table 7: Intra-Class Correlation Coefficient of 2 Expert Raters of the Interview ........................................ 31 Table 8: Cronbach Alpha for the 8 Item Interview and Subscales .................................................................. 31 Table 9: Intra-Class Correlation Coefficient of 2 Co-worker Raters ............................................................... 31 Table 10: Cronbach Alpha for the Co-worker Questionnaire and Subscales ................................................ 32 Table 11: Correlation matrix with PSI, Interview, SJT 3 EXPERTS and Co-worker 1 .............................. 35 Table 12: Correlation matrix with PSI, Interview, 8 Consistent Items SJT, Co-worker 1 ........................... 36 Table 13: Correlation matrix with PSI, Interview, SJT (Rescore), Co-worker 1 ........................................... 37 Table 14: Correlation matrix with PSI, Interview, 8 Consistent Items SJT (Rescore), Co-worker 1 ........ 38 Table 15: Frequency Analysis of Interview Question 1 and SJT item 6 Responses ..................................... 41 Table A 1: Correlation matrix with PSI, Interview, SJT 32 Items 5 Experts and Co-worker Average ..... 51 Table A 2: Correlation matrix with PSI, Interview, SJT 32 Items 5 Experts and Co-worker 1 ................. 52 Table A 3: Correlation matrix with PSI, Interview, SJT 32 Items 5 Experts and Co-worker 2 .................. 53 Table A 4: Correlation matrix with PSI, Interview, SJT 32 Items 3 Experts and Co-worker Average ..... 54
Table A 5: Correlation matrix with PSI, Interview, SJT 32 Items 3 Experts and Co-worker 1 .................. 55 Table A 6: Correlation matrix with PSI, Interview, SJT 32 Items 3 Experts and Co-worker 2 .................. 56

iii
ABSTRACT
Political skill has been described as using human resources and manipulating social exchanges to
influence group outcomes (Mintzberg, 1983). Researchers have found that political skill has significant
relationships with constructs such as contextual performance, career satisfaction and leadership. Based
on these empirical findings it may be beneficial to include a measure of political skill as part of a
selection process. In this study, different methods were explored for measuring political skill that may
be appropriate for administrative purposes such as the self-rated questionnaire called the Political Skill
Inventory (PSI), a situational judgment test (SJT) and the structured interview. A sample of 100
graduate business students, most of whom had extensive managerial experience, completed the
previously mentioned measures in exchange for feedback on their assessments. The participants were
subsequently rated on political skill by their coworkers. The only significant association with the
coworker scores was the PSI; neither the SJT nor the structured interview showed a significant
relationship with the peer ratings of political skill. However, there were unforeseen technical limits to
the measures that might explain the negative findings. The paper concludes with recommendations
for improving the measures prior to a follow-up study.

1
CHAPTER I: INTRODUCTION
What makes one employee more successful than another is an important question for
industrial and organizational (I/O) psychologists. Researchers have examined various antecedents to
job performance and some have noted that the more capable a person is at utilizing different resources
and skills in order to influence change, the more likely that they will be a successful and effective
employee. Mintzberg (1983) introduced the term Political Skill, to describe utilizing human resources
to influence change. He explored how the ability to observe and manipulate social exchanges could
contribute to being an effective employee. Expounding on Mintzberg’s concept, Ferris, et al. (2005)
further defined Political Skill as “the ability to effectively understand others at work and to use such
knowledge to influence others to act in ways that enhance one’s personal and/or organizational
objectives”.
Building on the perception that political skill could be a contributing factor to job performance
it became essential to develop an instrument to measure it. In the initial stages of test development,
Ferris, et al. (2007) conducted several psychometric analyses and discovered that a four factor model
was best suited for the content of political skill. The four dimensions identified from the factor analysis
were termed social astuteness, interpersonal influence, networking ability and apparent sincerity. Ferris
and his colleagues defined social astuteness as the ability to observe others’ behaviors and critically
analyze social interactions. Those who are socially astute can empathize with others in order to receive
personal gains. Interpersonal influence involves adjusting one’s behavior to match the audience to
maximize one’s influence with the intent of achieving one’s personal objective. Developing a
significant social group incorporates negotiating and conflict management skills. People who can

2
strategically position themselves through alliances and coalitions can take advantage of multiple
opportunities that arise from knowing other influential people. This practice is referred to as
networking. The final dimension is apparent sincerity which is simply managing your image such that
you appear to others as having high levels of integrity and that you are authentic, sincere, and genuine.
Based on the results of the factor analysis the Political Skill Inventory (PSI) was developed by
Ferris, et al. (2005). The current PSI is an 18 item test that asks candidates to rate on a 1 – 7 scale their
agreement with statements such as “I am good at getting people to like me.” With an instrument
developed it was now time for researchers to truly explore the relationships between political skill and
job performance along with other job relevant variables. The PSI and its modified 6 item version have
been used in many studies concerning political skill. The following section will review current research
which provides insight into the role that political skill plays in the work environment.
CURRENT RESEARCH
Although Mintzberg introduced this concept in the early 1980s, it was only recently that
researchers have explored the relationship between political skill and other constructs of interest.
Through the use of the PSI, researchers discovered that political skill has significant positive
relationships with contextual job performance (Jawahar, Meurs, Ferris & Hochwarter, 2008), career
satisfaction, and promotion within the organization (Todd, Harris, Harris & Wheeler, 2009).
Political skill was initially proposed as the manipulation of human resources and social
interactions which is similar to the concept of leadership. “A leader gets organizations and people to
change”, Maccoby (2000). Therefore it was also important to look specifically at leader political skill
since managers have additional social pressures requiring them to build and maintain relationships
with multiple persons at varying levels, both internal and external to the organization. Ahearn, Ferris,
Hochwarter, Douglas & Ammeter (2004) found that leader political skill accounted for a significant
increment in team performance variance after controlling for a number of leader characteristics and

3
team variables. It was also discovered that political skill positively related to subordinate and supervisor
ratings of leader effectiveness (Douglas & Ammeter, 2004) and employee perceptions of perceived
support and trust (Treadway et al. 2004).
These significant results led researchers to conduct more complex analyses in order to further
understand the significance of political skill. Studies found that political skill can also be a moderator
for several relationships involving stress. One study uncovered that political skill has a positive effect
on reducing stress by moderating its relationship with role conflict. Another explored the relationship
between role conflict and strain. Strain, a sub-factor of stress, occurs when the appraisal of one’s
situation becomes psychologically uncomfortable and generates negative emotional and physical
reactions. The researchers of the this study, Perrewé, Zellars, Ferris, Rossi, Kacmar & Ralston (2004),
found that more politically skilled individuals experienced less negative effects of role conflict as it
relates to psychological and physiological strain. Jawahar, Stone & Kisamore (2007) explored the
concept of burnout. Burnout refers to a drain of mental/emotional resources caused by chronic job
stress. In their research paper, they explained that high levels of political skill reduced the negative
effects that role conflict has on personal accomplishment, which is one manifestation of burnout.
Political skill not only moderates the role conflict and job stress relationship; it was discovered
to play a role in the relationship between impression management and job performance. Harris,
Kacmar, Zivnuska & Shaw (2007) found that those who engaged in impression management
techniques were rated more favorably by their supervisor when they had high political skill. However,
workers who had low political skill scores but engaged in impression management received less
favorable performance evaluations from their supervisors. These studies and many others
demonstrate that political skill is important as it relates to several constructs such as job satisfaction,
job stress and leader effectiveness. However, this is only the beginning stages of discovering the extent
to which political skill can impact the workplace. Therefore this paper continues by investigating

4
existing gaps in current research, focusing in an area that is of great interest to I/O psychologists,
employee selection.
GAPS AND LIMITATIONS OF CURRENT RESEARCH
Despite the many significant findings, political skill is a relatively new research area and there
is opportunity for improvement and extension of this construct. For example, the current literature
has not explored political skill from a selection perspective. Because most of the constructs and
relationships examined appear significant for job performance, it seems prudent to measure the
political skill of applicants, especially for managerial jobs. As mentioned previously, political skill
impacts leadership success in terms of team performance (Ahearn et al., 2004) and perceived leader
effectiveness (Douglas & Ammeter, 2004).
One limitation of the current research is that the majority of previous studies of political skill
were conducted using one political skill measure, the PSI. The PSI is a self-report measure that uses
a Likert-scale response option. Such measures have been shown to be prone to response distortion
and appear easily “fakable” in the context of personnel selection (Donovan, Dwight, & Hurtz, 2003).
Similar concerns have been raised regarding personality testing for administrative purposes (Arthur,
Woehr and Granziano, 2001).
Arthur, et al. (2001) explored several issues associated with personality testing and selection.
Two such issues appear relevant to the PSI. One issue is the assumption of a linear relationship
between predictors and criteria. The linear model implies that higher scores on the predictor are more
desirable, which suggests selecting those with the highest scores over those with more intermediate
scores. Alternatively, it may be the case that for some jobs there is an ideal point for the trait; for
example, for police officers there may be an ideal point for agreeableness. Because there may be an
ideal point for using political behavior this issue is a concern when using the PSI for selection. The
second issue noted in this article is impression management and self-deception on a self-report test.

5
Persons applying for a job are motivated to present themselves in the best light and may therefore
alter their responses to do so. It is also possible that they may truly believe that they are very
conscientious, for example, when in reality they are not as detail oriented as they think. Impression
management and self-deception lead to biased responses on self-report Likert scales.
Though it has been shown that response distortion does not appear to impact the validity of
a test (Barrick & Mount, 1996) it has been demonstrated that using the typical top down selection
process, especially in management selection when there is a low selection ratio, the selected candidates
are disproportionately those who faked on the test (Rosse, Stecher, Miller & Levin, 1998). Thus, for
selection contexts at least, it appears preferable to design a measure of political skill that is not as easily
manipulated by the test taker to create a favorable impression.
Secondly, the PSI has been mainly validated using undergraduate students who may or may
not represent well the population of managerial job applicants. It will be preferable to use a sample
of participants that are either managers, managerial applicants, or those who are likely to be managerial
applicants within some reasonable period of time.
Thirdly, Mintzberg (1985) argued that to successfully use political behaviors, individuals must
not only possess ‘political will,’ or capacity to expend personal effort, but also possess ‘political skill,’
the ability to execute behaviors in a politically shrewd way. Treadway, Hochwarter, Kacmar & Ferris
(2005) conducted a study that attempted to test Mintzberg’s theory by proposing a model of political
behavior. However this study did not actually observe participants’ political behavior but simply asked
whether they engaged in such behavior. It would be preferable to relate scores on a test of political
skill to a more impartial measure of behaviors indicative of more or less political skill in job relevant
contexts. Since this study will be looking at predicting political behavior; and it may be difficult to
actually observe political behavior in the workplace, using other ratings maybe a more appropriate
approach rather than self-report. Supervisors, peers and subordinates should be able to provide a

6
more unbiased evaluation of someone’s behavior as opposed to how individuals think they act. Using
this type of rating will help fill the gap of measuring political skill that occurs in the workplace.
CURRENT STUDY
Based on the limitations mentioned in the previous section, the purpose of this paper was to
develop a measure of political skill that could be used for selection, compare that instrument to existing
alternative measures, and compare each of the selected methods to an external job-related
performance criterion. The study is intended to provide a better understanding of the measurement
of political skill and the reasons for its relation to employee success. The results should also be of
interest in the practice of managerial selection.
In order to determine which selection method or methods will be best for assessing political
skill, it is important to explore the different options currently used. For job selection there are several
measurement methods such as interviews, work samples, assessment centers and situational judgment
tests that can be used to assess different constructs. Therefore it is prudent to review the pros and
cons of each of these methods to determine which will be best suited as an alternative to the PSI for
measuring political skill in selection situations.
SELECTION MEASUREMENT METHODS
One popular measurement method for assessing political skill is the interview. It is included
in most selection processes for all job levels. The employment interview is a communication method
that allows the employer to ask questions about the applicant and also for the applicant to find out
more about the organization and the job requirements. There are a few advantages to this method.
Firstly, interviews can provide information that may be missing or questionable from other selection
procedures. For example responses on specific personality items may not be clear and the interviewer
could ask for further clarification. Secondly, especially for jobs where employees are directly

7
interacting with people, including clients, subordinates, peers and supervisors, interviews can be used
to assess applicant appearance, verbal communication and interpersonal competence. Thirdly, the
main purpose of any selection method is to evaluate applicants’ job knowledge, using an interview can
be beneficial in this area as many interview questions may be technical. One concern about interviews
is the ability to compare one candidate’s responses to another. A structured interview allows for
applicant comparisons and has been shown to be a valid predictor of job performance while adding
incremental validity over cognitive ability (Schmidt & Hunter, 1998). Additionally an interview can
be used to measure other constructs besides job knowledge. One study found that personality and
applied social skills such as interpersonal relations and ability to work with others were rated frequently
during an interview (Huffcutt, Conway, Roth & Stone, 2001). Such a finding makes the interview a
plausible method for measuring political skill for selection purposes. To illustrate, candidates can be
asked to describe an occasion in which they had to use their networking skills or explain how they
persuaded others to agree to one of their project ideas.
Despite the above mentioned advantages, interviews have a few shortcomings. Firstly, they
are time consuming and expensive to administer. Each interview can take up to 15 – 30 minutes and
interviewers have to be paid for that time. It also does not allow for testing of a large number of
applicants at one time. The next major concern of an employment interview is rating the applicants’
responses. There are several rater errors such as halo and leniency and other biases that can influence
decisions made based on interview scores. Attempts to reduce this problem include having a panel
of interviewers and rater training, but this adds to the cost of conducting interviews as it increases the
number of interviewers and increases the time taken to train human resource personnel.
Another selection tool is the work sample, which provides the applicant with a specific job-
related task and results in observable job-relevant behavior. In other words, a work sample is a
miniature replica or simulation of situations or tasks which an applicant will face on the job (e.g., a

8
welding test or a driving test). This method has the highest criterion validity on average (r = 0.54;
Schmidt & Hunter, 1998), it is well accepted by applicants and tends to have minimal adverse impact
(Brugnoli, Campion & Basen 1979). Managerial work samples can be group activities like a leaderless
group discussion. Such an exercise might require a group of participants to discuss some job-related
topic whereby each person attempts to persuade the others to a different course of action (Cascio &
Aguinis, 2008). There are also individual exercises such as the business game. One example is a
simulation that was created to have participants perform six one-hour tasks. They were challenged to
complete several critical managerial tasks which required skills in strategy and planning and were
assessed on response time and use of opportunities (Struefert, Pogash & Piasecki, 1988).
The different dimensions of political skill could possibly be measured using such a selection
method. For example the leaderless group discussion could be used for assessing interpersonal
influence. However this would mean that several work samples may have to be designed for each
political skill dimension, which would be very expensive to design and administer. As noted in the
example of the business game simulation, it took six hours per applicant. This means that it is not a
feasible method for testing a large applicant pool. For work samples that test interpersonal relations,
observers are typically needed for scoring. Once such observers become part of the measurement
process, questions of reliability and validity of the raters become an issue. As with the interview, the
number of raters, their training, and their expense must be considered.
Building on the work sample concept is a selection tool referred to as an assessment center
(AC), which is mostly a collection of work samples (e.g., a leaderless group discussion or an in-basket)
combined with other psychological testing (e.g., personality tests). The assessment center method is
used mainly for management selection and can provide feedback for developmental and administrative
purposes (Cascio & Aguinis, 2008). The main purpose of an AC is to measure the dimensions or
competencies that participants need in order to perform well on the job (Thornton & Rupp, 2006).

9
In a typical assessment center, assessors observe the behaviors of the 6 – 12 assessees and score their
behavior based on dimensions (e.g. communication, problem solving) that were identified through a
job analysis. Therefore this method allows others to rate social interactions in a simulated work
environment which makes an assessment center appear to be one of the best ways to measure political
skill behaviors.
The main advantages of this method stems from its design. Because it brings together many
selection instruments and techniques (Cascio & Aguinis, 2008), it has all the advantages associated
with cognitive and personality tests, interviews and work samples. ACs are also moderately correlated
(r = 0.37; Schmidt & Hunter, 1998) with job performance; appear fair to minority groups with little
to no adverse impact and applicants can be compared on different dimensions including overall
assessment ratings.
Despite the many advantages there is the major concern of construct validity and the problem
of exercise factors (Woehr & Arthur, 2003). Similar to interviews and work samples there is the issue
of rater errors and biases. Thirdly, ACs are time consuming and costly to design and administer.
Generally participants engage in a series of exercises over a three to five day period (Gaugler,
Rosenthal, Thorton & Bentson, 1987) and this may not be feasible for most businesses.
As a result of the cost and time associated with ACs, researchers have explored an alternative
way to present applicants with multiple job situations and assess their responses to critical incidents.
Because high fidelity assessments are so expensive, a lower fidelity method was considered. This led
to the development of the final type of measurement method described here, the situational judgment
test (SJT). The SJT is essentially a low fidelity work sample test that typically presents applicants with
a variety of job relevant situations. Such scenarios are generally created based on critical incidents or
other job analytical methods. For each situation, test takers are presented with multiple possibilities
for handling the hypothetical scenario. Participants are then required to select the most appropriate

10
response using either a forced choice (select the option you will most/least likely perform) or a Likert-
style (rate the effectiveness of each option on a 1 – 5 scale) format (Weekley & Polyhart, 2006). SJTs
are usually presented in a paper and pencil form, although video and computer based versions have
also been used (Weekly & Jones, 1997). In either case (written or video stimulus presentation), the
responses are selected rather than generated by test takers. According to McDaniel & Nguyen (2001) this
measurement method can be used to assess a variety of constructs and will therefore be a possible
option for measuring political skill.
The popularity of this type of selection tool has increased over the years due to its
many positive features. The first advantage is its relationship with job performance as researchers
McDaniel, Morgeson, Finnegan, Campion & Braverman (2001) discovered by analyzing 102 validity
coefficients. The results of their analysis found a mean corrected validity of 0.34 with job performance.
Secondly, other researchers found that this test type provides incremental validity beyond more
typically used assessment methods such as personality and cognitive ability (Chan & Schmitt, 2002).
One possible reason for this incremental validity is that SJTs have been found to be correlated with
job knowledge (Motowidlo, Borman, & Schmit, 1997) and job experience (Weekley & Jones, 1999).
It is possible that an SJT for political skill might measure ‘tacit knowledge’ (Wagner & Sternberg, 1985)
in leadership situations, which could be important for managerial success.
Thirdly, SJTs are relatively well perceived by applicants (Lievens, Peeters & Schollaert, 2008).
They tend to have less adverse impact towards minorities than cognitive ability tests, and good face
validity because test takers can see connections between items and actual job situations (Lievens,
Peeters & Schollaert, 2008). In addition, the SJT can also provide applicants with a realistic job
preview because it describes a variety of problems that applicants will likely face after being hired.
Apart from the above mentioned advantages, there are two major benefits of this method. It
can be easily administered to a large applicant pool, which is an advantage over interviews and typical

11
work samples. Also, there are minimal rater errors from observers because the scores are based solely
on the response selected by the applicant rather than an observer’s interpretation of the behavior
observed in the test situation. Conversely, an SJT can be expensive to develop because it requires the
generation of many scenarios and associated actions (Lievens, Peeters & Schollaert, 2008). The actions
must be plausible but still discriminate among candidates so as to identify those who best fit the job.
Judges must still evaluate each of the responses to the stem or stimulus situation presented in the SJT.
However, the magnitude of the error (disagreement) among judges can be more easily studied and
better controlled by the researcher than in the case of interviews and assessment centers. With the
SJT, the error is largely confined to the development of the scoring key. After that, the error in scoring
the applicant response tends to be negligible.
Although the SJT has clear benefits, the applicant must select, rather than generate, the
response to the situation. It is possible that the applicant may recognize the appropriate response to
a problem even though that response would not have occurred to them when simply presented with
the problem. Additionally, the manner or style in which the applicant would respond is not
observable. One could select the option ‘delegate this item to your assistant’ for example, but selecting
such an option does not tell us the medium chosen (face-to-face, email, etc.) or the tact and
consideration for the subordinate that gets displayed while delegating. In the paper-and-pencil SJTs
it is difficult to represent nonverbal social cues realistically as part of the stimulus; this is less of an
issue with video SJTs, where actors present such cues.
CHOICE OF METHODS
Based on the review of the literature, three different methods were compared in the current
study. First, the situational judgment test was chosen because it has many of the benefits of work
simulations (eliciting job-related knowledge and skill in a manner that is face valid and yet
standardized). Additionally this test type may also gather more information about political skill by

12
addressing how workers analytically process social situations (tacit knowledge). The second method
that was chosen is an interview. Interviews are used in the majority of recruitment processes and
unlike the PSI and the SJT, the interview allows candidates to generate their own responses to different
political situations. The inclusion of an interview allows an indirect comparison of the importance of
direct interpersonal contact as a source of information about political skill.
The PSI is the third measurement method to be included as it has been used in previous studies
that found relationships between political skill and other constructs. Based on the literature, the PSI
appears to be the researcher’s choice for measuring political skill. Though response distortion is a
concern, some researchers have reported that faking on measures in employee selection only slightly
affects the validities of these tests (Barrick & Mount, 1996; Ones, Viswesvaran & Reiss, 1996). Each
of the methods, the PSI, SJT and Interview appears feasible for measuring political skill; however each
method has advantages and disadvantages. For example, the interview is more challenging to
administer than the others, but it is the only method which allows the direct observation of
interpersonal behavior. Such observation is likely to provide cues that are important for politically
skilled actions. The SJT on the other hand, is difficult to develop, but it also appears relatively difficult
to fake compared to the PSI and is essentially sample situations and behavioral choices related to
political skill rather than self- assessments. The PSI is an established scale with evidence of reliability
and validity. It is easy to administer and has been used in several studies. However, for selection there
is the concern of candidates distorting their responses either intentionally or because they lack insight
into their own competence as compared to others.
HYPOTHESES
H1: There will be a positive relationship between scores from each of the predictors (PSI, SJT and
structured interview).

13
H2: Each of the three predictor tests will significantly predict the criterion of political skill on the
job.
H3: SJT will add incremental validity over the structured interview and PSI.
H4: The structured interview will add incremental validity over the PSI.
STUDY DESIGN OVERVIEW
The current study consists of three parts. The first section describes the development of the
other predictor measures, that is, the SJT and the structured interview. Experts in political skill and
employee management were used to create test items for these two measurements. The second section
incorporates the development of the criterion measure for this study. This consists of other peer
ratings of political skill. Experts for the SJT were sampled from jobs including sales managers,
customer service managers, I/O psychologists and university professors. These persons were
identified because of their extensive experience in the four areas that make up political skill.
Measurement validation was the purpose of section three, in which each of the predictor tests (SJT,
interview and PSI) were compared to other ratings of the candidate’s political skill. The participants
for this section were master of business administration (MBA) students that are managers and manager
trainees because they are generally working in their career of choice and have more work experience
compared to other college students. Because this study is primarily interested in management selection
this group also represented more managers or prospective managers and have a wider age range than
would a typical undergraduate group or a random sample of workers.

14
CHAPTER II: METHOD
SECTION 1: DEVELOPMENT OF PREDICTORS - SJT & STRUCTURED INTERVIEW
POLITICAL SKILL SITUATIONAL JUDGMENT TEST
As outlined previously, SJTs are somewhat laborious to design as the development of
this assessment involved several steps before the final product was ready for administration. The first
step was to determine the presentation format. SJTs can be presented in either a written format or a
video presentation. For this study the written presentation was used because it is simpler and less
expensive to create and administer.
Following the format of the instrument, a decision was needed for the instructions on how to
complete the test. For a SJT this becomes a significant consideration as there has been a debate among
researchers between using “will do” versus “should do” instructions. The main purpose of this study
was to find an alternative selection method to a self-rated Likert type test due to prevalence of response
distortion especially under administrative conditions. With this in mind, the “should do” instructions
was selected as the most appropriate due to evidence that SJTs with this directive have higher validity
(Reynolds, Sydell, Scott, & Winter, 2000) as compared to the “will do” versions. Although this
instruction has been linked to higher cognitive load (Nguyen & McDaniel, 2003), this test was designed
for management selection; because managerial applicants typically have advanced educational degrees,
cognitive load was less of a concern.
The subsequent steps involved the creation of the test’s content, which included the creation
of the item stems and corresponding responses. There are several ways to develop test items and for
this SJT construction it was decided to use subject matter experts (SMEs). SMEs are typically persons
who have specific job or construct knowledge/experience. The first step was the creation of critical

15
incidents (stems) that form the basis of the final scenarios used in the test. The second step was to
create possible responses to the incidents selected. Each expert was asked to provide an effective and
an ineffective response to their scenario. I/O psychologists also provided responses to the stems that
were selected for the initial assessment. For these stages both the scenarios and responses were
reviewed before being selected for the test. According to Weekley & Polyhart, (2006) it is important
to consider the content, complexity and fidelity of the items to make sure that the test matches the
applicant pool and the intentions for using the measure.
The final step was to develop the scoring key. During this stage another group of experts
rated each stem response on a 1 – 7 scale, where 7 represented a very effective approach to dealing
with the situation presented and 1 indicated a very ineffective choice to the problem. Different
responses could have the same rating from experts and for each item not all of the rating scale points
were used. When a test taker selected an option, they were given the score provided by the mean of
the expert ratings for that response.
Scenario & Response Development
A sample of 10 managers and executives from different industry backgrounds were selected
as SMEs in order to generate 2 critical incidents for each of the four political skill dimensions. This
group of experts composed of 4 males and 6 females from diverse professional backgrounds including
human resource management, corporate communication, architecture and sales. Their years of
experience in the respective fields spanned 12 – 30 years, each having earned either a bachelor’s or
master’s (n = 5) degree. In conjunction with the incidents provided by the experts, business case
studies and sample competency-based interview questions and responses were reviewed and edited to
make up a total of 100 possible critical incidents which could have been used in the final set of SJT
stems. One example that corresponded to the interpersonal influence dimension involved persuading
others in order to achieve a personal objective. This scenario described an occasion whereby the

16
support from an important executive member was needed for a project and participants were asked
how they should go about convincing someone on the executive team to approve their project budget.
As part of the stem generation procedure, the cases were sorted by dimension so that each
incident was grouped according to the dimension it best represents. The compilation of the scenarios
created was edited for content and wording. While editing the cases and making final selections the
following questions were considered: “Could the scenario be applicable to multiple industries?”,
“Does the situation match a dilemma that a manager could face?” and “Could there be multiple
responses to the circumstance?”. At the end of the process the resulting scenarios were applicable to
various job categories, phrased so that there were several desirable responses and related to one of the
political skill dimensions.
The second component that makes up the test items of a SJT is the responses to the scenarios.
To generate these responses, the ten (10) experts who provided critical incidents along with five (5)
additional persons were asked to generate potential responses to the edited situations. Each
respondent was tasked with proposing an effective course of action, one that may be reasonable but
not optimal as well as a response that was ineffective given the circumstances. Similar to the stems,
the responses were edited and restructured by I/O psychologists so that they were comprehensible
responses to the corresponding scenario.
The final phase of the scenario and response development was to narrow down the test items
to determine the final set of dilemmas that was used in the study. This involved two parts. Firstly
three (3) I/O psychologists reviewed all the items (stems with responses) and coded them according
to the dimension definition that it best represents. Items where at least two persons agreed were kept
and those that were not matched were removed from the test. The resulting set of 40 items was pilot
tested by 12 professional who all had undergraduate degrees and were working at supervisory or above
job positions. Pilot participants also provided feedback on grammatical errors, typos and item clarity.

17
Items were eliminated if respondents only chose one option or if the feedback indicated that the item
was difficult to read or generally confusing. Based on these criteria, 32 items remained. The resulting
(32 item) SJT was administered during this study. The test had 8 different scenarios per dimension
each with 5 corresponding potential courses of action.
Scoring
As previously mentioned, the SME scoring procedure was chosen in part because of test
validation results using a similar construct, ‘leadership skills assessment’ (Bergman, Drasgow,
Donovan, Henning & Juraska, 2006). 20 SMEs were used to develop a scoring key with 5 per
dimension. Each SME independently read each stem and the corresponding responses. For each
response, they rated how effective it appeared in relation to the corresponding dimension definition
using a 1 – 7 scale. The average score for each item response was calculated, and this was used to
score the participants’ selection. The instruction to the test taker was to select the most appropriate
response to the scenario presented. The chosen response was awarded the SME mean score for that
response. A total score was calculated for each of the four categories by summing the candidate’s
selections chosen for the respective stems for that dimension, as shown in the following example.
Example:
Stem: You have been assigned a major account but cannot manage it on your own. It will be
easier if you receive assistance from one your colleagues. What should you do?
a. Think about it some more and decide that you can handle it on your own
b. Promise your colleague dinner if he/she helps with the account
c. Offer to help your colleague with his/her work if they can help you with yours
d. Tell your supervisor that you need assistance from one of your colleagues
Expert Ratings: a = 1 b = 3 c = 4
d = 2

18
Test Taker selection = b Test Taker score for this item = 3
The expert ratings in this example are hypothetical and used solely to illustrate the process of scoring
the response.
POLITICAL SKILL STRUCTURED INTERVIEW
Similar to the SJT, the development of an interview has a few factors that need to be
considered. The first is the degree of the interview structure. Interviews can be unstructured whereby
interviewers are allowed to ask any question they deem necessary or structured where interviewers are
given specific questions to ask each candidate (Cascio & Aguinis, 2008). For this study a complete
standardization of the questions that interviewers can ask was used. This technique permits the
interviewer to collect the same information about each interviewee (Campion, Palmer & Campion,
1998) therefore allowed for better comparison between responses provided by participants in this
study. Also according to Huffcutt et al. (2001), structured interviews have higher validity because they
focus more on constructs that are related to performance.
The next feature to consider is the type of questions that are asked. Questions can be
experiential whereby candidates are asked about past work or life experiences and are phrased “Can
you tell about a time when…?” (Janz, 1982). They can also be situational questions such that
participants are given a particular job relevant situation and are asked, “What will you do if…?”
(Latham, Saari, Pursell & Campion, 1980). The situational type was used as this allowed all study
participants the ability to answer questions whether or not they have years of work experience. Also
a meta-analysis conducted by Taylor and Small (2002) found that inter-rater reliability was not
significantly different for the question types nor were there differential validity based on job
complexity. Finally, the situational type of question matched the other predictor measures, which
allowed for better comparisons of responses across test types.

19
A main goal of the study was to compare measures of political skill that might be used in
personnel selection. Therefore in conjunction with using situational type questions, interview items
were also chosen to be behavioral. Salgado and Moscoso (2002) defined behavioral questions as
interview questions that are geared towards job knowledge and behavior descriptions. In their article
they further described behavioral interview question content areas as mainly descriptions of experience
and activity and questions focused on past behavior or future behavior. They were able to show that
behavioral items were better for evaluating situational judgment and social skills which makes it a more
appropriate format for this study.
By taking into consideration all the factors mentioned above, a sample of eight (8) SJT stems
were selected as the interview questions followed by “What would you do?”. This is because these
dilemmas allowed for standardized questions that are both situational and behavioral in content. In
addition to these eight questions, participants were also asked to compare themselves to their
colleagues in each of the political skill dimensions. They were given the opportunity to indicate
whether they thought they were above average, average or below average with respect to the different
dimensions in relation to other workers. The final question asked of interviewees was to rank each of
the dimensions where the top position indicates the term they were best at demonstrating.
Example of Interview Question:
You are at the grocery store and see your neighbor chatting with the President of “Sunbloom
Distributors,” a company that your firm has been trying to work with for a long time. What would
you do?
Example of Ranking Question:
In terms of developing a significant social group, negotiating and conflict management skills, how
would you rate yourself in relation to your colleagues?
Top 5% = Outstanding

20
Top 15% = Good
Top 1/3 = Above Average
Middle 1/3 = Average
Bottom 1/3 = Below Average
Bottom 15% = Poor
Bottom 5% = Very Poor
One trained interviewer conducted all the interviews and did not probe any of the participants
in order to maintain consistency with each person. For twenty (20) participants a second expert
provided scores for the interview responses and this was used to measure inter-rater reliability and to
ensure that the scoring was accurate. The interviewer took detailed notes during the interview sessions
and used the scores provided by experts for the SJT as the standardized scoring for the responses.
For those responses that did not match any of the SJT options an anchored rating scale was used such
that the quality of the answer was defined. For example a score of 1 meant “Candidate did not respond
to the question” and a score of 7 indicates “Candidate provided a competent response to the question,
provided evidence and provided a similar response identified by experts as an effective course of
action”. In total the interview took approximately 30 minutes to administer.
SECTION 2: DEVELOPMENT OF A CRITERION MEASURE – OTHER RATING SCALE
The main purpose of this section was to determine the best method for assessing political skill
for personnel selection. The previous section identified 3 methods that were used in a typical selection
process. The next step was to determine the criterion that was used to compare these measures to
each other. Political skill has been linked to different variables such as job performance (Jawahar,
Meurs, Ferris & Hochwarter, 2008) and leadership effectiveness (Douglas & Ammeter, 2004). In
order to determine the validity of the different predictor measures being studied it was decided to use
a criterion that best matched the predictor. When comparing the validity of various measures using

21
measures of the same construct for the predictor and the criteria yields the best validity (Lievens,
Buyse, & Sackett, 2005). Based on this concept, coworker ratings of the candidates’ political skill were
used as the criterion.
The outcome rating scale followed a performance appraisal format, such that the two part
process of observation and judgment (Thorton & Zorich, 1980) was used. Observation gathers the
information required to make adequate evaluations of the person’s behavior. Since Mintzberg (1983)
described political skill as utilizing human resources to influence change then it makes sense for the
criterion to be others’ evaluation of someone’s ability to behave in a political manner.
The source of the ratings was the first factor considered in the design of the others’
ratings of political skill. Immediate supervisors are typically responsible for evaluating employee
behavior and job performance (Cascio & Aguinis, 2008) because they understand the full scope of
work that is required of employees and therefore will have a better perspective on the effectiveness of
the participants’ behavior on the job. However, in many jobs such as teaching, self-managed work
teams, and external sales, immediate supervisors may not have many opportunities to observe a
worker’s behavior (Becker & Klimoski, 1989). Therefore another source was considered for this
study, peer assessments. In Harris & Schaubroeck (1988) meta-analysis of self-supervisor, self-peer,
and peer-supervisor ratings, they cited that work colleagues can be used to provide additional
information about a worker’s behavior because they have more contact with their coworkers resulting
in more observation time. Peers may also have a different perspective on the person’s actions as well
as a qualitatively different sample of behavioral observations. Therefore, in this section two co-
workers were asked to provide ratings on how politically skilled they thought their counterparts were.
Subordinate ratings can also assist in making evaluations of an employee’s performance but
not all participants in this study had subordinates (they may not have been in supervisory positions)
and therefore it was not possible to collect that kind of data during this study.

22
Subordinate ratings can also assist in making evaluations of an employee’s performance, but because
not all participants in this study had subordinates (some participants were not in supervisory
positions). Lack of subordinate would have created a missing data problem; sample size is an
important characteristic in selection validation studies where effect sizes are typically small. Therefore,
it was decided not to collect data from subordinates during this study.
The second step was to select the type of evaluative measure that was best suited for
this study. Performance measures fall into two major categories - tangible measures and subjective
measures (Cascio & Aguinis, 2008). Tangible measures include variables such as dollar value of sales
or number of errors; for the purposes of this study; there were no tangible measures that could
reasonably be used across jobs. Therefore political skill was measured subjectively. Within the
category of subjective measures there are the subgroups relative and absolute rating systems (Cascio
& Aguinis, 2008). For this study, a combination of both relative (norm-referenced) and absolute
(criterion referenced) judgments was used. Relative measures require that raters make comparisons
such that the performance of the subject employee is compared to others. Employees within an
organization are ranked in terms of their performance from first to last or placed within groups
according to where they stand in relation to others. Relative judgments were elicited from coworkers
for participants’ standings on each of the political skill dimensions (an example item is shown below).
It was also important to provide standard scenarios for the raters to evaluate political skills.
For these scenarios, coworkers were asked to make judgments about how well they thought the
participant would handle the problem embedded within the scenario. Such judgments are criterion-
referenced because they compare the person’s behavior to a standard of task performance rather than
to other people. The most popular rating scale is the graphic rating scale (Cascio & Aguinis, 2008),
which was chosen for use in this study. With a graphic rating scale raters are asked to determine if the
performance of workers are high/low or excellent/unsatisfactory. Finally, similar to the development

23
of the predictor measures, variations of the critical incidents developed for the SJT and interview were
used so that a standard set of situational referents was used by raters. As previously mentioned, using
the same construct for the predictor and the criterion typically yields the highest validity.
By combining the norm-referenced and criterion-referenced rating scales a unique rating
measure was developed that assessed the political skill of participants of this study. An example of an
interpersonal influence rating item is as follows:
Example:
Instructions:
For each of the following scenarios rate this person on how effective you think his/her response
would be. Consider their past behavior and the given definition to make your judgment.
Scenario:
1. Your company has gotten some bad press recently about your waste disposal practices and
the fact that they are harmful to the environment. An environment activist has called for a
boycott of all your company’s products. Your colleague has volunteered to take charge of the
campaign to convince the public to continue to support the company.
Rating Scale:
7= Very Effective
1 = Very Ineffective
7 6 5 4
3 2 1
Ranking Question:
24
2. In relation to his/her peers, rate this employee in terms of interpersonal influence using the
definition given above.
Top 5% = Outstanding
Top 15% = Good
Top 1/3 = Above Average
Middle 1/3 = Average
Bottom 1/3 = Below Average
Bottom 15% = Poor
Bottom 5% = Very Poor
Raters were instructed that their ratings were for developmental purposes and it would be most helpful
for the ratee if the rater were honest in their assessments.
SECTION 3: MEASUREMENT COMPARISON
The purpose of this section was to compare the measures of political skill for selection
purposes. To execute this objective, scores from the newly developed SJT, scores from the interview,
and scores from the PSI were all be correlated with one another to determine the amount of shared
variance for each pair and for all three together. Then each test was used as a predictor of the outcome
measure. To establish criterion-validity and to determine if one test adds incremental validity over
another, multiple regressions estimated the overall variance accounted for in the criterion and unique
contribution for each of the predictors as well as for specific combinations.
PARTICIPANTS
One hundred and twenty five (125) persons were interviewed as part of this study and
one hundred (100) completed all the instruments. Participants for this study were working students
from a variety of programs from a graduate business school located in Trinidad and Tobago. These
included MBA students as well as those studying specialized areas such as human resource

25
management, marketing, finance and event planning. Some of the business programs at this school
accept students that are in the category “mature entry”. This means that though they may not have
an undergraduate degree they have extensive work experience (over 10 years at a supervisory or above
job level) in conjunction with relative professional certificates. In this study eighty-five percent (85%)
had a bachelor’s degree or higher level of education. The majority of participants had more than 10
years working experience and the typical job level was that of middle management.
Table 1: Participants Demographic Information
Gender Male Female
N 25 77
Age
(years)
18 - 24 25 - 34 35 - 44 45 - 54 55 - 64
N 4 46 29 19 4
Job
Tenure
(years)
0 - 5 6 - 10 11 - 15 16 - 20 Over 20
N 20 20 24 12 26
Job Level Executive Management Administrative Consultant Other
N 5 52 21 22 2
Job Type n
Arts, Entertainment, or Recreation 4
Education 19
Finance and Insurance 19
Government and Public Administration 9
Health Care and Social Assistance 5
Information - Services and Data 6

26
Manufacturing 6
Oil/Gas/Energy Sector 5
Retail 4
Telecommunications 5
Utilities 4
Other (i.e. construction, agriculture, religious…) 16
n = 102
MEASURES:
Three assessments were used to measure the predictor construct political skill. The first was
the Political Skill Inventory (PSI), which was developed by Ferris, et al. (2005). This test consisted of
18 items posing questions on each of the four dimensions. The second instrument that was
administered to participants was the Political Skill SJT that was developed as part of section 1.
Participants were presented with 32 critical incidents and asked to select the best solution to the
problem presented. The final predictor measure was the Structured Interview. Participants were asked
to respond to 8 scenarios that were also used in the SJT as well as self-evaluations for each of the four
dimensions. The criterion measure was the Other Rating Scale. Peers of each participant were given
the same subset of incidents used in the interview and asked to rate the anticipated effectiveness of
the participant in handling each. They were also tasked with ranking the participants in comparison
to other co-workers on each of the four political skill dimensions.
PROCEDURE:
The execution of section 3 took place at a graduate business school located in Trinidad and
Tobago. Participants reviewed the informed consent document and were given a unique 5 digit
identification code (e.g., 51900). The participants were interviewed for approximately 30 minutes and
then all instructions were emailed with respect to the online instruments – the PSI, SJT and Co-worker

27
questionnaire. Participants were asked to email a link to the co-worker questionnaire along with their
5 digit code to two work peers. All data were stored by code number rather than by name, so that
anonymity was assured.
Participants took about two weeks to complete all the instruments. Follow up reminders
were emailed for those who were missing responses to different instruments. The data collection
period lasted two months.
As an incentive to participate, a feedback report was designed and only those participants who
completed all the instruments including two co-worker questionnaires were eligible to receive one.
Feedback reports were subsequently emailed to the eligible participants.

28
CHAPTER 3: RESULTS
SECTION 1: DEVELOPMENT OF PREDICTORS - SJT & STRUCTURED INTERVIEW
The first of three studies was to develop predictor instruments to measure the political skill of
potential job applicants for comparison to the PSI. The following results show the reliability analysis
of all the assessments that were used in the study. It is important to note that for all analyses ‘listwise
deletion’ was used to handle missing data, such that an entire record was deleted if a participant missed
a questioned. Therefore, in the calculations there were different sample sizes used depending on the
instruments or questions being analyzed.
The overall test reliability for the PSI measure was α = 0.94, (n = 98). The subscale alphas are
listed in the table below and the tabled values are all consistent with those reported in Ferris et al.
(2005).
Table 2: Cronbach Alpha for the entire Political Skill Inventory and the test Subscales
SA
5 items
NW
6 items
II
4 items
AS
3 items
Overall
18 items
Α 0.91 0.88 0.90 0.56 0.94
NB: SA – Social Astuteness; NW – Networking; II – Interpersonal Influence; AS – Apparent Sincerity
The scoring for both the SJT and interview were based on ratings provided by subject matter
experts who were tasked with providing scores based on the effectiveness of the responses as
compared to the hypothetical scenarios. There were five (5) expert raters who provided scores for
each political skill dimension. The inter-rater reliability for these persons ranged from r = 0.37 to r =

29
0.59. For each dimension, there were a different group of raters, such that no experts rated the entire
set of SJT items. Therefore, an overall reliability score was not calculated.
Table 3: Intra-class Correlation Coefficient of 5 Experts Ratings of the SJT
SA NW II AS
ICC 0.59 0.37 0.58 0.49
NB: SA – Social Astuteness; NW – Networking; II – Interpersonal Influence; AS – Apparent Sincerity All values were significant; p < 0.05
These Intra-Class Correlation (ICC) values are fairly low and there are two options to improve
the reliability of the ratings provided, the first being to increase the number of persons providing
expert ratings. To determine the number of experts that would be necessary to improve the ICC
ratings to at least 0.80 a Spearman Brown calculation was conducted. This calculation involves using
the current ICCs and determining the number of judges that would be needed to improve the
coefficients values. The results of this analysis are provided in Table 4.
Table 4: Spearman Brown Number of Judges Analysis for ICC (r = 0.80)
SA NW II AS
No. of Judges Needed 15 30 15 20
NB: SA – Social Astuteness; NW – Networking; II – Interpersonal Influence; AS – Apparent Sincerity
Based on the large number of judges that would be needed to improve the reliability
coefficients, the decision was made to choose option 2, which is to remove extreme scores. Therefore
one (1) low extreme rating and one (1) high extreme were removed leaving three (3) middle values to
determine the score for a particular response. This improved the inter-rater reliability to r = 0.72 to r
= 0.80. It is important to note that the same two raters were not removed each time and that these
results are more a comparison of the three middle values rather than strictly comparing 3 distinct
raters.

30
Table 5: Intra-class Correlation Coefficient of 3 Experts Ratings of the SJT
SA NW II AS
ICC 0.80 0.72 0.79 0.76
NB: SA – Social Astuteness; NW – Networking; II – Interpersonal Influence; AS – Apparent Sincerity All values were significant; p < 0.05
An average score was computed using the middle values and this was used to score the
interview and SJT responses. The Cronbach alpha (α) was then calculated for the SJT, and the initial
coefficients ranged between α = 0.19 – 0.52 for the individual test sections and α = 0.19, (n = 101)
for the entire test. Based on this initial analysis certain items were removed due to poor relations with
others in the scale and a final set of twenty – three (23) items were selected from the original thirty-
two (32). It should be noted that items that were used for the interview and co-worker questionnaire
were not removed from the SJT; although removing them would have yielded higher internal
consistency values in a couple of cases.
Table 6: Cronbach Alpha for the 23 Item Situation Judgment Test and the Subscales
SA
6 items
NW
6 items
II
5 items
AS
6 items
Overall
23 items
α 0.33 0.56 0.37 0.27 0.24
NB: SA – Social Astuteness; NW – Networking; II – Interpersonal Influence; AS – Apparent Sincerity
These reliability values are below the typical alphas seen in SJTs. In a meta-analysis by
McDaniel et al. (2001) the average value from the studies they used was α = 0.60. Some of the studies
in Mc Daniel’s analyses had reliability results as low as 0.43 but not as small as the values found in this
study. The lowest value was the overall scale reliability and this could be accounted for by the poor
subscale correlations. These coefficients can be seen in Table 11.
31
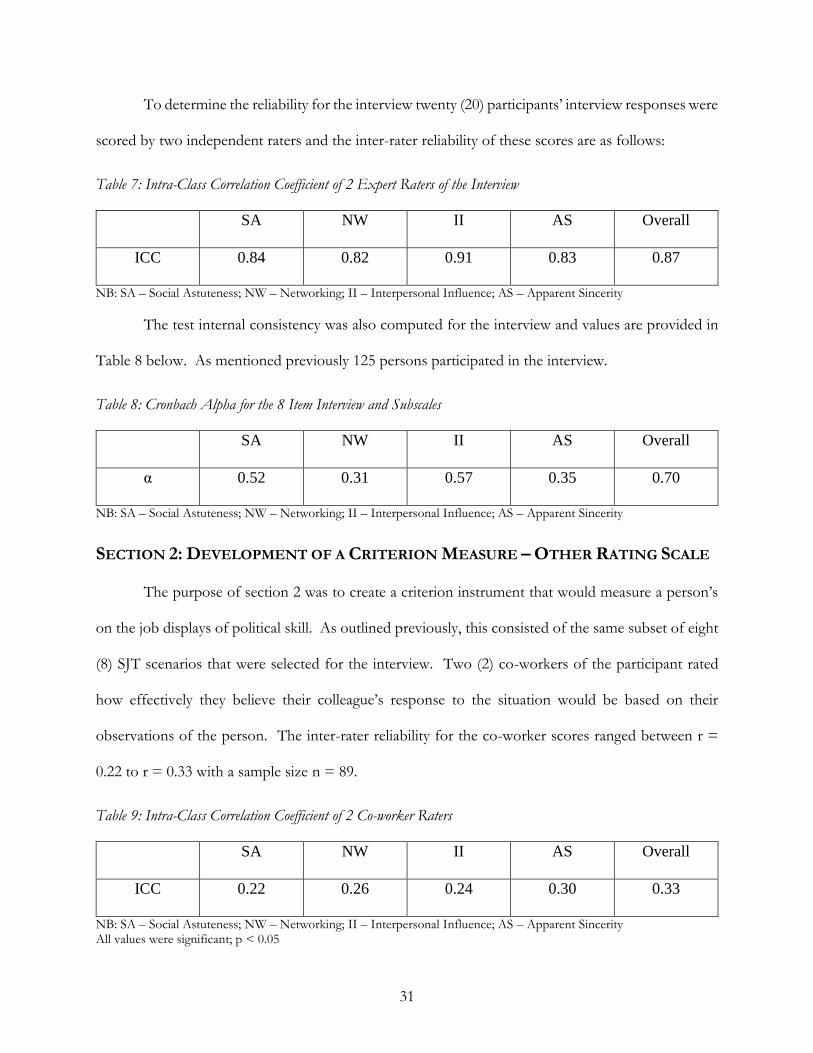
To determine the reliability for the interview twenty (20) participants’ interview responses were
scored by two independent raters and the inter-rater reliability of these scores are as follows:
Table 7: Intra-Class Correlation Coefficient of 2 Expert Raters of the Interview
SA NW II AS Overall
ICC 0.84 0.82 0.91 0.83 0.87
NB: SA – Social Astuteness; NW – Networking; II – Interpersonal Influence; AS – Apparent Sincerity
The test internal consistency was also computed for the interview and values are provided in
Table 8 below. As mentioned previously 125 persons participated in the interview.
Table 8: Cronbach Alpha for the 8 Item Interview and Subscales
SA NW II AS Overall
α 0.52 0.31 0.57 0.35 0.70
NB: SA – Social Astuteness; NW – Networking; II – Interpersonal Influence; AS – Apparent Sincerity
SECTION 2: DEVELOPMENT OF A CRITERION MEASURE – OTHER RATING SCALE
The purpose of section 2 was to create a criterion instrument that would measure a person’s
on the job displays of political skill. As outlined previously, this consisted of the same subset of eight
(8) SJT scenarios that were selected for the interview. Two (2) co-workers of the participant rated
how effectively they believe their colleague’s response to the situation would be based on their
observations of the person. The inter-rater reliability for the co-worker scores ranged between r =
0.22 to r = 0.33 with a sample size n = 89.
Table 9: Intra-Class Correlation Coefficient of 2 Co-worker Raters
SA NW II AS Overall
ICC 0.22 0.26 0.24 0.30 0.33
NB: SA – Social Astuteness; NW – Networking; II – Interpersonal Influence; AS – Apparent Sincerity All values were significant; p < 0.05

32
Based on these low co-worker agreement scores only co-worker 1 scores were used in the final
measurement comparison correlations. This group was chosen due to its larger sample size (n = 107).
The alpha values for this scale are presented below in Table 10 and there was little change in the alpha
values using only the co-worker 1 group.
Table 10: Cronbach Alpha for the Co-worker Questionnaire and Subscales
SA
3 items
NW
3 items
II
3 items
AS
3 items
Overall
12 items
α (2 co-workers) 0.81 0.84 0.83 0.82 0.93
α (co-worker 1) 0.77 0.82 0.85 0.79 0.92
NB: SA – Social Astuteness; NW – Networking; II – Interpersonal Influence; AS – Apparent Sincerity
SECTION 3: MEASUREMENT COMPARISON
The third section was meant to compare the three predictor measures and to determine which
is most suitable for predicting political skill performance. The final instruments used in these
comparisons were the original 18 item PSI, the 3 middle value expert rated 23 item SJT, the Interview
using the scoring key of the 3 expert ratings of the SJT and the criterion measure consisting of the
scores provided by the co-worker 1 responses to the peer questionnaire.
The first hypothesis proposed was that all the predictor instruments would correlate with each
other. As can be seen in Table 11, the overall scale of the Interview significantly correlated with both
the PSI and the SJT. However, the PSI and SJT did not relate to each other. In terms of the individual
sections of the tests, there were only three significant relationships. The interview interpersonal
influence scale was significantly related to the corresponding questions in the PSI. Also, between the
interview and the SJT, networking items were significantly correlated as well as the apparent sincerity
questions.

33
Hypothesis 2 was to determine the relationship between the predictor instruments and the
scores provided by the participants’ work colleagues. The results of these analyses showed that only
the PSI had a significant relationship with the co-worker ratings.
The PSI was the only predictor to significantly relate to co-worker ratings. AS a result the
regression tests comparing the predictive ability of the three predictors were superfluous. However,
for completeness of the project, the results of the regressions are as follows: the PSI significantly
predicted co-worker 1 ratings; β = 0.14, t (99) = 2.45, p < 0.05. The PSI also explained a significant
proportion of variance in co-worker political skill evaluation scores, R2 = .07, F (1, 99) = 7.19, p <
0.05. The hierarchical regression analysis for Hypothesis 3 showed no significant added incremental
validity R2 = 0.001 for the SJT over the PSI and Interview. The same result occurred for the Interview
over the PSI which did not support Hypothesis 4.
SUPPLEMENTAL ANALYSES
Several supplemental analyses were computed in an attempt to better understand the reasons
for the lack of support for the hypotheses. The initial analyses used the first coworker only. To assess
whether the choice of coworker was influential, additional analyses were computed with the average
of both coworkers and just using the scores of the second coworker. The correlations changed but
little, and the results still did not support the hypotheses.
To assess whether the choice of SJT items was consequential, the original 32 item SJT scores
were computed, and scores were computed both with keys based on the average of just the middle
three judges and also with the average of all five judges. Again the hypotheses were not supported.
The full correlation matrices for these analyses can be found in the appendix A of this document.
The first adjustment tried was to use only the eight (8) items that were consistent for the SJT,
Interview and peer ratings. The results of this correlation are presented in Table 12. As can be seen

34
there were no significant relationships between the SJT and the Interview, PSI or with the Co-worker
responses.
In an attempt to address the issue with the rating key of the SJT and Interview these responses
were rescored by one I/O psychologist (the principle study investigator) and each of the above
analyses were computed again. The results of these correlations are shown in Table 13 and 14 and
there were no changes in the results.

35
Table 11: Correlation matrix with PSI, Interview, SJT 3 EXPERTS and Co-worker 1
M SD 1 2 3 4 5 6 7 8 9 10 11 12 13 14 15 16 17 18 19 20
1 PSA 25.62 5.81 1.00
2 PNW 27.94 6.69 0.74* 1.00
3 PII 20.67 4.62 0.71* 0.68* 1.00
4 PAS 16.96 2.74 0.68* 0.43* 0.58* 1.00
5 PTOT 91.19 17.25 0.92* 0.89* 0.86* 0.71* 1.00
6 SSA 29.23 2.83 0.08 0.08 0.12 -0.02 0.09 1.00
7 SNW 26.81 3.94 0.05 0.00 0.15 0.05 0.06 0.08 1.00
8 SII 25.29 2.64 -0.12 -0.09 -0.09 -0.09 -0.11 0.04 0.07 1.00
9 SAS 25.78 3.09 0.14 0.04 0.04 0.04 0.08 0.05 -0.11 -0.07 1.00
10 STOT 107.10 6.40 0.08 0.02 0.12 0.01 0.07 0.53* 0.63* 0.44* 0.41* 1.00
11 ISA 8.75 1.82 0.17 0.17 0.30* 0.22* 0.24* 0.05 0.11 0.06 -0.03 0.10 1.00
12 INW 9.08 1.89 0.14 0.16 0.21* 0.22* 0.20 0.09 0.29* 0.10 -0.06 0.23* 0.42* 1.00
13 III 9.14 1.91 0.19 0.17 0.32* 0.32* 0.26* 0.04 0.18 0.08 -0.12 0.10 0.38* 0.44* 1.00
14 IAS 8.34 1.59 0.07 0.02 0.13 0.10 0.08 -0.04 0.08 0.06 0.28* 0.19 0.17 0.15 0.25* 1.00
15 ITOT 35.32 5.02 0.21* 0.19 0.35* 0.32* 0.29* 0.05 0.24* 0.11 0.01 0.22* 0.72* 0.74* 0.76* 0.53* 1.00
16 CW1SA 16.08 2.56 0.20* 0.14 0.29* 0.05 0.21* 0.01 -0.03 0.12 0.12 0.09 0.04 -0.03 0.02 0.19 0.07 1.00
17 CW1NW 16.57 2.94 0.18 0.26* 0.24* -0.01 0.22* 0.01 -0.02 -0.15 0.13 -0.01 0.01 -0.02 -0.07 0.01 -0.03 0.69* 1.00
18 CW1IIT 16.49 2.80 0.28* 0.17 0.36* 0.19 0.29* -0.02 -0.02 0.04 0.13 0.05 0.24* 0.12 0.15 0.14 0.23* 0.76* 0.66* 1.00
19 CW1AS 16.72 2.95 0.18 0.04 0.26* 0.23* 0.18 -0.08 -0.06 -0.10 0.07 -0.08 0.09 -0.01 0.04 0.15 0.09 0.60* 0.50* 0.65* 1.00
20 CW1TOT 65.86 9.60 0.25* 0.18 0.34* 0.14 0.26* -0.03 -0.04 -0.03 0.13 0.01 0.11 0.02 0.04 0.14 0.10 0.88* 0.83* 0.90* 0.81* 1.00
All * values were significant at p < 0.05, n = 97

36
Table 12: Correlation matrix with PSI, Interview, 8 Consistent Items SJT, Co-worker 1
M SD 1 2 3 4 5 6 7 8 9 10 11 12 13 14 15 16 17 18 19 20
1 PSA 25.62 5.81 1.00
2 PNW 27.94 6.69 0.74* 1.00
3 PII 20.67 4.62 0.71* 0.68* 1.00
4 PAS 16.96 2.74 0.68* 0.43* 0.58* 1.00
5 PTOT 91.19 17.25 0.92* 0.89* 0.86* 0.71* 1.00
6 ISA 8.75 1.82 0.17 0.17 0.30* 0.22* 0.24* 1.00
7 INW 9.08 1.89 0.14 0.16 0.21* 0.22* 0.20 0.42* 1.00
8 III 9.14 1.91 0.19 0.17 0.32* 0.32* 0.26* 0.38* 0.44* 1.00
9 IAS 8.34 1.59 0.07 0.02 0.13 0.10 0.08 0.17 0.15 0.25* 1.00
10 ITOT 35.32 5.02 0.21* 0.19 0.35* 0.32* 0.29* 0.72* 0.74* 0.76* 0.53* 1.00
11 SSA56 9.04 1.45 0.11 0.11 0.14 0.11 0.13 -0.07 -0.03 -0.09 -0.23 -0.14 1.00
12 SNW27 9.44 2.51 0.01 -0.04 0.04 0.02 0.00 0.04 0.31* 0.09 0.02 0.17 0.12 1.00
13 SII36 10.66 1.54 -0.05 0.00 0.03 0.02 0.00 0.17 0.15 0.12 0.21* 0.23* -0.08 0.05 1.00
14 SAS17 8.03 2.13 0.06 0.10 0.09 0.01 0.08 -0.05 0.05 -0.02 0.35* 0.10 -0.14 0.00 0.03 1.00
15 STOT8 37.16 3.94 0.06 0.07 0.14 0.06 0.09 0.04 0.27* 0.06 0.19 0.20 0.34* 0.70* 0.41* 0.50* 1.00
16 CW1SA 10.43 1.87 0.17 0.15 0.29* 0.06 0.20* 0.05 -0.01 0.03 0.18 0.08 0.04 -0.02 0.11 0.10 0.10 1.00
17 CW1NW 10.87 2.23 0.16 0.23* 0.25* -0.02 0.21* 0.00 -0.03 -0.04 0.02 -0.02 0.08 -0.06 -0.08 0.09 0.01 0.69* 1.00
18 CW1II 10.78 2.04 0.26* 0.17 0.36* 0.18 0.27* 0.22* 0.12 0.14 0.09 0.21* 0.04 -0.03 0.04 0.06 0.04 0.76* 0.66* 1.00
19 CW1AS 42.99 7.24 0.22* 0.17 0.33* 0.13 0.25* 0.08 0.01 0.04 0.11 0.08 0.09 -0.04 -0.02 0.05 0.03 0.88* 0.84* 0.89* 1.00
20 CW1TOT 10.91 2.27 0.17 0.04 0.26* 0.21* 0.17 0.03 -0.04 0.01 0.11 0.04 0.12 -0.03 -0.09 -0.05 -0.04 0.63* 0.54* 0.67* 0.83* 1.00
All * values were significant at p < 0.05, n = 97

37
Table 13: Correlation matrix with PSI, Interview, SJT (Rescore), Co-worker 1
M SD 1 2 3 4 5 6 7 8 9 10 11 12 13 14 15 16 17 18 19 20
1 PSA 25.62 5.81 1.00
2 PNW 27.94 6.69 0.74* 1.00
3 PII 20.67 4.62 0.71* 0.68* 1.00
4 PAS 16.96 2.74 0.68* 0.43* 0.58* 1.00
5 PTOT 91.19 17.25 0.92* 0.89* 0.86* 0.71* 1.00
6 SSA 29.23 2.83 0.08 0.08 0.12 -0.02 0.09 1.00
7 SNW 26.81 3.94 0.05 0.00 0.15 0.05 0.06 0.08 1.00
8 SII 25.29 2.64 -0.12 -0.09 -0.09 -0.09 -0.11 0.04 0.07 1.00
9 SAS 25.78 3.09 0.14 0.04 0.04 0.04 0.08 0.05 -0.11 -0.07 1.00
10 STOT 107.10 6.40 0.08 0.02 0.12 0.01 0.07 0.53* 0.63* 0.44* 0.41* 1.00
11 ISA 8.75 1.82 0.17 0.17 0.30* 0.22* 0.24* 0.05 0.11 0.06 -0.03 0.10 1.00
12 INW 9.08 1.89 0.14 0.16 0.21* 0.22* 0.20 0.09 0.29* 0.10 -0.06 0.23* 0.42* 1.00
13 III 9.14 1.91 0.19 0.17 0.32* 0.32* 0.26* 0.04 0.18 0.08 -0.12 0.10 0.38* 0.44* 1.00
14 IAS 8.34 1.59 0.07 0.02 0.13 0.10 0.08 -0.04 0.08 0.06 0.28* 0.19 0.17 0.15 0.25* 1.00
15 ITOT 35.32 5.02 0.21* 0.19 0.35* 0.32* 0.29* 0.05 0.24* 0.11 0.01 0.22* 0.72* 0.74* 0.76* 0.53* 1.00
16 CW1SA 16.08 2.56 0.20* 0.14 0.29* 0.05 .210* 0.01 -0.03 0.12 0.12 0.09 0.04 -0.03 0.02 0.19 0.07 1.00
17 CW1NW 16.57 2.94 0.18 0.26* 0.24* -0.01 0.22* 0.01 -0.02 -0.15 0.13 -0.01 0.01 -0.02 -0.07 0.01 -0.03 0.69* 1.00
18 CW1II 16.49 2.80 0.28* 0.17 0.36* 0.19 0.29* -0.02 -0.02 0.04 0.13 0.05 0.24* 0.12 0.15 0.14 0.23* 0.76* 0.66* 1.00
19 CW1AS 16.72 2.95 0.18 0.04 0.26* 0.23* 0.18 -0.08 -0.06 -0.10 0.07 -0.08 0.09 -0.01 0.04 0.15 0.09 0.60* 0.50* 0.65* 1.00
20 CW1TOT 65.86 9.60 0.25* 0.18 0.34* 0.14 0.26* -0.03 -0.04 -0.03 0.13 0.01 0.11 0.02 0.04 0.14 0.10 0.88* 0.83* 0.90* 0.81* 1.00
All * values were significant at p < 0.05, n = 97
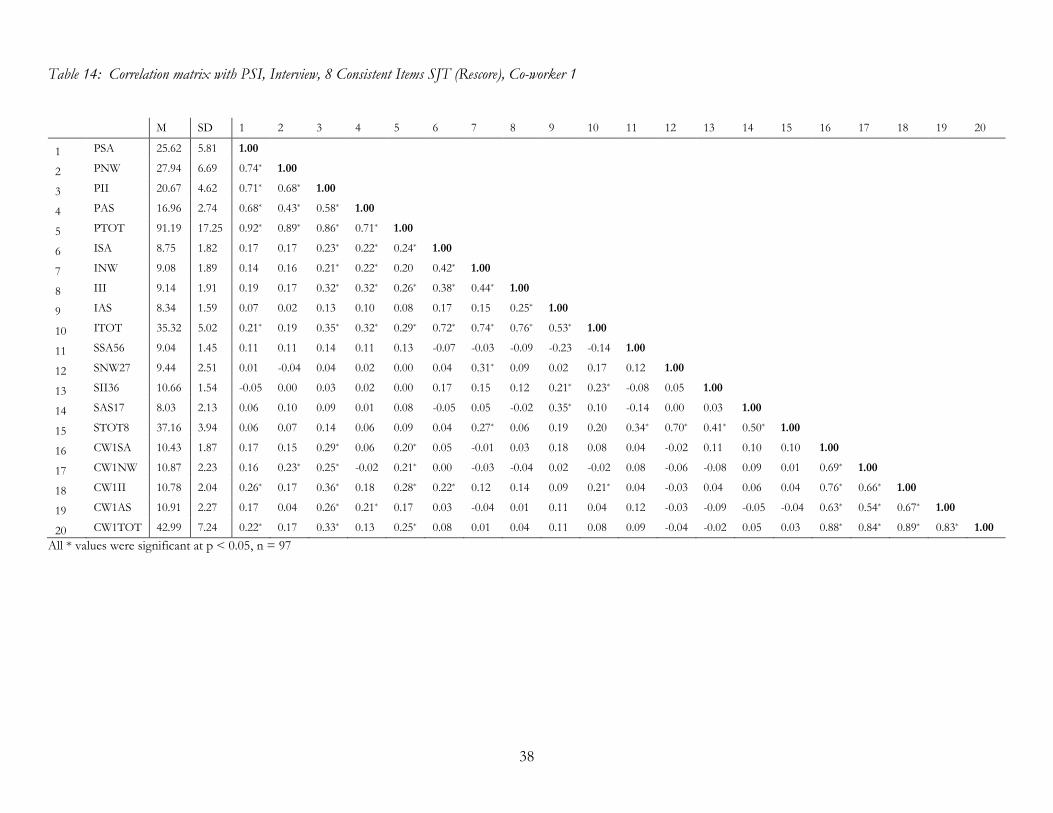
38
Table 14: Correlation matrix with PSI, Interview, 8 Consistent Items SJT (Rescore), Co-worker 1
M SD 1 2 3 4 5 6 7 8 9 10 11 12 13 14 15 16 17 18 19 20
1 PSA 25.62 5.81 1.00
2 PNW 27.94 6.69 0.74* 1.00
3 PII 20.67 4.62 0.71* 0.68* 1.00
4 PAS 16.96 2.74 0.68* 0.43* 0.58* 1.00
5 PTOT 91.19 17.25 0.92* 0.89* 0.86* 0.71* 1.00
6 ISA 8.75 1.82 0.17 0.17 0.23* 0.22* 0.24* 1.00
7 INW 9.08 1.89 0.14 0.16 0.21* 0.22* 0.20 0.42* 1.00
8 III 9.14 1.91 0.19 0.17 0.32* 0.32* 0.26* 0.38* 0.44* 1.00
9 IAS 8.34 1.59 0.07 0.02 0.13 0.10 0.08 0.17 0.15 0.25* 1.00
10 ITOT 35.32 5.02 0.21* 0.19 0.35* 0.32* 0.29* 0.72* 0.74* 0.76* 0.53* 1.00
11 SSA56 9.04 1.45 0.11 0.11 0.14 0.11 0.13 -0.07 -0.03 -0.09 -0.23 -0.14 1.00
12 SNW27 9.44 2.51 0.01 -0.04 0.04 0.02 0.00 0.04 0.31* 0.09 0.02 0.17 0.12 1.00
13 SII36 10.66 1.54 -0.05 0.00 0.03 0.02 0.00 0.17 0.15 0.12 0.21* 0.23* -0.08 0.05 1.00
14 SAS17 8.03 2.13 0.06 0.10 0.09 0.01 0.08 -0.05 0.05 -0.02 0.35* 0.10 -0.14 0.00 0.03 1.00
15 STOT8 37.16 3.94 0.06 0.07 0.14 0.06 0.09 0.04 0.27* 0.06 0.19 0.20 0.34* 0.70* 0.41* 0.50* 1.00
16 CW1SA 10.43 1.87 0.17 0.15 0.29* 0.06 0.20* 0.05 -0.01 0.03 0.18 0.08 0.04 -0.02 0.11 0.10 0.10 1.00
17 CW1NW 10.87 2.23 0.16 0.23* 0.25* -0.02 0.21* 0.00 -0.03 -0.04 0.02 -0.02 0.08 -0.06 -0.08 0.09 0.01 0.69* 1.00
18 CW1II 10.78 2.04 0.26* 0.17 0.36* 0.18 0.28* 0.22* 0.12 0.14 0.09 0.21* 0.04 -0.03 0.04 0.06 0.04 0.76* 0.66* 1.00
19 CW1AS 10.91 2.27 0.17 0.04 0.26* 0.21* 0.17 0.03 -0.04 0.01 0.11 0.04 0.12 -0.03 -0.09 -0.05 -0.04 0.63* 0.54* 0.67* 1.00
20 CW1TOT 42.99 7.24 0.22* 0.17 0.33* 0.13 0.25* 0.08 0.01 0.04 0.11 0.08 0.09 -0.04 -0.02 0.05 0.03 0.88* 0.84* 0.89* 0.83* 1.00
All * values were significant at p < 0.05, n = 97

39
CHAPTER IV - DISCUSSION
SUMMARY OF RESULTS
The main purpose of this study was to find a suitable instrument that measures political skill
and could be used as part of a selection assessment for managers. Typically a self-evaluation Likert
scale type inventory like the PSI is susceptible to response distortion. Since there are no other political
skill instruments currently existing, this study also incorporated the development of two possible
predictor instruments, an SJT and a structured interview. To determine the validity of these new
assessments and in order to compare the different types of measurement, a co-worker political
performance evaluation was also developed. The study was therefore divided into three sections. The
first was aimed to develop political skill predictor assessments that could be used for the selection of
managers as an alternative to the PSI. The second segment consisted of the development of the co-
worker questionnaire, which was designed in a performance appraisal format whereby work colleagues
provided ratings of the participants’ political behavior. Using these instruments, the third section
compared the different assessments to one another and to a criterion of political skill on the job.
The first hypothesis stated that each of the predictor tests would be correlated with the others.
The second hypothesis stated that each of the instruments would be correlated with co-worker ratings
of political skill. Thirdly it was proposed that the SJT would add incremental validity over the
interview and PSI and finally the fourth hypothesis stated that the interview would add incremental
validity over the PSI.
The results of the correlation analyses with respect to Hypothesis 1 and 2 showed that the
interview scores were significantly correlated with both the overall scores for the PSI and the overall

40
scores for the SJT. The SJT and the PSI were not significantly related. For the subscales there were
only three significant relationships found. In terms of relations with the criterion measure, only the
PSI had significant relationships with co-worker ratings overall and for the subscales. The SJT and
interview failed to correlate significantly with peer ratings for both the overall score and the subscales.
In reviewing the entire set of analyses there were several possible reasons that the
measurement comparison hypotheses were not all confirmed. One possible reason for this occurrence
was the low internal consistency coefficients for the SJT. Typically SJTs tend to fall below the
conventional rule of 0.70, but the values seen in this study were even smaller than SJT averages of
0.45 - 0.60 (McDaniel et al (2001). As the reliability of a scale is necessary to determine the validity of
it, this may be one way to account for the poor relationships between the SJT and PSI in addition to
co-worker ratings. Part of the problems with the SJT may have been the quality of the keys as
evidenced by the low reliability of the judges. Although the reliability appears to have improved by
eliminating extreme judgments, there were only three experts for response, and the item scores may
not have been very stable. Based on the Spearman Brown analyses it would have taken at least 15
experts to improve the ICC ratings and this would have proved challenging for this study.
The non-significant relationships between the SJT and two interview subscales Social
Astuteness and Interpersonal Influence could have occurred as a result of inconsistent responding by
the participants across the two instruments. It is possible that the responses provided in the interview
were not similar to the ones they selected in the SJT. Participants may have selected an alternative to
their interview answers when they had the opportunity to see other possible responses they did not
initially consider. To further explore this a correlation analysis was conducted only for the questions
that were consistent across the two instruments. The results showed that there were significant
relationships for Networking (r = 0.31; p = .002) and Apparent Sincerity (r = 0.35; p = 0.001).
However, the Interpersonal Influence and Social Astuteness relationships were not significant.

41
In order to look at the inconsistency of the responses, a frequency analysis was conducted to
compare the interview to the SJT for one of the common Social Astuteness items. Interview responses
were coded to match SJT options and of the ninety-six participants only forty-five had consistent
answers. The results of the analysis confirm that participants did select a different course of action
when answering the SJT compared to their response to the interview questions. See the full
comparison on Table 15.
Table 15: Frequency Analysis of Interview Question 1 and SJT item 6 Responses
Interview Responses
SJT Responses
a b c d e
a 0 5 0 0 0
b 0 37 4 0 0
c 0 33 8 0 0
d 0 0 0 0 0
e 0 5 2 0 0
Other 0 2 0 0 0
NB: Bold numbers are frequency counts for matched responses. N = 96 “Other” indicates responses that did not match any of the SJT options.
The fundamental difference between the instruments is that the PSI is a self-rating
instrument as opposed to the SJT and Interview whereby participants were responding to
hypothetical situations. The non-relationship found between the SJT and the co-worker ratings was
that while persons may have been able to identify what they should do or how they should act, they
may not have engaged in the actual behavior. Though the co-workers were presented with the same
situations, their task was not to choose which option they thought their colleague would select, but

42
rather to rate how effectively they thought their co-worker would respond given their observations
of the person’s behavior in the workplace. As mentioned in the introduction Threadway, et al.
(2005) explored the differences among political will, political skill and political behavior as they
researched the relationships among these three factors and emotional labor. They concluded that
political will or motivation to act in a political way is necessary for one to exhibit political skill. Based
on this study it is reasonable to assume that the SJT may be measuring a persons’ political skill such
that they can determine the appropriate action given a particular circumstance. However, it does not
necessarily tap into their will to actually perform these actions. Therefore those who may be
politically skilled may not always be the ones that are motivated to display these behaviors. This is
different from the PSI as it asks persons to select statements that best matches their behavior, which
could be taping into a persons’ political will to a greater degree.
The SJT is closely allied with the notion of tacit knowledge or practical intelligence
(Schmidt & Hunter, 1993; Sternberg, et al., 2000; Wagner & Sternberg, 1985). It aims to tap
knowledge acquired through experience that is often unwritten and difficult to articulate. It is
possible that developing generic SJTs may be difficult because the type of knowledge required may
be specific to a given domain such as a particular work context, including specific kinds of
organizations, jobs, conflicts, or kinds of negotiation. If so, then writing political skill SJT items
would prove difficult because experts from diverse backgrounds would correctly identify different
best responses.
An explanation for the non-significant relationship with the interview and the peer assessment
is that co-workers have a wider range of behavior to draw from in order to make an accurate
assessment of the participant’s ability to respond to the different situations. The interviews were 30
minutes long and an assessment during that time period would only give a rater limited range to make
their evaluation of the person’s political skill. Also the interviewer did not probe participants to

43
maintain consistency from one person to the next and this could also account for the limited
information to make judgments, especially for those persons who did not elaborate in their interview
answers.
IMPLICATIONS
As the hypotheses proposed were not supported and many of the correlations between the
different instrument scores were not significant there are no major implications other than further
confirmation that the PSI is a significant predictor of political skill. This study advanced the validity
of this instrument among a graduate level population who had more than 10 years’ work experience
and who were at higher job levels than the original validation study conducted with undergraduate
students. These findings would suggest that even at a management level the PSI is a good predictor
of political behavior.
LIMITATIONS
There were a few limitations noted in this study. As mentioned above, the poor internal
consistency of the SJT was a major problem for the validation of the instrument. However it should
be noted that for a couple of the subscales the removal of one the items would have yielded higher
alpha values. It may be valuable to possibly use a different subset of scenarios to compare SJT and
co-worker ratings.
Another limitation was the limited responses provided by participants in the interview. In
many cases persons did not elaborate in their answers to the questions, which gave the interviewer
less information to provide an accurate rating. In typical competency based interviews, some probing
is allowed in order for the assessor to better elicit a person’s competency level. Socially desirable
responding could have occurred with the interview versus the other instruments. As discovered by
the Richman, Kiesler, Weisband & Drasgow (1999) meta-analysis, response distortion is higher for

44
face to face interviews than computer based assessments. Finally, there was the inconsistency in
responses between the Interview and the SJT. The fact that persons did not select the same responses
could mean that they were not as politically skilled as the SJT scores would suggest, or that they were
not confident or consistent in their decision to act in a political way.
FUTURE STUDIES
One promising future study is to further explore measurement comparisons especially
for instruments being used under high stakes conditions. One of the limitations of the measurement
comparison component of this study was that the instruments being compared did not accurately
predict the criterion, coworkers’ rating of political skill. Therefore in the future it may be best to
simply use a construct that each of the methods on their own have already been shown to predict, for
example leadership. The outlined methodology may be the same. However, it is essential that
instruments are criterion valid, in order for comparisons to be made. Finding a suitable measurement
for administrative purposes is very important due to the limitations of self-rating scales in job selection
situations.
CONCLUSION
This study was designed to establish alternative instruments for measuring political skill and
to compare different assessment methodologies in order to determine the most appropriate one(s)
for selection purposes. Though the overall design did not yield favorable results, the goals
highlighted should still be explored as political skill continues to be a significant factor in job
performance, especially for managers. As the market becomes more competitive, the need to hire
and train politically skilled managers and company leaders increases. Therefore, it would be
important to assess job applicants the best way possible.

45
REFERENCES
Aheam, K.K., Ferris, G.R., Hochwarter, W.A., Douglas, C. & Ammeter, A.P. (2004). Leader Political
Skill and Team Performance. Journal of Management 30, 309-327.
Arthur, W., Woehr, D.J. & Graziano, W.G. (2001). Personality testing in employment settings:
Problems and issues in the application of typical selection practices. Personnel Review, 30, 657 –
676
Barrick, M. R. & Mount, M. K. (1996). Effects of impression management and self-deception on the
predictive validity of personality constructs. Journal of Applied Psychology, 81, 261-272.
Becker, T.E. & Klimoski, R.J. (1989). A field study of the relationship between organizational feedback
environment and performance. Personnel Psychology, 42, 343 – 358.
Bergman, M. E., Drasgow, F., Donovan, M. A., Henning, J. B. & Juraska, S. E. (2006). Scoring
situational judgment tests: Once you get the data, your troubles begin. International Journal of
Selection and Assessment, 14, 223 – 235
Brugnoli, G.A., Campion, J.E. & Basen, J.A. (1979). Racial bias in the use of work samples for personal
selection. Journal of Applied Psychology, 64, 119 – 123
Burnett, J.R., & Motowidlo, S.J. (1998). Relation between different sources of information in the
structured selection interview. Personnel Psychology, 51, 963–983.
Campion, M. A., Palmer, D. K., & Campion, J. E. (1998). Structuring employment interviews to
improve reliability, validity, and users' reactions. Current Directions in Psychological Science, 77-82.
Cascio, W.F. & Aguinis, H.A. (2008). Applied psychology in human resource management. Upper Saddle River,
NJ: Pearson Prentice Hall

46
Chan, D. & Schmitt, N. (2002). Situational judgment and job performance. Human Performance, 15, 233
– 254.
Donovan, J. J., Dwight, S. A., & Hurtz, G. M. (2003). An assessment of the prevalence, severity, and
verifiability of entry-level applicant faking using the randomized response technique. Human
Performance, 16(1), 81-106.
Douglas, C. & Ammeter, A.P. (2004). An examination of leader political skill and its effect on ratings
of leader effectiveness. The Leadership Quarterly, 15, 537–550.
Ferris, G.R., Treadway, D.C., Kolodinsky, R.W., Hochwarter, W.A., Kacmar, C.J. Douglas C. & Frink,
D.D. (2005). Development and validation of the political skill inventory. Journal of Management,
31, 126-152
Ferris, G.R., Treadway, D.C., Perrewé, P.L., Brouer, R.L. Douglas, C. & Lux, S. (2007). Political Skill
in Organizations. Journal of Management, 33, 290-320
Gauler, B.B., Rosenthal, D.B., Thorton, G.C. III & Bentson, C. (1987). Meta-analysis of assessment
center validity. Journal of Applied Psychology, 72, 493 – 511.
Harris, K. J., Kacmar, K., Zivnuska, S. & Shaw, J. D. (2007). The impact of political skill on impression
management effectiveness. Journal of Applied Psychology, 92(1), 278-285.
Harris, M. M., & Schaubroeck, J. (1988). A Meta-Analysis of Self-Supervisor, Self-Peer, and Peer-
Supervisor Ratings. Personnel Psychology, 41(1), 43-62.
Huffcutt, A.I., Conway, J.M., Roth, P.L & Stone, N.J. (2001). Identification and meta-analytic
assessment of psychological constructs measured in employment interviews. Journal of Applied
Psychology, 86, 897 – 913.
Jawahar, I. M., Meurs, J. A., Ferris, G. R. & Hochwarter, W. A. (2008). Self-efficacy and political skill
as comparative predictors of task and contextual performance: A two-study constructive
replication. Human Performance, 21, 138-157.

47
Jawahar, I. M., Stone, T. H. & Kisamore, J. L. (2007). Role conflict and burnout: The direct and
moderating effects of political skill and perceived organizational support on burnout
dimensions. International Journal of Stress Management, 14, 142-159.
Kane, J.S. & Lawler, E.E. III. (1978). Methods of peer assessment. Psychological Bulletin, 85, 555 – 586.
Lievens, F., Buyse, T., & Sackett, P. R. (2005). The operational validity of a video-based situational
judgment test for medical college admissions: Illustrating the importance of matching predictor
and criterion construct domains. Journal of Applied Psychology, 90, 442-452.
Lievens, F., Peeters, H. & Schollaert, E. (2008). Situational judgment tests: A review of recent research.
Personnel Review, 37, 426 – 441
Maccoby, M. (2000). Understanding the difference between management and leadership. Research
Technology Management; 43(1), 57 - 59.
Maurer, T., Solamon, J. & Troxtel, D. (1998). Relationship of coaching with performance in situational
employment interviews. Journal of Applied Psychology, 83, 128–136.
McDaniel, M.A., Morgeson, F.P., Finnegan, E.B., Campion, M.A. & Braverman E.P. (2001). Use of
situational judgment tests to predict job performance: A clarification of the literature. Journal of
Applied Psychology, 80, 730 -740
McDaniel, M.A. & Nguyen, N.T. (2001). Situational judgment tests: a review of practice and constructs
assessed, International Journal of Selection and Assessment, 9, 103-13
Mintzberg, H. 1983. Power in and around organizations. Englewood Cliffs, NJ: Prentice-Hall.
Motowidlo, S. J., Borman, W. C. & Schmit, M. J. (1997). A theory of individual differences in task and
contextual performance. Human Performance, 10, 71- 83.
Motowidlo, S.J., Dunnette, M.D. & Carter, G.W. (1990). An alternative selection procedure: The low-
fidelity simulation. Journal of Applied Psychology, 75, 640 – 647.

48
Nguyen, N. T. & McDaniel, M. A. (2003). Response instructions and racial differences in a situational
judgment test. Applied H.R.M. Research, 8, 33-44.
Perrew, P., P.I., Zellars, K.l, Ferris, G.R., Rossi, A. Kacmar, C.J. & Ralston, D.A. (2004). Neutralizing
job stressors: political skill as an antidote to the dysfunctional consequences of role conflict.
Academy of Management Journal, 47, 141-152.
Pulakos, E. D. & Schmitt, N. (1995). Experience-based and situational interview questions: studies of
validity. Personnel Psychology, 48, 289-308.
Rausch, E., Sherman, H. & Washbush, J.B. (2002). Defining and assessing competencies for
competency-based, outcome-focused management development. Journal of Management
Development, 21, 184 - 200
Reynolds, D. H., Sydell, E. J., Scott, D. R. & Winter, J. L. (2000, April). Factors affecting situational
judgment test characteristics. Paper presented at the annual meeting of the Society of Industrial
and Organizational Psychology, New Orleans, LA.
Richman, W. L., Kiesler, S., Weisband, S., & Drasgow, F. (1999). A meta-analytic study of social
desirability distortion in computer-administered questionnaires, traditional questionnaires, and
interviews. Journal of Applied Psychology, 84(5), 754-775.
Rosse, J. G., Stecher, M. D., Miller, J. L. & Levin, R. A. (1998). The impact of response distortion on
pre-employment personality testing and hiring decisions. Journal of Applied Psychology, 83, 634-
644.
Schmidt, F. L.; Hunter, J. E. (1993). Tacit knowledge, practical intelligence, general mental ability, and
job knowledge. Current Directions in Psychological Science, 2: 8–9.
Schmidt, F.L. & Hunter, J.E. (1998). The validity and utility of selection methods in personnel
psychology: practical and theoretical implications of 85 years of research findings. Psychological
Bulletin, 124, 262-274.

49
Sternberg, R. J., Forsythe, G. B., Hedlund, J., Horvath, J. A., Wagner, R. K., Williams, W. M., et al.
(2000). Practical intelligence in everyday life. Cambridge: Cambridge University Press.
Struefert, S., Pogash, R. & Piasecki, M. (1988). Simulation-based assessment of managerial
competence: Reliability and validity. Personnel Psychology, 41, 537 – 557.
Thornton, G. C. & Rupp, D. E. (2006). Assessment centers in human resource management: Strategies for
prediction, diagnosis, and development. Mahwah, NJ: Lawrence Erlbaum Associates.
Thornton, G.C. & Zorich, S. (1980). Training to improve observer accuracy. Journal of Applied
Psychology, 65, 351 – 354.
Todd, S. Y., Harris, K. J., Harris, R. B. & Wheeler, A. R. (2009). Career success implications of political
skill. The Journal of Social Psychology, 149, 179-204.
Treadway, D. C., Hochwarter, W. A., Ferris, G. R., Kacmar, C. J., Douglas, C., Ammeter, A. P. &
Buckley, M. (2004). Leader political skill and employee reactions. The Leadership Quarterly, 15,
493-513.
Treadway, D. C., Hochwarter, W. A., Kacmar, C. J. & Ferris, G. R. (2005). Political will, political skill,
and political behavior. Journal of Organizational Behavior, 26, 229-245.
Wagner, R. K., & Sternberg, R. J. (1985). Practical intelligence in real-world pursuits: The role of tacit
knowledge. Journal of Personality and Social Psychology, 49, 436-458
Weekley, J.A. & Jones, C. (1999). Further studies of situational tests. Personnel Psychology, 52, 679 – 700.
Weekley, J.A. & Jones, C. (1997). Video-based situational testing. Personnel Psychology, 50, 25 - 49.
Weekley, J. A. & Polyhart, R. E. (2006). An introduction to situational judgment testing, In J. A.
Weekley & R. E. Polyhart (Eds.), Situational judgment tests: Theory, measurement, and application (pp.
1-10). Mahwah, NJ: Lawrence Erlbaum Associates Publishers.

50
Woehr, D. J. & Arthur, W. r. (2003). The construct-related validity of assessment center ratings: A
review and meta-analysis of the role of methodological factors. Journal of Management, 29, 231-
258.

51
APPENDIX
Table A 1: Correlation matrix with PSI, Interview, SJT 32 Items 5 Experts and Co-worker Average
M SD 1 2 3 4 5 6 7 8 9 10 11 12 13 14 15 16 17 18 19 20
1 PTOT 91.19 17.25 1.00
2 PSA 25.62 5.81 0.92* 1.00
3 PNW 27.94 6.69 0.89* 0.74* 1.00
4 PII 20.67 4.62 0.86* 0.71* 0.68* 1.00
5 PAS 16.96 2.74 0.71* 0.68* 0.43* 0.58* 1.00
6 STOT 148.84 6.79 -0.03 -0.01 -0.05 0.02 -0.09 1.00
7 SSA 35.02 2.84 0.07 0.03 0.07 0.14 -0.02 0.55* 1.00
8 SNW 37.58 3.56 -0.03 -0.02 -0.09 0.03 -0.01 0.65* 0.23* 1.00
9 SII 40.68 3.35 -0.13 -0.13 -0.11 -0.09 -0.16 0.53* -0.04 0.06 1.00
10 SAS 35.55 2.57 0.06 0.13 0.05 -0.02 0.01 0.44* 0.08 0.01 0.06 1.00
11 ITOT 35.32 5.02 0.29* 0.21* 0.19 0.35* 0.32* 0.15 0.06 0.17 0.05 0.03 1.00
12 ISA 8.75 1.82 0.24* 0.17 0.17 0.30* 0.22* 0.03 -0.04 0.09 -0.03 0.04 0.72* 1.00
13 INW 9.08 1.89 0.20 0.14 0.16 0.21* 0.22* 0.15 0.10 0.24* 0.01 -0.05 0.74* 0.42* 1.00
14 III 9.14 1.91 0.26* 0.19 0.17 0.32* 0.32* 0.09 0.12 0.10 0.02 -0.05 0.76* 0.38* 0.44* 1.00
15 IAS 8.34 1.59 0.08 0.07 0.02 0.13 0.10 0.14 -0.03 0.01 0.16 0.17 0.53* 0.17 0.15 0.25* 1.00
16 CWTOT 66.03 8.55 0.23* 0.24* 0.12 0.30* 0.14 -0.05 -0.14 -0.02 -0.04 0.11 0.09 0.10 0.07 0.01 0.08 1.00
17 CWSA 16.17 2.21 0.17 0.19 0.07 0.24* 0.08 0.04 -0.10 0.01 0.09 0.10 0.06 0.04 0.05 -0.01 0.11 0.91* 1.00
18 CWNW 16.61 2.55 0.21* 0.18 0.20 0.25* 0.00 -0.04 -0.10 0.04 -0.11 0.09 0.00 0.03 0.06 -0.06 -0.03 0.83* 0.70* 1.00
19 CWII 16.53 2.34 0.22* 0.23* 0.10 0.30* 0.12 -0.01 -0.15 -0.01 0.00 0.14 0.14 0.17 0.09 0.05 0.09 0.90* 0.77* 0.68* 1.00
20 CWAS 16.72 2.72 0.21* 0.24* 0.04 0.28* 0.27* -0.14 -0.16 -0.09 -0.10 0.06 0.11 0.11 0.03 0.05 0.11 0.86* 0.73* 0.51* 0.72* 1.00
All * values were significant at p < 0.05, n = 97

52
Table A 2: Correlation matrix with PSI, Interview, SJT 32 Items 5 Experts and Co-worker 1
M SD 1 2 3 4 5 6 7 8 9 10 11 12 13 14 15 16 17 18 19 20
1 PTOT 91.19 17.25 1.00
2 PSA 25.62 5.81 0.92* 1.00
3 PNW 27.94 6.69 0.89* 0.74* 1.00
4 PII 20.67 4.62 0.86* 0.71* 0.68* 1.00
5 PAS 16.96 2.74 0.71* 0.68* 0.43* 0.58* 1.00
6 STOT 148.84 6.79 -0.03 -0.01 -0.05 0.02 -0.09 1.00
7 SSA 35.02 2.84 0.07 0.03 0.07 0.14 -0.02 0.55* 1.00
8 SNW 37.58 3.56 -0.03 -0.02 -0.09 0.03 -0.01 0.65* 0.23* 1.00
9 SII 40.68 3.35 -0.13 -0.13 -0.11 -0.09 -0.16 0.53* -0.04 0.06 1.00
10 SAS 35.55 2.57 0.06 0.13 0.05 -0.02 0.01 0.44* 0.08 0.01 0.06 1.00
11 ITOT 35.32 5.02 0.29* 0.21* 0.19 0.35* 0.32* 0.15 0.06 0.17 0.05 0.03 1.00
12 ISA 8.75 1.82 0.24* 0.17 0.17 0.30* 0.22* 0.03 -0.04 0.09 -0.03 0.04 0.72* 1.00
13 INW 9.08 1.89 0.20 0.14 0.16 0.21* 0.22* 0.15 0.10 0.24* 0.01 -0.05 0.74* 0.42* 1.00
14 III 9.14 1.91 0.26* 0.19 0.17 0.32* 0.32* 0.09 0.12 0.10 0.02 -0.05 0.76* 0.38* 0.44* 1.00
15 IAS 8.34 1.59 0.08 0.07 0.02 0.13 0.10 0.14 -0.03 0.01 0.16 0.17 0.53* 0.17 0.15 0.25* 1.00
16 CW1TOT 65.86 9.60 0.26* 0.25* 0.18 0.34* 0.14 -0.06 -0.08 -0.04 0.00 -0.01 0.10 0.11 0.02 0.04 0.14 1.00
17 CWSA 16.08 2.56 0.21* 0.20* 0.14 0.29* 0.05 0.02 -0.05 -0.04 0.11 0.00 0.07 0.04 -0.03 0.02 0.19 0.88* 1.00
18 CW1NW 16.57 2.94 0.22* 0.18 0.26* 0.24* -0.01 -0.06 -0.03 -0.01 -0.08 -0.01 -0.03 0.01 -0.02 -0.07 0.01 0.83* 0.69* 1.00
19 CW1II 16.49 2.80 0.29* 0.28* 0.17 0.36* 0.19 -0.03 -0.08 -0.04 0.06 0.00 0.23* 0.24* 0.12 0.15 0.14 0.90* 0.76* 0.66* 1.00
20 CW1AS 16.72 2.95 0.18 0.18 0.04 0.26* 0.23* -0.11 -0.11 -0.04 -0.08 -0.01 0.09 0.09 -0.01 0.04 0.15 0.81* 0.60* 0.50* 0.65* 1.00
All * values were significant at p < 0.05, n = 97

53
Table A 3: Correlation matrix with PSI, Interview, SJT 32 Items 5 Experts and Co-worker 2
M SD 1 2 3 4 5 6 7 8 9 10 11 12 13 14 15 16 17 18 19 20
1 PTOT 91.19 17.25 1.00
2 PSA 25.62 5.81 0.92* 1.00
3 PNW 27.94 6.69 0.89* 0.74* 1.00
4 PII 20.67 4.62 0.86* 0.71* 0.68* 1.00
5 PAS 16.96 2.74 0.71* 0.68* 0.43* 0.58* 1.00
6 STOT 153.94 7.97 0.02 0.03 -0.02 0.07 -0.01 1.00
7 SSA 38.51 3.65 0.10 0.07 0.09 0.12 0.08 0.55* 1.00
8 SNW 36.94 4.19 0.06 0.04 0.00 0.15 0.05 0.58* 0.06 1.00
9 SII 41.21 3.18 -0.18 -0.16 -0.17 -0.14 -0.14 0.56* 0.03 0.15 1.00
10 SAS 25.78 3.09 0.08 0.14 0.04 0.04 0.04 0.39* 0.07 -0.11 0.06 1.00
11 ITOT 35.32 5.02 0.29* 0.21* 0.19 0.35* 0.32* 0.19 0.06 0.27* 0.01 0.01 1.00
12 ISA 8.75 1.82 0.24* 0.17 0.17 0.30* 0.22* 0.07 0.01 0.17 -0.05 -0.03 0.72* 1.00
13 INW 9.08 1.89 0.20 0.14 0.16 0.21* 0.22* 0.19 0.10 0.32* -0.03 -0.06 0.74* 0.42* 1.00
14 III 9.14 1.91 0.26* 0.19 0.17 0.32* 0.32* 0.13 0.07 0.19 0.07 -0.12 0.76* 0.38* 0.44* 1.00
15 IAS 8.34 1.59 0.08 0.07 0.02 0.13 0.10 0.15 -0.04 0.05 0.03 0.28* 0.53* 0.17 0.15 0.25* 1.00
16 CW2TOT 66.03 8.55 0.23* 0.24* 0.12 0.30* 0.14 -0.02 -0.09 0.02 -0.05 0.12 0.09 0.10 0.07 0.01 0.08 1.00
17 CW2SA 16.17 2.21 0.17 0.19 0.07 0.24* 0.08 0.08 -0.05 0.06 0.04 0.16 0.06 0.04 0.05 -0.01 0.11 0.91* 1.00
18 CW2NW 16.61 2.55 0.21* 0.18 0.20 0.25* 0.00 -0.02 -0.05 0.05 -0.12 0.06 0.00 0.03 0.06 -0.06 -0.03 0.83* 0.67* 1.00
19 CW2I 16.53 2.34 0.22* 0.23* 0.10 0.30* 0.12 0.01 -0.11 0.03 0.00 0.11 0.14 0.17 0.09 0.05 0.09 0.90* 0.77* 0.68* 1.00
20 CW2AS 16.72 2.72 0.21* 0.24* 0.04 0.28* 0.27* -0.10 -0.11 -0.06 -0.08 0.11 0.11 0.11 0.03 0.05 0.11 0.86* 0.73* 0.51* 0.72* 1.00
All * values were significant at p < 0.05, n = 97

54
Table A 4: Correlation matrix with PSI, Interview, SJT 32 Items 3 Experts and Co-worker Average
M SD 1 2 3 4 5 6 7 8 9 10 11 12 13 14 15 16 17 18 19 20
1 PTOT 91.19 17.25 1.00
2 PSA 25.62 5.81 0.92* 1.00
3 PNW 27.94 6.69 0.89* 0.74* 1.00
4 PII 20.67 4.62 0.86* 0.71* 0.68* 1.00
5 PAS 16.96 2.74 0.71* 0.68* 0.43* 0.58* 1.00
6 STOT 153.94 7.97 0.02 0.03 -0.02 0.07 -0.01 1.00
7 SSA 38.51 3.65 0.10 0.07 0.09 0.12 0.08 0.55* 1.00
8 SNW 36.94 4.19 0.06 0.04 0.00 0.15 0.05 0.58* 0.06 1.00
9 SII 41.21 3.18 -0.18 -0.16 -0.17 -0.14 -0.14 0.56* 0.03 0.15 1.00
10 SAS 25.78 3.09 0.08 0.14 0.04 0.04 0.04 0.39* 0.07 -0.11 0.06 1.00
11 ITOT 35.32 5.02 0.29* 0.21* 0.19 0.35* 0.32* 0.19 0.06 0.27* 0.01 0.01 1.00
12 ISA 8.75 1.82 0.24* 0.17 0.17 0.30* 0.22* 0.07 0.01 0.17 -0.05 -0.03 0.72* 1.00
13 INW 9.08 1.89 0.20 0.14 0.16 0.21* 0.22* 0.19 0.10 0.32* -0.03 -0.06 0.74* 0.42* 1.00
14 III 9.14 1.91 0.26* 0.19 0.17 0.32* 0.32* 0.13 0.07 0.19 0.07 -0.12 0.76* 0.38* 0.44* 1.00
15 IAS 8.34 1.59 0.08 0.07 0.02 0.13 0.10 0.15 -0.04 0.05 0.03 0.28* 0.53* 0.17 0.15 0.25* 1.00
16 CWTOT 66.03 8.55 0.23* 0.24* 0.12 0.30* 0.14 -0.02 -0.09 0.02 -0.05 0.12 0.09 0.10 0.07 0.01 0.08 1.00
17 CWSA 16.17 2.21 0.17 0.19 0.07 0.24* 0.08 0.08 -0.05 0.06 0.04 0.16 0.06 0.04 0.05 -0.01 0.11 0.91* 1.00
18 CWNW 16.61 2.55 0.21* 0.18 0.20 0.25* 0.00 -0.02 -0.05 0.05 -0.12 0.06 0.00 0.03 0.06 -0.06
-0.03
0.83* 0.67* 1.00
19 CWII 16.53 2.34 0.22* 0.23* 0.10 0.30* 0.12 0.01 -0.11 0.03 0.00 0.11 0.14 0.17 0.09 0.05 0.09 0.90* 0.77* 0.68* 1.00
20 CWAS 16.72 2.72 0.21* 0.24* 0.04 0.28* 0.27* -0.10 -0.11 -0.06 -0.08 0.11 0.11 0.11 0.03 0.05 0.11 0.86* 0.73* 0.51* 0.72* 1.00
All * values were significant at p < 0.05, n = 97

55
Table A 5: Correlation matrix with PSI, Interview, SJT 32 Items 3 Experts and Co-worker 1
M SD 1 2 3 4 5 6 7 8 9 10 11 12 13 14 15 16 17 18 19 20
1 PTOT 91.19 17.25 1.00
2 PSA 25.62 5.81 0.92* 1.00
3 PNW 27.94 6.69 0.89* 0.74* 1.00
4 PII 20.67 4.62 0.86* 0.71* 0.68* 1.00
5 PAS 16.96 2.74 0.71* 0.68* 0.43* 0.58* 1.00
6 STOT 153.94 7.97 0.02 0.03 -0.02 0.07 -0.01 1.00
7 SSA 38.51 3.65 0.10 0.07 0.09 0.12 0.08 0.55* 1.00
8 SNW 36.94 4.19 0.06 0.04 0.00 0.15 0.05 0.58* 0.06 1.00
9 SII 41.21 3.18 -0.18 -0.16 -0.17 -0.14 -0.14 0.56* 0.03 0.15 1.00
10 SAS 25.78 3.09 0.08 0.14 0.04 0.04 0.04 0.39* 0.07 -0.11 0.06 1.00
11 ITOT 35.32 5.02 0.29* 0.21* 0.19 0.35* 0.32* 0.19 0.06 0.27* 0.01 0.01 1.00
12 ISA 8.75 1.82 0.24* 0.17 0.17 0.30* 0.22* 0.07 0.01 0.17 -0.05 -0.03 0.72* 1.00
13 INW 9.08 1.89 0.20 0.14 0.16 0.21* 0.22* 0.19 0.10 0.32* -0.03 -0.06 0.74* 0.42* 1.00
14 III 9.14 1.91 0.26* 0.19 0.17 0.32* 0.32* 0.13 0.07 0.19 0.07 -0.12 0.76* 0.38* 0.44* 1.00
15 IAS 8.34 1.59 0.08 0.07 0.02 0.13 0.10 0.15 -0.04 0.05 0.03 0.28* 0.53* 0.17 0.15 0.25* 1.00
16 CW1TOT 65.86 9.60 0.26* 0.25* 0.18 0.34* 0.14 -0.02 -0.04 -0.01 -0.05 0.13 0.10 0.11 0.02 0.04 0.14 1.00
17 CWSA 16.08 2.56 0.21* 0.20* 0.14 0.29* 0.05 0.03 -0.02 -0.01 0.04 0.12 0.07 0.04 -0.03 0.02 0.19 0.88* 1.00
18 CW1NW 16.57 2.94 0.22* 0.18 0.26* 0.24* -0.01 -0.04 0.00 -0.01 -0.14 0.13 -0.03 0.01 -0.02 -0.07 0.01 0.83* 0.69* 1.00
19 CW1II 16.49 2.80 0.29* 0.28* 0.17 0.36* 0.19 0.03 0.00 0.01 -0.01 0.13 0.23* 0.24* 0.12 0.15 0.14 0.90* 0.76* 0.66* 1.00
20 CW1AS 16.72 2.95 0.18 0.18 0.04 0.26* 0.23* -0.08 -0.10 -0.03 -0.05 0.07 0.09 0.09 -0.01 0.04 0.15 0.81* 0.60* 0.50* 0.65* 1.00
All * values were significant at p < 0.05, n = 97

56
Table A 6: Correlation matrix with PSI, Interview, SJT 32 Items 3 Experts and Co-worker 2
M SD 1 2 3 4 5 6 7 8 9 10 11 12 13 14 15 16 17 18 19 20
1 PTOT 91.88 16.71 1.00
2 PSA 25.84 5.60 0.91* 1.00
3 PNW 28.34 6.56 0.89* 0.72* 1.00
4 PII 20.66 4.61 0.86* 0.67* 0.69* 1.00
5 PAS 17.04 2.66 0.68* 0.66* 0.39* 0.53* 1.00
6 STOT 153.60 8.27 -0.02 -0.01 -0.04 0.03 -0.07 1.00
7 SSA 38.54 3.64 0.08 0.07 0.06 0.09 0.06 0.58* 1.00
8 SNW 36.72 4.24 0.01 -0.02 0.00 0.09 -0.04 0.57* 0.07 1.00
9 SII 41.04 3.22 -0.14 -0.12 -0.12 -0.11 -0.13 0.59* 0.08 0.16 1.00
10 SAS 25.78 3.05 0.05 0.10 0.01 0.04 0.02 0.40* 0.15 -0.14 0.11 1.00
11 ITOT 35.35 5.11 0.25* 0.15 0.17 0.33* 0.27* 0.18 0.10 0.25* 0.02 -0.05 1.00
12 ISA 8.76 1.80 0.26* 0.17 0.20 0.33* 0.24* 0.08 0.06 0.18 -0.05
-0.11 0.74* 1.00
13 INW 9.12 1.94 0.14 0.09 0.11 0.15 0.16 0.18 0.10 0.31* 0.00 -0.07 0.75* 0.47* 1.00
14 III 9.10 1.95 0.24* 0.15 0.17 0.29* 0.28* 0.10 0.10 0.15 0.06 -0.15 0.77* 0.43* 0.42* 1.00
15 IAS 8.37 1.59 0.04 0.01 -0.02 0.13 0.06 0.14 0.00 0.03 0.06 0.24* 0.52* 0.15 0.15 0.24* 1.00
16 CW2TOT 66.59 10.37 0.14 0.18 0.04 0.19 0.09 0.01 -0.08
0.02 -0.01
0.05 0.01 0.02 0.05 -0.03 -0.02
1.00
17 CW2SA 16.29 2.69 0.05 0.10 -0.03 0.08 0.06 0.10 -0.02
0.06 0.06 0.13 -0.01 0.00 0.05 -0.05 -0.02
0.88* 1.00
18 CW2NW 16.78 2.90 0.15 0.17 0.08 0.21 0.05 0.04 -0.08
0.12 0.01 -0.06 0.03 0.04 0.08 0.01 -0.05
0.84* 0.63* 1.00
19 CW2I 16.64 2.92 0.08 0.11 0.02 0.13 -0.03 -0.01 -0.14
0.01 0.00 0.05 -0.04 -0.03 0.01 -0.10 0.01 0.88* 0.69* 0.74* 1.00
20 CW2AS 16.88 3.48 0.19 0.22* 0.06 0.22* 0.20 -0.09 -0.05
-0.10 -0.08
0.05 0.04 0.05 0.04 0.02 -0.01
0.86* 0.76* 0.55* 0.62* 1.00
All * values were significant at p < 0.05, n = 97