assessing potential desertification environmental impact ... impact.pdf · (civit 2009). in order...
TRANSCRIPT

LAND USE IMPACTS
Assessing potential desertification environmental impactin life cycle assessmentPart 1: Methodological aspects
Montserrat Núñez & Bárbara Civit & Pere Muñoz &
Alejandro Pablo Arena & Joan Rieradevall &Assumpció Antón
Received: 1 October 2008 /Accepted: 27 July 2009 /Published online: 21 October 2009# Springer-Verlag 2009
AbstractBackground, aim and scope Life cycle assessment (LCA)enables the objective assessment of global environmentalburdens associated with the life cycle of a product or a
production system. One of the main weaknesses of LCA isthat, as yet, there is no scientific agreement on theassessment methods for land-use related impacts, whichresults in either the exclusion or the lack of assessment oflocal environmental impacts related to land use. The inclusionof the desertification impact in LCA studies of any humanactivity can be important in high-desertification risk regions.Main features This paper focuses on the development of amethodology for including the desertification environmen-tal impact derived from land use in LCA studies. A set ofvariables to be measured in the life cycle inventory (LCI),their characterisation factors (CFs) and an impact assess-ment method for the life cycle impact assessment (LCIA)phase are suggested. The CFs were acquired using ageographical information system (GIS).Results For the LCI stage it is necessary to registerinformation on: (1) the four biophysical variables of aridity,erosion, aquifer overexploitation and fire risk, with acreated scale of values; (2) the geographical location ofthe activity and (3) the spatial and temporal extension of theactivity. For the CFs, the four LCI biophysical variables in(1) were measured for the main terrestrial natural regions(ecoregions) by means of GIS.Discussion Using GIS, calculation of the CF for the aridityvariable shows that 38% of the world area, in eight out of15 existing ecoregions, is at risk of desertification. Themost affected is the tropical/subtropical desert. The LCIAmodel has been developed to identify scenarios withoutdesertification impact.Conclusions The developed method makes possible the in-clusion of the desertification impact derived from land use inLCA studies, using data generally available to LCA users.Recommendations and perspectives While this LCIA modelmay be a simplified approach, it can be calibrated and
Responsible editor: Llorenç Milà i Canals
Preamble In this series of two papers, methodological aspects relatedto the assessment of desertification environmental impact in lifecycle assessment (LCA) are discussed (Part 1), and the operationalmethod and characterisation factors suggested are put into practise in acase study of energy crops in different regions worldwide (Part 2).
M. Núñez (*) : P. MuñozIRTA, SosteniPrA,Ctra. de Cabrils, Km 2 Cabrils,08348 Barcelona, Spaine-mail: [email protected]
A. AntónSosteniPrA (UAB-IRTA),Ctra. de Cabrils, Km 2 Cabrils,08348 Barcelona, Spain
B. Civit :A. P. ArenaUniversidad Tecnológica Nacional—Facultad RegionalMendoza/CONICET,Rodríguez 273,5500 Mendoza, Argentina
J. RieradevallICTA, SosteniPrA. Institute of Environmental Scienceand Technology (ICTA), Universitat Autònoma de Barcelona (UAB),08193 Bellaterra,Barcelona, Spain
J. RieradevallChemical Engineering Department,Universitat Autònoma de Barcelona (UAB),08193 Bellaterra,Barcelona, Spain
Int J Life Cycle Assess (2010) 15:67–78DOI 10.1007/s11367-009-0126-0

improved for different case studies. The model proposed issuitable for assessing the desertification impact of any typeof human activity and may be complemented with specificactivity indicators, and although we have consideredbiophysical factors, the method can be extended to socio-economic vectors.
Keywords Aridity index . Characterisation factors .
Desertification . Geographical information system (GIS) .
Land use impacts . Life cycle assessment (LCA) . Life cycleimpact assessment (LCIA) . Life cycle inventory (LCI)
1 Introduction
Life cycle assessment methodology (LCA) was initiallydeveloped for environmental assessments of industrialsystems. It was later adapted to agricultural systems, whereits use has gradually spread. Traditionally, LCA studies takea general approach that is spatially and temporallyindependent of the environmental impacts derived from aproduct or production system (ISO-14040 2006; ISO-140442006). However, as agricultural systems are closely relatedto local and temporal aspects, especially water consumptionand land use, adjustments of the LCA methodology to takeland use impacts into consideration are the subject of study(Guinée et al. 2006) for both the life cycle inventory (LCI)and the life cycle impact assessment (LCIA).
Today, it is acknowledged that land use should beassessed by LCA, but there is still no consensus on theparameters to consider and the methodology to follow,mainly due to the lack of available data (Cowell andLindeijer 2000). Research has been carried out by a numberof authors to identify the possible problems and proposesolutions to address land use in LCA (Audsley 1997;Goedkoop et al. 2009; Koellner and Scholz 2007; Koellnerand Scholz 2008; Milà i Canals et al. 2007; WegenerSleeswijk et al. 1996; Weidema and Meeusen 2000).
Apart from the area of land, land use quality and soildisturbance by the activity being developed have to beconsidered (Guinée et al. 2001; Mattsson et al. 2000; Milà iCanals et al. 2007).
Due to the complexity of the different factors affecting landuse quality, most proposals have suggested distinguishingbetween different ecosystems (Heijungs et al. 1992; Steen andRyding 1993) and using multiple indicators (Blonk et al.1997; Cowell and Clift 2000; Mattsson et al. 2000).
1.1 Desertification as a life cycle assessment land useimpact category
To date, no attempts to include desertification impact in LCAstudies have been published, even though this is one of the
main problems for sustainability in arid, semi-arid and drysub-humid areas, especially in developing countries. TheUnited Nations Convention to Combat Desertification(UNCCD) states that arid, semi-arid and dry sub-humid areasinclude areas other than polar and sub-polar regions, in whichthe ratio of annual precipitation to potential evapotranspira-tion lies between 0.05 and 0.65 (United Nations 1994).
Irreversible soil degradation due to desertification is aconcern in arid areas worldwide, as such, it is important toinclude desertification impact in LCA studies in these areas(Civit 2009). In order to assess such land use impact, it isfirst necessary to define the variables and to gather qualityinformation about them in the LCI. Other elementary flowsrequired in the LCI are the spatial and temporal extent, andthe geographical location. Once the inventory data isgathered, the LCI results have to be characterised in theimpact assessment phase.
At present, the international community has not agreedon the methodology that should be followed to selectdesertification indicators. The main obstacle is that not allindicators are suitable at all scales. Two main factors forselecting the appropriate scale to measure an indicator arethe availability of data sets for the area over a sufficientlength of time, and the possibility of using remote-sensingtechnologies to obtain information (DESERTLINKS 2004).
Desertification indicators are arranged according to thethree dimensions of sustainable development: environmental(or biophysical), economic and social (MIMAM 2006). Mostof the studies on desertification assessment (e.g., DESER-TLINKS, DesertNet, DISMED, LADA and MEDALUS)have focused on the biophysical dimension of desertification,using several variables to measure it. Thus, desertificationassessment using a multi-indicator approach appears to be anappropriate method for evaluating this land use impact.
1.2 Life cycle assessment and geographical informationsystems
Nowadays, most desertification indicators included innational action programmes and in studies to combatdesertification are directly obtained from digitalized mapsor by using geographical information systems (GIS).
Despite the widespread employment of GIS, little use ismade of combinations of GIS data with LCIA to obtain landuse indicators. Examples of using GIS and LCA focus onhandling the information acquired with GIS methods toproduce site-specific information on the environmental effectsof a product or production system, which allows for moreaccurate LCA (Bengtsson et al. 1998; Jäppinen et al. 2008).
Given the benefits of GIS to provide land information,and the weakness of LCA, lacking impact categories relatedto land use, the integration of GIS with LCA is a good toolto define site-dependent characterisation factors (CFs). This
68 Int J Life Cycle Assess (2010) 15:67–78

improves LCA adaptability to land use impacts, not onlyfor desertification but also for other land use impacts suchas biodiversity, water consumption and erosion.
The aim of this research was to develop a methodologyfor including potential desertification from land use as anenvironmental impact in LCA studies. This study providesLCI data, CFs obtained by GIS analysis and a LCIA.
2 Life cycle inventory modelling
LCI considers the total consumptions and emissions of asystem and quantifies them according to the functional unitestablished. When considering land use, inputs are related toresource consumption as well as to the pressure put on them.
Inputs to the model proposed must reflect the causes ofland degradation, specifically those that affect arid lands, i.e.,the causes of desertification. The selection was carried out byoverlapping indicators at the local, national and global leveland those indicators applicable within the LCA methodolo-gy. Only physical factors, belonging to the state and pressureframework, were taken into account, due to the disagreementrelated to social and economic vectors. The four selectedphysical variables state the desertification impact due to thedifferent human activities that can occupy a portion of landduring a certain period of time. The selected variables were:aridity index, erosion, aquifer overexploitation and fire risk.After an extensive review of action programmes to combatdesertification from several countries and a number ofinternational studies focused on assessment of desertificationindicators, we concluded that these four variables adequatelyembrace the main factors that cause desertification. The fourvariables may be complemented with those specific fordifferent kinds of human activity (e.g., salinity for agricul-tural activities, soil crusting for building activities). For LCApractitioners wishing to include a specific variable, becauseit is a basic indicator in a certain region under study, the sameprocedure must be followed as with the other variables.
Table 1 shows the variables selected for inclusion in theLCI and their possible values. Each one must first bequantified then qualified following the scales of valuesproposed in Sections 2.1 to 2.4. The proposed values werebased on the reviewed desertification programmes anddesertification studies.
Once the individual value for each variable has beenassigned, the LCI value (LCIDesertification) can be calculatedas shown in Eq. 1:
If VAridity � 0; LCIDesertification ¼ 0
If VAridity > 0; LCIDesertification ¼ VAridity þ VErosion
þVAquifer overexploitation þ VFire risk
ð1Þ
where LCIDesertification is the desertification index for theLCI phase and VAridity, VErosion, VAquifer overexploitation andVFire risk are the individual values for each variable. Thesum of the individual values for the four variables was usedto express the desertification impact caused by an activity,following the United Nations definition of desertification(United Nations 1994), even though other mathematicalformulae may also be appropriate. As a general rule, thehigher the LCIDesertification value, the greater the desertifica-tion impact; however, Section 2.1 reports an exception tothis generalisation. This LCI framework allows for easycomparisons of the desertification impact of severalactivities under study.
As Table 1 shows, the range between the higher and thelower values of each variable differs. While VAquifer overexploitationand VFire risk range from 1 to 2, the range for VAridity is from 0 to3 and VErosion from 1 to 3. Only VAridity can take a value of 0. Adifferent weighting was assigned to the conditions consideredin each variable, depending on their importance in determiningdesertification. Both VAquifer overexploitation and VFire risk have alower weighting than VAridity and VErosion. The aridityvariable has a higher weighting as it is the criterion usedby the United Nations (1994) to identify those zoneswhere desertification could occur. The high weightingallocated to soil erosion is due to its major impact at aglobal level. In addition, both the aridity index and soilerosion are the two basic indicators in all national actionprogrammes to combat desertification (DESERTLINKS2004). Following the criterion established in the SpanishDesertification National Action Programme (DNAP-Spain), four desertification impact categories were distin-guished in agreement with the LCIDesertification value: low(LCIDesertification from 4 to 5), medium (LCIDesertificationfrom 5 to 6), high (LCIDesertification from 6 to 7) and veryhigh (LCIDesertification from 7 to 10).
Apart from the individual values for each variable(VAridity, VErosion, VAquifer overexploitation and VFire risk), toassess this impact of land use it is necessary to register thegeographical location, and spatial and temporal extensionof the activity in the LCI.
2.1 Aridity variable
The aridity factor was calculated considering the climaticsurface map given by the ratio P/ET0, where P is theprecipitation and ET0 the potential evapotranspiration. Gen-eral criteria to characterise each area are shown in Table 1.
To assign values to the aridity variable (VAridity), theregions described within the United Nations definition ofdesertification (United Nations 1994) were considered.According to the UNCCD, humid sub-humid and humidareas are not at risk of desertification. The numerical valuesassigned were: arid regions, 3; semi-arid regions, 2; dry
Int J Life Cycle Assess (2010) 15:67–78 69

sub-humid regions, 1 and humid sub-humid and humidregions, 0. These numerical values were adapted from theDNAP-Spain proposal. This action programme gives aridregions a value of 2, semi-arid regions a value of 1 and theremainder (dry sub-humid, humid sub-humid and humidregions) a value of 0. However, it seems more appropriateto increase the value of all climates with desertification risk,from dry sub-humid to arid regions, by one unit. Regardlessof the VErosion, VAquifer overexploitation and VFire risk values, thedesertification impact in a portion of land exists only ifVAridity is not equal to 0, as shown in Eq. 1.
2.2 Erosion variable
Erosion is one of the main reasons for soil degradation anddesertification. The LCI data for the erosion variable(VErosion) only requires an estimate of water erosion forthe study area. Wind erosion is not included in themeasurement because, by comparison, water erosion causesgreater soil losses on a world scale (Oldeman et al. 1990;Reich et al. 2001). Water erosion is a biophysical indicatorusually built within the national action programmes tocombat desertification. The universal soil loss equation(USLE; Wischmeier and Smith 1978) was used for theassessment, as it is the quantitative model of soil lossevaluation with the greatest agreement on an internationallevel and widely applied (Boellstorff and Benito 2005;Nelson 2002; Van der Knijff et al. 2000). The USLEpredicts the average annual water erosion rate in the long-
term on a field slope based on rainfall pattern, soil type,topography, crop system and management practises. In thisstudy, the five erosion intensity categories proposed byStone (2000) were reduced to three: category 1 (<12 tha–1
year–1) combines the <7.5 and 7.5–12.5 tha–1year–1
categories, category 2 (12–25 tha–1year–1) corresponds tothe 12.5–25.5 tha–1year–1 category and category 3 (>25 tha–1year–1) combines the 25.5–37 and >37 tha–1year–1
categories. These three categories were given the numericalvalues of 1, 2 and 3 respectively, following the DNAP-Spain criteria. The established thresholds fit well withinthose adopted by DNAP-Spain and are similar to thosesuggested by other authors: Basic et al. (2004) considers sixcategories, from <2 tha–1year–1 (insignificant erosion) to>40.01 tha–1year–1 (disastrous erosion) and Kirkby et al.(2004) distinguishes eight erosion limits, from ≤0.5 tha–1
year–1 to >50 tha–1year–1.
2.3 Aquifer overexploitation variable
Overexploitation may be defined as the situation in which,over a period of years, the average aquifer abstraction rateis greater than, or close to, the average recharge rate (RDPH1986). The LCI data estimate for the aquifer overexploita-tion variable (VAquifer overexploitation) needs to take intoaccount the hydrological balance of the aquifers located inthe area under study. The variable can take four differentvalues, between 1 and 2, depending on the degree ofaquifer exploitation, calculated as withdrawal divided by
Desertification variables
Estimation value Evaluation (LCI variable data, dimensionless)
Aridity variable (VAridity)a
Arid (0.05–0.20) 3
Semi-arid (0.20–0.50) 2
Dry sub-humid (0.50–0.65) 1
Humid sub-humid (0.65–0.75) 0
Humid (>0.75) 0
Erosion variable (VErosion)
>25 tha–1year–1 3
12–25 tha–1year–1 2
<12 tha–1year–1 1
Aquifer overexploitation variable (VAquifer overexploitation)
Wb>0.8Rc 2
0.8R≥W>0.4R 1.6
0.4R≥W>0.2R 1.3
W≤0.2R 1
Fire risk variable (VFire risk)
≥10% burned area in previous 10 years 2
<10% burned area in previous 10 years 1
Table 1 Proposal for theestimation and evaluation ofdesertification variables forthe inventory phase(LCIDesertification; dimensionless)
a Ratio between precipitation (P)and evapotranspiration (ET0;P/ET0), dimensionlessbWithdrawalc Recharge
70 Int J Life Cycle Assess (2010) 15:67–78

recharge (water exploitation ratio). The aquifer exploitationthresholds established in this study are based on thosesuggested by Alcamo et al. (2000). For this author, anexploitation ratio above 0.8 indicates very high stress(VAquifer overexploitation is 2); a ratio between 0.4 and 0.8represents high stress (VAquifer overexploitation is 1.6); aratio between 0.2 and 0.4 indicates medium stress(VAquifer overexploitation is 1.3); a ratio between 0.1 and 0.2 meanslow stress; and a ratio below 0.1 shows no stress(VAquifer overexploitation is 1 in these last two cases). Currently,there is no objective basis for selecting a threshold foroverexploitation ratio. The DNAP-Spain considers that aquiferoverexploitation only takes place when water withdrawal isequal or higher than 0.8 times the recharge. However, otherauthors consider this exploitation rate shows high-stressedwater resources. For this reason, the criterion of the DNAP-Spain was rejected in favour of more universal and conserva-tive criteria for water requirements of ecosystems.
2.4 Fire risk variable
Forest fires, recognised as a cause of desertification(MIMAM 2005), are one of the main factors that influencethe structure and function of terrestrial ecosystems all overthe world. The LCI data for the fire risk variable (VFire risk)was obtained by quantifying the accumulated percentage ofsurface affected by forest fires during the last 10 years inthe geographical area under study. If these data are notavailable, statistical data over a period of 10 years may beused. The selected geographical area must be equivalent toa regional administrative division (e.g., departamentos,comarcas in Spain and Argentina). The choice of the 10-year period for the fire statistics was based on themonitoring period of the Forest Resources Assessment2005 (1988–1992 and 1998–2002; FAO 2006). Fireintensity was classified into two groups, following theDNAP-Spain criterion: <10% of affected area and ≥10% ofaffected area. According to this criterion, when the areaaffected is <10%, the fire risk variable takes a value of 1, andwhen it is ≥10%, the variable takes a value of 2. The 10%threshold is also considered appropriate for regions outsideSpain because this value was the result of a consensusagreed in an action programme to combat desertification in aMediterranean region. Here, many studies on the consequen-ces of fires have been carried out, as a consequence of highfire frequency and its derived economic and social problems.
3 Development of the characterisation factorsfor natural areas
As CFs of the LCIA phase for the four variables estimatedin the LCI have been established for the large natural areas
of the world, soil quality was taken into account in land useassessment, following the proposals by other authors(Heijungs et al. 1992; Steen and Ryding 1993). CFs forlarge natural areas that incorporate biodiversity impacts inLCA have also been developed (Cowell and Lindeijer2000; Koellner 2000; Schmidt 2008), but no inclusion ofdesertification impacts has previously been published. Oneof the main contributions of this study is the establishmentof desertification impact CFs for the large natural areas ofland. The divisions between these areas are based onclimatic and vegetative cover factors, both aspects having amajor influence on soil desertification risk.
3.1 Choice of an ecosystem classification
The assessment of any impact category in LCA requiresCFs that are unique on a global scale. To satisfy thispremise, the classification of natural systems that is used inthe LCIA must comply with the following criteria: (1) itmust be applicable worldwide, (2) it needs to be acceptedby the scientific community and widely used, (3) the datamust be available worldwide and (4) a relationship betweeneach natural system category and its desertification riskmust be shown. Additionally, it is preferable that theclassification is available in digital format, to enable workwith GIS.
Many authors have developed classification systems ofnatural areas. For example, Begon et al. (1999) define 12biomes, Folch et al. (1984) distinguish 12 physiognomicdomains, Olson et al. (1983) identify 44 land ecosystemclasses and Bailey (1996; 1998) describes 15 ecosystemregions (or ecoregions). These authors all comply with thefour requirements mentioned above, but the hierarchicalclassification of Bailey’s ecoregions was used here as it isavailable in a GIS compatible format, while the other threehave poor quality digitalized public maps. The lack of geo-referenced maps makes it difficult to determine the CFs inthe analyses, and to combine the natural areas layer withother information layers (aridity index, erosion risk, aquiferoverexploitation and fire risk).
Based on macroclimate conditions and the prevailingplant formations determined by these conditions, Bailey(1996; 1998) subdivided the continents into ecoregionswith three levels of detail: domains (macroecosystems),divisions and climate subtypes, provinces or sites (micro-ecosystems; Bailey 2002). Table 3 in the Appendix listsclimate, vegetation and surface area associated with each ofthe four domains and 15 divisions.
3.2 Calculation of the characterisation factors
The CFs must be calculated for each LCI variable and foreach ecoregion. The assessment methodology and the
Int J Life Cycle Assess (2010) 15:67–78 71

possible values follow the same procedure used to obtainthe values of the variables in the LCI (see Sections 2.1 to2.4). The CFs were calculated using GIS. The configurationof each layer (one for each variable) was based on thecollection of maps and statistical data from severalinformation sources:
CFiAridity (characterisation factor for the aridity variablefor each ecoregion, i) was based on the global aridity indexmap of the Global Agro-Ecological Zoning 2000 from FAOand IIASA (Fischer et al. 2000).
CFiErosion was derived from the world map of the GlobalAssessment of Human-Induced Soil Degradation (GLASOD;ISRIC 2008). In GLASOD, a total of 12 soil degradation
types are recognised and mapped, of which two types arerelated to water erosion: loss of topsoil (Wt) and terraindefinition/mass movement (Wd). Both were accounted for ineach ecoregion in order to obtain the CFiErosion.
CFiAquifer overexploitation was determined using statistical dataon the recharge and withdrawal aquifer exploitation rates percountry published by EEA (1999), EMWIS (2007), FAO(2007a), UNEP (2002) and WRI (2007). These five groupscollected their data for years between 1960 and 2007.However, the years covered for statistical analysis arevariable and typically not available for a time series.
CFiFire risk was also derived from statistical data at thenational level published by FAO (2006; 2007b; 2008) and
Fig. 1 Diagram of the methodology applied for obtaining thecharacterisation factors of desertification risk for each ecoregion(CFi). a Three divisions of the polar domain (icecap, tundra and
subarctic) were not included as they are in a cold or antarctic climate(not arid, semi-arid or dry sub-humid areas; Fischer et al., 2000). iecoregion, CF characterisation factor
72 Int J Life Cycle Assess (2010) 15:67–78
UNEP (2002). The statistical period covered is from 1985to 2004. In countries where data on the surface affected byforest fires for a period of 10 years was not available, theaverage burned area per year was calculated from theavailable information.
Once the information on each of the four variables wascompiled, geo-referenced layers were made using GIS. Forthis, we used two software programmes: MiraMon® 6.1(2008) and ArcView 3.2®. The GIS allows the overlap ofBailey’s ecoregions layer with the four desertificationvariable layers, to obtain surface statistics of each variablecategory for each ecoregion.
CFiAridity and CFiAquifer overexploitation were calculated as theaverage value for each ecoregion. CFiErosion is the averagevalue of soil erosion risk in the ecoregion soils threatenedby water erosion, weighted by the ecoregion surface area.Finally, CFiFire risk was calculated by a similar method to thatapplied in the LCI phase, in which an ecoregion isconsidered to have a fire risk (CF is 2) if, during theprevious 10 years, a minimum of 10% of its surface areahad been affected by fires, with each country affectedhaving a ratio equal to or higher than 10% of area burned.If the burned area of the ecoregion is lower than 10%, itsCF is 1.
The CF for a given ecoregion can be calculated as thesum of the CFs for each of the four variables. Themethodology explained in this section is summarised inFig. 1. As shown in this figure, after carrying out the overlapbetween the Global Aridity Index map and the GlobalBailey’s Ecoregions, only eight out of 15 ecoregions havearid, semi-arid or dry sub-humid average aridity index. Theseecoregions are: marine, Mediterranean, prairie, savanna,temperate steppe, tropical/subtropical steppe, temperate desert
and tropical/subtropical desert, which represent 38% of thetotal land surface. According to the United Nations (1994)criterion, desertification risk is only possible in these eightecoregions. In the remaining seven ecoregions, CFiAridity isequal to 0 (see Section 2.1 and Table 1).
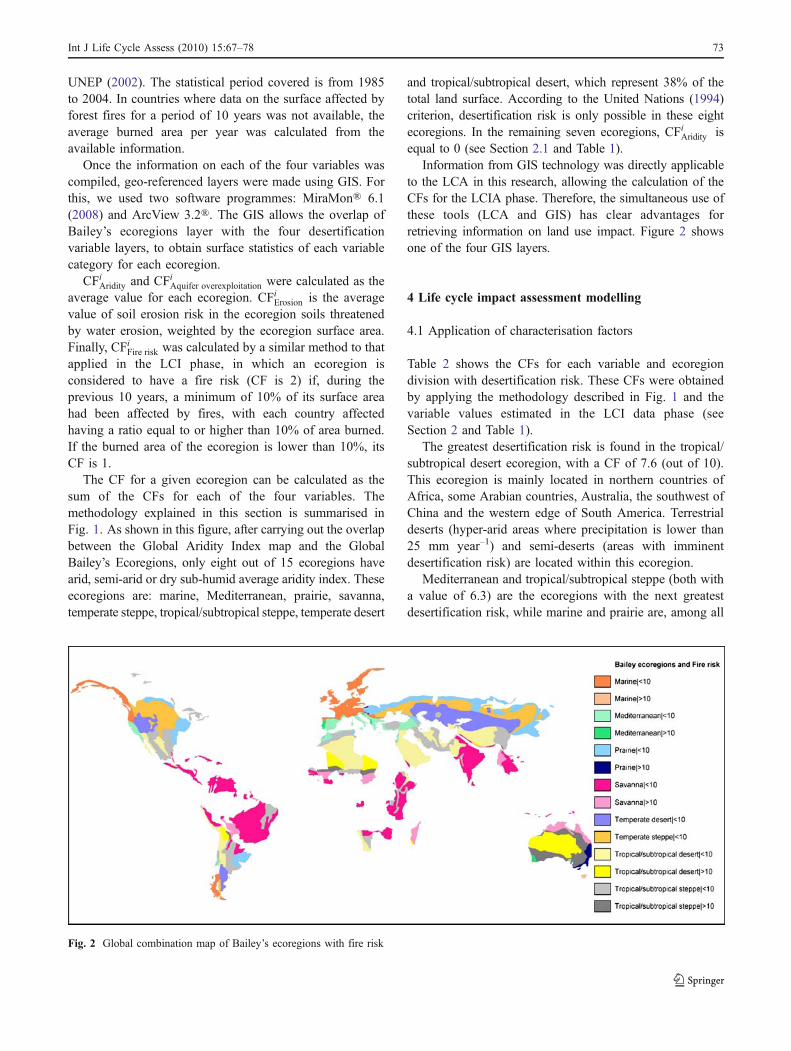
Information from GIS technology was directly applicableto the LCA in this research, allowing the calculation of theCFs for the LCIA phase. Therefore, the simultaneous use ofthese tools (LCA and GIS) has clear advantages forretrieving information on land use impact. Figure 2 showsone of the four GIS layers.
4 Life cycle impact assessment modelling
4.1 Application of characterisation factors
Table 2 shows the CFs for each variable and ecoregiondivision with desertification risk. These CFs were obtainedby applying the methodology described in Fig. 1 and thevariable values estimated in the LCI data phase (seeSection 2 and Table 1).
The greatest desertification risk is found in the tropical/subtropical desert ecoregion, with a CF of 7.6 (out of 10).This ecoregion is mainly located in northern countries ofAfrica, some Arabian countries, Australia, the southwest ofChina and the western edge of South America. Terrestrialdeserts (hyper-arid areas where precipitation is lower than25 mm year–1) and semi-deserts (areas with imminentdesertification risk) are located within this ecoregion.
Mediterranean and tropical/subtropical steppe (both witha value of 6.3) are the ecoregions with the next greatestdesertification risk, while marine and prairie are, among all
Fig. 2 Global combination map of Bailey’s ecoregions with fire risk
Int J Life Cycle Assess (2010) 15:67–78 73

the ecoregions with desertification risk, the least susceptible(CF of 4).
4.2 Life cycle impact assessment model
In this study, we also propose a desertification impactassessment model. Equation 2 shows the model proposedfor inclusion in LCA studies.
LCIADesertification ¼ LCIDesertification � CFi� �
� AreaLCI activityLog AreaEcoregion i
� t ð2Þ
where LCIADesertification is the desertification impact due tothe assessed activity, in km2
LCI activity×km–2
Ecoregion i
during the period of time (years) that the activity takesplace; LCIDesertification is the inventory data (dimensionless)of this activity; CFi is the characterisation factor of theecoregion where the evaluated activity takes place (dimen-sionless, see Table 2); AreaLCI_Activity is the spatialextension of the activity (in km2); Log AreaEcoregion_i isthe decimal logarithm of the ecoregion area where theactivity is located (in km2) and t is the temporal extensionof the activity (in years). High values of LCIADesertification
mean high soil desertification impact caused by thesituation under analysis.
It should be noted that, when the variable VAridity in theLCIDesertification is equal to 0 (humid climates, withoutdesertification risk), LCIADesertification is zero. In this casethe desertification impact of the activity should not beintegrated in LCA studies. This can be used to identify thosecases without desertification impact. The LCIADesertification
value is also zero when CFi or any other variable in Eq. 2 iszero. A value of zero for CFi means that the activity beingstudied is in an ecoregion with no desertification risk(icecap, tundra, subarctic, warm continental, hot continental,subtropical and rainforest).
The model suggested focuses on the desertification riskvalue of the ecoregions without comparing to a referenceecoregion (Blonk et al. 1997; Heijungs et al. 1992; Weidema etal. 1996). This approach works well, as there is no agreementabout which reference system to select or how to measure it.
The LCIA model selected was that which fit best the modelsused to apply in LCA of those tested. Previous LCIA modelstested were, for instance, the average LCIDesertification/CF
i
and the weighted average
Pn
i¼1
VLCI variable
Pn
i¼1
CFivariable
approaches. They
were not effective in cases of single land use (activities withthe same LCI) in different ecoregions. In both approachesthe greatest impact values were obtained in ecoregionswith lower CF.
Table 2 Characterisation factors of desertification risk for each ecoregion (dimensionless)
Marine Prairie Temperatesteppe
Temperatedesert
Savanna Mediterranean Tropical/subtropicalsteppe
Tropical/subtropical desert
CFAridity 1 1 2 2 1 1 2 3
CFErosion 1 1 1 1 2 2 1 2
CFAquifer overexploitation 1 1 1 1.3 1 1.3 1.3 1.6
CFFire risk 1 1 1 1 2 2 2 1
CFi 4.0 4.0 5.0 5.3 6.0 6.3 6.3 7.6
i ecoregion
tArea
Area]CFLCI[LCIA
iEcoregion
activityLCIiationDesertific ×××=
0,0E+00
2,0E-08
4,0E-08
6,0E-08
8,0E-08
1,0E-07
1,2E-07
1,4E-07
0 5 10 15 20 25 30
Ecoregion area (106km2)
LC
IA
Fig. 3 Relationship between the desertification impact (LCIA, in km2LCI activity×km
−2Ecoregion i×y) and the ecoregion area for the eight ecoregions
with desertification risk. Hypothetical case where LCIDesertification=6, AreaLCI activity=10,000 m2, t=1 year
74 Int J Life Cycle Assess (2010) 15:67–78

The area of the ecoregion (AreaEcoregion i) is expressed inEq. 2 by a logarithmic relationship with the resultingimpact. The aim was to represent the likelihood of an area–desertification relation, with smaller surface areas havingmore desertification risk than larger areas (Fig. 3). Loga-rithmic correlations between area–species interactions havebeen reported for several groups of organisms (theory ofinsularity), where the drop in the number of species is fasterin smaller areas (Begon et al. 1999). It could be argued thatthe potential impact does not follow an area–desertificationrelation in a logarithmic way. However, unlike the linearmodel, the model proposed shows the growing marginaleffects with successive surface area reductions.
5 Conclusions
In this research, an LCA methodology for assessing theenvironmental local impact of desertification were devel-oped and adapted. The approach adds an innovativecontribution, since previous LCA methodological studiesconsider water consumption, erosion and biodiversityimpacts but not the desertification impact.
Four biophysical variables belonging to the state andpressure frameworks were selected for the model: aridity,erosion, aquifer overexploitation and fire risk. The desert-ification impact evaluation of any human activity in a LCAshould include these common, basic four variables. TheLCIDesertification value of the activity being assessed isdetermined by the addition of the individual values givento each of the four variables, according to a scale of values.
Following methodologies proposed by other authors toinclude local biodiversity impacts in LCA, we established CFsof desertification impact for the large divisions of theterrestrial ecological regions (ecoregions). This study is thefirst we are aware of, at an international level, to includedesertification impact in LCA based on a classification ofnatural areas. GIS technology has facilitated the developmentof this study. The simultaneous use of LCA and GIS is a majoradvantage for gathering information that can be applied todecision-making in land management. The calculation of theCF for the aridity index shows that only eight out of 15
terrestrial ecoregions have desertification risk, as theirprevailing climate is arid, semi-arid or dry sub-humid. Theseeight ecoregions are: marine, prairie, Mediterranean, savanna,temperate steppe, temperate desert, tropical/subtropical steppeand tropical/subtropical desert, which represent 38% of theterrestrial surface. The greatest desertification risk is found inthe tropical/subtropical desert ecoregion and the lowest inmarine and prairie divisions.
All the information required for a desertification impactassessment in the LCA is generally available. This paperprovides CFs for including desertification impact in LCAstudies, and the variables suggested allow the comparisonof the benefits and threats posed by different humanactivities.
6 Recommendations and perspectives
Although the LCIA model developed as a product offactors may be a simplified approach, it can be calibratedand improved when applied to specific case studies.
The proposed LCI variables are appropriate for assessingthe desertification impact of any human activity (agricul-ture, industry, mining, etc.). The scheme proposed could becomplemented with specific LCI factors for differenthuman activities (e.g., salinity for agricultural activities,soil crusting for building activities).
Even though we have considered biophysical variables,the method could be extended to social and economicvectors. However, this is a long-term task due to itsmagnitude and difficulty.
Acknowledgements This study was funded by AECI (SpanishInternational Cooperation Agency), needs for complementary actions,official announcements for inter-university cooperation programmes andscientific research, and project reference number C/6501/06: develop-ment of impact indicators characteristic of arid zones for life cycleassessment: desertification, erosion and water consumption. Dr. JosepMas (Universitat de Girona) provided very useful information. MartaBorrós (Geographic Information System technician, at the Institute ofEnvironmental Science and Technology—Universitat Autònoma deBarcelona, ICTA-UAB) and Cecilia Rubio (Geographic InformationSystem technician, at the Laboratorio de Desertificación y OrdenamientoTerritorial—IADIZA–CONICET, Mendoza) provided GIS support.
Table 3 Climate, vegetation and surface area for each ecoregion division
Name of domain Name of division Equivalent Köppen-Trewarthaclimates
Zonal vegetation Surface area(106km2)
Polar (100) Ice cap (110) Polar climate: ice cap 15.40a
Tundra (120) Polar climate: tundra Ice and stony deserts: tundras 14.90
Subarctic (130) Boreal climate: subarctic Forest tundras and openwoodlands; taiga
16.80
Appendix
Int J Life Cycle Assess (2010) 15:67–78 75

References
Alcamo J, Henrich T, Rösch T (2000) World Water in 2025—Globalmodeling and scenario analysis for the World Commission onWater for the 21st Century. Kassel: Centre for EnvironmentalSystem Research, University of Kassel, http://www.usf.uni-kassel.de/usf/archiv/dokumente/kwws/kwws.2.pdf (last accesseddate August 8, 2008)
Audsley E (1997) Harmonisation of Environmental Life CycleAssessment. Final Report Concerted action AIR3-CT94-2028,European Commission DG VI Agriculture
Bailey RG (1996) Ecosystem geography. Springer, New YorkBailey RG (1998) Ecoregions: the ecosystem geography of the oceans
and continents. Springer, New YorkBailey RG (2002) Eco-region based design for sustainability. Springer,
New YorkBasic F, Kisic I, Mesic M, Nestroy O, Butorac A (2004) Tillage and
crop management effects on soil erosion in central Croatia. SoilTill Res 78(2):197–206
Begon M, Harper JL, Townsend CR (1999) Ecología: individuos,poblaciones y comunidades. Omega, 3rd. edition, Barcelona
Bengtsson M, Carlson R, Molander S, Steen B (1998) An approachfor handling geographical information in life cycle assessmentusing a relational database. J Hazard Mater 61(1–3):67–75
Blonk H, Lindeijer E, Broers J (1997) Towards a methodology fortaking physical degradation of ecosystems into account in LCA.Int J Life Cycle Assess 2(2):91–98
Boellstorff D, Benito G (2005) Impacts of set-aside policy on the riskof soil erosion in central Spain. Agr Ecosyst Environ 107(2–3):231–243
Civit B (2009) Sostenibilidad ambiental. Desarrollo de indicadorespara su aplicación en estudios de análisis de ciclo de vida en laregión árida del centro-oeste argentino. Ph. D. Thesis, Universi-dad Nacional de Cuyo, Mendoza
Cowell SJ, Clift R (2000) A methodology for assessing soil quantityand quality in life cycle assessment. J Clean Prod 8:321–331
Cowell SJ, Lindeijer E (2000) Impacts on ecosystems due to land use:biodiversity, life support, and soil quality in life Cycle Assess-ment. In: Weidema B, Meeusen M (eds) Agricultural data for lifecycle assessments. Agricultural Economics Research Institute,The Haugue, pp 80–87
DESERTLINKS (2004) Desertification Indicator System for Mediter-ranean Europe (DIS4ME). European Commission, ContractEVK2-CT-2001-00109, http://www.kcl.ac.uk/projects/desertlinks/(last accessed date August 5, 2008)
EEA (1999) Groundwater quality and quantity in Europe. Technicalreport no. 22, European Environment Agency, Copenhagen
EMWIS (2007) Mediterranean groundwater report. Technical reporton groundwater management in the Mediterranean and the WaterFramework Directive. Euro-Mediterranean Information Systemon know-how in the Water Sector, Mediterranean GroundwaterWorking Group (MED-EUWI WG on groundwater), http://circa.europa.eu/Public/irc/env/wfd/library?l=/framework_directive/groundwater_library/mediterranean_groundwate/_EN_1.0_&a=d(last accessed date May 20, 2008)
Table 3 (continued)
Name of domain Name of division Equivalent Köppen-Trewarthaclimates
Zonal vegetation Surface area(106km2)
Humid temperate (200) Warm continental (210) Temperate climate: temperate continental,cool summer
Mixed deciduous–coniferousforests
4.34
Hot continental (220) Temperate climate: temperate continental,warm summer
Broad-leaved forests 2.56
Subtropical (230) Subtropical climate: humid subtropical Broad-leaved coniferousevergreen forests; coniferousbroad-leaved semi-evergreenforests
4.91
Marine (240) Temperate climate: temperate oceanic Mixed forests 4.78
Prairie (250) Subtropical climate: humid subtropical;temperate climate: temperatecontinental, warm summer;temperate climate: temperatecontinental, cool summer
Forest-steppes and prairies;savannas
3.90
Mediterranean (260) Subtropical climate: subtropicaldry summers
Dry steppe; hard-leavedevergreen forests; openwoodlands and shrub
2.83
Dry (300) Tropical/subtropicalsteppe (310)
Dry climate: tropical/subtropicalsemi-arid
Open woodland and semi-deserts; steppes
13.94
Tropical/subtropicaldesert (320)
Dry climate: tropical/subtropical arid Semi-deserts; deserts 17.98
Temperate steppe (330) Dry climate: temperate semi-arid Steppes; dry steppes 6.84
Temperate desert (340) Dry climate: temperate arid Semi-deserts and deserts 6.78
Humid tropical (400) Savanna (410) Tropical and humid climate:tropical wet-dry
Open woodlands, shrubs andsavannas; semi-evergreen forest
20.54
Rainforest (420) Tropical and humid climate:tropical wet
Evergreen tropical rain forest 12.50
The identification code for each domain and division is shown in parentheses. Source: Bailey (2002)a Includes Antarctica
76 Int J Life Cycle Assess (2010) 15:67–78

FAO (2006) Global Forest Resources Assessment (FRA 2005). Foodand Agriculture Organization of the United Nations, http://www.fao.org/forestry/32085/en/ (last accessed date July 31, 2008)
FAO (2007a) AQUASTAT online database, Land and Water Devel-opment Division. Food and Agriculture Organization of theUnited Nations, Rome, http://www.fao.org/nr/water/aquastat/data/query/index.html (last accessed date August 4, 2008)
FAO (2007b) Fire management—global assessment 2006. FAOforestry paper 151, Food and Agriculture Organization of theUnited Nations, Rome
FAO (2008) Technical Meeting of the National Correspondents to theGlobal Forest Resources Assessment (FRA 2010). Food andAgriculture Organization of the United Nations, Rome, 3–7March 2008, http://www.fao.org/forestry/fra2010/en/ (lastaccessed date July 31, 2008)
Fischer G, van Velthuizen H, Nachtergaele F, Medow S (2000) GlobalAgro-ecological Zones (Global-AEZ). FAO/IIASA
Folch R, Franquesa T, Camarasa JM (1984) Història Natural delsPaïsos Catalans, Vegetació. Vol 7, Ed Enciclopèdia Catalana, SA,Barcelona
Goedkoop M, Heijungs R, Huijbregts M, De Schryver A, Struijs J,van Zelm R (2009) ReCiPe 2008. A life cycle impact assessmentmethod which comprises harmonised category indicators at themidpoint and the endpoint level. First edition. Report I:characterisation. VROM, Den Haag, The Netherlands
Guinée J, Gorrée M, Heijungs R, Huppes G, Kleijn R, de Koning A,van Oers L, Wegener Sleeswijk A, Suh S, Udo de Haes H (2001)An operational guide to the ISO-standards. Part 3: Scientificbackground. CML, Centre of Environmental Science, Leiden
Guinée J, van Oers L, de Koning A, Tamis W (2006) Life cycleapproaches for Conservation Agriculture. CML report 171,Institute of Environmental Sciences, Department of IndustrialEcology & Department of Environmental Biology, Leiden
Heijungs R, Guinée JB, Huppes H, Lankreijer RM, Udo de Haes HA,Wegener Sleeswijk A, Ansems AMM, Eggels PG, van Duin R,Goede HP (1992) Environmental Life Cycle Assessment ofProducts—Guide and Backgrounds, Centre of EnvironmentalScience (CML), Leiden
ISO-14040 (2006) Environmental management—Life cycle assessment—Principles and framework. 14040, International Organisation forStandardisation ISO, Geneva
ISO-14044 (2006) Environmental management—Life cycle assessment—Requirements and guidelines. 14044, International Organisation forStandardisation ISO, Geneva
ISRIC (2008) Global Assessment of Human-induced Soil Degradation(GLASOD). International Soil Reference and Information Centre,http://www.isric.org/NR/exeres/545B0669-6743-402B-B79A-DBF57E9FA67F.htm (last accessed date July 12, 2008)
Jäppinen E, Karttunen K, Ranta T (2008) Geographical InformationSystem (GIS) and Life Cycle Assessment (LCA)methods combinedfor evaluation of biomass supply chain. 16th European BiomassConference & Exhibition, Valencia (Spain), 2–6 June 2008
Kirkby MJ, Jones RJA, Irvine B, Gobin A, Govers G, Cerdan O, VanRompaey AJJ, Le Bissonais Y, Daroussin J, King D, MontanarellaL, Grimm L, Vieillefont V, Puigdefabregas J, Boer M, Kosmas C,Yassoglou N, Tsara M, Mantel S, Van Lynden GJ, Huting J (2004)Pan-European Soil Erosion Risk Assessment: the PESERA Map,Version 1, October 2003. European Soil Bureau Research, ReportNo 16, Office for Official Publications of the European Commu-nities, Luxembourg
Koellner T (2000) Species-pool effect potentials (SPEP) as a yardstickto evaluate land-use impacts on biodiversity. J Clean Prod 8(4):293–311
Koellner T, Scholz RW (2007) Assessment of land use impacts on thenatural environment. Part 1: an analytical framework for pureland occupation and land use change. Int J LCA 12(1):16–23
Koellner T, Scholz RW (2008) Assessment of land use impacts on thenatural environment. Part 2: generic characterisation factors forlocal species diversity in central Europe. Int J Life Cycle Assess13(1):32–48
Mattsson B, Cederberg C, Blix L (2000) Agricultural land use in lifecycle assessment (LCA): case studies of three vegetable oil crops.J Clean Prod 8(4):283–292
Milà i Canals L, Bauer C, Depestele J, Dubreuil A, FreiermuthKnuchel R, Gaillard G, Michelsen O, Müller-Wenk R,Rydgren B (2007) Key elements in a framework for land useimpact assessment in LCA. Int J Life Cycle Asssess 12(1):5–15
MIMAM (2005) Evaluación preliminar de los impactos en España porefecto del cambio climático. Ministerio de Medio Ambiente,Centro de Publicaciones, Secretaría General Técnica, http://www.mma.es/portal/secciones/cambio_climatico/areas_tematicas/impactos_cc/eval_pre_imp_esp_cc.htm (last accessed date June5, 2008)
MIMAM (2006) III Informe sobre el Programa de Acción Nacionalcontra la Desertificación, España. Ministerio de Medio Ambi-ente, Secretaría General para el Territorio y la Biodiversidad,Protección General para la Biodiversidad, Madrid
MiraMon® 6.1 (2008) Generalitat de Catalunya, Departament deGovernació i Administracions Públiques
Nelson RG (2002) Resource assessment and removal analysis for cornstover and wheat straw in the Eastern and Midwestern UnitedStates—rainfall and wind-induced soil erosion methodology.Biomass Bioenerg 22(5):349–363
Oldeman LR, Hakkeling RTA, Sombroek WG (1990) Worldmap of the human-induced soil degradation: an explanatorynote. International Soil Reference and Information Centre,Wageningen
Olson JS, Watts JA, Allison LJ (1983) Carbon in Live Vegetationof Major World Ecosystems, Report ORNL-5862, Oak RidgeNational Laboratory, Oak Ridge, Tennessee, USA. Thesource of this data set as obtained by GRID is the USNational Geophysical Data Center (NGDC), Boulder,Colorado, USA
RDPH (1986) Real Decreto 84/1986, de 11 de abril, por el que seaprueba el Reglamento del Dominio Público Hidráulico, quedesarrolla los Títulos Preliminar, I, IV, V, VI y VII de la Ley 29/1985, de 2 de agosto, de Aguas (BOE n°103, 30 April)
Reich P, Eswaran H, Beinroth F (2001) Global dimensions ofvulnerability to wind and water erosion. In: Stott DE, MohtarRH, Steinhardt GC (eds) Sustaining the global farm. Selectedpapers from the 10th International Soil Conservation Organi-zation Meeting, May 24–29 1999, Perdue University andUSDA-ARS National Soil Erosion Research Laboratory, pp838–846
Schmidt JH (2008) Development of LCIA characterisation factorsfor land use impacts on biodiversity. J Clean Prod 16(18):1929–1942
Steen B, Ryding SO (1993) The EPS enviro-accounting method. Anapplication of environmental accounting for evaluation andvaluation of environmental impact in product design. AFR,Stockholm
Stone RP (2000) Universal Soil Loss Equation (USLE) Ministry ofAgriculture, Food and Rural Affairs, Ontario, http://www.omafra.gov.on.ca/english/engineer/facts/00-001.htm (last accessed dateAugust 8, 2008)
UNEP (2002) Data sets, GEO-3 Data Compendium. United NationsEnvironment Programme, http://geocompendium.grid.unep.ch/data_sets/ (last accessed date August 2, 2008)
United Nations (1994) United Nations Convention to CombatDesertification in Countries Experiencing serious Drought and/or Desertification, Particularly in Africa
Int J Life Cycle Assess (2010) 15:67–78 77

Van der Knijff JM, Jones RJA, Montanarella L (2000) Soil erosionrisk assessment in Europe. INRA, Luxembourg
Wegener Sleeswijk A, Kleijn R, Meeusen-van Onna M.JG, Leneman H,Sengers HHWJM, Zeijts H van, Reus JAWA (1996) Application ofLCA to Agricultural Products. CML report 130, Centre of Environ-mental Science, Leiden University (CML), Centre of Agriculture andEnvironment, Agricultural-Economic Institute (LEI-DLO), Leiden
Weidema BP, Meeusen M (ed) (2000) Agricultural data for Life CycleAssessments, 1. Agricultural Economics Research Institute, TheHaugue
Weidema BP, Mortensen B, Nielsen P, Hauschild M (1996) Elementsof an impact assessment of wheat production. Institute forProduct Development
Wischmeier WH, Smith DD (1978) Predicting rainfall erosion losses—aguide to conservation planning. Agricultural Handbook, no. 537,United States Department of Agriculture
WRI (2007) Water resources and freshwater ecosystems, Searchabledatabase World Resources Institute, http://earthtrends.wri.org/searchable_db/index.php?action=select_variable&theme=2 (lastaccessed date May 27, 2008)
78 Int J Life Cycle Assess (2010) 15:67–78