assessing return on investment for e-resources: a cross-institutional analysis of cost-per-use data...
TRANSCRIPT

Assessing Return on Investment for E-Resources: A Cross-Institutional
Analysis of Cost-Per-Use Data
Patrick L. CarrNorth Carolina Serials Conference
Chapel Hill. March 10, 2011

“Print was simpler.”
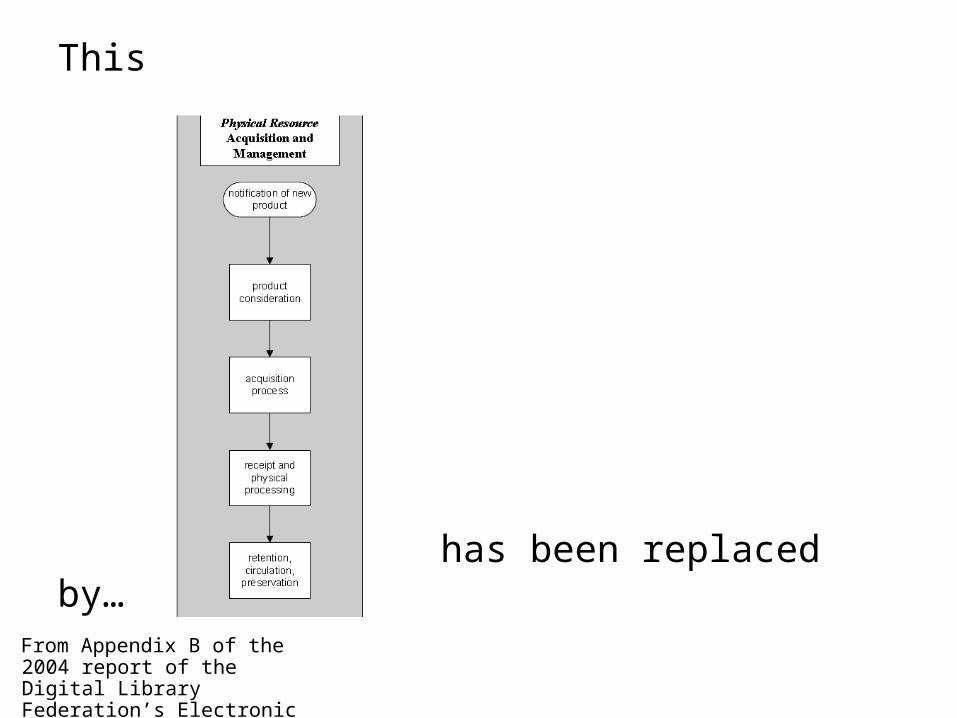
This
has been replaced by…
From Appendix B of the 2004 report of the Digital Library Federation’s Electronic Resources Management Initiative.

This
Has been replaced by…
From Appendix B of the 2004 report of the Digital Library Federation’s Electronic Resources Management Initiative.
Indeed:
This
Has been replaced by…
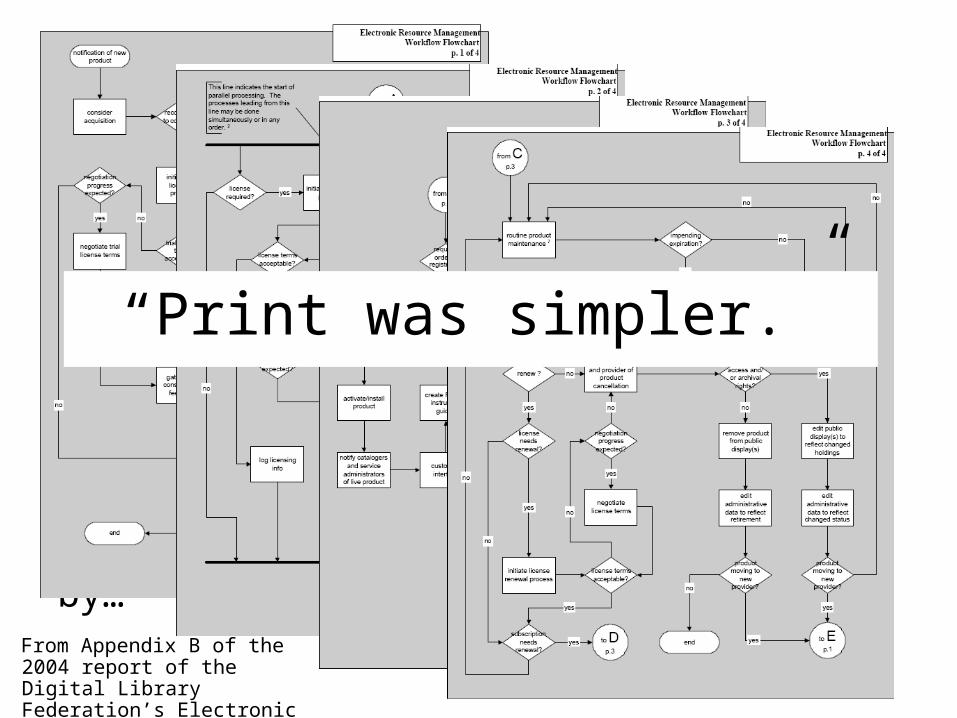
“Print was simpler.”
From Appendix B of the 2004 report of the Digital Library Federation’s Electronic Resources Management Initiative.

Indeed:
This
Has been replaced by…
“Print was simpler.”Not when it comes to use-based
evaluations.
From Appendix B of the 2004 report of the Digital Library Federation’s Electronic Resources Management Initiative.
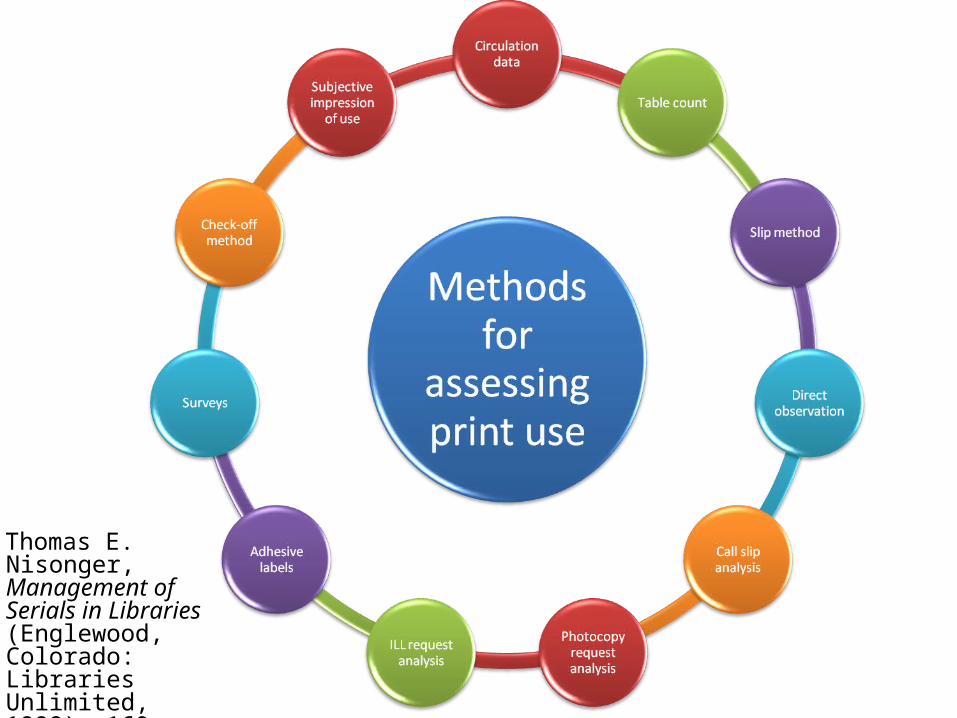
Thomas E. Nisonger, Management of Serials in Libraries (Englewood, Colorado: Libraries Unlimited, 1998): 160-65.

Thomas E. Nisonger, Management of Serials in Libraries (Englewood, Colorado: Libraries Unlimited, 1998): 160-65.
We have far superior tools to assess use of e-resources.
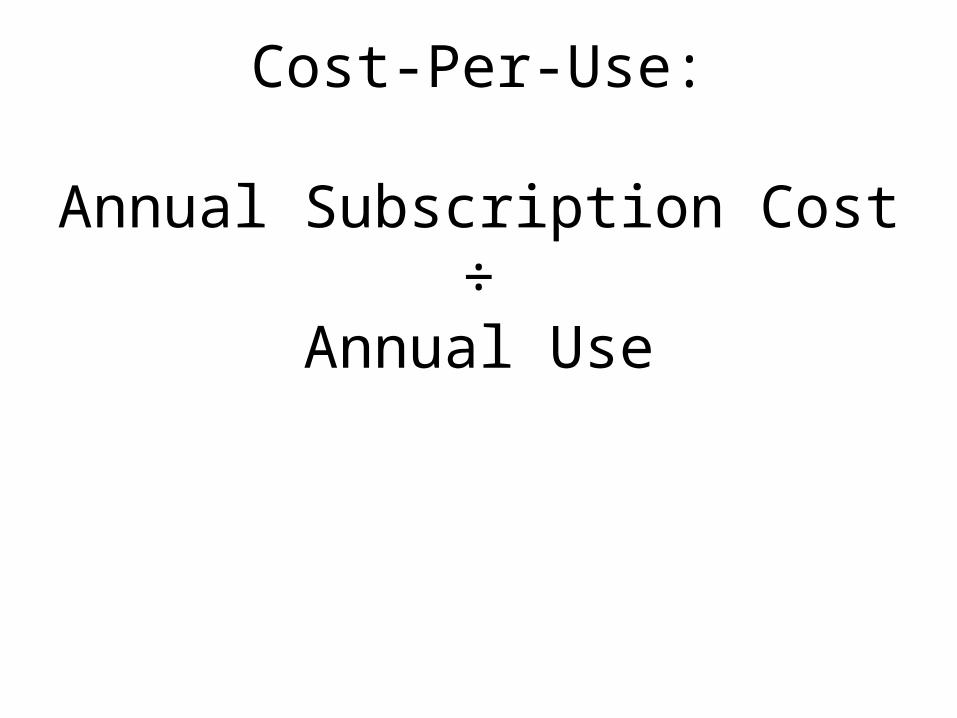
Cost-Per-Use:
Annual Subscription Cost÷
Annual Use
Cost-Per-Use:
Should always be considered in the context of qualitative
measures of ROI.

Cost-Per-Use:
A powerful tool for assessing return on investment.

Cost-Per-Use:
A powerful tool for assessing return on investment.
But are we using CPU data to its fullest potential?
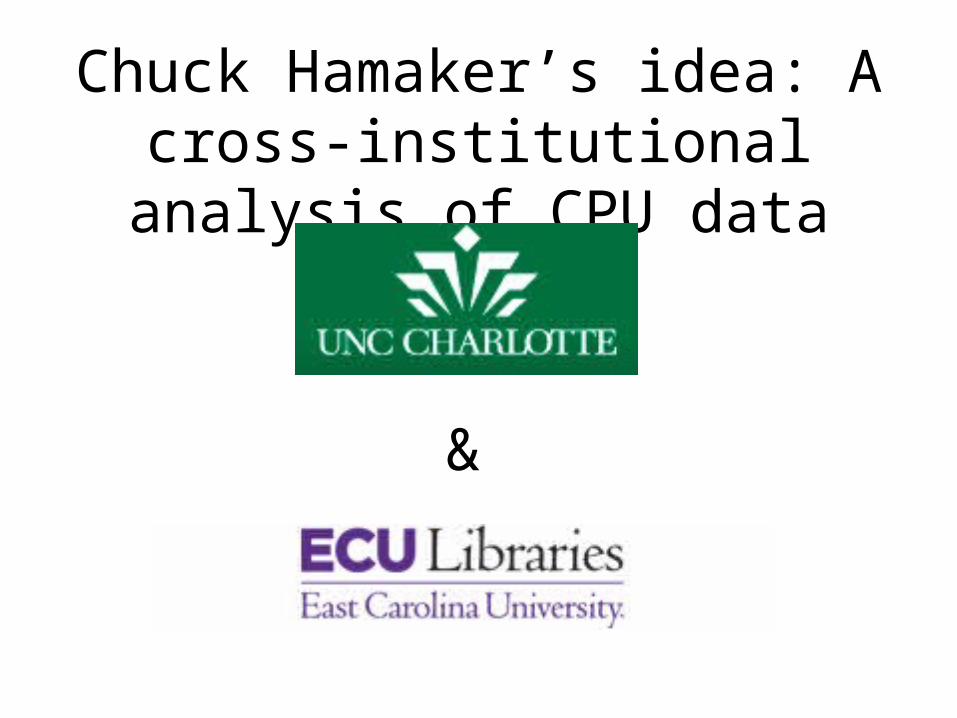
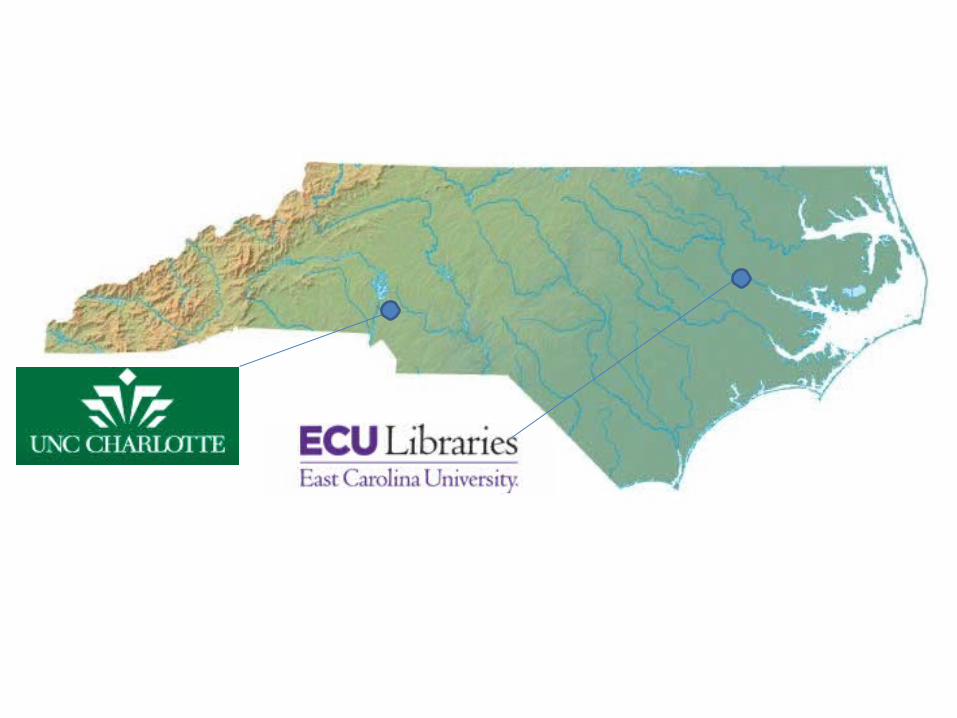
Chuck Hamaker’s idea: A cross-institutional analysis of CPU data
&


Carnegie Classifications 2009 ASERL Statistics
Student Population
Basic Class E-Journals Subscriptions
(5.a.i)
E-Journal Expenditure
(23)
East Carolina University
27,654 Doctoral / Research Universities
47,274 $3,030,342
UNC-Charlotte
24,701 Doctoral / Research Universities
24,224 $2,117,660
UNC-Greensboro
21,306 Research Universities (high research activity)
35,892 $2,769,122
UNC-Wilmington
12,924 Master's Colleges and Universities (larger programs)

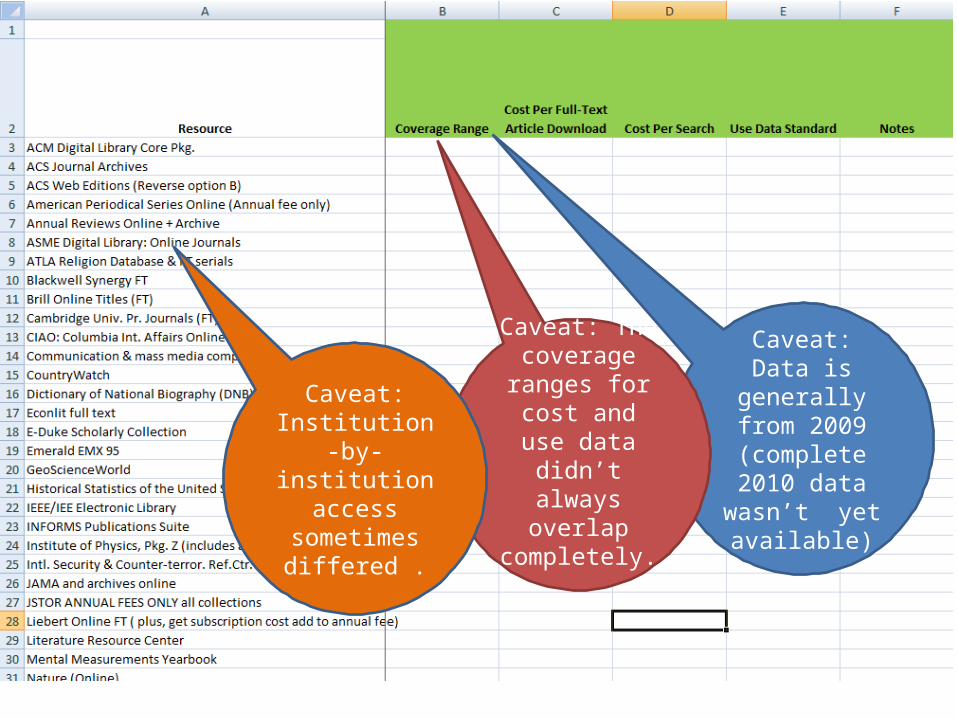
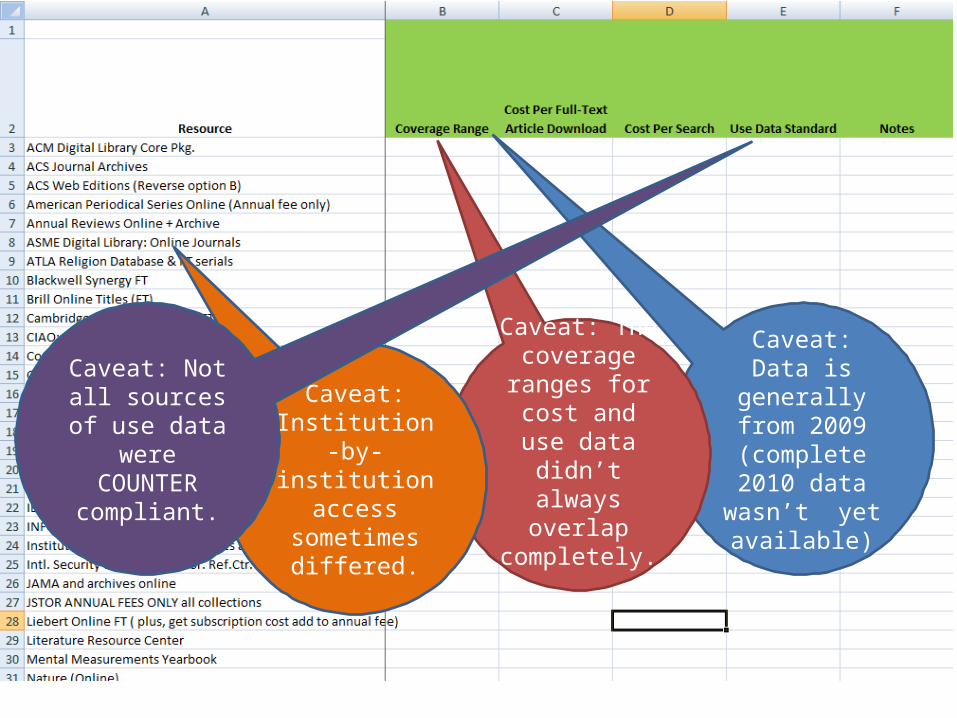
Caveat: Data is generally from 2009 (complete
2010 data wasn’t yet available)

Caveat: Data is generally from 2009 (complete
2010 data wasn’t yet available)
Caveat: The coverage ranges for cost and use
data didn’t always overlap completely.
Caveat: Data is generally from 2009 (complete
2010 data wasn’t yet available)
Caveat: The coverage ranges for cost and use
data didn’t always overlap completely.
Caveat: Institution-by-
institution access
sometimes differed .
Caveat: Data is generally from 2009 (complete
2010 data wasn’t yet available)
Caveat: The coverage ranges for cost and use
data didn’t always overlap completely.
Caveat: Institution-by-
institution access
sometimes differed.
Caveat: Not all sources of use
data were COUNTER compliant.
Caveat: Data is generally from 2009 (complete
2010 data wasn’t yet available)
Caveat: The coverage ranges for cost and use
data didn’t always overlap completely.
Caveat: Institution-by-
institution access
sometimes differed.
Caveat: Not all sources of use
data were COUNTER compliant.
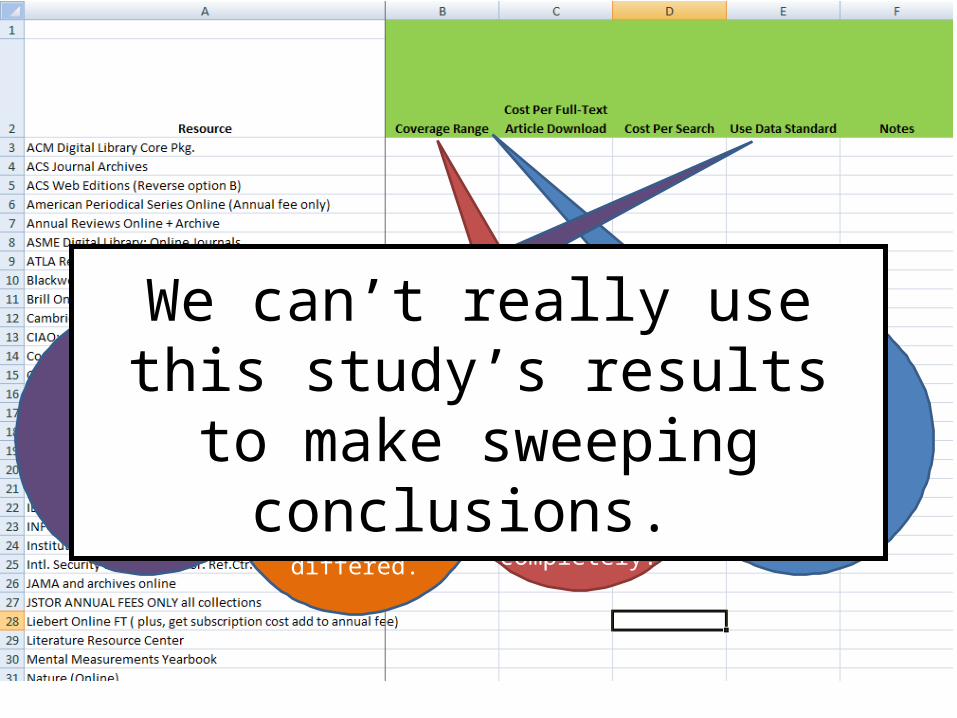
We can’t really use this study’s results to make sweeping
conclusions.

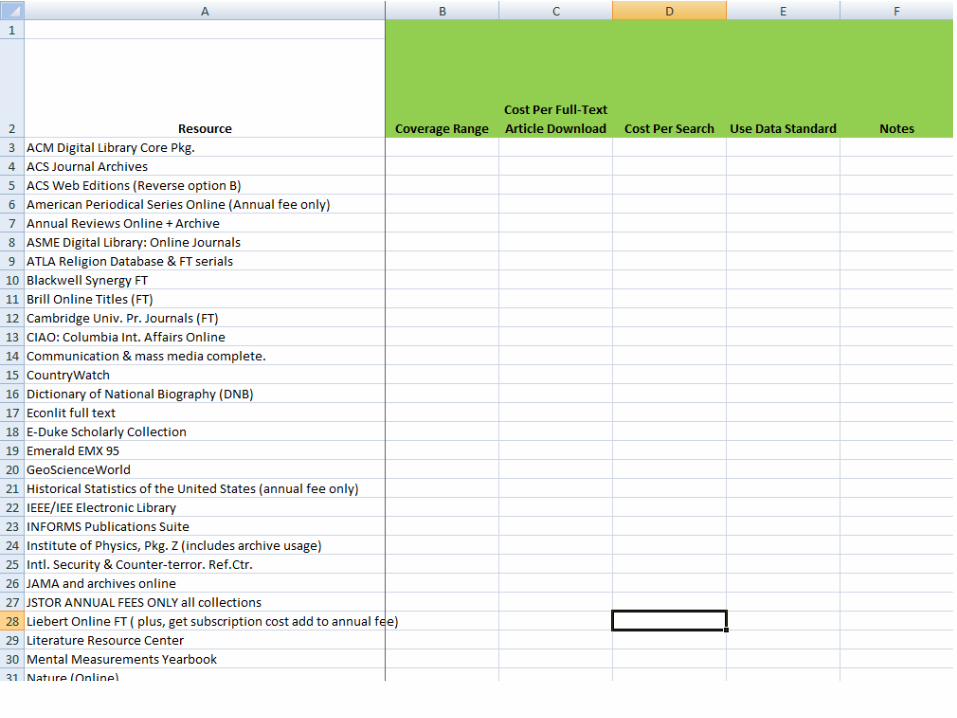
Five Categories of Resources
1. Publisher journal packagesCommercial publishersSociety publishersUniversity presses
2. Full-text aggregators3. Site licenses to journals4. Indexing & abstracting databases5. Other stuff

Publisher Journal Packages UNC Charlotte ECU UNC Wilmington UNC Greensboro
Resource Average CPU CPU CPU CPU CPU
Blackwell Synergy $11.51 $11.46 $7.59 $20.12 $6.88
Elsevier ScienceDirect $5.65 $3.89 $4.06 $8.56 $6.08
Emerald EMX $3.16 $1.10 $3.75 $5.08 $2.72
Sage Premier $6.15 $4.42 $4.79 $10.25 $5.15
Springerlink $10.49 $9.06 $6.64 $15.17 $11.08
Wiley $14.43 $14.17 $12.72 $23.64 $7.20
ACM Digital Library $6.85 $2.42 $4.73 $5.71 $14.54
ACS Web Editions $5.32 $4.72 $4.84 $6.41
Annual Reviews $4.21 $4.22 $3.14 $5.27
IEEE/IEE Electronic Library $17.73 $5.91 $13.40 $33.87
Institute of Physics $23.95 $19.78 $28.11
Royal Society of Chemistry $34.51 $20.98 $38.06 $44.50
Cambridge University Press $7.28 $8.59 $8.27 $5.86 $6.40
E-Duke Scholarly Collection $5.35 $4.73 $6.94 $4.39
Oxford University Press $5.24 $4.13 $3.77 $6.56 $6.49
ResearchNow (BEPress) $6.79 $7.90 $5.68
Average $10.54 $7.97 $9.78 $15.48 $6.93
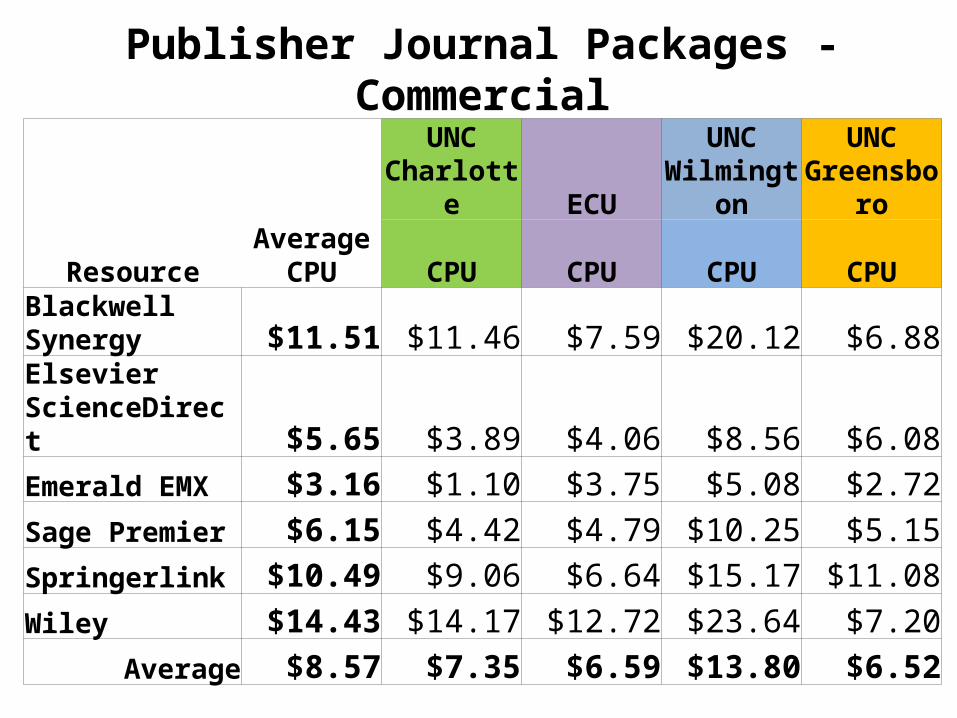
Publisher Journal Packages - Commercial
UNC
Charlotte ECUUNC
WilmingtonUNC
Greensboro
ResourceAverage
CPU CPU CPU CPU CPU
Blackwell Synergy $11.51 $11.46 $7.59 $20.12 $6.88Elsevier ScienceDirect $5.65 $3.89 $4.06 $8.56 $6.08Emerald EMX $3.16 $1.10 $3.75 $5.08 $2.72Sage Premier $6.15 $4.42 $4.79 $10.25 $5.15Springerlink $10.49 $9.06 $6.64 $15.17 $11.08Wiley $14.43 $14.17 $12.72 $23.64 $7.20
Average $8.57 $7.35 $6.59 $13.80 $6.52
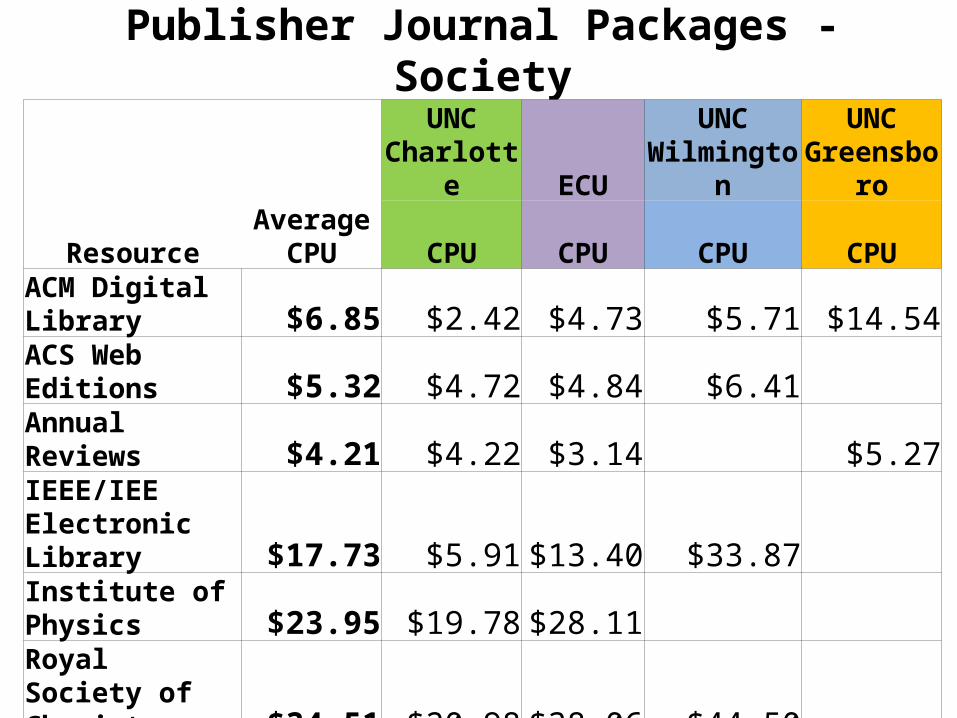
Publisher Journal Packages - Society
UNC
Charlotte ECUUNC
WilmingtonUNC
Greensboro
ResourceAverage
CPU CPU CPU CPU CPUACM Digital Library $6.85 $2.42 $4.73 $5.71 $14.54ACS Web Editions $5.32 $4.72 $4.84 $6.41 Annual Reviews $4.21 $4.22 $3.14 $5.27IEEE/IEE Electronic Library $17.73 $5.91 $13.40 $33.87 Institute of Physics $23.95 $19.78 $28.11 Royal Society of Chemistry $34.51 $20.98 $38.06 $44.50
Average $15.43 $9.67 $15.38 $22.62 $9.91
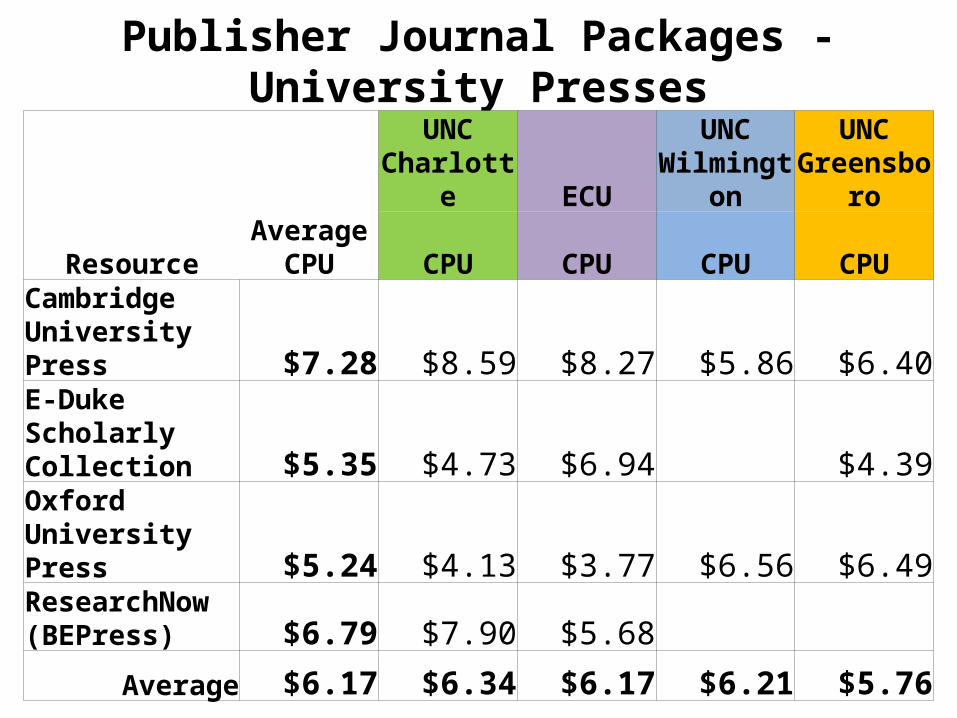
Publisher Journal Packages - University Presses
UNC
Charlotte ECUUNC
WilmingtonUNC
Greensboro
ResourceAverage
CPU CPU CPU CPU CPUCambridge University Press $7.28 $8.59 $8.27 $5.86 $6.40E-Duke Scholarly Collection $5.35 $4.73 $6.94 $4.39Oxford University Press $5.24 $4.13 $3.77 $6.56 $6.49ResearchNow (BEPress) $6.79 $7.90 $5.68
Average $6.17 $6.34 $6.17 $6.21 $5.76

Full-Text Aggregators
UNC
Charlotte ECUUNC
WilmingtonUNC
Greensboro
ResourceAverage
CPU CPU CPU CPU CPUATLA Religion $4.34 $1.25 $1.62 $8.90 $5.61CIAO: Columbia Int. Affairs Online $2.07 $1.67 $3.96 $2.15 $0.51Communication & Mass Media Complete $0.52 $0.03 $0.63 $0.89 $0.53EconLit $3.84 $3.49 $4.18Literature Resource Center $3.68 $2.91 $7.15 $0.99Project Muse $1.84 $1.29 $1.96 $2.18 $1.94PsycArticles $0.61 $0.27 $1.06 $0.54 $0.58SPORTdiscus $0.55 $0.35 $0.35 $0.96
Average $2.18 $1.41 $1.60 $3.25 $2.05
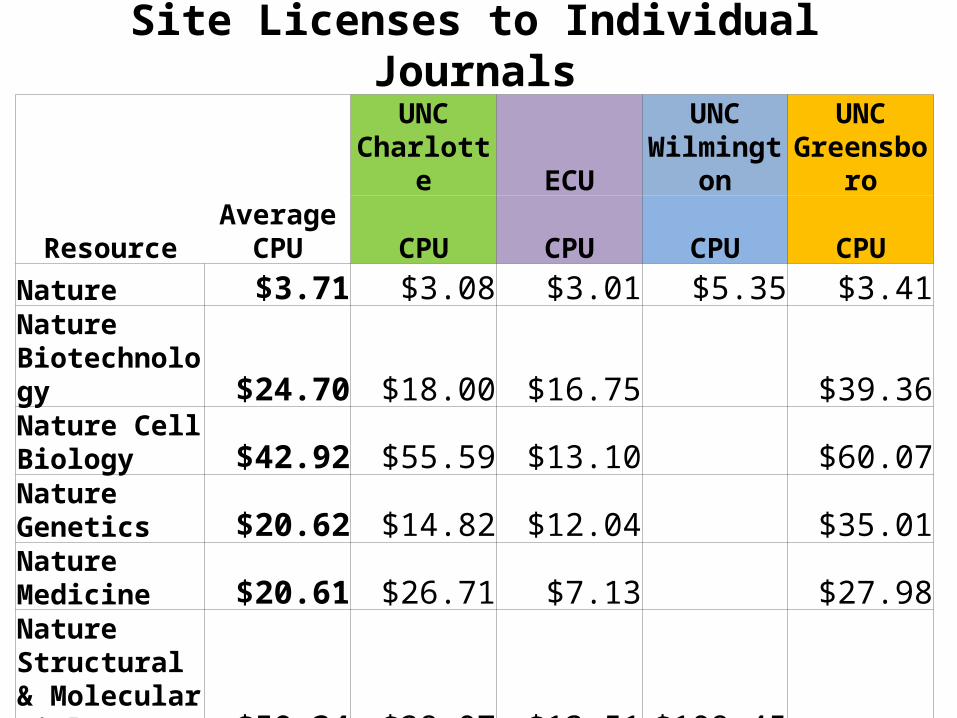
Site Licenses to Individual Journals
UNC
Charlotte ECUUNC
WilmingtonUNC
Greensboro
ResourceAverage
CPU CPU CPU CPU CPUNature $3.71 $3.08 $3.01 $5.35 $3.41Nature Biotechnology $24.70 $18.00 $16.75 $39.36Nature Cell Biology $42.92 $55.59 $13.10 $60.07Nature Genetics $20.62 $14.82 $12.04 $35.01Nature Medicine $20.61 $26.71 $7.13 $27.98Nature Structural & Molecular Biology $50.34 $28.07 $13.51 $109.45 Science $2.42 $1.98 $1.62 $2.35 $3.71
Average $23.62 $21.18 $9.59 $39.05 $28.26

Indexing & Abstracting Services
UNC Charlotte ECUUNC
WilmingtonUNC
GreensboroResource Average CPU CPU CPU CPU CPU
Abstracts in Social Gerontology $0.13 $0.04 $0.21America, History and Life $0.41 $0.12 $0.66 $0.20 $0.64Avery Index to Architectural Per. $0.48 $0.28 $0.69Engineering Village (Compendex) $16.38 $2.54 $30.22 Film and Television Lit Index $0.05 $0.04 $0.07 $0.05Historical Abstracts $0.49 $0.13 $0.77 $0.23 $0.82Journal Citation Reports Web $7.99 $5.25 $8.00 $10.73 Mathscinet $0.73 $0.11 $0.25 $1.72 $0.85MLA International Bibliography $0.15 $0.17 $0.21 $0.12 $0.09Music Index Online $1.09 $2.89 $0.28 $0.09 Oxford English Dictionary Online $0.43 $1.01 $0.46 $0.08 $0.16Philosopher's Index $1.04 $0.69 $0.16 $2.26 Polling the Nations $5.78 $8.84 $2.71 RILM Abstracts of Music Lit. $0.48 $0.08 $1.57 $0.10 $0.16Social Work Abstracts $0.13 $0.08 $0.12 $0.19Ulrichs Periodicals Directory $2.02 $4.32 $0.86 $0.89Web of Science $1.80 $0.92 $2.24 $1.18 $2.87
Average $2.33 $1.62 $3.46 $1.69 $0.64

Other Resources
UNC
Charlotte ECUUNC
WilmingtonUNC
Greensboro
ResourceAverage
CPU CPU CPU CPU CPUAmerican Periodical Series Online (archival fee) $1.17 $1.48 $1.43 $0.61Dictionary of National Biography $4.02 $8.00 $2.61 $2.50 $2.96Historical Statistics of the United States (archival fee) $0.55 $0.38 $0.96 $0.30JSTOR (archival fee) $0.26 $0.12 $0.16 $0.36 $0.40Proquest Dissertations & Theses $2.20 $2.30 $2.10Times (London) Digital Archive $1.10 $1.36 $0.84

Three Questions
Three Questions
What does a cross-institutional CPU analysis actually tell us?
Three Questions
What does a cross-institutional CPU analysis actually tell us?
How can we use what it tells us?

Three Questions
What does a cross-institutional CPU analysis actually tell us?
How can we use what it tells us?
Where do we go from here?
Questions/Comments
Patrick L. CarrHead of Electronic & Continuing Resource Acquisitions
Joyner LibraryEast Carolina University
Greenville, North Carolina 27858email: [email protected]: 252-328-2266