assessing school-based management in the philippines
TRANSCRIPT

This note is part of a series outlining analysis and results from the Philippines Public Expenditure Tracking and Quantitative Service Delivery Study conducted by the Department of Education and the World Bank with the support of the Australian Government through the Australia-World Bank Philippines Development Trust Fund.
WWW.WORLDBANK.ORG/PH 1
Philippines Education Note JUNE 2016 | NO. 5
Assessing School-based Management in the PhilippinesIntroductionIn recent times, many countries around the world have begun to devolve more authority and resources to schools in an effort to improve teaching and learning conditions. School-based management (SBM) reforms of this kind are seen as a strategy to improve education quality by bringing decision-making closer to local com-munities and by strengthening accountability between schools and the parents and children that they serve.
Recent studies from many different countries have shown that school-based management can have a positive impact in terms of increasing access to education and improving learning outcomes.1 However, these reviews have also shown that the type of SBM reforms being implemented varies enormously from country to country and that the reforms can take some time to yield results. Moreover, their success depends critically on parental participation, political support, and effective implementation.
In the early 2000s, the Government of the Philippines began to introduce school-based management reforms, which have had a positive impact on student learning outcomes.2 A key aspect of the success of these reforms has been the provision of ever-increasing levels of operational funding to the school level coupled with the devolution of greater school autonomy over the use of these funds.3 By 2014, schools were managing significant amounts of resources and using these funds to implement their own school improvement plans. Also, in 2015, the Department of Education (DepEd) issued new guidelines drawing on past experience that aimed to strengthen school improvement planning and make it more transparent.
Pub
lic D
iscl
osur
e A
utho
rized
Pub
lic D
iscl
osur
e A
utho
rized
Pub
lic D
iscl
osur
e A
utho
rized
Pub
lic D
iscl
osur
e A
utho
rized
2 WWW.WORLDBANK.ORG/PH
Assessing School-based Management in the Philippines
The purpose of this policy note is to assess the current status of school-based management in elementary and high schools in the Philippines. The findings reported in the note are based on a comprehensive survey of the public education system that tracked public education expenditure and assessed the quality of education services (see Box 1).
The note shows that the key elements of an effective school-based management system are in place. However, schools report that they are not yet implementing many
of the key aspects of this system. Moreover, parents and local communities still play a very limited role in decision-making and in holding schools accountable. Given the ever increasing amounts of resources that schools now control and the need to give them more flexibility over how to use those funds, this note argues that the role of representative school governing councils could be expanded and efforts made by DepEd to increase awareness among parents and education stakeholders of the useful role they could play in supporting school-based management.
Box 1: The Philippines Public Education Expenditure Tracking and Quantitative Service Delivery Study
The aim of the Philippines Public Education Expenditure and Quantitative Service Delivery Study has been to answer four main questions on the use of the public education budget:
1. Resource flow, management, and control. What factors prevent resources from reaching their intended destination in a timely and transparent manner?
2. Existence, use, and financing of inputs at the school level. Do schools have access to essential inputs and how effective are the systems that govern their use?
3. Equity. How do the resources available to schools and the systems that manage these resources differ among regions and socioeconomic groups?
4. School performance and resources. How and why does the performance of schools differ and what drives those differences?
The study has tracked over 80 percent of the national government education budget (including teacher salaries and training, school maintenance and operating expenses, construction, and learning materials) as well as local government spending on basic education.
In order to assess how funds flow and how they are used at the school level, the study team conducted a nationally representative survey of government institutions and public schools in the last quarter of 2014. The Autonomous Region in Muslim Mindanao was excluded from the study because government funds for this region are managed separately and flow to schools through a different mechanism. In addition, integrated schools (which offer both elementary and high school education) and schools that did not have final grade elementary and high school students were excluded from the sample, primarily because the study aimed to measure outcomes at the end of elementary school and at the end of high school.
The sample for the survey included all regional offices of the Department of Education (DepEd) and the Department of Budget and Management (DBM), 51 division and 113 district offices of DepEd, 54 district engineering offices of the Department of Public Works and Highways, 74 provincial and city/municipality local governments, 249 public elementary schools, and 200 public high schools. At the school level, interviewers administered a questionnaire to each parent-teacher association, assessed the competencies of approximately 1,500 teachers, and interviewed 2,200 student households.
The data collected were used to explore the systems that govern the use of public funds and to assess how the availability of resources differed among schools. The study team combined information on the flow of funds to schools with information on school characteristics and quality to evaluate how financing and governance affected school performance.

PHILIPPINES EDUCATION NOTE 3
Implementation of School-based Management in the Philippines Studies that have assessed the implementation of school-based management have generally focused on three key dimensions:
¾ Autonomy. The degree of autonomy that schools have to make their own decisions determines their ability to affect the educational outcomes of their students.
¾ Participation in decision-making. A central component of SBM reforms has been to encourage greater participation by parents and other members of the community in supporting schools, usually by establishing or strengthening school governing bodies.
¾ Accountability and transparency. The extent to which a school is accountable to its local community is an important aspect of its management practices, including the transparency of the school decision-making process and the quality of information that the school provides to its stakeholders.
Most schools in the Philippines have as yet not gone very far in implementing school-based management. In 2009, DepEd introduced a tool for schools to carry out their own assessment of their progress in implementing SBM (Box 2). In 2014 the PETS-QSDS study collected information on the results of these self-assessments and found that the majority of elementary and high schools reported having put in place only the lowest level of SBM (Figure 1). This means that they had only a minimum number of arrangements in place for community participation and for taking action to improve learning outcomes. Fewer than 10 percent of schools reported being at the highest level of SBM implementation and, thus, meeting all standards of community participation and school-based management.
Poorer students were more likely than wealthier students to attend schools with lower self-assessed SBM ratings. The PETS-QSDS survey included a nationally representative sample of public elementary and high school student households. Using information collected on consumption and asset ownership in the survey, it was possible to rank student households by estimated levels of per capita
household consumption.4 Using this indicator, it was possible to disaggregate the SBM ratings by schools serving different socioeconomic groups. The study found that students from the poorest 20 percent of households were more likely to attend elementary and high schools that had the lowest level of self-assessed SBM implementation than students from the wealthiest 20 percent of households.5 Other research has shown that SBM reforms have had only a limited impact in schools that serve poorer communities.6 The findings from the PETS-QSDS study suggest that this may be due at least in part to the fact that schools in poorer areas are finding it difficult to put SBM into practice.
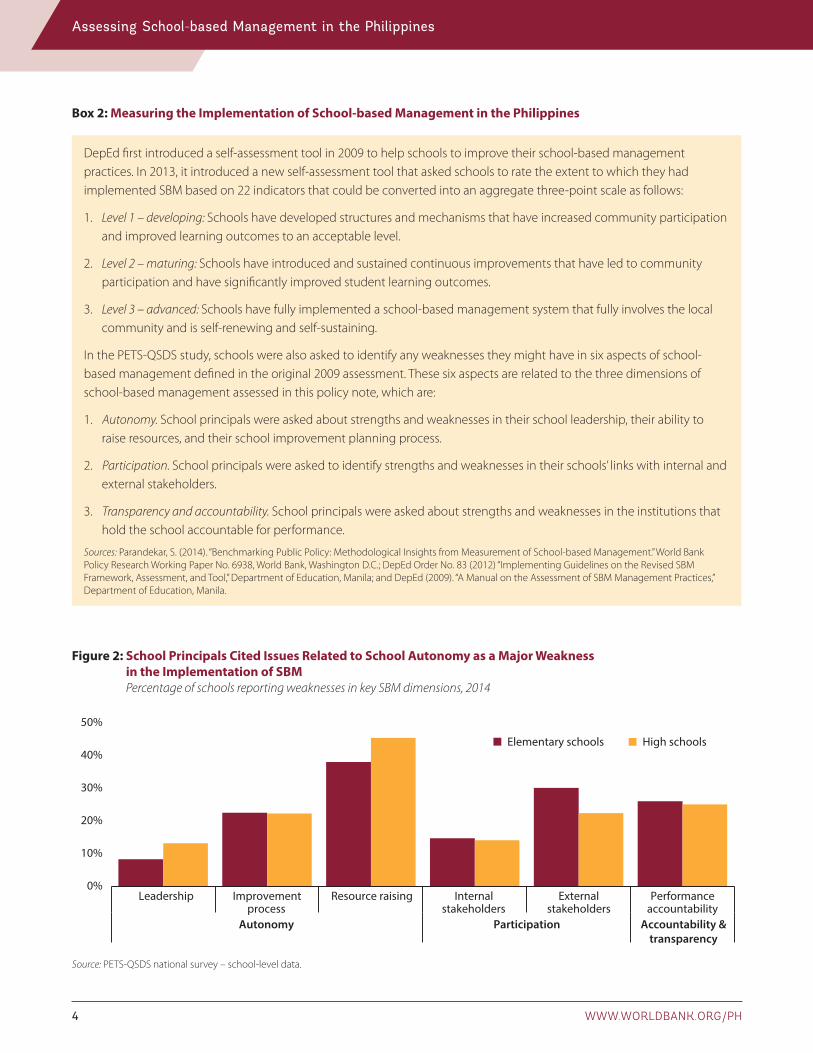
The main weaknesses identified by school principals were related to school autonomy. On the whole, more elementary school principals than high school principals highlighted weaknesses in their implementation of SBM. However, more high school principals mentioned their inability to raise sufficient resources as a major impediment to putting SBM into practice (Figure 2). It is likely that this also limits the ability of schools to carry out the activities included in their school improvement plans. Approximately 20 percent of elementary and high school principals also cited weaknesses in school improvement planning as an issue preventing the implementation of SBM.
Most principals did not regard the participation of teachers and other internal stakeholders in decision-making at
Figure 1: Most Schools Rated Themselves as Being at the Lowest Level of SBM Implementation Percentage of schools by latest self-assessed SBM implementation level, 2014
0%
20%
40%
60%
80%
100%
Elementary School High School
Level 1-developingLevel 2-maturingLevel 3-advanced
Source: PETS-QSDS national survey – school-level data.
4 WWW.WORLDBANK.ORG/PH
Assessing School-based Management in the Philippines
Box 2: Measuring the Implementation of School-based Management in the Philippines
DepEd first introduced a self-assessment tool in 2009 to help schools to improve their school-based management practices. In 2013, it introduced a new self-assessment tool that asked schools to rate the extent to which they had implemented SBM based on 22 indicators that could be converted into an aggregate three-point scale as follows:
1. Level 1 – developing: Schools have developed structures and mechanisms that have increased community participation and improved learning outcomes to an acceptable level.
2. Level 2 – maturing: Schools have introduced and sustained continuous improvements that have led to community participation and have significantly improved student learning outcomes.
3. Level 3 – advanced: Schools have fully implemented a school-based management system that fully involves the local community and is self-renewing and self-sustaining.
In the PETS-QSDS study, schools were also asked to identify any weaknesses they might have in six aspects of school-based management defined in the original 2009 assessment. These six aspects are related to the three dimensions of school-based management assessed in this policy note, which are:
1. Autonomy. School principals were asked about strengths and weaknesses in their school leadership, their ability to raise resources, and their school improvement planning process.
2. Participation. School principals were asked to identify strengths and weaknesses in their schools’ links with internal and external stakeholders.
3. Transparency and accountability. School principals were asked about strengths and weaknesses in the institutions that hold the school accountable for performance.
Sources: Parandekar, S. (2014). “Benchmarking Public Policy: Methodological Insights from Measurement of School-based Management.” World Bank Policy Research Working Paper No. 6938, World Bank, Washington D.C.; DepEd Order No. 83 (2012) “Implementing Guidelines on the Revised SBM Framework, Assessment, and Tool,” Department of Education, Manila; and DepEd (2009). “A Manual on the Assessment of SBM Management Practices,” Department of Education, Manila.
Figure 2: School Principals Cited Issues Related to School Autonomy as a Major Weakness in the Implementation of SBM Percentage of schools reporting weaknesses in key SBM dimensions, 2014
0%
10%
20%
30%
40%
50%
Leadership Improvementprocess
Resource raising Internalstakeholders
Externalstakeholders
Performanceaccountability
Autonomy Participation Accountability &transparency
Elementary schools High schools
Source: PETS-QSDS national survey – school-level data.

PHILIPPINES EDUCATION NOTE 5
the school level as a weakness. However, 40 percent of elementary school principals felt that the engagement of external stakeholders, including parents, local government, and other community representatives, was relatively weak.
Autonomy
While schools have only a limited amount of autonomy to make decisions about their own affairs, most schools develop their own improvement plans and implement them to the extent that their authority and resources allow. In each school, the school improvement plan (SIP) is developed by the principal with help and input from teachers and the local community. It reviews the school’s performance (for example, in terms of student scores on the National Achievement Test) and identifies areas where improvements are needed. Each SIP covers a three-year period, and the school produces a more detailed implementation plan every year. However, schools have very limited authority over such important areas as the hiring and deployment of teachers and school infrastructure improvements.7 In 2014, almost all schools had current school improvement plans in place, and only 5 percent of elementary schools and 10 percent of high schools did not have an up-to-date annual implementation plan.
Schools have discretion over only a very small amount of their total revenues. The PETS-QSDS study collected detailed information on all sources of school revenue and expenditure from a nationally representative sample of elementary and high schools.8 The findings showed that the average annual revenue of an elementary school was approximately PHP 3 million and for high schools it was PHP 8.1 million (Figure 3). Over 80 percent of school funding is devoted to teacher and staff salaries, and most of these salary payments are for centrally hired government teachers and staff. While school principals have some control over the day-to-day supervision of their staff, the hiring and resources used for school staffing fall outside the school’s control. Only around PHP 188,000 or 7 percent of total funds are available to each elementary school to use at its own discretion. High schools have a little more flexibility in the use of their funds but only around PHP 987,000 or 12 percent of each school’s total funds are discretionary.
The bulk of these discretionary funds are provided by DepEd and come with some conditions over their use. DepEd provides 70 percent of discretionary funds for elementary schools and 83 percent for high schools. The bulk of cash
Figure 3: Discretionary Resources at the School Level are Low Annual school revenue by type and source, 2013/14 school year
0
2,000
4,000
6,000
8,000
10,000
Elementary School High School0%
20%
40%
60%
80%
100%
Elementary School High School
Composition of all school funding (PHP 000s) Percentage of discretionary funds by source
DepEd Other cash SchoolSalaryOther in-kind
InfrastructureDiscretionary/cash
Source: PETS-QSDS national survey – school level.
Note: The averages reported in the table are for all schools even if they received zero revenue under a particular category. Other cash revenue includes cash provided to schools by parent-teacher associations, local governments, and barangays and from private sector or NGO contributions.
6 WWW.WORLDBANK.ORG/PH
Assessing School-based Management in the Philippines
funds provided by DepEd is allocated on the basis of student numbers and is provided to cover maintenance and other operating expenses (MOOE).9 Schools are allowed to use these funds on many recurrent items (such as utility payments and small repairs) but are prohibited from spending them on other important items such as learning materials and any capital assets (for example, IT equipment).10
Schools also generate their own funds, but their ability to do so is dependent on the socioeconomic composition of their student populations. Schools collect student contributions to cover specific activities (such as school projects, Red Cross, uniforms, and school feeding programs) as well as running the school canteen and other income-generating projects. About 27 percent of discretionary revenue comes from these sources in elementary schools compared with 16 percent in high schools.11 However, schools that serve a large proportion of children from poorer households are restricted in terms of how much of this kind of revenue they can raise. For example, in 2014 students in the poorest quintile attended high schools that collected approximately PHP 60 per student in canteen funds, while students in the wealthiest quintile attended schools that collected PHP 116 per student in canteen funds.12 While some of this difference may have been due to the quantity and quality of food provided, it may also have reflected the greater capacity of wealthier schools to collect revenues to support their own school improvement planning.
A lot of school discretionary resources are devoted to routine expenditures, which leaves only a limited amount available to fund additional activities. The most detailed information available on the use of school discretionary resources comes from official school records on school-level spending on MOOE. In 2013, schools used approximately three-quarters of their MOOE funding to pay for supplies and printing, to undertake routine maintenance, and to pay their utility bills.13 While these are clearly important, it does not leave much room for schools to invest in other activities that might support better learning. For example, less than 5 percent of MOOE funding was used to finance teacher training. A recent detailed costing study found that existing levels of MOOE were insufficient to provide education services up to the standard of existing DepEd norms.14 The limited amount of funding that schools have
available to spend at their own discretion in effect curtails the autonomy that they have to make their own decisions on how best to improve their operations.
Participation
Effective school-based management requires parents and local community members to play a strong supporting role in school decision-making and oversight. The School Governing Council (SGC) for each school is a forum for parents, students, teachers, and community stakeholders to participate in making school improvement decisions. It takes an active role in developing the school improvement plan (SIP) and, together with the school principal, is responsible for endorsing it to the schools division superintendent (SDS) for approval. It is also expected to participate in the monitoring of the implementation of the SIP.15 The number and type of the SGC’s members and the frequency of its meetings are initially decided through an establishment meeting attended by parents and other stakeholders. In this meeting the constitution and by-laws of the SGC and the election process for selecting council members are agreed.
Most schools have established school governing councils, and their composition tends to be representative of stakeholders within the school and in the local community (Figure 4). The PETS-QSDS survey found that approximately 90 percent of elementary schools and 80 percent of high schools had SGCs. The PETS-QSDS survey was administered in the last quarter of 2014, and its results showed that, on average, SGCs had met twice since the beginning of the 2014/15 school year. This implies that SGC meetings are usually held every quarter. The survey found that SGCs generally include representatives of most of the major stakeholders including parents, teachers, and students. In terms of overall numbers, parents and students tend to be most heavily represented on elementary school SGCs, whereas in high schools, teachers are more heavily represented.
School principals reported that the most common types of support provided by SGCs is the time and labor that they devote to school activities. Two-thirds of elementary school principals and nearly half of all high school principals reported receiving this kind of support from SGCs. About half of all principals also cited financial support for school

PHILIPPINES EDUCATION NOTE 7
planning as another type of support received from the SGC. When SGCs meet, the most common topics of discussion are student discipline, school improvement planning, school finances, and student academic performance.
Very few parents of students were aware that their child’s school had an SGC. The PETS-QSDS study interviewed a random sample of student households from the schools that were sampled. Nearly three-quarters of the household heads that were interviewed were unaware that their child’s school had an SGC (Figure 5). These findings raise questions about how effectively the SGCs are fulfilling their role as forums for school and community collaboration in improving learning outcomes.
Given that parents tend not to know about the existence of the SGC, it is perhaps not surprising that fewer than half of all parents interviewed were aware that their school had an improvement plan. Most of the parents who knew about the SIP seem to have been invited to participate directly in its preparation, but any awareness beyond this group of parents was rare.
Parent-teacher associations (PTA) are another mechanism through which parents can support school improvement. All schools sampled as part of the PETS-QSDS study reported that they had a functioning PTA. The role of PTAs in school decision-making and in the development of the school improvement plan in particular is less clearly articulated than the role of the SGC. The DepEd guidelines governing PTAs focus almost exclusively on procedures for collecting funds
and reporting on their use.16 However, PTAs are an important way in which parents can raise any concerns about school issues and provide support for school operations. As with SGCs, many PTAs include representatives of other local stakeholders including barangay captains and other local government officials.
Parents are moderately more aware of and active in PTAs than in school governing councils. All schools and almost all parents reported that their child’s school had a PTA.
Figure 4: School Governing Councils Are Representative of Most Key Stakeholders Percentage of SGCs by type of membership, 2014
0%
25%
50%
75%
100%
Elementary Schools High Schools
Barangay captainAlumni
Parents/PTA representativesLocal professionals
Student council membersTeachersNGO members
Source: PETS-QSDS national survey – school level.
Figure 5: Few Parents Know about the SGC or Are Aware of the School Improvement Plan Percentage of parents of elementary and high school students who know about the SGC and the SIP, 2014
0%
20%
40%
Aware of SchoolGoverning Council
Aware that the school hasan improvement plan
Kindergarten Elementary High School
Source: PETS-QSDS national survey – household level.
Note: The bars relate to the level of education attended by the student from the interviewed household.

8 WWW.WORLDBANK.ORG/PH
Assessing School-based Management in the Philippines
Interviews with the Presidents of the PTAs indicated that most PTAs met on a monthly or quarterly basis (Figure 6). Only 10 percent of PTAs in elementary and high schools met less than twice a year. Almost a half of all parents participated in PTA meetings and on average attended four meetings during the school year (Figure 6). On the whole, over 90 percent of parents were satisfied with the functioning of their local PTA.
Even though PTAs play only a limited formal role in school affairs, PTA Presidents reported that they had had some involvement in both the formulation and monitoring of school plans. Approximately 85 percent of elementary and high school PTAs participated in the development of the school improvement plan as well as in monitoring its implementation. The small proportion of PTAs that were not involved in the SIP process mentioned either that they were not asked to help or that the PTA did not have the time to devote to it.
The main kind of support that PTAs provide to schools is in the form of additional financial and human resources. PTA Presidents mentioned that providing their labor and skills for school projects was one of their most common activities in support of schools (Figure 7). Two of the most commonly cited kinds of support given to schools by their PTAs were
Figure 6: PTAs Meet Regularly and Parents Play an Active Role Frequency of PTA meetings and percentage of parents reporting that they attended regularly in 2013/14 school year
0%
10%
20%
30%
40%
50%
60%
Elementary schools High schools0%
25%
50%
75%
100%
0
1
2
3
4
5
Kindergarten Elementary High school
No. of meetings attended in last school yearPercentage of parents participating (RHS)
Biannually AnnuallyQuarterlyMonthly
Frequency of PTA meetings Parents’ participation in PTA meetings
Source: PETS-QSDS national survey. Left hand panel from student household interviews and right hand panel from PTA interviews.
physical labor and participation in school maintenance week (Brigada Eskwela). PTAs were also active in providing additional funding to schools through their own PTA fees as well as organizing fund-raising activities for the school. Only 32 percent of elementary school PTAs and 41 percent of high school PTAs mentioned planning as one of their main areas of support.
These findings suggest that PTAs are generally more active in school affairs than SGCs and are the main mechanism through which parents and other stakeholders participate. These findings are confirmed by school principals who stated that one of the most common ways in which they receive feedback and complaints from parents and other stakeholders is through the PTA. Approximately 60 percent of elementary and high school principals reported receiving comments and complaints from the PTA, and, with the exception of direct discussions with parents and students, this was their most common feedback mechanism.
Accountability and Transparency
This note has already provided an assessment of the kinds of institutions that are available at the school level to hold schools accountable for the resources they receive and

PHILIPPINES EDUCATION NOTE 9
ultimately for the education outcomes they deliver. This section focuses on the information that parents, PTAs, and SGCs can use to hold schools to account and ways in which parents and other stakeholders are able to provide feedback to schools.
While the PETS-QSDS enumerators were visiting schools, they noted that approximately 70 percent of elementary and high schools had some kind of notice board or transparency board where information was posted (Figure 8). However, many of these transparency boards were not publicly accessible. For example, around 40 percent of the transparency boards in elementary schools were located inside the principal’s office or in the staff room.
Most schools do not display or publish up-to-date information on how they spend their discretionary resources. The proportion of schools, particularly high schools, that reported such information was low (Figure 8). The most common information posted in schools was reports on how they had spent their MOOE funds. However, in one-third of the cases where this information was included on the transparency board, it was over three months old. Information on how revenues from sources such as school canteen funds were reported in slightly over half of all elementary schools but in fewer than one-third of high schools.
Information on school performance was also rarely provided on publicly accessible notice boards. Only 41 percent of elementary schools and 12 percent of high schools placed information such as the results achieved by their students on the National Achievement Test and school dropout rates on transparency boards (Figure 8). While many schools do display this information, they usually do so within the principal’s office, which is inaccessible to parents and other community stakeholders.
The limited availability of information provided by schools is perhaps a key reason why parents appear to be unaware of the kinds of financial resources that schools receive to fund improvements. Interviews with the parents of students in PETS-QSDS schools revealed that they had little knowledge of what resources the schools received. For example, only 40 percent of parents of elementary and high school students were aware that schools received MOOE funding from the national government. Even among the parents who were aware of this, fewer than half had received any information on how the funds had been allocated in their school over the previous year. School meetings and PTA meetings were the most common places where information on MOOE was disseminated. Fewer than 5 percent of elementary and high school parents reported obtaining this information from the transparency board at the school.
Figure 7: PTAs Commonly Provide Schools with Labor, Finances, and Assistance during the Brigada Eskwela Percentage of PTAs providing support by type, 2014
0%
20%
40%
60%
80%
Elementary Schools High Schools
Brigada EskwelaFinancialPhysical AdministrativePlanningFund raising
Source: PETS-QSDS national survey – PTA interviews.
Note: Brigada Eskwela, or school maintenance week, happens at the start of the school year and the local community provides labor and resources to repair and tidy up school facilities.

10 WWW.WORLDBANK.ORG/PH
Assessing School-based Management in the Philippines
There are few other ways by which parents and other stakeholders can access information on school performance. As part of the school improvement planning process, schools are supposed to prepare an annual school report card that includes information on key school performance indicators such as the National Achievement Test (NAT) results and student progression indicators. Yet only around a half of parents of elementary and high school students said that they had been given such a card or even any information in the previous two school years. A similar proportion of parents reported that they had not even received a report card on their own child’s progress.
Despite the limited provision of information by schools, parents on the whole felt that schools were fairly responsive and that there were a number of mechanisms in place for parents to provide feedback. Over 85 percent of parents either agreed or strongly agreed that schools provided opportunities for parents to file complaints on school-related issues. A similar proportion of parents of elementary and
high school students felt that their school worked well with other stakeholders to respond to the needs of learners.
Beyond school-level institutions, social accountability initiatives like Check My School do not appear to have had a significant impact. Check My School (CMS) is a project that uses mobile and internet technology to enable communities to monitor the quality of basic education services. The initiative involves local facilitators who mobilize communities to verify information on the status of their school. Any discrepancies between official government data and the data collected by the CMS are then brought to the attention of DepEd. Although the initiative began in 2011, its coverage appears to be quite small. Only 15 percent of elementary school principals and 20 percent of high school principals were aware of CMS, and only a small proportion of these schools had had any direct dealings with the initiative (Figure 9). For example, fewer than 5 percent of high schools had ever provided feedback through CMS.17
Figure 8: About a Half of Schools Have an Accessible Transparency Board but the Information Provided Is Frequently Limited Percentage of schools with a transparency board and types of information posted on the boards, 2014
0%
20%
40%
60%
80%
Board Information on board
0%
20%
40%
60%
80%
Has
tran
spar
ency
boa
rd
Boar
d in
pub
lic s
pace
MO
OE
liqui
datio
n
Cant
een
fund
s
PTA
fund
s
LGU
fund
s
Scho
ol p
erfo
rman
ce
MO
OE
guid
elin
es
Has
tran
spar
ency
boa
rd
Boar
d in
pub
lic s
pace
MO
OE
liqui
datio
n
Cant
een
fund
s
PTA
fund
s
MO
OE
guid
elin
es
LGU
fund
s
Scho
ol p
erfo
rman
ce
Board Information on board
Elementary Schools High Schools
Source: PETS-QSDS national survey – school level.

PHILIPPINES EDUCATION NOTE 11
Division and district supervisors from DepEd regularly visit schools to monitor their operations and to provide them with administrative and academic support. Elementary school principals reported that, since the start of the 2014/15 school year, they had received two visits on average from
the public schools district supervisor (PSDS) and one visit from division office supervisors (Figure 10). Given that the PETS-QSDS survey was administered in the last quarter of 2014, this means that the PSDS was visiting an average of once every two months and the division supervisors were
Figure 9: Social Accountability Initiatives like Check My School Do Not Work in Many Schools Percentage of school principals reporting any involvement with Check My School (CMS) in 2013 or 2014
0%
5%
10%
15%
20%
Elementary Schools High Schools
Feedback through CMSCMS reportVisited by CMSAware of CMS
Source: PETS-QSDS national survey – school level.
Figure 10: Division and District Supervisors Carry Out School Monitoring Visits Regularly Average number of visits to schools in first half of 2014/15 school year and issues covered
0
1
2
3
Dis
tric
tsu
perv
isor
Div
isio
nsu
perv
isor
s
Div
isio
nsu
perv
isor
s
Elementary School High Schools Elementary School High Schools
0%
20%
40%
60%
80%
Aca
dem
ic
Plan
ning
and
man
agem
ent
Adm
inis
trat
ive
Fina
ncia
l
Aca
dem
ic
Plan
ning
and
man
agem
ent
Adm
inis
trat
ive
Fina
ncia
l
Number of visits Issues discussed
% o
f vis
its
Source: PETS-QSDS national survey – school level.
Note: Only issues that were discussed with the public schools district supervisor are reported for elementary schools.
12 WWW.WORLDBANK.ORG/PH
Assessing School-based Management in the Philippines
visiting every quarter. Similarly, high schools were being visited by division supervisors every two months.18 These visits usually included academic supervision of classroom teaching and discussions with school principals on planning, management, and administration.
Policy Directions to Strengthen School-based Management The relatively low level of SBM implementation reported by schools in their own self-assessments highlights the need for DepEd to provide more support to schools. Providing school-level staff and SGC and PTA members with training on their roles and responsibilities has the potential to enable them to support schools in implementing all of the aspects of SBM. However, it is also likely that schools will
need support from district and division-level supervisors to help them to develop and implement better school improvement plans and to increase the effectiveness of PTAs and SGCs. This support could be provided during the existing visits that district and division supervisors make routinely to schools. A recent evaluation of training in Indonesia highlighted the importance of supervisors playing this kind of mentoring role in supporting school improvements (see Box 3).
Providing schools with more discretionary funding could support the implementation of SBM and increase the effectiveness of public spending. The small share of discretionary funding that schools currently receive limits their autonomy and ability to implement their school improvement plans. Less than 15 percent of school funding is controlled directly by schools, and much of this funding is spent on utility bills and routine supplies instead of on actions aimed at improving the learning
Box 3: An Evaluation of School-based Management Training Activities in Indonesia
In 2011, Indonesia embarked on a massive program to train school principals and school committee members on the core elements of school-based management, including planning, budgeting, and financial management. Approximately 650,000 people attended a three-day training event held in different locations across Indonesia. An evaluation of the program came to a number of important conclusions:
• A follow-up survey of participants found that the materials covered under the training program were relevant to the needs of schools in terms of school-based management.
• The training program contributed to a number of changes at the school level particularly in terms of school governance. These positive findings were confirmed by interviews with parents and community members, which revealed that schools were using discretionary funds in a transparent and accountable way.
• Schools reported that they were better able to follow the central government’s guidelines for reporting on their use of discretionary funds, which increased transparency and accountability.
• The follow-up survey highlighted overall improvements in the management of school operational funding, particularly by school committee members.
• The quality of training varied greatly across regions. There was a lack of supervision of the training events at the district level, which resulted in differences in the length of the training, class sizes, the capacity of trainers, and the quality of training facilities.
The majority of trainees interviewed in the follow-up survey felt that more guidance and assistance was needed to help them to implement the training elements in their own schools.
Source: Shaeffer, S. (2013). “BOS Training: Its Implementation, Impact, and Implications for the Development of Indonesia’s Education System. An Independent Review” Report prepared for AusAID Indonesia, Jakarta.

PHILIPPINES EDUCATION NOTE 13
outcomes of their students. DepEd has already embarked on a strategy to increase the level of school MOOE funds significantly, and this will go some way towards providing schools with the resources that they need.
The government should consider increasing the authority that schools have over the use of other school-level funding. For example, DepEd is currently engaged in a massive school infrastructure improvement program, but analysis of the PETS-QSDS survey has shown that the quality of classrooms and water and sanitation facilities built or rehabilitated under this program has generally been poor. Giving schools and the SGC a greater role during the planning and implementation of these improvement projects and giving schools the authority to certify project completion could improve the quality of these facilities in the future.19
This note has also highlighted the need for DepEd to provide greater support to schools that serve poorer communities. It has shown that poorer children generally attend schools where SBM implementation is less advanced and where fewer discretionary funds are available. The introduction of an equity component in the school MOOE funding formula would be one way to address these funding inequalities. For example, schools in remote areas and/or that serve disadvantaged groups could be given additional funding to account not only for differences in their own revenue-raising abilities but also for the higher costs they incur to purchase school equipment and supplies and to attend training sessions. While more training and support for SBM implementation is needed throughout the Philippines, it is likely that additional help will be needed by the most disadvantaged schools.
Greater efforts are required to revitalize the role played by school governing councils in the school improvement planning process in schools across the Philippines. As DepEd considers devolving more of the public education budget to schools, it is vital that accountability structures and resource planning processes are strengthened. In particular, SGCs could be given greater responsibility for monitoring how schools use their MOOE funds as a supplement to DepEd’s oversight mechanisms. For example, SGCs could become jointly responsible with the DepEd divisions office for signing off on schools’ MOOE liquidation reports. If the SGCs are to take on an expanded role, then more training and support will need to be provided by DepEd to their members.
This note has shown that most parents of students are unaware of the existence of SGCs or their school’s improvement plan. It seems clear that a campaign is urgently needed to increase the awareness of parents and other education stakeholders of the role of SGCs and school improvement plans. Recent evaluations in Indonesia and Pakistan have shown that it is possible to use old and new technologies to increase awareness. In Indonesia, an impact evaluation study showed that well-designed information campaigns using simple SMS text messages or school meetings can significantly increase public knowledge about schools’ funding levels and responsibilities.20 It also found that this increased knowledge led to higher levels of parental participation in school affairs. In Pakistan, a similar strategy was used in a successful pilot program to disseminate information about school councils.21 The pilot set up a call center and used inbound and outbound calls, robot calls, and SMS text messages to transmit important information on the role played by school councils and their members. An assessment of the pilot showed that the knowledge that school council members had of their roles and responsibilities had increased, while school principals reported an increase in the participation of the councils in school affairs.
This note has found that PTAs seemed to function well, with high participation rates by stakeholders and good relations with school principals. These findings suggest that parents and other stakeholders could participate to a greater extent in school improvement planning and in the management and oversight of school funds. However, it is also vital that the roles and responsibilities of SGCs and PTAs should be clarified by DepEd to ensure that there are no duplications in functions and that each institution fulfils its particular role.
Schools also need to make more information available to their stakeholders on how they use their funds and on the school’s overall performance. This note has shown that many schools do not routinely share this kind of information with parents even though there are regulations obligating them to do so. Keeping parents informed can encourage them to expand their role in supporting schools and in holding schools to account. Schools in the Philippines are required to produce report cards on the performance of the school and of individual students, but this note has shown that this often does not happen. There is evidence from other countries that these report cards can have significant

14 WWW.WORLDBANK.ORG/PH
Assessing School-based Management in the Philippines
Box 4: An Evaluation of School-based Management Training Activities in Uganda
A randomized controlled trial in Uganda explored the impact of different interventions that used school report cards as a way for school managing committees to monitor performance. The two interventions that were tested were as follows:
• A standard scorecard. School committee members were trained on how to use a school-level report card developed by education officials and NGOs.
• A participatory scorecard. School committee members were trained and helped to produce a school-level report card that they themselves had developed and that included indicators of school progress agreed upon with the school.
Interventions like these can be expected to improve education outcomes by providing local communities with the information needed to hold their schools accountable. They can also encourage schools to improve their performance either through social pressure or through a closer collaboration between the school and community.
The experiment found that the participatory scorecard approach had a statistically significant impact on education outcomes. In terms of student learning, schools where the participatory scorecard was introduced had a statistically significant advantage in primary school test scores of approximately 0.2 standard deviations over control schools. Teacher attendance also improved, with teachers working in participatory scorecard schools being 13 percentage points more likely to be present than teachers in control schools.
The results for the standard scorecard approach were less promising. The experiment found no statistically significant effects on student learning although it did appear to have a positive effect on the attendance of some teachers.
The authors argue that the better outcomes for the participatory scorecard were primarily the result of increased cooperation between the school and the local community rather than because of differences in the information contained in the different scorecards. These findings suggest that using participatory methods to develop school report cards may improve education outcomes and strengthen the supporting role played by school committees.
Source: Barr, A., F. Mugisha, P. Serneels and A. Zeitlin. (2012). “Information and Collective Action in Community-based Monitoring of Schools: Field and Lab Experimental Evidence from Uganda.” Unpublished paper.
benefits in terms of, for example, higher student test scores and reduced absenteeism by teachers (Box 4). Therefore, DepEd needs to ensure that its regulations requiring schools to produce report cards are enforced and to make parents aware that they are entitled to expect to be given more information on their children’s schools.
The evidence from the Philippines clearly shows that the introduction of school-based management can have
enormous benefits in terms of better education outcomes. Schools around the country have already embarked on many of the reforms needed to realize these benefits. However, there is a need to revitalize school-level institutions and to increase the amount of information that schools provide to parents and other stakeholders on the services that the schools are providing. Only then will the full potential of school-based management to improve education outcomes be realized.

PHILIPPINES EDUCATION NOTE 15
Table 1: Strengthening School-based Management
Findings Policy suggestions
Schools assess their level of SBM implementation as low
• Provide further training to school principals, school governing councils, and parent-teacher associations on school-based management
• Build the capacity of district and division supervisors to mentor schools in the implementation of school-based management
Only a small share of school funding is discretionary
• Increase central government MOOE funds to a level that will enable schools to meet existing education service standards
• Increase the authority of schools over other funds (such as school construction funding)
SBM implementation is less advanced and fewer discretionary funds are available in schools that serve poorer communities
• Introduce an equity component into the MOOE funding formula
• Provide additional supervisory support on school-based management to schools serving disadvantaged groups
SGCs are not functioning as they were designed to do
• Clarify the roles and responsibilities of SGCs and PTAs
• Establish a role for the SGC in overseeing the use of school discretionary funds
• Increase the knowledge of SGC members on their roles and responsibilities through school-level training initiatives
• Conduct an information campaign to increase public awareness of the role of SGCs and PTAs, the SIP, and the use of and the reporting requirements associated with discretionary school funds (such as MOOE funds and canteen revenues)
Transparency at the school level needs to be increased
• Strengthen monitoring by DepEd district and division offices of the production of key information (such as school report cards and student report cards) by schools
• Enforce regulations on making information publicly available on school performance and use of funds

16 WWW.WORLDBANK.ORG/PH
Assessing School-based Management in the Philippines
Endnotes1 AusAID ERF (2011). “Current Issues in Education: School Grants
and School-based Management.” Canberra; Bruns, B., D. Filmer, and H. Patrinos (2011) “Making Schools Work: New Evidence on Accountability Reforms” World Bank, Washington, D.C.; and Carr-Hill, R., C. Rolleston, T. Pherali, and R. Schendel (2014). “The Effects of School-based Decision-making on Educational Outcomes in Low- and Middle-income contexts: A Systematic Review” Institute of Education, London.
2 Khattri, N., C. Ling, and S. Jha (2010). “The Effects of School-based Management in the Philippines: An Initial Assessment Using Administrative Data” Policy Research Working Paper Series. No. 5248, World Bank, Washington, D.C. and Yamauchi, F. (2014) “An Alternative Estimate of School-based Management Impacts on Students’ Achievements: Evidence from the Philippines.” Journal of Development Effectiveness. 6, no. 2: 97-110.
3 World Bank and AusAID (2013). “School-based Management in the Philippines: An Empirical Investigation.” World Bank and AusAID, Manila.
4 The household questionnaire included a short module on consumption and a set of questions on assets that have been used by the Department of Social Welfare and Development (DSWD) to undertake a proxy means testing (PMT) approach to estimating household consumption per capita. The results reported here are based on information gathered using the PMT approach, and a full description is included in a separate note.
5 The full results are provided in a set of additional annexes and tables accompanying the main PETS-QSDS report.
6 Carr-Hill, R., C. Rolleston, T. Pherali, and R. Schendel (2014). “The Effects of School-based Decision-making on Educational Outcomes in Low- and Middle-income Contexts: A Systematic Review” Institute of Education, London.
7 Systems governing the use of school infrastructure improvement funds is discussed in detail in a separate note - Building Better Learning Environments in the Philippines.
8 A full description of the information collected in the PETS-QSDS study and the approach used to calculate total school revenue and expenditure is included in a set of additional annexes and tables accompanying the main PETS-QSDS report.
9 In 2013/14, DepEd also provided school-based management grants of between PHP 100,000 - 200,000 to 7 percent of elementary and 17 percent of high schools in low income class municipalities. The revenue from these funds is included under revenue from DepEd in Figure 3.
10 A more detailed assessment of the systems governing the use of MOOE funding for schools is provided in a separate note- Providing Schools with Adequate Operating Expenses to Deliver Quality Education in the Philippines.
11 Despite these sources representing a lower proportion of total discretionary funds in high schools than in elementary schools, high schools collected higher absolute amounts from these sources in 2014.
12 The pattern is similar in elementary schools and for other school-level revenues (for example, charges for school utilities). Full details are available in a set of additional annexes and tables accompanying the main PETS-QSDS report.
13 A more detailed assessment of school MOOE funding is provided in a separate note- Providing Schools with Adequate Operating Expenses to Deliver Quality Education in the Philippines.
14 World Bank (2016). “The Development and Implementation of a Normative School MOOE Formula in the Department of Education in the Philippines.” Washington D.C.
15 SGCs also play a role in making policies regarding student welfare and in managing council resources. See DepEd (2009). “A Manual on School Governing Councils.” Department of Education, Manila.
16 DepEd Order No. 54 (2009). “Revised Guidelines Governing Parents-Teachers Associations at the School Level.” Department of Education, Manila.
17 Similar results were also found for Government Watch initiatives in the education sector like textbook count and textbook walk.
18 High schools are not monitored by public schools district supervisors.
19 A fuller discussion of the strengths and weaknesses of existing school infrastructure improvement systems is provided in a separate note in this series - Building Better Learning Environments in the Philippines.
20 Cerdan-Infantes, P. and D. Filmer (2015). “Information, Knowledge, and Behavior: Evaluating Alternative Methods of Delivering School Information to Parents.” World Bank Policy Research Working Paper No.7233, World Bank, Washington D.C.
21 Cambridge Education (2014). “Review of Implementation of School Council Policy 2013.” Cambridge, UK.