assessing the contribution of the … the contribution of the deinstitutionalization of the mentally...
TRANSCRIPT

The University of ChicagoThe University of Chicago Law School
Assessing the Contribution of the Deinstitutionalization of the Mentally Ill to Growth in theU.S. Incarceration RateAuthor(s): Steven Raphael and Michael A. StollSource: The Journal of Legal Studies, Vol. 42, No. 1 (January 2013), pp. 187-222Published by: The University of Chicago Press for The University of Chicago Law SchoolStable URL: http://www.jstor.org/stable/10.1086/667773 .
Accessed: 25/06/2014 21:24
Your use of the JSTOR archive indicates your acceptance of the Terms & Conditions of Use, available at .http://www.jstor.org/page/info/about/policies/terms.jsp
.JSTOR is a not-for-profit service that helps scholars, researchers, and students discover, use, and build upon a wide range ofcontent in a trusted digital archive. We use information technology and tools to increase productivity and facilitate new formsof scholarship. For more information about JSTOR, please contact [email protected].
.
The University of Chicago Press, The University of Chicago, The University of Chicago Law School arecollaborating with JSTOR to digitize, preserve and extend access to The Journal of Legal Studies.
http://www.jstor.org
This content downloaded from 169.229.139.238 on Wed, 25 Jun 2014 21:24:30 PMAll use subject to JSTOR Terms and Conditions

187
[Journal of Legal Studies, vol. 42 (January 2013)]� 2013 by The University of Chicago. All rights reserved 0047-2530/2013/4201-0007$10.00
Assessing the Contribution of theDeinstitutionalization of the Mentally Ill toGrowth in the U.S. Incarceration Rate
Steven Raphael and Michael A. Stoll
ABSTRACT
We assess the degree to which the mentally ill who would have been in mental hospitals in
years past have been transinstitutionalized to prisons and jails. We also assess the contribution
of deinstitutionalization to growth in the U.S. prison population. We find no evidence of
transinstitutionalization for any demographic groups for the period 1950–80. However, for
the 20-year period 1980–2000, we find significant transinstitutionalization rates for all men
and women, with a relatively large transinstitutionalization rate for men in comparison to
women and the largest transinstitutionalization rate observed for white men. Our estimates
suggest that 4–7 percent of incarceration growth between 1980 and 2000 is attributable to
deinstitutionalization. While this is a relatively small contribution to prison growth overall,
the results suggest that a sizable portion of the mentally ill behind bars would not have been
incarcerated in years past.
1. INTRODUCTION
The prevalence of mental health problems is extremely high among U.S.prison and jail inmates (James and Glaze 2006). Approximately half ofstate and federal prison inmates and over 60 percent of jail inmatesreport having mental health problems or symptoms indicative of mentalillness. The relative prevalence of severe mental illness is particular high(nearly five times that of the general adult population). Applying theseprevalence rates to the 2008 incarcerated population implies that roughly
STEVEN RAPHAEL is Professor of Public Policy at the University of California, Berkeley.MICHAEL A. STOLL is Professor of Public Policy and Urban Planning at the University ofCalifornia, Los Angeles. We thank the Russell Sage Foundation for its generous supportof this research.
This content downloaded from 169.229.139.238 on Wed, 25 Jun 2014 21:24:30 PMAll use subject to JSTOR Terms and Conditions

188 / T H E J O U R N A L O F L E G A L S T U D I E S / V O L U M E 4 2 ( 1 ) / J A N U A R Y 2 0 1 3
Figure 1. Prisoners, mental hospital inpatients, and all institutionalized persons per 100,000residents, 1930–2000.
316,000 severely mentally ill people were inmates in the nation’s prisonsand jails (115,000 jail inmates and 201,000 state and federal prisoninmates) at that time. By contrast, the mental hospital inpatient popu-lation was less than 60,000.
That the population of the incarcerated mentally ill exceeds the in-patient mental hospital population is a relatively new development. Infact, as of midcentury, the number of mental hospital inpatients per100,000 U.S. residents greatly exceeded the prison incarceration rate.This fact is illustrated in Figure 1, which presents the number of statemental hospital inpatients,1 state and federal prisoners, and the sum ofthese two populations per 100,000 residents for the period 1930–2000.During the 1950s and 1960s, the inpatient rate was approximately threetimes the prison incarceration rate. Shortly thereafter, the inpatient ratedeclined precipitously, falling below the incarceration rate in the mid-
1. Data on inmates in state and county mental hospitals through 1970 are drawn fromPalermo, Smith, and Liska (1991), and data for later years are from Raphael (2000).
This content downloaded from 169.229.139.238 on Wed, 25 Jun 2014 21:24:30 PMAll use subject to JSTOR Terms and Conditions
D E I N S T I T U T I O N A L I Z AT I O N A N D I N C A R C E R AT I O N / 189
1970s and continuing to decline in later decades. Meanwhile, during the1980s and 1990s, the country experienced a nearly fivefold increase inincarceration rates.
The juxtaposition of these trends and the current high incidence ofsevere mental illness among those behind bars begs the question ofwhether the mentally ill have simply been transinstitutionalized frommental hospitals to prisons and jails. A related question concerns theextent to which the unprecedented growth in incarceration since the late1970s is driven by a reduction in public investment in inpatient mentalhealth services. Past changes in sentencing and corrections policies arecurrently under heightened scrutiny as state prison populations are atrecord levels and many states are seeking to scale back correctionalpopulations with an eye on the fiscal benefits of doing so. To the extentthat the run-up in state prison populations was driven by deinstitution-alization, the current focus on sentence enhancements and the evolutionof the U.S. sentencing regime may be misplaced.
In this paper, we analyze various facets of this question using U.S.census data covering the period 1950–2000. We begin with a detaileddescriptive analysis of the population of state, county, and private mentalhospitals as of midcentury. We document the fact that many of thosewho were institutionalized in the 1950s and 1960s, and were subse-quently deinstitutionalized, did not experience large increases in incar-ceration. Conversely, those most likely to be incarcerated as of the 2000census experienced pronounced increases in overall institutionalizationbetween 1950 and 2000 (with particularly large increases for blackmales). Thus, the impression created by aggregate trends is somewhatmisleading, as the 1950 demographic composition of the mental hospitalpopulation differs considerably from the 2000 demographic compositionof prison and jail inmates.
We then estimate the rate at which individuals who would have beeninstitutionalized in years past have been transinstitutionalized to prisonsand jails. We construct a panel data set that varies by state, gender, race,and age and estimate the impact of changes in regional mental hospitalinpatient rates on changes in regional incarceration rates, controlling fora variety of fixed effects defined by the dimensions of the panel. For theearly period, 1950–80, we find no evidence of transinstitutionalizationfor any of the demographic groups analyzed. For the 20-year period1980–2000, we find significant transinstitutionalization rates for all menand women, with a relatively large transinstitutionalization rate for men
This content downloaded from 169.229.139.238 on Wed, 25 Jun 2014 21:24:30 PMAll use subject to JSTOR Terms and Conditions

190 / T H E J O U R N A L O F L E G A L S T U D I E S / V O L U M E 4 2 ( 1 ) / J A N U A R Y 2 0 1 3
in comparison to women and the largest transinstitutionalization rateobserved for white men.
The magnitudes of these transinstitutionalization effect estimates sug-gest that deinstitutionalization has played a relatively minor role in ex-plaining the phenomenal growth in U.S. incarceration levels. Our resultsindicate that 4–7 percent of incarceration growth between 1980 and2000 can be attributed to deinstitutionalization. While this is a relativelysmall contribution to the prison population growth overall, the resultsdo suggest that a sizable portion of the mentally ill behind bars wouldnot have been incarcerated in years past.
2. DEINSTITUTIONALIZATION AND THE CRIMINAL JUSTICE SYSTEM
2.1. Policies, Innovations, and Legal Decisions DrivingDeinstitutionalization
Deinstitutionalization refers to the set of policies and treatment inno-vations driving the half-million-person decrease in the mental hospitalpopulation between 1955 and the present. Initial declines during the late1950s are often attributed to the introduction of medications, particu-larly phenothiazine, designed to control psychotic symptoms and permitmore effective outpatient treatment for the least severe cases of mentalillness. A further impetus toward reduction came with the 1966 intro-duction of the Medicaid and Medicare programs, under which the federalgovernment committed to a 50 percent match for treatment costs innursing homes. The match created an incentive for states to transfer alleligible residents of mental hospitals to nursing homes and other facilities,and many did. Such state responses account for much of the decline in theinpatient census during the 1960s and 1970s (Mechanic and Rochefort1990).
The one policy change that embraced deinstitutionalization as anexplicit goal occurred under the Kennedy administration. The 1963Community Mental Health Act (Pub. L. No. 88-164) established com-munity mental health centers (CMHCs) designed to provide outpatient,emergency, and partial hospitalization services for the mentally ill (Me-chanic and Rochefort 1990). The legislation embodied the shift in pro-fessional opinion regarding the effectiveness of outpatient care and theimportance of maintaining residence in the community.2 A further force
2. Many have questioned the effectiveness of this legislation, however, since the numberof community mental health centers (CMHCs) falls far short of projected needs (Foley and
This content downloaded from 169.229.139.238 on Wed, 25 Jun 2014 21:24:30 PMAll use subject to JSTOR Terms and Conditions

D E I N S T I T U T I O N A L I Z AT I O N A N D I N C A R C E R AT I O N / 191
reducing inpatient population counts was the 1975 U.S. Supreme Courtdecision in O’Connor v. Donaldson (422 U.S. 563). A key element ofthis decision was the finding that mental illness alone was not sufficientgrounds for involuntarily commitment. In subsequent years, most stateschanged their involuntary-commitment statutes to require that an in-dividual be a danger to him- or herself and/or to others, with varyingevidentiary requirements, rendering involuntary commitment consider-ably more difficult (Ross, Rothbard, and Schinnar 1996; Werth 2001).
To the extent that outpatient mental health services are inadequate,deinstitutionalization exposes severely and chronically mentally ill in-dividuals to a number of competing risks. A risk that has received con-siderable attention concerns the relationship between untreated mentalillness and homelessness (Jencks 1994; Torrey 1997). A competing riskthat has received less attention concerns the probability of incarceration.
The size of the incarceration risk faced by the untreated mentally illdepends on the degree to which the mentally ill commit crimes. More-over, whether the mentally ill are incarcerated in jails (where individualsserving sentences of less than a year and those awaiting arraignment andtrial are held) or prisons (where those serving time for felonies withsentences of a year or more are held) depends on the severity of offensescommitted. Torrey (1997) notes that the mentally ill are often arrestedfor minor crimes such as shoplifting, engaging in lewd behavior, or failingto pay for a restaurant meal, offenses likely to result in a jail spell.Torrey also cites several instances of local authorities putting the men-tally ill in local jails to provide a place for them to stay while awaitingmore suitable psychiatric services.
A prison sentence, in contrast, requires being convicted of a seriousfelony. Several studies address the issue of whether the mentally ill com-mit violent acts at a higher rate than that observed for the general public.An early review of this research documents the consistent finding thatdischarged mental patients are arrested and convicted for violent crimesat a rate that exceeds that of the general adult population (Rabkin 1979).The more recent literature reviews provided by Monahan (1992) andFrank and McGuire (2009) arrive at similar conclusions, noting the
Sharfstein 1983). Moreover, the CMHCs have been criticized as shunning individuals withthe most severe and chronic mental health problems (Johnson 1990; Jencks 1994).
This content downloaded from 169.229.139.238 on Wed, 25 Jun 2014 21:24:30 PMAll use subject to JSTOR Terms and Conditions

192 / T H E J O U R N A L O F L E G A L S T U D I E S / V O L U M E 4 2 ( 1 ) / J A N U A R Y 2 0 1 3
robustness of the relationship between mental illness and violence toalternative methodological approaches and model specifications.3
2.2. How Prevalent Is Mental Illness among Prison and Jail Inmates?
The severely mentally ill are certainly overrepresented among the in-carcerated. Moreover, this is true for both prison and jail inmates, whichsuggests that the criminal justice interactions with the untreated mentallyill extend beyond being jailed for safekeeping. Table 1 presents estimatesof the lifetime prevalence of various mental illnesses from the 2004Survey of Inmates in State and Federal Correctional Facilities (U.S. De-partment of Justice 2007) and the 2002 Survey of Inmates in Local Jails(U.S. Department of Justice 2012). These estimates are based on ques-tions inquiring whether inmates had ever received a diagnosis of a spe-cific mental illness from a health care professional. For comparison, thetable also presents two sets of prevalence estimates for the noninstitu-tionalized population: estimates for the general adult population by Kes-sler et al. (2005) from the National Comorbidity Survey Replication andfor adult males by Kessler et al. (1994) from the original National Co-morbidity Survey. While we could not find comparable estimates foreach condition included in the inmate surveys for these larger groups,these studies do provide lifetime prevalence estimates for the most severemental illnesses.
Lifetime prevalence of mental illness among state prison inmates andlocal jail inmates is nearly identical, with roughly one-quarter of eachindicating at least one diagnosis. The prevalence of severe mental illness(manic depression, bipolar disorder, or a psychotic disorder) among stateprisoners and local jail inmates is very high (nearly 15 percent of eachpopulation, 3.1–6.5 times the rate observed for all males and for thegeneral adult population). The rates of mental illness among federalprison inmates are somewhat lower. However, as federal prison inmatesaccount for only 13 percent of the total prison population, the overallprison prevalence rates are closer to those for state prisoners.
3. Steadman et al. (1998) assess the violent behavior of a sample of individuals dis-charged from acute psychiatric facilities. The authors find no differences in the levels ofviolent behavior of the mentally ill who do not abuse alcohol or drugs and members ofthe general population with no symptoms of substance abuse. Among substance abusers,however, the mentally ill are relatively more violent, which suggests some interaction be-tween mental illness and substance abuse. Frank and McGuire (2009) cite several studiesthat similarly find an interaction effect between mental illness and substance abuse on self-reported violent behavior.
This content downloaded from 169.229.139.238 on Wed, 25 Jun 2014 21:24:30 PMAll use subject to JSTOR Terms and Conditions

Tabl
e1.
Life
tim
ePr
eval
ence
ofM
enta
lIl
lnes
s
Pris
onIn
mat
es,
2004
Jail
Inm
ates
,20
02
Non
inst
itut
iona
lized
Dia
gnos
isSt
ate
Fede
ral
All
Pers
ons
18an
dO
lder
,20
00–2
002
All
Mal
es15
–54,
1990
–92
Dep
ress
ive
diso
rder
.191
.108
.194
.166
.121
Man
icde
pres
sion
,bi
pola
rdi
sord
er,
orm
ania
.097
.041
.101
.039
.016
Schi
zoph
reni
aor
anot
her
psyc
hoti
cdi
sord
er.0
46.0
20.0
46.0
07a
.006
a
Post
trau
mat
icst
ress
diso
rder
.057
.033
.051
.068
Ano
ther
anxi
ety
diso
rder
such
aspa
nic
diso
rder
.071
.046
.071
.057
b.0
36b
Pers
onal
ity
diso
rder
such
asan
tiso
cial
orbo
rder
line
.060
.033
.051
Any
othe
rm
enta
lor
emot
iona
lco
ndit
ion
.019
.008
.020
Any
ofth
eab
ove
.248
.144
.250
Sour
ces.
Est
imat
esfo
rpr
ison
inm
ates
are
base
don
our
anal
ysis
ofU
.S.D
epar
tmen
tof
Just
ice
(200
7).E
stim
ates
for
jail
inm
ates
are
base
don
our
anal
ysis
ofU
.S.
Dep
artm
ent
ofJu
stic
e(2
012)
.E
stim
ates
for
the
noni
nstit
utio
naliz
edE
nglis
h-sp
eaki
ngre
side
nts
ofth
eU
nite
dSt
ates
18an
dol
der
are
base
don
Kes
sler
etal
.(2
005)
,w
hich
anal
yzes
the
Nat
iona
lC
omor
bidi
tySu
rvey
Rep
licat
ion,
cond
ucte
d20
01–3
.E
stim
ates
for
men
ages
15–5
4ar
efr
omK
essl
eret
al.(
1994
),w
hich
anal
yzes
the
orig
inal
Nat
iona
lC
omor
bidi
tySu
rvey
,co
nduc
ted
1990
–92,
ada
tase
tpe
rtai
ning
toal
lno
nins
titut
iona
lized
pers
ons
ages
15–5
4.a Pr
eval
ence
ism
easu
red
for
all
indi
vidu
als
wit
ha
hist
ory
ofno
naff
ecti
veps
ycho
sis,
incl
udin
gsc
hizo
phre
nia,
schi
zoph
reni
form
diso
rder
,sch
izoa
ffec
tive
diso
rder
,del
usio
nald
isor
der,
and
atyp
ical
psyc
hosi
s.Se
eK
essl
eret
al.(
1994
)fo
rde
tails
.Not
eth
atth
efig
ures
pert
ain
toth
eor
igin
alN
atio
nalC
omor
bidi
tySu
rvey
and
thus
mea
sure
the
lifet
ime
prev
alen
ceof
nona
ffec
tive
psyc
hose
sas
ofth
eea
rly
1990
s.bPr
eval
ence
ism
easu
red
for
peop
lein
dica
ting
that
they
have
gene
raliz
edan
xiet
ydi
sord
er.
This content downloaded from 169.229.139.238 on Wed, 25 Jun 2014 21:24:30 PMAll use subject to JSTOR Terms and Conditions

194 / T H E J O U R N A L O F L E G A L S T U D I E S / V O L U M E 4 2 ( 1 ) / J A N U A R Y 2 0 1 3
Table 2. Characteristics of State Prison Inmates, 2004
Diagnosed Mental Illness
AllInmates None Any
Bipolar, Manic,or Psychotic
Disorder
Male .932 .953 .868 .846Married .164 .167 .154 .142Any children .555 .558 .546 .555Homeless prior to arrest .086 .065 .151 .173Hispanic .181 .199 .125 .110White .488 .444 .619 .633Black .430 .466 .321 .317American Indian .252 .047 .067 .075Offense:
Murder, homicide, or manslaughter .139 .139 .140 .123Sexual assault .107 .102 .124 .099Robbery .127 .129 .120 .135Assault .086 .082 .098 .103Other violent crime .020 .019 .024 .023Burglary .082 .080 .088 .085Fraud or larceny .078 .072 .096 .114Auto theft .012 .011 .016 .020Other property crime .010 .010 .012 .013Drugs .213 .230 .161 .155Weapons .025 .027 .018 .019Other .101 .100 .104 .112
Parent or stepparent served time .201 .247 .247 .263Age:
25th percentile 27 26 27 2750th percentile 34 34 35 3575th percentile 42 42 42 42
Age at first arrest:25th percentile 15 15 14 1450th percentile 17 17 17 1775th percentile 21 21 20 20
Source. Figures are tabulated from U.S. Department of Justice (2007).
Tables 2, 3, and 4 present average characteristics for state prisoners,federal prisoners, and jail inmates, respectively, by mental health status.There are several notable patterns in Table 2. First, while males andracial and ethnic minorities are heavily overrepresented among stateprison inmates, this is less the case among mentally ill inmates. Forexample, while 93 percent of state prisoners are male, approximately85 percent of severely mentally ill inmates are male. Similarly, whitesaccount for 49 percent of all inmates; they account for 63 percent ofseriously mentally ill inmates.
This content downloaded from 169.229.139.238 on Wed, 25 Jun 2014 21:24:30 PMAll use subject to JSTOR Terms and Conditions

D E I N S T I T U T I O N A L I Z AT I O N A N D I N C A R C E R AT I O N / 195
Table 3. Characteristics of Federal Prison Inmates, 2004
Diagnosed Mental Illness
AllInmates None Any
Bipolar, Manic,or Psychotic
Disorder
Male .929 .943 .847 .834Married .259 .266 .221 .167Any children .643 .653 .589 .527Homeless prior to arrest .037 .026 .100 .154Hispanic .249 .261 .179 .112White .435 .412 .575 .574Black .463 .489 .327 .356American Indian .040 .036 .064 .044Offense:
Murder, homicide, or manslaughter .029 .029 .026 .029Sexual assault .009 .008 .014 .004Robbery .085 .077 .134 .205Assault .017 .017 .019 .029Other violent crime .006 .004 .013 .015Burglary .005 .004 .008 .021Fraud or larceny .034 .032 .043 .053Auto theft .001 .001 .003 .009Other property crime .001 .002 .007 .016Drugs .552 .575 .418 .339Weapons .110 .099 .175 .192Other .150 .151 .140 .089
Parent or stepparent served time .148 .140 .199 .233Age:
25th percentile 29 29 29 2750th percentile 35 35 36 3475th percentile 44 44 44 43
Age at first arrest:25th percentile 16 16 15 1350th percentile 18 18 18 1775th percentile 23 23 22 22
Note. Figures are tabulated from U.S. Department of Justice (2007).
These patterns are consistent with the research documenting differ-ences in the prevalence of mental illness across demographic groups. Intheir review of 50 years of research on this topic, Frank and Glied (2006)find relatively comparable lifetime prevalence rates of severe mental ill-ness for men and women and for different racial groups. While adultsof low socioeconomic status are overrepresented among the mentally ill,it is difficult to rule out a reverse causal effect of mental illness on
This content downloaded from 169.229.139.238 on Wed, 25 Jun 2014 21:24:30 PMAll use subject to JSTOR Terms and Conditions

196 / T H E J O U R N A L O F L E G A L S T U D I E S / V O L U M E 4 2 ( 1 ) / J A N U A R Y 2 0 1 3
Table 4. Characteristics of Jail Inmates, 2002
Diagnosed Mental Illness
AllInmates None Any
Bipolar, Manic,or Psychotic
Disorder
Male .883 .913 .792 .781Married .161 .169 .142 .124Any children .552 .552 .554 .546Homeless prior to arrest .127 .102 .207 .228Hispanic .184 .208 .114 .105White .500 .462 .614 .617Black .430 .456 .337 .336American Indian .045 .041 .057 .053Reason held:
Awaiting arraignment .109 .114 .096 .097Awaiting trial .259 .244 .302 .309Awaiting parole or probation hearing .095 .096 .095 .099For safekeeping .005 .003 .010 .009As a witness .002 .001 .005 .002For contempt of court .014 .014 .001 .016Awaiting sentencing .109 .103 .128 .114Serving a sentence .353 .362 .325 .302Awaiting transfer .072 .071 .075 .085Other .067 .068 .064 .066
Defining offense:Violent .082 .079 .090 .149Property .251 .261 .218 .183Violation for financial gain .068 .065 .076 .076Drug .032 .035 .025 .016Public order .568 .560 .591 .575
Parent or stepparent served time .212 .192 .272 .289Age:
25th percentile 23 23 24 2450th percentile 31 30 32 3275th percentile 39 39 40 40
Age at first arrest:25th percentile 15 16 15 1550th percentile 18 18 17 1775th percentile 21 22 21 20
Note. Figures are tabulated from U.S. Department of Justice (2012).
socioeconomic status.4 Regardless, as mental illness does not discrimi-nate, it is noteworthy that the demographics of the incarcerated mentally
4. While one might contend that socioeconomic status based on parental characteristicstakes care of this problem, there is a strong intergenerational correlation between the mentalhealth of parents and their offspring (Gottesman 1991).
This content downloaded from 169.229.139.238 on Wed, 25 Jun 2014 21:24:30 PMAll use subject to JSTOR Terms and Conditions

D E I N S T I T U T I O N A L I Z AT I O N A N D I N C A R C E R AT I O N / 197
ill are closer to the demographics of the general adult population thanto the incarcerated overall.
Mentally ill state prisoners are only slightly more likely to be servingtime for a violent crime (50.6 percent of all mentally ill compared to47.1 percent of inmates without a diagnosis). The severely mentally illare also considerably more likely (by 6 percentage points) to be servingtime for a property crime and are considerably less likely to be doingtime for a drug offense. Finally, mentally ill prison inmates are morelikely to indicate that they suffered a spell of homelessness in the yearpreceding the arrest leading to their current incarceration. While 17.3percent of inmates with severe mental illness experienced homelessnessprior to their current arrest, the comparable figure for inmates with nodiagnosed mental illness is 6.5 percent.
We observe similar demographic patterns for federal prison inmates,with a lower proportion who are male, a higher proportion who arewhite, and lower proportions who are Hispanic or black among theseverely mentally ill. We also observe a strong relationship between men-tal illness and the likelihood of being homeless prior to arrest. Mentallyill federal inmates are considerably more likely to be held for violentcrime than are inmates with no diagnosis and considerably less likelyto be serving time for a drug crime. One pattern that is unique to thefederal system concerns the proportion serving time for a weapons vi-olation. Inmates with severe mental illness are 8 percentage points morelikely to be held for a weapons violation than are inmates with nodiagnosed mental illness. Under federal law, individuals who have been“adjudicated mentally defective” or “committed to a mental health in-stitution” are prohibited from purchasing firearms (Daly 2008). Thisdifferential treatment of the mentally ill under federal law may explainthis disparity.
The comparisons for jail inmates largely conform to the patternsobserved for state and federal prison inmates. We see similar patternswith regard to gender and race. Over one-fifth of severely mentally illinmates were homeless prior to arrest. Severely mentally ill inmates arealso nearly twice as likely to have been arrested for a violent crime thanare inmates with no such diagnosis. One interesting finding that jumpsout is the relatively small proportion of severely mentally ill inmateswho were being held for safekeeping. Only half a percent of all inmatesare described in this manner. While this is three times the comparablevalue for inmates with no diagnosed mental illness, it is still remarkablylow.
This content downloaded from 169.229.139.238 on Wed, 25 Jun 2014 21:24:30 PMAll use subject to JSTOR Terms and Conditions

198 / T H E J O U R N A L O F L E G A L S T U D I E S / V O L U M E 4 2 ( 1 ) / J A N U A R Y 2 0 1 3
2.3. Prior Research on the Transinstitutionalization of theMentally Ill
Several studies directly correlate prison populations with the mentalhospital population. Penrose (1939) was probably the first to raise theissue. Data on 18 European countries revealed a negative correlationbetween the sizes of the prison and mental hospital populations. On thebasis of this inverse correlation, Penrose advanced what he labeled the“balloon theory”: assuming a stable population in need of institution-alization, squeezing the population of one institution (for example, clos-ing mental hospitals) will cause a ballooning of the other. By modernstandards the study is flawed,5 but it is interesting to note that the inverserelationship observed in Figure 1 existed in a different time and place.
A more recent study provides a simple time-series analysis of aggre-gate national data for the United States between 1926 and 1987 (Pa-lermo, Smith, and Liska 1991), revealing significant negative correlationsbetween the sizes of the mental hospital population and prison and jailpopulations. No attempt is made to control for other possibly importantvariables or to assess the direction of causality. Nonetheless, the cor-relations are strong (the Pearson correlation coefficients for various timeperiods range from �.4 to �.5) and highly statistically significant.
3. PUTTING AN UPPER BOUND ON THE POSSIBLE CONTRIBUTION OF
DEINSTITUTIONALIZATION TO PRISON AND JAIL POPULATION GROWTH
The research findings regarding the relationship between severe mentalillness and criminal activity, combined with the overrepresentation ofthe mentally ill behind bars, suggest that deinstitutionalization may bean important contributor to U.S. prison population growth during thelast few decades of the twentieth century. However, a careful analysisof the characteristics of those in mental hospitals during the peak periodof use reveals large differences between the characteristics of those whowere subsequently deinstitutionalized and those who experienced largeincreases in incarceration rates.
To be specific, prison and jail inmates in the United States are over-whelmingly male, disproportionately minority, and relatively young. Thesame cannot be said for mental patients at midcentury. In Table 5, we
5. There is no attempt to control for other determinants of the institutionalized popu-lation and no attempt to net out common trends—that is, the panel aspects of the dataanalyzed are not fully exploited.
This content downloaded from 169.229.139.238 on Wed, 25 Jun 2014 21:24:30 PMAll use subject to JSTOR Terms and Conditions

Tabl
e5.
Dist
ribu
tion
ofIn
stit
utio
naliz
edan
dNo
nins
titu
tion
aliz
edPo
pula
tion
s,19
50–8
0
1950
1960
1970
1980
Men
tal
Hos
pita
lsPr
ison
san
dJa
ilsN
IM
enta
lH
ospi
tals
Pris
ons
and
Jails
NI
Men
tal
Hos
pita
lsPr
ison
san
dJa
ilsN
IM
enta
lH
ospi
tals
Pris
ons
and
Jails
NI
Age
grou
p:!
10.8
5.8
419
.51
.43
.03
22.0
3.5
7.1
518
.48
.73
.04
14.7
710
–17
1.06
11.1
011
.51
1.66
2.85
14.2
13.
593.
4316
.18
6.26
2.23
13.6
918
–25
5.31
27.5
412
.13
5.03
30.0
19.
869.
0939
.67
12.7
614
.63
43.1
514
.80
26–3
06.
3217
.28
8.19
4.30
16.3
86.
136.
1316
.67
6.43
9.18
21.6
68.
4131
–35
8.02
12.8
87.
545.
9413
.76
6.73
5.75
11.2
45.
509.
0212
.90
7.41
36–4
08.
408.
697.
457.
3611
.86
6.90
6.50
9.15
5.51
6.91
7.65
5.97
41–4
58.
347.
236.
538.
328.
396.
398.
046.
695.
856.
954.
605.
0646
–50
11.1
65.
246.
089.
526.
405.
898.
025.
345.
905.
812.
674.
9151
–55
11.6
94.
085.
2010
.11
4.78
5.28
9.00
3.29
5.28
7.76
2.41
5.20
56–6
418
.54
3.25
7.75
18.6
14.
507.
7118
.33
3.35
8.11
12.5
21.
638.
54≥6
520
.30
1.88
8.10
28.7
21.
038.
8824
.99
1.03
10.0
020
.24
1.06
11.2
4R
ace
oret
hnic
ity:
Whi
te87
.62
62.2
087
.99
85.0
358
.86
86.6
382
.80
54.6
785
.52
79.4
047
.14
81.5
0B
lack
10.5
233
.40
9.90
12.7
335
.57
10.4
715
.45
40.2
911
.03
17.1
542
.65
11.6
5O
ther
.43
1.26
.43
1.00
1.87
.89
.93
1.82
1.18
1.95
5.14
3.41
His
pani
c1.
433.
141.
681.
243.
692.
01.8
23.
232.
271.
505.
073.
45G
ende
r:M
ale
52.5
590
.79
49.6
053
.23
95.1
049
.01
55.9
594
.84
48.4
560
.79
94.1
048
.37
Fem
ale
47.4
59.
2150
.40
46.7
74.
9050
.99
44.0
55.
1651
.55
39.2
15.
9051
.63
Popu
lati
ones
tim
ate
(1,0
00s)
621
315
151,
274
698
356
178,
247
440
341
202,
257
246
461
226,
024
Not
e.T
abul
atio
nsar
efr
omth
ePu
blic
Use
Mic
roda
taSa
mpl
efil
esof
the
1pe
rcen
tsa
mpl
eof
dem
ogra
phic
sfo
rpe
ople
and
hous
ing
unit
sfr
omth
eU
.S.C
ensu
sof
Popu
lati
onan
dH
ousi
ngfo
r19
50,
1960
,19
70,
and
1980
.N
Ip
noni
nsti
tuti
onal
ized
.
This content downloaded from 169.229.139.238 on Wed, 25 Jun 2014 21:24:30 PMAll use subject to JSTOR Terms and Conditions

200 / T H E J O U R N A L O F L E G A L S T U D I E S / V O L U M E 4 2 ( 1 ) / J A N U A R Y 2 0 1 3
characterize mental hospital inpatients, prison and jail inmates, and thenoninstitutionalized with data from the Public Use Microdata Samples(PUMS) of the U.S. Census of Population and Housing for the years1950–80.6 Beginning with tabulations for 1950, there are several notabledifferences between the inpatient and correctional populations. First, themental hospital population is considerably older, with larger proportionsover 40 and a population 65 and older that is more than 10 times thecomparable figure for the correctional population. Second, the propor-tion who are black or Hispanic is not appreciably larger than the com-parable proportion for the noninstitutionalized population, while mi-norities are very much overrepresented in prisons and jails. One of themost pronounced disparities is the gender composition. Nearly half ofthe mental hospital population is female, while in 1950 only 9 percentof those in prison or jail were women.
Between 1950 and 1980, the mental hospital inpatient populationbecame younger, more minority, and more male, although the elderlyand women still constitute larger proportions of mental hospital inpa-tients than of prison and jail inmates. These changes suggest that de-institutionalization proceeded in a nonrandom fashion, with institution-alization rates declining first for those who are perhaps the least likelyto be transinstitutionalized (for example, women and/or the elderly),followed by subsequent declines in mental hospital institutionalizationamong groups who subsequently experienced increases in incarceration(young men and racial and ethnic minorities). While we cannot measurefurther changes in the composition of the mental hospital populationafter 1980, as this is the last year that the census separately identifiedmental hospital inpatients, we know from aggregate statistics that by2000 the mental hospital population became trivially small. Hence, the1980 mental hospital population largely represents the demographics ofthose deinstitutionalized over the subsequent 2 decades.
These demographic differences between prison and jail inmates andmental hospital patients suggest that the potential impact of deinstitu-tionalization on prison population growth is substantially less than whatmight be inferred from comparisons of aggregate time series. While de-cline in mental hospital institutionalization rates between 1950 and 2000is of magnitude comparable to the late-century increase in incarcera-tion—a fact that may lead to the belief that we are simply rehousing
6. For each of the census years, those in mental hospitals can be distinguished fromthose in correctional institutions by using the detailed group-quarters variable.
This content downloaded from 169.229.139.238 on Wed, 25 Jun 2014 21:24:30 PMAll use subject to JSTOR Terms and Conditions

D E I N S T I T U T I O N A L I Z AT I O N A N D I N C A R C E R AT I O N / 201
the mental patients of 1950 in current prisons and jails—the demo-graphic dissimilarities in Table 5 suggest caution in drawing such aninference.
To illustrate the importance of these compositional differences, wepose the following two questions. First, how has the overall institution-alization risk (either in mental hospitals or in prisons or jails) for some-one who is institutionalized in 2000 changed since 1950? Second, howdid the institutionalization risk for someone institutionalized in 1950change over the subsequent half century? If we have simply transferredthe same types of people from one institution to another, the 2000 in-stitutionalization risk of the currently institutionalized should resembletheir comparable institutionalization risks at midcentury. Similarly, theinstitutionalization risk in 2000 of those institutionalized in 1950 shouldequal their institutionalization risk in 1950.
To answer these questions, we calculate the following weighted av-erage institutionalization risks. Let i index the eight age groups of adults18–64 listed in Table 5, r index the four mutually exclusive race orethnicity groups, g index gender, and t index the year. Furthermore,define wgirt as the proportion of the institutionalized population in yeart that is of gender g, age group i, and race or ethnicity group r, anddefine Igirt as the corresponding institutionalization rate for this group.Taking the product of the group-specific institutionalization rate and thegroup institutionalization share and summing over all dimensions givesthe institutionalization risk for someone with demographic character-istics that mirror those of the average institutionalized person. For ex-ample, this institutionalization risk in 2000 for those institutionalizedin 2000 is
2000IR p w I . (1)���2000 gir2000 gir2000g i r
The value in equation (1) of course exceeds the overall institutionali-zation rate, as it is a weighted average with higher weights placed onthose demographic groups that disproportionately constitute the insti-tutionalized population.
To answer the two questions posed above, we calculate the institu-tionalization risk for each analysis year for the institutionalized popu-lation from a specific year. For example, the institutionalization risk in1950 for someone with demographic characteristics that resemble thoseof the institutionalized in 2000 is given by the equation
2000IR p w I . (2)���1950 gir2000 gir1950g i r
This content downloaded from 169.229.139.238 on Wed, 25 Jun 2014 21:24:30 PMAll use subject to JSTOR Terms and Conditions

202 / T H E J O U R N A L O F L E G A L S T U D I E S / V O L U M E 4 2 ( 1 ) / J A N U A R Y 2 0 1 3
Figure 2. Institutionalization rates and risks for adults 18–64 years of age, 1950–2000
To the extent that we are institutionalizing the same people in 2000 aswe did in 1950, the alternative risk measures in equations (1) and (2)should be of comparable magnitude.
Figure 2 depicts the overall institutionalization rate for adults 18–64years of age for each year 1950–2000 as well as the institutionalizationrisk in each year for those who resemble the 2000 institutionalized pop-ulation and those who resemble the 1950 institutionalized population.The overall institutionalization rate exhibits a pattern comparable tothat in Figure 1: a substantial decline 1960–80, from 1,156 per 100,000residents to 716 per 100,000 residents, followed by a more than off-setting increase to 1,309 per 100,000 residents in 2000. The institu-tionalization risk for those resembling the 1950 institutionalized pop-ulation exceeds the overall rate in the peak year of 1960 by about 14percent. However, by 2000 the institutionalization risk for this groupfalls short of the overall institutionalization rate by approximately 7
This content downloaded from 169.229.139.238 on Wed, 25 Jun 2014 21:24:30 PMAll use subject to JSTOR Terms and Conditions

D E I N S T I T U T I O N A L I Z AT I O N A N D I N C A R C E R AT I O N / 203
percent. Moreover, relative to the 1960 peak, this weighted institution-alization risk declines by nearly 9 percent.
By contrast, the institutionalization risk weighted by the 2000 insti-tutionalized population exhibits a sharp increase 1950–2000. Relativeto the peak year of 1960, the institutionalization risk for this groupincreased nearly 80 percent, from 2,521 per 100,000 residents to 4,512per 100,000 residents. In conjunction, these two series suggest real de-clines in the institutionalization risks for those who would have beeninstitutionalized in the past (both absolutely and relative to overalltrends) and real, particularly large increases in institutionalization risksfor those who are most likely to be institutionalized today.
The dissimilarities between those in mental hospitals and those inprisons and jails as well as the limits of the potential contribution ofdeinstitutionalization to prison population growth become particularlysalient when we take a close look at the period 1980–2000. Note thatnearly 92 percent of the growth in U.S. incarceration rates occurring1950–2000 happens during this latter period, with most of the remaining8 percent occurring during the latter half of the 1970s. Figures 3–6present comparisons of mental hospitalization rates in 1980 to thechange in incarceration rates 1980–2000 for white and black males(Figures 3 and 4) and white and black females (Figures 5 and 6). Eachfigure provides comparisons for eight age groups of adults 18–64. Notethat we would ideally wish to compare the change in mental hospitalinstitutionalization rates over this period to the corresponding changesin incarceration rates. However, the census does not separate the incar-cerated from mental hospital inpatients in PUMS data after 1980. None-theless, we know that by 2000 the overall population of state and countymental hospitals had declined to below 60,000 people and declined inall states. Thus, if one assumes for the sake of argument that the mentalhospital population zeroes out by 2000, the change in incarceration canbe measured by the difference between the 2000 institutionalization rateand the 1980 incarceration rate, while the change in the mental hospitalinpatient rate simply equals �1 times the inpatient rate for the base year1980. The base mental hospital population rate can be thought of asproviding an upper-bound estimate of the potential contribution of de-institutionalization to incarceration growth.
For most white males, the mental hospital inpatient rate in 1980 wasroughly 12–17 percent of the change in incarceration rates occurring1980–2000, with larger percentage figures for older groups of males.For black males, the comparable figures are considerably smaller. For
This content downloaded from 169.229.139.238 on Wed, 25 Jun 2014 21:24:30 PMAll use subject to JSTOR Terms and Conditions

204
Figure 3. Changes in institutionalization rates compared with 1980 mental hospital inpatientrates: white males.
Figure 4. Changes in institutionalization rates compared with 1980 mental hospital inpatientrates: black males.
This content downloaded from 169.229.139.238 on Wed, 25 Jun 2014 21:24:30 PMAll use subject to JSTOR Terms and Conditions

205
Figure 5. Changes in institutionalization rates compared with 1980 mental hospital inpatientrates: white females.
Figure 6. Changes in institutionalization rates compared with 1980 mental hospital inpatientrates: black females.
This content downloaded from 169.229.139.238 on Wed, 25 Jun 2014 21:24:30 PMAll use subject to JSTOR Terms and Conditions
206 / T H E J O U R N A L O F L E G A L S T U D I E S / V O L U M E 4 2 ( 1 ) / J A N U A R Y 2 0 1 3
relatively young black males (under 40), the base mental hospital in-patient rates range from 3 to 6 percent of the change in incarcerationoccurring over the subsequent 2 decades. Similar to those for whitemales, the comparable figures for older groups of black males are higher,though never exceeding 20 percent of the actual change. For whitewomen, base mental hospitalization rates constitute relatively larger pro-portions of the subsequent change in incarceration (30–60 percent),while for black females the comparable figures range from about 10 to30 percent across nearly all age groups.
These comparisons can be used to calculate an upper bound of thepotential contribution of deinstitutionalization to incarceration growthas well as several estimates of the impact of deinstitutionalization underalternative transinstitutionalization rates between mental hospitals andprisons. To do so, we first tabulate what the incarceration rate wouldhave been in 2000 for demographic groups defined by gender, race orethnicity, and age, assuming that the mental hospitalization rate did notdecline from the 1980 value and that each one-person change in themental hospitalization rate causes a one-person change in the incarcer-ation rate of opposite sign. We then use actual 2000 population sharesacross the gender-race-age groups to tabulate a hypothetical overall in-carceration rate in 2000. Comparing actual growth to counterfactualgrowth toward this hypothetical rate provides our upper-bound estimate.
Table 6 provides some of the intermediate inputs for this tabulation(to conserve space, we do not provide the age-specific tabulations). Inaddition to the actual incarceration rate in 1980 and the actual insti-tutionalization rate in 2000, it shows the hypothetical incarceration ratefor each group, assuming a one-for-one transinstitutionalization rate, a.5 rate, or a .25 rate and assuming a change in mental hospital inpatientrates equal to �1 times the base rate in 1980.
The results of this exercise reveal the likely modest contribution ofdeinstitutionalization to incarceration growth. For black males, thesetabulations indicate that deinstitutionalization contributed at most 331persons per 100,000 residents to the change in the incarceration rate of5,842 persons per 100,000 residents experienced by black males (lessthan 6 percent of growth). For white males, the tabulations suggest thatdeinstitutionalization could be culpable for at most 17 percent of in-carceration growth. The comparable figure for Hispanic males is 4 per-cent. Among women, the upper-bound estimates suggest that deinsti-tutionalization may be a proportionally more important contributor toincarceration growth (39 percent for white women, 19 percent for black
This content downloaded from 169.229.139.238 on Wed, 25 Jun 2014 21:24:30 PMAll use subject to JSTOR Terms and Conditions

Tabl
e6.
Inst
itut
iona
lizat
ion
and
Inca
rcer
atio
nRa
tes
Act
ual
1980
Inca
rcer
atio
nR
ate
Act
ual
2000
Inst
itut
iona
lizat
ion
Rat
e
Hyp
othe
tica
l20
00In
carc
erat
ion
Rat
e
Tra
nsin
stit
utio
naliz
atio
nR
ate
p1
Tra
nsin
stit
utio
naliz
atio
nR
ate
p.5
Tra
nsin
stit
utio
naliz
atio
nR
ate
p.2
5
Mal
es:
Whi
te35
61,
285
1,12
71,
206
1,24
6B
lack
2,62
58,
467
8,13
68,
301
8,38
4O
ther
980
1,39
81,
250
1,32
41,
361
His
pani
c1,
000
2,91
92,
833
2,87
62,
897
Fem
ales
:W
hite
1826
516
921
724
1B
lack
144
852
716
784
818
Oth
er54
217
191
204
211
His
pani
c60
265
212
239
252
Not
e.H
ypot
heti
cal
inca
rcer
atio
nra
tes
assu
me
aco
ntri
buti
onof
dein
stit
utio
naliz
atio
nto
the
over
all2
000
inst
itut
iona
lizat
ion
rate
equa
lto
the
men
talh
ospi
tal
inpa
tien
trat
ein
1980
mul
tipl
ied
byth
etr
ansi
nsti
tuti
onal
izat
ion
para
met
er.A
vera
gein
stit
utio
naliz
atio
nra
tes
wit
hin
gend
er-r
ace
grou
psar
eca
lcul
ated
byav
erag
ing
the
age-
spec
ific
esti
mat
esus
ing
the
2000
popu
lati
onsh
ares
wit
hin
gend
er-r
ace
grou
psas
wei
ghts
.T
hehy
poth
etic
alta
bula
tion
sas
sum
eco
mpl
ete
dein
stit
utio
n-al
izat
ion
1980
–200
0;th
atis
,th
esi
mul
atio
nsas
sum
eno
men
tal
hosp
ital
inpa
tien
tsin
2000
.
This content downloaded from 169.229.139.238 on Wed, 25 Jun 2014 21:24:30 PMAll use subject to JSTOR Terms and Conditions

208 / T H E J O U R N A L O F L E G A L S T U D I E S / V O L U M E 4 2 ( 1 ) / J A N U A R Y 2 0 1 3
Figure 7. Hypothetical incarceration rates, 2000
women, 16 percent for other women, and 26 percent for Hispanicwomen). Naturally, when we assume lower transinstitutionalizationrates, the tabulated contribution of deinstitutionalization to prison pop-ulation growth falls.
Of course, our upper-bound estimate of the overall contribution ofdeinstitutionalization to prison growth over this latter time period willmore closely reflect the group-specific estimates for demographic groupsthat constitute disproportionate shares of the prison population. Thatis to say, the overall impact will be closer to that of males and, inparticular, to that of black and Hispanic males. Figure 7 displays theactual incarceration rate for 1980, the actual institutionalization rate in2000, and several hypothetical overall incarceration rates in 2000 as-suming no deinstitutionalization 1980–2000 and 1, .5, and .25 transin-stitutionalization rates. The hypothetical 2000 incarceration rate assum-ing a one-for-one transfer rate is roughly 90 percent of the actualinstitutionalization rate for that year. Growth between 1980 and thishypothetical rate amounts to 87 percent of the actual growth in incar-ceration rates occurring 1980–2000. In other words, these tabulationsindicate that deinstitutionalization over this period can account for nomore than 13 percent of the corresponding growth in incarceration. Tobe sure, the estimated contributions to incarceration growth are smallerwhen we assume lower transinstitutionalization rates (7 percent assum-ing a transfer rate of .5 and 3 percent assuming a transfer rate of .25).
This content downloaded from 169.229.139.238 on Wed, 25 Jun 2014 21:24:30 PMAll use subject to JSTOR Terms and Conditions

D E I N S T I T U T I O N A L I Z AT I O N A N D I N C A R C E R AT I O N / 209
While the potential contribution to overall incarceration growth isrelatively modest, the potential contribution to growth in incarcerationlevels of the mentally ill is much larger. In Table 1, we presented estimatesfrom inmate surveys finding that 14.3 percent of state prison inmates,6.1 percent of federal prison inmates, and 14.7 percent of local jailinmates had a prior diagnosis of severe mental illness. Combining theselifetime prevalence rates with 2000 correctional population totals sug-gests that in 2000 there were roughly 277,000 incarcerated severelymentally ill individuals (66 percent of whom were in state or federalprison). The hypothetical estimate in Figure 7 assuming a one-for-onetransfer rate suggests that deinstitutionalization contributed a maximumof 129 persons per 100,000 residents to the adult incarceration rate in2000. With approximately 108 million adults ages 18–64 in 2000, thiscontribution translates into 140,000 additional prisoners (roughly halfof the population of incarcerated persons with severe mental illness).Moving beyond upper-bound estimates requires that we generate moreprecise estimates of the transinstitutionalization rate. We turn next tothis estimation challenge.
4. ESTIMATING THE TRANSFER RATE FROM MENTAL HOSPITALIZATION TO
INCARCERATION
There are a number of reasons to suspect that the empirical relationshipbetween the mental hospital inpatient rate and the incarceration rateshould be heterogeneous, with a stronger empirical association in latteryears and perhaps a stronger association for certain demographic sub-groups. Given the differences between the forces driving early deinsti-tutionalization (new drug therapies and the incentives created by Med-icare) and the forces driving latter declines (legal challenges toinvoluntary commitments), it is likely that deinstitutionalization fol-lowed a chronologically selective path, with the least ill and perhaps theleast prone to felonious behavior deinstitutionalized first. This alonesuggests that the impact of declining inpatient populations on prisonpopulation growth may be larger during the latter decades of the twen-tieth century.
Beyond selective deinstitutionalization, the impact of declining hos-pitalization rates on prison counts should interact with the degree ofstringency in sentencing policy. In other words, a one-person decline inthe mental hospitalization rate will have a larger impact on incarcerationthe more likely society is to incarcerate a criminal offender and the longer
This content downloaded from 169.229.139.238 on Wed, 25 Jun 2014 21:24:30 PMAll use subject to JSTOR Terms and Conditions
210 / T H E J O U R N A L O F L E G A L S T U D I E S / V O L U M E 4 2 ( 1 ) / J A N U A R Y 2 0 1 3
the effective prison sentence. A further concern is the possibility thatincreases in incarceration may reverse cause declines in the mental hos-pital population, to the extent that the mentally ill get caught up incorrectional systems or if corrections expenditures displace expenditureson mental health services.7 Both suspicions are plausible, as the likeli-hood of being sent to prison conditional on committing a crime hasincreased,8 as has the share of state budgets devoted to operational andcapital correctional expenditures. In our empirical estimate, we can ruleout the possibility of a reverse-causal effect of prison population growthon the pace of deinstitutionalization by exploiting variation in this paceoccurring across demographic groups within states. However, a reverse-causal effect operating through a higher competing risk of incarcerationfor the mentally ill in recent years will qualify the causal interpretationof the estimates below.
In the remainder of Section 4, we present a series of estimates of thetransinstitutionalization rate between mental hospitals and prisons thatattempt to account for some of these factors. We first estimate the em-pirical relationship during the early phases of deinstitutionalization(1950–80). We then present estimates for the period 1980–2000.
4.1. Estimates for 1950–80
To estimate the transinstitutionalization rate for this early phase of de-institutionalization, we employ data from the PUMS files for the 1 per-cent sample of demographics for people and housing units from the U.S.Census of Population and Housing for the years 1950, 1960, 1970, and1980. Again, the data from these census years permit separate identifi-cation of those institutionalized in mental hospitals and those institu-tionalized in jails or prisons. For each year, we estimate the proportionin mental hospitals and the proportion incarcerated for demographicsubgroups defined by state of residence, gender, the eight age groups ofadults 18–64 listed in Table 5, and our four mutually exclusive race orethnicity groups. We estimate a series of models in which the dependentvariable is the group-specific intercensus change in the incarceration rateand the key explanatory variable is the corresponding change in themental hospitalization rate.
7. Indeed, Ellwood and Guetzkow (2009) find that correctional expenditures displacespending on budget items usually covered by state health services departments.
8. Raphael and Stoll (2009) demonstrate that between 1984 and 2002 the admissionsrates into U.S. prisons increased sharply, as did the expected value of time served conditionalon the conviction offense.
This content downloaded from 169.229.139.238 on Wed, 25 Jun 2014 21:24:30 PMAll use subject to JSTOR Terms and Conditions

D E I N S T I T U T I O N A L I Z AT I O N A N D I N C A R C E R AT I O N / 211
The model specification that we estimate for each gender is given by
DIncarceration p a � b � d � g DHospitalization � � , (3)tsgra tsg sgr sga g tsgra tsgra
where t indexes specific 10-year periods, s indexes states, g indexes gen-der, r indexes race or ethnicity, a indexes age groups, DIncarcerationtsgra
is the intercensus change in the incarceration rate for a specific 10-yearperiod in state s for the gender-race-age group, and DHospitalizationtsgra
is the corresponding change in the mental hospitalization rate. The termsatsg, bsgr, dsga, and gg are parameters to be estimated, and �tsgra is a randomerror term.
Note that the key parameter of interest, gg, is permitted to vary bygender. We expect a priori that this coefficient should be negative forboth genders but perhaps larger in absolute value for men than forwomen. The specification includes decade-state-gender fixed effects tocontrol for any corrections policy changes that may vary across decadesand have differential impacts on gender groups. These fixed effects alsocontrol for a possible reverse-causal impact of incarceration growth onhospitalization rates operating through state budgetary displacement,assuming that the impact of such budgetary pressures is the same withingender. The state-gender-race fixed effects adjust both series for averagedifferences in 10-year changes in incarceration and hospitalization ratesthat vary by state, gender, and race, while the state-gender-age fixedeffects account for similar differences along groups defined by this tripleinteraction. In addition, we also estimate equation (3) separately foreach of the four racial or ethnic groups, effectively interacting all of thefixed effects with race and permitting the gender-specific transinstitu-tionalization parameter to vary for each racial or ethnic group. All mod-els are weighted by the number of observations used to compute theincarceration rate in the starting year of the change observation. Finally,in calculating standard errors for our parameters, we cluster on gender-race-state-age cells.
Table 7 presents estimation results for the period 1950–80. The tablereports estimates of the transinstitutionalization parameter for variousgroups from several alternative specifications. There is essentially noevidence of a negative relationship between incarceration and hospital-ization rates during this early period. The coefficients are relatively smalland statistically insignificant, and few have the theoretically expectedsign. Thus, we conclude that during the early phases of deinstitution-
This content downloaded from 169.229.139.238 on Wed, 25 Jun 2014 21:24:30 PMAll use subject to JSTOR Terms and Conditions
212 / T H E J O U R N A L O F L E G A L S T U D I E S / V O L U M E 4 2 ( 1 ) / J A N U A R Y 2 0 1 3
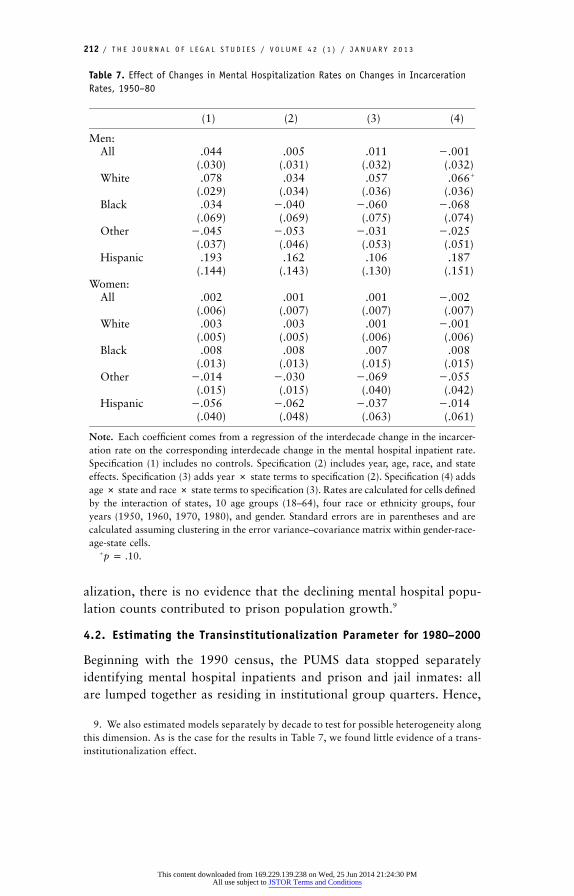
Table 7. Effect of Changes in Mental Hospitalization Rates on Changes in IncarcerationRates, 1950–80
(1) (2) (3) (4)
Men:All .044
(.030).005
(.031).011
(.032)�.001(.032)
White .078(.029)
.034(.034)
.057(.036)
.066�
(.036)Black .034
(.069)�.040(.069)
�.060(.075)
�.068(.074)
Other �.045(.037)
�.053(.046)
�.031(.053)
�.025(.051)
Hispanic .193(.144)
.162(.143)
.106(.130)
.187(.151)
Women:All .002
(.006).001
(.007).001
(.007)�.002(.007)
White .003(.005)
.003(.005)
.001(.006)
�.001(.006)
Black .008(.013)
.008(.013)
.007(.015)
.008(.015)
Other �.014(.015)
�.030(.015)
�.069(.040)
�.055(.042)
Hispanic �.056(.040)
�.062(.048)
�.037(.063)
�.014(.061)
Note. Each coefficient comes from a regression of the interdecade change in the incarcer-ation rate on the corresponding interdecade change in the mental hospital inpatient rate.Specification (1) includes no controls. Specification (2) includes year, age, race, and stateeffects. Specification (3) adds year # state terms to specification (2). Specification (4) addsage # state and race # state terms to specification (3). Rates are calculated for cells definedby the interaction of states, 10 age groups (18–64), four race or ethnicity groups, fouryears (1950, 1960, 1970, 1980), and gender. Standard errors are in parentheses and arecalculated assuming clustering in the error variance–covariance matrix within gender-race-age-state cells.
� .p p .10
alization, there is no evidence that the declining mental hospital popu-lation counts contributed to prison population growth.9
4.2. Estimating the Transinstitutionalization Parameter for 1980–2000
Beginning with the 1990 census, the PUMS data stopped separatelyidentifying mental hospital inpatients and prison and jail inmates: allare lumped together as residing in institutional group quarters. Hence,
9. We also estimated models separately by decade to test for possible heterogeneity alongthis dimension. As is the case for the results in Table 7, we found little evidence of a trans-institutionalization effect.
This content downloaded from 169.229.139.238 on Wed, 25 Jun 2014 21:24:30 PMAll use subject to JSTOR Terms and Conditions

D E I N S T I T U T I O N A L I Z AT I O N A N D I N C A R C E R AT I O N / 213
Figure 8. Scatterplot of the changes in the mental hospital inpatient rate by state, 1980–2000
the exact equation that we estimate for the earlier phase of deinstitu-tionalization cannot be estimated for this latter phase. However, theability to separately identify mental hospital inpatients in 1980, coupledwith the fact that the mental hospital population declined to very lowlevels by 2000 (despite substantial population growth over this timeperiod), does allow us to construct a proxy for the actual change inhospitalization rates occurring within demographic groups.
To be specific, we gauge the change in hospitalization rates 1980–2000 by �1 times the base hospitalization level in 1980. This approx-imation would be exact if the mental hospital population declined tozero by 2000. As this is not the case, however, we sought corroboratingevidence on the suitability of our proxy in state-level data on state andcounty mental hospital populations for this time period. Figure 8 pres-ents a state-level scatterplot of the change in mental hospital inpatientsper 100,000 residents 1980–2000 against the mental hospital inpatientrate in 1980. As is evident in the figure, the base level in 1980 is a verystrong predictor of the overall change in hospitalization rates over thesubsequent 2 decades. The slope coefficient on the bivariate regressionline fitted to the data is near �1 (�.73, with a standard error of .04),and the explanatory power of this simple regression is quite high (R2 p
This content downloaded from 169.229.139.238 on Wed, 25 Jun 2014 21:24:30 PMAll use subject to JSTOR Terms and Conditions

214 / T H E J O U R N A L O F L E G A L S T U D I E S / V O L U M E 4 2 ( 1 ) / J A N U A R Y 2 0 1 3
.87). Hence, the 1980 hospitalization value provides a strong proxy forthe subsequent change in hospitalization rates through 2000.10
For the period 1980–2000, we thus estimate the equation
DIncarceration p a � b � g Hospitalization_1980 � � , (4)gsra gsr gsa g gsra gsra
where all dimensions and variables are as defined above and where wehave substituted the base mental hospitalization rate for the actualchange. There are a few differences between this model and that specifiedfor the earlier period that bear mentioning. First, since we observe onlyone change per demographic group (following from the fact that wecannot observe hospitalization rates for 1990), we dropped the timeterm and all interactive fixed effects with time. Second, since we cannotseparately identify the incarcerated from mental hospital inpatients in2000, we effectively assume that all adults within our age range of studywho are in institutional group quarters in 2000 are incarcerated in pris-ons or jails. Hence, the change in incarceration for each group is mea-sured by the overall institutionalization rate in 2000 for that group minusthe proportion incarcerated in 1980. Similar to the results for the earlierperiod, we also estimate equation (4) separately for each racial or ethnicgroup. The one necessary change when we estimate separate models byrace or ethnicity is that we must drop the gender-state-age interactionssince there is only one observation per age group in each state. Again,all models are weighted by the number of observations used to computethe incarceration rate in the starting year of the change observation. Weestimate the model in equation (4) using data from the PUMS files forthe 5 percent sample of demographics for people and housing units fromthe U.S. censuses for 1980 and 2000.
Table 8 presents the results from this analysis. The first column pres-ents estimates of the coefficient on the 1980 hospitalization rate11 whenno other controls are added to the model. The second column presentsestimates of the transinstitutionalization effect from estimating the com-plete specification in equation (4). There is considerably stronger evi-dence of transinstitutionalization during this latter period, especially for
10. We also produced similar graphs using specific demographic cohorts for early decadesfor which we can observe mental hospitalization for both the beginning and ending years(for example, the change from 1970 to 1980 in the Public Use Microdata Samples data).These analyses produced similar results—that is, base-level institutionalization rates arestrong predictors of the actual changes occurring within specific demographic groups.
11. Before estimating the regression, we multiplied the base hospitalization rate by �1.With this transformation, evidence of a transinstitutionalization effect would require anegative statistically significant coefficient on the pseudochange in hospitalization.
This content downloaded from 169.229.139.238 on Wed, 25 Jun 2014 21:24:30 PMAll use subject to JSTOR Terms and Conditions
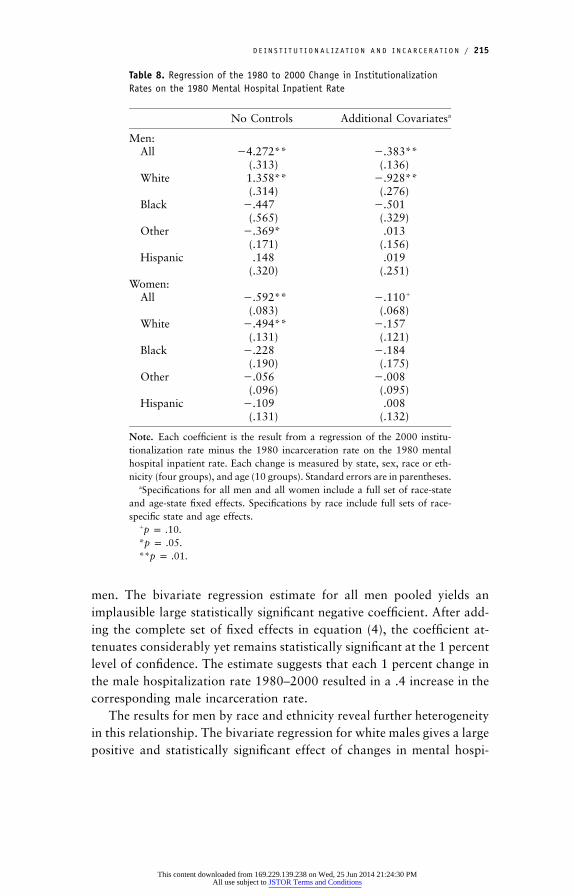
D E I N S T I T U T I O N A L I Z AT I O N A N D I N C A R C E R AT I O N / 215
Table 8. Regression of the 1980 to 2000 Change in InstitutionalizationRates on the 1980 Mental Hospital Inpatient Rate
No Controls Additional Covariatesa
Men:All �4.272**
(.313)�.383**(.136)
White 1.358**(.314)
�.928**(.276)
Black �.447(.565)
�.501(.329)
Other �.369*(.171)
.013(.156)
Hispanic .148(.320)
.019(.251)
Women:All �.592**
(.083)�.110�
(.068)White �.494**
(.131)�.157(.121)
Black �.228(.190)
�.184(.175)
Other �.056(.096)
�.008(.095)
Hispanic �.109(.131)
.008(.132)
Note. Each coefficient is the result from a regression of the 2000 institu-tionalization rate minus the 1980 incarceration rate on the 1980 mentalhospital inpatient rate. Each change is measured by state, sex, race or eth-nicity (four groups), and age (10 groups). Standard errors are in parentheses.
aSpecifications for all men and all women include a full set of race-stateand age-state fixed effects. Specifications by race include full sets of race-specific state and age effects.
� .p p .10* .p p .05** .p p .01
men. The bivariate regression estimate for all men pooled yields animplausible large statistically significant negative coefficient. After add-ing the complete set of fixed effects in equation (4), the coefficient at-tenuates considerably yet remains statistically significant at the 1 percentlevel of confidence. The estimate suggests that each 1 percent change inthe male hospitalization rate 1980–2000 resulted in a .4 increase in thecorresponding male incarceration rate.
The results for men by race and ethnicity reveal further heterogeneityin this relationship. The bivariate regression for white males gives a largepositive and statistically significant effect of changes in mental hospi-
This content downloaded from 169.229.139.238 on Wed, 25 Jun 2014 21:24:30 PMAll use subject to JSTOR Terms and Conditions
216 / T H E J O U R N A L O F L E G A L S T U D I E S / V O L U M E 4 2 ( 1 ) / J A N U A R Y 2 0 1 3
talization on incarceration. The corresponding result from the completespecification, however, yields a statistically significant (at the 1 percentlevel) negative impact for white males. In fact, the estimate suggests anear one-for-one transfer rate from mental hospitals to prisons for whitemen over this time period. For black males, the bivariate estimate isnegative yet statistically insignificant, while the estimate from the com-plete specification is negative (�.501) yet imprecisely estimated. The p-value on this coefficient is .130. For other men and Hispanic men, thereis no evidence of transinstitutionalization.
The results for women indicate that the relationship between thehospitalization rate and the incarceration rate is substantially weakerthan that observed for men. For women overall, the coefficient estimateon the pseudochange in hospitalization is statistically significant andnegative in both the bivariate model and the complete specification (atthe 1 percent and the 10 percent levels, respectively). The magnitudesof these estimates, however, are substantially lower than those observedfor men. While there are several negative coefficients in the race- orethnicity-specific estimate for women, none of the estimates from thecomplete model specification are statistically significant.
Thus, we do find evidence of transinstitutionalization for the latterphases of deinstitutionalization but not for the first few decades of theprocess. This pattern is in line with expectations, as deinstitutionalizationproceeded in a chronologically selective manner and since those dein-stitutionalized after 1980 (either literally through release or effectivelyby not being admitted to a mental hospital when in the past they wouldhave been) were subject to increasingly harsh penalties for criminal ac-tivity.
4.3. Did Stiffer Sentencing Policies Drive the Decline in MentalHospital Inpatient Populations?
In the introduction to Section 4, we raised two potential alternativeinterpretations of a negative relationship between mental hospitalizationand incarceration rates, both in which changes in the incarceration rateare reverse causing the decline in the mental hospital inpatient popu-lation (the opposite of what we are hypothesizing). First, budgetarypressures caused by an increasing prison population may force states topare back resources allocated to state mental hospitals. We believe thatour empirical methodology addresses this particular threat to internalvalidity by the inclusion of state fixed effects in our change regressionsand the analysis of multiple demographic groups within states.
This content downloaded from 169.229.139.238 on Wed, 25 Jun 2014 21:24:30 PMAll use subject to JSTOR Terms and Conditions

D E I N S T I T U T I O N A L I Z AT I O N A N D I N C A R C E R AT I O N / 217
The second reverse-causal explanation operates through an enhancedrisk of incarceration due to sentencing changes enhancing the competingrisk of incarceration for the mentally ill. Policies that increase the ex-tensiveness and intensity of the use of prison as punishment will increasethe likelihood that an untreated mentally ill person gets caught up inthe criminal justice system, perhaps precluding an involuntary commit-ment to a mental hospital. The qualitative interpretation of the largementally ill population currently behind bars is substantially differentunder this alternative scenario. Rather than deinstitutionalization effec-tively hoisting the mentally ill into state corrections systems, a moreaggressive sentencing structure is capturing and punishing the mentallyill with incarceration, effectively diverting these individuals away fromstate mental health systems.
While this subtle difference in interpreting an inverse relationshipmay appear to be splitting hairs, the importance of this distinction ex-tends beyond mere semantics. If deinstitutionalization post-1980 is re-sponsible for this inverse relationship, then it must necessarily be thecase that the reduction in the likelihood of a mental health interventionhas resulted in more crime, and by extension more victims of crime,than the nation would have experienced had this change not occurred.On the other hand, if newly aggressive sentencing is driving the inverserelationship, then the criminal justice system is simply more likely toincarcerate (and perhaps incarcerate for longer periods) those amongthe mentally ill who commit felonies. Under such circumstances, crimemay actually decrease because of greater incapacitation.
One way to address this more subtle identification problem wouldbe to find a third factor that affects mental hospitalization rates butaffects prison populations only indirectly through its impact on hospi-talization. With such a variable, we could reestimate the models in Tables7 and 8 and use instrumental variables rather than ordinary least squaresestimation. We were unable to identify such a variable that varies at thelevel of demographic groups that we employ in this paper. One possibilitythat we explored in detail is to use interstate differences in the stringencyof laws pertaining to the involuntary commitment of the mentally illand reestimate our model using state-level data on incarceration andhospitalization. The intuition here is that states with more stringentstandards should have exogenously lower mental hospital populations.Quantifying these standards across states and over time, however, provedto be quite difficult. First, the language of state statutes is quite similar,and thus it is difficult to identify differences that in practice would result
This content downloaded from 169.229.139.238 on Wed, 25 Jun 2014 21:24:30 PMAll use subject to JSTOR Terms and Conditions
218 / T H E J O U R N A L O F L E G A L S T U D I E S / V O L U M E 4 2 ( 1 ) / J A N U A R Y 2 0 1 3
in differences in hospitalization rates. For example, all states allow forthe involuntary civil commitment of those who, as a result of theirillnesses, pose a danger to themselves or others. The primary existingdifferences pertain to whether someone who is “gravely ill” (unable tocare for oneself) can be involuntarily committed and the evidentiaryrequirements stipulated in the legislation (Ross, Rothbard, and Shinnar1996). We were unable to find a strong first-stage effect of this statutoryvariation on hospitalization rates.12
Second, the existing body of state case law plays an important rolein determining how easy or hard it is to commit someone involuntarily(Brakel, Parry, and Weiner 1985; LaFond and Durham 1992). Giventhat this case law is not necessarily reflected in the language of statestatutes and given the enormity of the task of categorizing the body ofcases related to involuntary commitment proceedings, using variation instate precedents does not appear to be a viable identification strategy.
In light of this potential identification problem, we must place aqualification on the interpretation of our estimation results. Essentially,the negative partial correlation between incarceration and hospitaliza-tion rates that we observe for some demographic groups for the period1980–2000 may reflect both causal effects of deinstitutionalization onprison populations and stiffer sentencing policies increasing the likeli-hood that the competing risk of prison wins out over that of mentalhospitals for the mentally ill. While a causal impact of deinstitutional-ization must necessarily result in additional crime and victimization togenerate the imprisonment increase, a causal effect in the opposite di-rection likely prevents crime through the earlier and perhaps longerincapacitation of the criminally active mentally ill. That being said, bothcausal stories imply that more mentally ill persons serve time in prisonsand jails instead of receiving treatment in mental hospitals as a resultof these policy shifts.
12. We estimated several alternative two-stage least squares models using a single yearof cross-sectional state observations and two alternative characterizations of state invol-untary-commitment laws. In the first model, we used data from the 1980s and a classifi-cation scheme developed by Ross, Rothbard, and Shinnar (1996). While we did find aweak first-stage relationship, the standard errors from the two-stage least squares modelfor our parameter of interest were too large to draw any conclusive inferences. For thesecond model, we used a classification scheme constructed by the American Bar Foundation(Parry 1994) characterizing state laws as of 1994, but we found no first-stage relationship.The two classification schemes are sufficiently different to prevent their combination toform a 2-year panel.
This content downloaded from 169.229.139.238 on Wed, 25 Jun 2014 21:24:30 PMAll use subject to JSTOR Terms and Conditions

D E I N S T I T U T I O N A L I Z AT I O N A N D I N C A R C E R AT I O N / 219
5. DISCUSSION
The estimation results from Section 4 can be used to estimate the pro-portion of prison population growth attributable to those who in yearspast would likely have been mental hospital inpatients. Using the gender-specific transinstitutionalization parameter estimates for the 1980–2000period, our estimates suggest that such individuals account for 4 percentof the incarceration growth during this period. Employing the transin-stitutionalization parameters estimated separately by gender and race,our models suggest that the incarceration of those who would haveformerly been hospitalized accounts for 7 percent of the prison popu-lation growth between 1980 and 2000. Thus, despite the impressionscreated by the juxtaposition of aggregate trends, deinstitutionalizationis not the smoking gun behind the tremendous growth in incarcerationrates. While a significant contributor, mental health policy is of second-order importance when compared with the contribution by shifts insentencing policy occurring in most states.
Nonetheless, it is certainly the case that a relatively high proportionof the currently incarcerated mentally ill would not have been incarcer-ated in years past and would likely be receiving inpatient treatment ina mental health facility. For the year 2000, our estimates indicate thatthere are 40,000–72,000 incarcerated individuals who in years pastwould likely have been mental hospital inpatients. Relative to a popu-lation of 277,000 severely mentally ill persons, this increase constitutes14–26 percent of the mentally ill incarcerated population.
Certainly, it would be preferable from the viewpoints of the mentallyill and of crime victims to intervene prior to the commission of a felony.There is research evidence that mental health interventions impact vi-olent crime levels, suggesting that the criminal activity associated withmental illness could be prevented through channels other than the crim-inal justice system. Perhaps most relevant to the present paper, Harcourt(2006) finds significant relationships between total institutionalizationrates inclusive of mental hospital inpatients and state-level homicide,suggesting that the withdrawal of service in the form of the shutteringof mental hospitals leads to more crime. A more positive developmentconcerns the findings of Marcotte and Markowitz (2009). The authorsdemonstrate a negative association between increases in prescriptionsfor antidepressants and attention deficit hyperactivity disorder medica-tion and violent crime. Both papers suggest that the current criminal
This content downloaded from 169.229.139.238 on Wed, 25 Jun 2014 21:24:30 PMAll use subject to JSTOR Terms and Conditions

220 / T H E J O U R N A L O F L E G A L S T U D I E S / V O L U M E 4 2 ( 1 ) / J A N U A R Y 2 0 1 3
activity attributable to the mentally ill is not a necessary a consequenceof their illnesses.
In addition, interventions that prevent incarceration among thosewith severe mental illness would certainly benefit those diverted fromprisons and jails. The regimented, often predatory, environment commonin U.S. prisons is not an ideal setting for treating mental illness. It islikely the case that the mentally ill are at elevated risk for assault andvictimization while incarcerated and likely receive insufficient mentalhealth services.
REFERENCES
Brakel, Samuel J., John Parry, and Barbara A. Weiner. 1985. The Mentally Dis-abled and the Law. 3rd ed. Chicago: American Bar Foundation.
Daly, Rich. 2008. People with Mental Illness Target of New Gun Law. PsychiatricNews 43(3):1.
Ellwood, John W., and Joshua Guetzkow. 2009. Footing the Bill: Causes andBudgetary Consequences of State Spending on Corrections. Pp. 207–38 inDo Prisons Make Us Safer? The Benefits and Costs of the Prison Boom,edited by Steven Raphael and Michael Stoll. New York: Russell Sage Foun-dation.
Foley, Henry A., and Steven S. Sharfstein. 1983. Madness and Government: WhoCares for the Mentally Ill? Washington, D.C.: American Psychiatric Press.
Frank, Richard G., and Shelly Glied. 2006. Better but Not Well: Mental HealthPolicy in the United States Since 1950. Baltimore: Johns Hopkins UniversityPress.
Frank, Richard G., and Thomas G. McGuire. 2009. Mental Health Treatmentand Criminal Justice Outcomes. Working Paper No. 15858. National Bureauof Economic Research, Cambridge, Mass.
Gottesman, Irving I. 1991. Schizophrenia Genesis: The Origins of Madness. NewYork: W. H. Freeman.
Harcourt, Bernard. 2006. Should We Aggregate Mental Hospitalization andPrison Population Rates in Empirical Research on the Relationship betweenIncarceration and Crime, Unemployment, Poverty, and Other Social Indi-cators? Public Law and Legal Theory Working Paper No. 114. University ofChicago Law School, Chicago.
James, Doris J., and Lauren E. Glaze. 2006. Mental Health Problems of Prisonand Jail Inmates. Report No. NCJ 213600. Washington, D.C.: Office of Jus-tice Programs, U.S. Bureau of Justice Statistics.
Jencks, Christopher. 1994. The Homeless. Cambridge, Mass.: Harvard Univer-sity Press.
This content downloaded from 169.229.139.238 on Wed, 25 Jun 2014 21:24:30 PMAll use subject to JSTOR Terms and Conditions

D E I N S T I T U T I O N A L I Z AT I O N A N D I N C A R C E R AT I O N / 221
Johnson, Braden Ann. 1990. Out of Bedlam: The Truth about Deinstitution-alization. New York: Basic Books.
Kessler, Ronald C., Patricia Berglund, Olga Demler, Robert Jin, Kathleen R.Merikangas, and Ellen E. Walters. 2005. Lifetime Prevalence and Age ofOnset Distributions of DSM-IV Disorders in the National Comorbidity Sur-vey Replication. Archives of General Psychiatry 62:593–602.
Kessler, Ronald C., Katherine A. McGonagle, Shanyang Zhao, Christopher B.Nelson, Michael Hughes, Suzann Eshleman, Hans-Ulrich Wittchen, andKenneth S. Kendler. 1994. Lifetime and 12-Month Prevalence of DSM-III-RPsychiatric Disorders in the United States. Archives of General Psychiatry51:8–19.
LaFond, John Q., and Mary L. Durham. 1992. Back to the Asylum: The Futureof Mental Health Law and Policy in the United States. New York: OxfordUniversity Press.
Marcotte, Dave E., and Sarah Markowitz. 2009. A Cure for Crime? Psycho-pharmaceuticals and Crime Trends. Working Paper No 15354. National Bu-reau of Economic Research, Cambridge, Mass.
Mechanic, David, and David A. Rochefort. 1990. Deinstitutionalization: AnAppraisal of Reform. Annual Review of Sociology 16:301–27.
Monahan, John. 1992. Mental Disorder and Violent Behavior: Perceptions andEvidence. American Psychologist 47:511–21.
Palermo, George B., Maurice B. Smith, and Frank J. Liska. 1991. Jails versusMental Hospitals: A Social Dilemma. International Journal of Offender Ther-apy and Comparative Criminology 35:97–106.
Parry, John. 1994. Survey of Standards for Extended Involuntary Commitment.Mental and Physical Disability Law Reported 18:329–36.
Penrose, Lionel. 1939. Mental Disease and Crime: Outline of a Comparative Studyof European Statistics. British Journal of Medical Psychology 18:1–15.
Rabkin, Judith Godwin. 1979. Criminal Behavior of Discharged Mental Patients:A Critical Appraisal of the Research. Psychological Bulletin 86:1–27.
Raphael, Steven. 2000. The Deinstitutionalization of the Mentally Ill and Growthin the U.S. Prison Population: 1971 to 1996. Unpublished manuscript. Uni-versity of California, Goldman School of Public Policy, Berkeley.
Raphael, Steven, and Michael Stoll. 2009. Why Are So Many Americans in Prison?Pp. 27–72 in Do Prisons Make Us Safer? The Benefits and Costs of the PrisonBoom, edited by Steven Raphael and Michael Stoll. New York: Russell SageFoundation.
Ross, Ruth E., Aileen B. Rothbard, and Arie P. Schinnar. 1996. A Framework forClassifying State Involuntary Commitment Statutes. Administration and Policyin Mental Health 23:341–56.
Steadman, Henry J., Edward P. Mulvey, John Monahan, Pamela Clark Robbins,Paul S. Applebaum, Thomas Grisso, Loren H. Roth, and Eric Silver. 1998.Violence by People Discharged from Acute Psychiatric Inpatient Facilities and
This content downloaded from 169.229.139.238 on Wed, 25 Jun 2014 21:24:30 PMAll use subject to JSTOR Terms and Conditions

222 / T H E J O U R N A L O F L E G A L S T U D I E S / V O L U M E 4 2 ( 1 ) / J A N U A R Y 2 0 1 3
by Others in the Same Neighborhoods. Archives of General Psychiatry 55:393–401.
Torrey, E. Fuller. 1997. Out of the Shadows: Confronting America’s Mental IllnessCrisis. New York: John Wiley & Sons.
U.S. Department of Justice. Bureau of Justice Statistics. 2007. Survey of Inmatesin State and Federal Correctional Facilities, 2004. Ann Arbor, Mich.: Inter-university Consortium for Political and Social Research (distributor).
———. 2012. Survey of Inmates in Local Jails, 2002. Ann Arbor, Mich.: Inter-university Consortium for Political and Social Research (distributor).
Werth, James L. 2001. U.S. Involuntary Mental Health Commitment Statutes:Requirements for Persons Perceived to Be a Potential Harm to Self. Suicideand Life-Threatening Behavior 31:348–57.
This content downloaded from 169.229.139.238 on Wed, 25 Jun 2014 21:24:30 PMAll use subject to JSTOR Terms and Conditions