assessing the cytotoxicity of select antimicrobial peptides in the treatment of...
TRANSCRIPT

ASSESSING THE CYTOTOXICITY OF SELECT ANTIMICROBIAL PEPTIDES IN THE TREATMENT OF TUBERCULOSIS
by
Joshua Feldmiller
BS Psychology and History of Art and Architecture, University of Pittsburgh, 2008
Submitted to the Graduate Faculty of
the Department of Infectious Diseases and Microbiology
Graduate School of Public Health in partial fulfillment
of the requirements for the degree of
Master of Public Health
University of Pittsburgh
2018

ii
UNIVERSITY OF PITTSBURGH
GRADUATE SCHOOL OF PUBLIC HEALTH
This essay is submitted
by
Joshua Feldmiller
on
August 10, 2018
and approved by
Essay Advisor: Joshua T Mattila, PhD _________________________________ Assistant Professor Infectious Diseases and Microbiology Graduate School of Public Health University of Pittsburgh Essay Reader: Berthony Deslouches, MD, PhD _________________________________ Research Assistant Professor Microbiology and Molecular Genetics School of Medicine University of Pittsburgh

iii
Copyright © by Joshua Feldmiller
2018

iv
ABSTRACT
Tuberculosis (TB) remains a leading cause of death despite the availability of drug
treatments. Antibiotic resistance resulting from human behavior and genetic mutation has led to
the development of both multi drug-resistant and extensively drug-resistant tuberculosis, further
complicating successful intervention. Antimicrobial peptides (AMPs) present a novel alternative
to standard antibiotic therapies. In this study, we used flow cytometry to measure the
cytotoxicity of three different synthetic AMPs (A4S7, D8 and WLBU2) on human monocyte-
like cell lines and macaque macrophages. Both WLBU2 and A4S7 were associated with
significant cell death (p < 0.05) at, and above, concentrations of 10 μM, and the results for D8
varied by cell type. The data obtained in this study will inform future experiments on bacteria
and co-infected cells, from which the plausibility of specific AMPs as treatments for
Mycobacterium tuberculosis can be assessed and provide insights of clear public health
significance.
Joshua T Mattila, PhD
ASSESSING THE CYTOTOXICITY OF SELECT ANTIMICROBIAL PEPTIDES IN THE TREATMENT OF TUBERCULOSIS
Joshua Feldmiller, MPH
University of Pittsburgh, 2018

v
TABLE OF CONTENTS
PREFACE .................................................................................................................................... IX
1.0 INTRODUCTION ........................................................................................................ 1
2.0 MATERIALS AND METHODS ................................................................................ 7
2.1 DATA ANALYSIS ............................................................................................... 7
2.2 TOXICITY ASSAY USING U937 CELLS: TRIALS 1 – 2 ............................. 7
2.3 TOXICITY ASSAY USING U937 CELLS: TRIALS 3 – 4 ............................. 9
2.4 TOXICITY ASSAY USING U937 CELLS: TRIALS 5 – 7 ............................ 9
2.5 TOXICITY ASSAY USING THP-1 CELLS: TRIALS 1 – 3 ........................ 10
2.6 TOXICITY ASSAY USING A549 CELLS: TRIALS 1 – 2 .......................... 11
3.0 RESULTS ................................................................................................................... 12
3.1 TOXICITY ASSAY USING U937 CELLS: TRIAL 1 ................................... 12
3.2 TOXICITY ASSAY USING U937 CELLS: TRIALS 1 – 2 ........................... 13
3.3 TOXICITY ASSAY USING U937 CELLS: TRIALS 3 – 4 .......................... 14
3.4 TOXICITY ASSAY USING U937 CELLS: TRIALS 5 – 7 ........................... 15
3.5 TOXICITY ASSAY USING THP-1 CELLS: TRIALS 1 – 3 ........................ 16
3.6 TOXICITY ASSAY USING A549 CELLS: TRIALS 1 – 2 ........................... 18
4.0 DISCUSSION ............................................................................................................. 20
4.1 FUTURE DIRECTIONS................................................................................... 24

vi
BIBLIOGRAPHY ....................................................................................................................... 25

vii
LIST OF TABLES
Table 1: Dunnett’s Multiple Comparisons Test of Peptide vs Controls: U937 Cells ................... 15
Table 2: Dunnett’s Multiple Comparisons Test of Peptide vs Controls: THP-1 Cells ................. 17
Table 3: Dunnett’s Multiple Comparisons Test of Peptide vs Controls: A549 Cells ................... 18

viii
LIST OF FIGURES
Figure 1: Toxic Effects of AMPs on U937 Cells, Trial 1 ............................................................. 12
Figure 2: Toxic Effects of AMPs on U937 Cells, Trials 1 – 2 ..................................................... 13
Figure 3: Toxic Effects of AMPs on U937 Cells, Trials 3 – 4 ..................................................... 14
Figure 4: Toxic Effects of AMPs on U937 Cells, Trials 5 – 7 ..................................................... 15
Figure 5: Toxic Effects of AMPs on THP-1 Cells, Trials 1 – 3 ................................................... 16
Figure 6: Toxic Effects of AMPs on A549 Cells, Trials 1 – 2 ..................................................... 18

ix
PREFACE
I would like to extend my sincerest thanks to Dr. Mattila and Dr. Deslouches for their guidance
and support throughout the process of writing this essay. I would also like to thank the members
of Dr. Mattila’s lab, Beth Junecko and Dr. Jia Yao Phuah, for their instruction and unwavering
patience. There is little doubt that my success is due, in no small part, to their collective
contributions, and I would invite them to share in the satisfaction that comes from this
achievement.
This assembly of experiments, while introductory in complexity to the seasoned
immunologist, is the result of countless hours of laboratory training that I was fortunate to
receive from some of the most highly skilled individuals. It is humbling to admit that you know
very little, but not nearly as humbling as the moment when you realize how little you actually
knew. There are few moments more personally insightful and professionally rewarding, and I
would like to thank everyone who contributed to that end.
1
1.0 INTRODUCTION
Tuberculosis (TB), an infection caused by Mycobacterium tuberculosis, is the ninth leading
cause of death worldwide [1]. Compared to both the leading and second leading causes of death
(ischaemic heart disease and stroke, respectively), communicable diseases like tuberculosis
cannot simply be prevented through behavioral or lifestyle changes [1]. The total number of
individuals killed by this pathogen, to date, is estimated to be over 1 billion, with an additional
1.37 million deaths occurring in 2016 [1]. Following genetic analysis of tissue samples,
exhumed Egyptian mummies from 2050 BCE were found to have M. tuberculosis DNA; a
sobering fact that speaks to both the historic resilience of this unique microorganism and an
intergenerational human dilemma [2]. The World Health Organization (WHO) reports that $6.9
billion was allocated in 2017 for addressing global tuberculosis prevention, case identification,
and treatment, which is $2.3 billion less than the total amount the WHO estimated to be
necessary for a comprehensive response [3]. This figure discounts an additional $9 billion in
research and development estimated to be necessary for just 2017 [3]. Financially, deaths
resulting from tuberculosis impact GDP to an even greater extent. In 2014 there were $50.4
billion in estimated GDP losses (excluding health spending) attributed to 753,000 TB deaths
occurring only within the WHO-defined African Region [4]. Infected individuals that are too ill
to work, isolated to prevent transmission of TB, or both, are unaccounted for in these financial

2
models, suggesting that estimates of the economic impact of TB significantly underrepresent the
true economic impact of TB in this region
While the global financial consequences of tuberculosis infections are staggering, the
burden of new infections is disproportionately disseminated around the world. As of 2016, 87%
of the 10.4 million new TB cases arose in WHO-defined South-East Asia, Africa, and Pacific
regions [3]. The majority of new TB infections were identified in India with 2.79 million
identified cases, which translates to 109-345 new infections per 100,000 people [3]. In response
to the continued epidemic, the WHO proposed the “End TB Strategy” that aims to reduce new
TB cases by 90% and TB-derived deaths by 95% between 2015 and 2035, with a 50% reduction
in incidence and a 75% reduction in mortality benchmark by 2025 [5]. A feasibility study was
conducted in 2016 that employed 11 different mathematical models to try and determine if the
2025 benchmark was plausible in high-burden countries, where the need for success is greatest.
The authors concluded that while significant reductions in infectious burden were possible with
current approaches, the cumulative consequence of massive increases in all individual
interventions would still be insufficient to reach WHO goals in high-burden countries like India
and China [6]. In short, the evidence suggests that the global community is presently under-
funding a strategy for combating an epidemic that, when adequately funded, would still fail to
meet its own goals in countries most affected.
M. tuberculosis, the primary causative agent of TB cases in humans, sits
phylogenetically alongside M. leprae (the causative agent of leprosy) in the Mycobacterium
genus [7]. The small (1-5 microns in diameter), curved bacillus is a non-motile obligate aerobe.
Human lungs provide an optimal environment for M. tuberculosis as a consistent source of
oxygen and a means for dissemination to new intra-host sites and transmission to new hosts [8].

3
Mycobacteria can survive in dry environments for up to five months without succumbing to
desiccation, in no small part because of their unique waxy layer of mycolic acids from which
their name derives [7, 8, 9]. This feature is highly immunogenic and promotes intra-host
survival but also likely contributes to host evasion as the bacteria can lie dormant in an infected
host for decades.
Despite the ability of mycobacteria to persist on dry surfaces, M. tuberculosis is not
transmitted from contact with infected surfaces [8]. Coughing, singing, or even speaking can
spread the bacteria through droplet transmission, but physical contact like kissing has not been
shown to result in transmission [7, 8]. Additionally, the probability of transmission is affected
by the duration of interactions between infected and uninfected individuals and ventilation in
confined spaces [8]. Friends and family members of infected individuals are encouraged to
employ social distancing to avoid infection, even in developed countries where incidence rates
are near zero [10]. However, self-segregation is a predictably unreasonable request for infected
individuals in developing countries where resources are scarce, and the healthcare infrastructure
is unstable.
A defining feature of M. tuberculosis is the unique intracellular approach by which it
evades host defenses. As the lungs are the initial site of M. tuberculosis infection, upon
inhalation, alveolar macrophages engulf the bacteria as part of the innate immune response [7, 8,
11]. Typically, bacteria-containing phagosomes combine with lysosomes leading to the contents
being degraded, but M. tuberculosis can prevent phago-lysosomal fusion [7, 11]. Having been
internalized by the macrophage but not degraded, the bacteria can evade the adaptive immune
response by preventing presentation of MHC II-bound peptide fragments to CD4+ T cells [7]. As
a result of the phagosome’s sustained integrity, the macrophage continues to release TNF-α,

4
consistently drawing the attention of additional immune cells. One suggested consequence of
this state of chronic inflammation is the formation of a granuloma: a massive ring of
macrophages and T-cells that encase the infected macrophages [7, 11]. The whole process is
reminiscent of a medieval army who, having failed to penetrate the city they intended to sack,
would surround the entire town, and wait for the denizens to starve. Deprived of nutrients and
oxygen, the bacteria are either rendered inert or enter a state of non-replication from which they
may emerge decades later [12]. The mechanism by which the bacteria maintain their integrity is
not well understood, but some evidence suggests that they may enter a form of sporulation, as
was demonstrated to occur in Mycobacterium marinum [13]. Latent TB Infection [LTBI] is such
a common outcome from exposure to TB that it is estimated that at least a quarter of the world’s
population is infected but shows no clinical signs [3]. TB is presently defined bimodally as
active vs. latent, but recent evidence from advanced imaging techniques and more extensive
cultures of patient samples suggest a redefinition. In the new approach, latency is presented as a
spectrum of symptoms, with more severe symptoms indicative of infection [14].
Despite the damage that tuberculosis has wrought, the continued presence of this
infectious pathogen has been associated with numerous breakthroughs that paved the foundation
for microbiology. Koch’s postulates on infectious etiology were first demonstrated with Mtb
bacillus, and the questionable results of isolation via sanitarium would, at least, provide the
institutional mindset for antiseptic environments during recovery [15]. In 1921, the BCG
(Bacille Calmette-Guerin) vaccine was introduced to prevent acquisition, and by the 1950’s there
were various successful chemotherapy options of promising success for individuals with latent
and active infections [15, 16].

5
Both a vaccine and a drug regimen exist, so why are so many people still dying? After
80 years of use, data shows that the BCG vaccine has limited efficacy preventing primary
infection and is presently only recommended by the WHO to HIV-negative newborns to prevent
extrapulmonary infections [15]. The present course of therapy for an individual with drug-
susceptible TB is a lengthy 6-month course of antimycobacterial drugs, beginning with a 2-
month course of rifampin, isoniazid, pyrazinamide, and ethambutol, and then a 4-month course
of only rifampin and isoniazid [16]. There are numerous drug combinations and schedules that
vary depending on drug-susceptibility, age, pregnancy status, location of TB infection,
concomitant immune disorders (HIV), and organ impairments (renal / hepatic) [16]. Adherence
to the full course of drugs is a major complication to treatment because of cost, availability of
drugs, discontinuation upon alleviation of symptoms and serious adverse events. Some
administration studies have shown rates of complete adherence to the full drug regimen as low as
51% [17]. The lack of adherence not only contributes to future infections, but also contributes to
the development of drug-resistant M. tuberculosis status. Multidrug-resistant TB [MDR TB] and
extensively drug-resistant TB [XDR TB] strains have emerged, and the recommended treatment
schedules are predictably more demanding than the drug-susceptible strains. Some studies show
efficacy with a 7-drug combination for 9 months, while others recommend less drugs for a longer
(20-month minimum) duration [16]. The intensity and duration of the regimen(s), the severity of
the side effects and the continued loss of life are clear signals that more effective interventions
are desperately needed.
In the absence of pharmaceutical interest in the development of new antibiotics, a novel
strategy for combatting infectious agents has emerged through the use of natural and synthetic
peptides with antimicrobial properties, or antimicrobial peptides (AMPs). AMPs are a diverse

6
collection of defensive compounds that exist as part of the innate immune response [18].
Compared to traditional antibiotics that aim to disrupt precise mechanisms, AMPs are broadly
effective as they (in the case of antibacterial peptides) target cell membranes with membrane
potentials outside the typical array for eukaryotic cells [19]. Through mutations, countless
conformational changes can be made to a cellular component to avoid disruption, but electrical
charge is fundamental and viable mutations are less common. By taking advantage of this
disparity, AMPs have a unique position of working as a targeted anti-infective and combating the
notion that resistance to any therapy is practically inevitable [18].
In this study, we aimed to acquire pilot data on the interactions between three synthetic
AMPs (A4S7, D8, and WLBU2) and human monocyte-like cell lines and macaque macrophages
to identify concentrations at which minimal cytotoxicity is observed. Although AMPs are
generally targeted at prokaryotic cells, they can have off-target effects that limit their usefulness.
WLBU2 has been demonstrated to effectively target P aeruginosa and S aureus in experimental
models [20]. The data obtained from this study will inform future experiments in bacterial
models (BCG and Mtb) to identify a minimum inhibitory concentration. This project has a clear
public health significance as it aims to provide the foundation for a proof-of-concept on the
utility of AMPs as a novel treatment for TB, a disease that claims the lives of millions of people
each year.

7
2.0 MATERIALS AND METHODS
2.1 DATA ANALYSIS
Flow cytometry data was analyzed using FlowJo v10 (BD Biosciences, San Jose, CA). Figures
and statistics were generated using GraphPad Prism version 7.00 for Windows (GraphPad
Software, La Jolla CA).
2.2 TOXICITY ASSAY USING U937 CELLS: TRIALS 1 – 2
To justify a possible intervention with AMPs in the treatment of Mtb infection, the first question
that was addressed experimentally was the plausibility of administration to human-like
monocytes. An aliquot of human histiocytic lymphoma U937 cells was thawed and introduced
into R10 Media (88% RPMI Culture Media with 1% L-Glutamine, 10% Fetal Bovine Serum, 1%
HEPES). To identify the logarithmic growth phase, cell density and media discoloration were
observed visually for up to four days, and verification of the presumed growth phase was
supported with Trypan Blue Exclusion Staining to obtain cell counts. Once the log phase had
been confirmed, a subculture was transferred to fresh R10 media and incubated again for four
days. No experiments were performed on the first passages to minimize cellular irregularities
due to cryopreservation.

8
In the absence of preliminary data, a wide range of peptide concentrations were used to
determine which concentration led to the largest amount of cytotoxicity. Five concentrations of
peptide (100 μM, 80 μM, 40 μM, 20 μM and 1 μM) were individually added to U937 cells for a
total volume of 250 μL per sample. This was done for each of the three experimental peptides
(A4S7, D8, WLBU2), totaling 15 conditional samples. Additionally, two 250 μL controls were
generated with 10 μL of PBS substituting for the deliberately absent peptides. The samples were
incubated for 24 hours. After 24 hours, the samples were centrifuged at 1800 rpm for 5 minutes
to form a pellet, the supernatant decanted and the pellet resuspended in a 100 μL mixture of PBS
and nucleic acid stains (SYTOX Orange and STYO9) in a 1:3000 dilution. The staining
procedure was performed in the dark for 15 minutes. After 15 minutes, the samples were washed
with 100 μL of PBS, spun at 1800 rpm for 5 minutes and the supernatant was decanted. The
washing process was completed three times in total. One of the two control samples was not
stained but was washed, consistent with the other samples. Following the removal of excess
stain, the samples were fixed in 2% paraformaldeyhde so they could be analyzed by flow
cytometry. SYTOX Orange positive cells were presumed dead (% dead cells), and the data
obtained can be found in Figure 1.
Following the completion of Trial 1, the experiment was repeated for reliability (Trial 2).
All study procedures implemented for Trial 1 were kept consistent except for a fresh U937
subculture. Trial 2 data obtained following flow cytometry was averaged with Trial 1 data and
displayed in Figure 2.

9
2.3 TOXICITY ASSAY USING U937 CELLS: TRIALS 3 – 4
The data obtained in Trials 1 and 2 suggested that the optimal peptide concentration for minimal
monocyte death might exist near the two lowest concentrations previously examined: 20 μM and
1 μM. A 5-fold dilution series was implemented for the new peptide concentrations, extending
slightly beyond the previously examined range: 40 μM, 8 μM, 1.6 μM, 0.32 μM, 0.064 μM,
0.0122 μM. The experiment was separated into two trials (3 and 4) to increase reliability and
they were carried out concurrently. The protocol for Trials 1 and 2 was repeated for Trials 3 and
4 with few deviations: new peptide concentrations (previously listed), fresh U937 cells, and the
use of 96-well plates which required less total volume per sample (200 μL). The “% dead cells”
obtained from Trials 3 and 4 was averaged and is displayed in Figure 3.
2.4 TOXICITY ASSAY USING U937 CELLS: TRIALS 5 – 7
U937 Trials 3 and 4 showed that the optimal peptide concentration was likely not less than 1 μM,
and Trials 1 and 2 showed that it likely did not exceed 20 μM. Trial 5 introduced a 2-fold
dilution series that peaked at 40 μM and extended just slightly below 1 μM with the following
concentrations: 40 μM, 20 μM, 10 μM, 5 μM, 2.5 μM, 1.25 μM and 0.65 μM. Trial 5 was
performed in triplicate (Trials 6 and 7), and the protocol was identical to Trials 3 and 4 except
for the new peptide concentrations. The SYTOX Orange positive cell (% dead cells) data
obtained using flow cytometry was averaged between the three trials and displayed in Figure 4
and data from statistical analyses are displayed in Table 1.

10
2.5 TOXICITY ASSAY USING THP-1 CELLS: TRIALS 1 – 3
The culture method employed for THP-1 cells was identical to the culture method for U937 cells.
The only exception was duration, as THP-1 cells often reach the log phase one day sooner than
U937 cells. A staining optimization protocol was developed to ensure that the SYTOX Orange
and SYTO9 stains were taken up by the THP-1 cells to a desirable degree. Untreated THP-1
cells were exposed to one of five concentrations of either SYTOX Orange or STYO9 nucleic
acid stains for 15 minutes. The cells were washed three times, fixed in 2% PFA and underwent
flow cytometry. SYTOX Orange at a 1:2000 dilution and STYO9 at a 1:4000 dilution resulted in
an emission signal within the preferred log range (103 – 105). The staining portion of the AMP
assay for the U937 cells was amended with these dilutions for THP-1 cells.
The antimicrobial peptide protocol for the U937 Trials 5 and 6 was replicated with the
same peptide concentrations (40 μM, 20 μM, 10 μM, 5 μM, 2.5 μM, 1.25 μM and 0.65 μM), but
with THP-1 cells instead of U937 cells. The THP-1 version of the AMP assay was done in
triplicate on a 96-well plate. SYTOX Orange positive cell (% dead cells) data obtained from
flow cytometry for THP Trials 1 – 3 is displayed in Figure 5 and data from statistical analyses
are displayed in Table 2.

11
2.6 TOXICITY ASSAY USING A549 CELLS: TRIALS 1 – 2
A549 cells are an adherent cell line unlike the THP-1 and U937 cells, so a modified AMP assay
was required. The A549 cells were cultured in a 96-well tissue culture treated plate and
incubated for one day so the cells could adhere and grow. After one day, the cells were exposed
to one of the three antimicrobial peptides at a concentration consistent with previous
experiments: 40 μM, 20 μM, 10 μM, 5 μM, 2.5 μM, 1.25 μM or 0.65 μM. The cells were then
incubated for an additional day with the added peptides. Two wells of A549 cells were not
exposed to any peptides (only PBS) throughout the experiment to function as controls. On the
third day, the media was discarded, the cells were washed and then stained with SYTOX Orange
(1:2000) and SYTO9 (1:4000) for 15 minutes. The stain dilutions had been determined during
an optimization protocol that ran concurrent with the THP-1 optimization protocol. After 15
minutes, the cells were washed with PBS and spun at 1800 rpm for 5 minutes, twice. 100 μL of
Trypsin was added to each well to detach the cells from the flat-bottom plates, and the cells were
transferred to a round-bottom plate. The cells were washed a final time to remove the Trypsin
and then resuspended in 2% PFA for flow analysis. SYTOX Orange positive cell (% dead cells)
data obtained from flow cytometry for A549 Trials 1 & 2 is displayed in Figure 6 and data from
statistical analyses are displayed in Table 3.

12
3.0 RESULTS
3.1 TOXICITY ASSAY USING U937 CELLS: TRIAL 1
% D e a d C e l l s ,
U n t r e a t e d C o n t r o l s =
3 %
1 0 0 8 0 4 0 2 0 11 0 0 8 0 4 0 2 0 1
1 0 0 8 0 4 0 2 0 1
0
2 0
4 0
6 0
8 0
1 0 0
P e p t i d e C o n c e n t r a t i o n ( µ M )
% D
ea
d C
ell
s
A 4 S 7
D 8
W L B U 2
Figure 1: Toxic Effects of AMPs on U937 Cells, Trial 1
Following flow cytometry on the experimental samples and controls for U937 Trial 1, the data
was stratified between cells positive and negative for SYTOX Orange, then expressed as
percentages. SYTOX Orange positive cells (% dead cells) data is shown. Only 3% of the
stained untreated controls were dead, denoted by a horizontal line on Figure 1. Concentrations
above 1 μM resulted in a substantial proportion of dead cells in all peptides, suggesting
concentrations >= 20 μM are cytotoxic to U937 cells when compared to untreated controls.

13
3.2 TOXICITY ASSAY USING U937 CELLS: TRIALS 1 – 2
1 0 0 8 0 4 0 2 0 11 0 0 8 0 4 0 2 0 1
1 0 0 8 0 4 0 2 0 1
0
2 0
4 0
6 0
8 0
1 0 0
P e p t i d e C o n c e n t r a t i o n ( µ M )
%
De
ad
Ce
lls
% D e a d C e l l s ,
U n t r e a t e d C o n t r o l s =
3 . 5 %
A 4 S 7
D 8
W L B U 2
Figure 2: Toxic Effects of AMPs on U937 Cells, Trials 1 – 2
The data from U937 Trial 2 reiterated the key finding from the data in U937 Trial 1. All
concentrations of peptide greater than 1 μM showed dramatically elevated percentages of overall
cell death. Interestingly, the 100 μM concentration of peptide D8 consistently returned fewer
dead cells than any other D8 concentration examined, excluding 1 μM D8. A possible
justification for this outcome is addressed in the discussion section. The untreated controls in
both Trials 1 and 2 consistently maintained a low (3-4%) dead cell count, which reiterates the
cytotoxicity of all three AMPs at higher concentrations.
14
3.3 TOXICITY ASSAY USING U937 CELLS: TRIALS 3 – 4
4 0 81 . 6
0 . 32
0 . 06 4
0 . 01 2
4 0 81 . 6
0 . 32
0 . 06 4
0 . 01 2
4 0 81 . 6
0 . 32
0 . 06 4
0 . 01 2
0
2 0
4 0
6 0
8 0
1 0 0
P e p t i d e C o n c e n t r a t i o n ( µ M )
%
De
ad
C e
lls
% D e a d C e l l s ,
U n t r e a t e d C o n t r o l s
= 6 %
A 4 S 7
D 8
W L B U 2
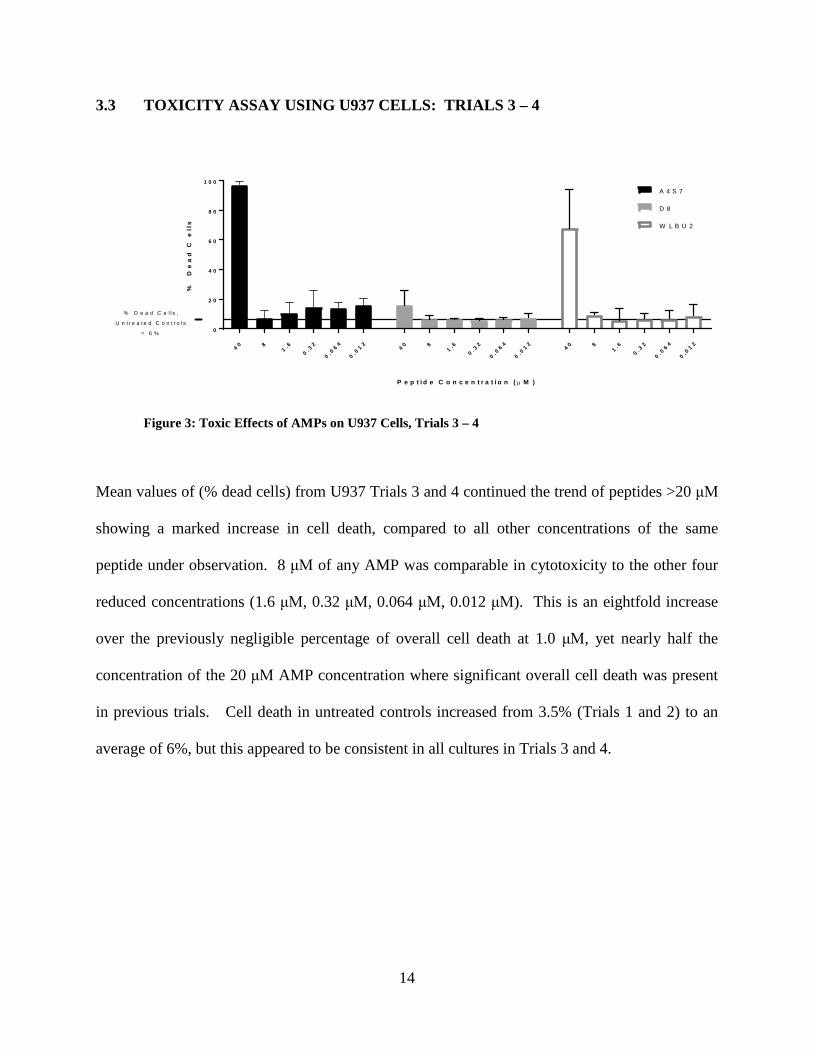
Figure 3: Toxic Effects of AMPs on U937 Cells, Trials 3 – 4
Mean values of (% dead cells) from U937 Trials 3 and 4 continued the trend of peptides >20 μM
showing a marked increase in cell death, compared to all other concentrations of the same
peptide under observation. 8 μM of any AMP was comparable in cytotoxicity to the other four
reduced concentrations (1.6 μM, 0.32 μM, 0.064 μM, 0.012 μM). This is an eightfold increase
over the previously negligible percentage of overall cell death at 1.0 μM, yet nearly half the
concentration of the 20 μM AMP concentration where significant overall cell death was present
in previous trials. Cell death in untreated controls increased from 3.5% (Trials 1 and 2) to an
average of 6%, but this appeared to be consistent in all cultures in Trials 3 and 4.

15
3.4 TOXICITY ASSAY USING U937 CELLS: TRIALS 5 – 7
4 0 2 0 1 0 52 . 5
1 . 25
0 . 62 5
4 0 2 0 1 0 52 . 5
1 . 25
0 . 62 5
4 0 2 0 1 0 52 . 5
1 . 25
0 . 62 5
0
2 0
4 0
6 0
8 0
1 0 0
P e p t i d e C o n c e n t r a t i o n ( µ M )
% D
ea
d
Ce
lls
A 4 S 7
D 8
W L B U
% D e a d C e l l s ,
U n t r e a t e d C o n t r o l s =
4 %
Figure 4: Toxic Effects of AMPs on U937 Cells, Trials 5 – 7
Table 1: Dunnett’s Multiple Comparisons Test of Peptide vs Controls: U937 Cells
Peptide Concentration (μM) Mean Diff. 95.00% CI of diff.
Adjusted P Value
A4S7 40 -82.6 -117.8 to -47.36 0.0001 A4S7 20 -77.73 -113 to -42.5 0.0001 A4S7 10 -37.47 -72.7 to -2.23 0.0327
D8 40 -54.37 -89.6 to -19.13 0.0008 WLBU2 40 -51.47 -86.7 to -16.23 0.0016 WLBU2 20 -77.17 -112.4 to -41.93 0.0001 WLBU2 10 -49.77 -85 to -14.53 0.0023
U937 Trials 5 - 7 further reinforce the data obtained from earlier trials with data from additional
peptide concentrations. A two-way ANOVA with Dunnett’s multiple comparisons test was
completed using GraphPad Prism. The mean percentage of dead cells of each experimental
AMP concentration was compared to the mean percentage of dead cells in untreated controls to

16
assess for significant differences (p value < 0.05), and all significant values are listed in Table 1.
Peptides A4S7 and WLBU2 showed significant differences in percentage of dead cells when
compared to controls for all concentrations >= 10 μM. Peptide D8 was only significantly
different (high percentage of dead cells) from the mean control value when the concentration was
at its highest: 40 μM. This suggests A4S7 and WLBU2 are more cytotoxic to U937 cells than
D8 at lower concentrations. As demonstrated in trials 3 and 4, there were still no significant
differences in percentage of dead cells between controls and any peptide concentrations <=5 μM,
suggesting peptides at this concentration are not killing U937 cells.
3.5 TOXICITY ASSAY USING THP-1 CELLS: TRIALS 1 – 3
4 0 2 0 1 0 52 . 5
1 . 25
0 . 62 5
4 0 2 0 1 0 52 . 5
1 . 25
0 . 62 5
4 0 2 0 1 0 52 . 5
1 . 25
0 . 62 5
0
2 0
4 0
6 0
8 0
1 0 0
P e p t i d e C o n c e n t r a t i o n ( µ M )
%
De
ad
C
ell
s
% D e a d C e l l s ,
U n t r e a t e d C o n t r o l s
= 2 . 8 %
A 4 S 7
D 8
W L B U
Figure 5: Toxic Effects of AMPs on THP-1 Cells, Trials 1 – 3

17
Table 2: Dunnett’s Multiple Comparisons Test of Peptide vs Controls: THP-1 Cells
Peptide Concentration (μM) Mean Diff. 95.00% CI of diff. Adjusted P
Value A4S7 40 -93.54 -114.7 to -72.35 0.0001 A4S7 20 -93.11 -114.3 to -71.91 0.0001 A4S7 10 -60.14 -81.33 to -38.95 0.0001
D8 40 -29.81 -51 to -8.614 0.0025 D8 20 -86.84 -108 to -65.65 0.0001 D8 10 -73.97 -95.17 to -52.78 0.0001 D8 5 -34.67 -55.87 to -13.48 0.0004
WLBU2 40 -93.97 -115.2 to -72.78 0.0001 WLBU2 20 -95.84 -117 to -74.65 0.0001 WLBU2 10 -93.64 -114.8 to -72.45 0.0001
Data from THP Trials 1 – 3 is provided above. When exposed to any of the three peptides at
concentrations >=20 μM, most THP-1 cells appear to be dead. At only 10 μM of any peptide, at
least 60% of THP-1 cells are dead, especially THP-1 cells exposed to WLBU2 (96% dead).
Based on a two-way ANOVA with multiple comparisons, a statistically significant difference (p
< 0.05) exists between the mean percentage of dead cells in untreated controls and any
experimental peptide at 10 μM or higher concentration (Table 2). At a peptide concentration of
5 μM, THP-1 cells exposed to D8 were most sensitive with 37% dead cells, then WLBU2 at
20%, and A4S7 at 9%. At 5 μM, D8 was the only peptide with a significant difference from the
control value (p = 0.0004). These results for D8 are in sharp contrast to those obtained in the
U937 trials, as D8 was comparably less cytotoxic at higher concentrations. All THP-1 cells
showed minimal cell death for any peptide at 2.5 μM or less and were not found to be
statistically significant when compared to control values at those concentrations.

18
3.6 TOXICITY ASSAY USING A549 CELLS: TRIALS 1 – 2
4 0 2 0 1 0 52 . 5
1 . 25
0 . 62 5
4 0 2 0 1 0 52 . 5
1 . 25
0 . 62 5
4 0 2 0 1 0 52 . 5
1 . 25
0 . 62 5
0
2 0
4 0
6 0
8 0
1 0 0
P e p t i d e C o n c e n t r a t i o n ( µ M )
%
De
ad
Ce
lls
% D e a d C e l l s ,
U n t r e a t e d C o n t r o l s =
2 1 . 4 %
A 4 S 7
D 8
W L B U
Figure 6: Toxic Effects of AMPs on A549 Cells, Trials 1 – 2
Table 3: Dunnett’s Multiple Comparisons Test of Peptide vs Controls: A549 Cells
Peptide Concentration (μM) Mean Diff. 95.00% CI of diff. Adjusted P Value A4S7 40 -49.25 -73.11 to -25.39 0.0001 A4S7 20 -37.1 -60.96 to -13.24 0.0012 A4S7 10 -30.25 -54.11 to -6.395 0.0089
WLBU2 40 -61.85 -85.71 to -37.99 0.0001 WLBU2 20 -60.9 -84.76 to -37.04 0.0001 WLBU2 10 -27.55 -51.41 to -3.695 0.0189
Data from A549 Trials 1 and 2 is displayed above. 21.4% of untreated controls were dead
following flow analysis, which was much higher than prior experiments, and is addressed in the
discussion. Despite this, significant differences between controls and peptide were observed.
At concentrations as low as 10 μM, A4S7 and WLBU2 produced significant (p < 0.05) cell death
when compared to untreated controls. No concentrations of A4S7 or WLBU2 below 10 μM
showed any meaningful differences from untreated controls in cell death. This finding is

19
consistent across all three types of human-like monocyte that were used in the study. No
concentration of D8 was associated with significant differences from untreated controls.

20
4.0 DISCUSSION
AMPs are widely used across the eukaryotic kingdom as a strategy to combat prokaryotic
pathogens. Despite the thousands of AMPs that have been discovered, little research has been
done on the interaction between mycobacteria and these first responders of the innate immune
system. The disinclination of AMPs to interact with our cells and to preferentially destroy non-
eukaryotic cells may have profound implications as a means of treatment. In this study, we
attempted to identify the concentrations at which three specific AMPs become cytotoxic to both
monocytes and epithelial cells during long (24-hour) exposures. The outcomes of these
concentrations can then be compared to parallel experiments with BCG and Mtb to identify a
possible minimum inhibitory concentration that attacks the bacteria with minimal collateral
damage to human cells.
U937 Trial 1 (Figure 1) suggested that, for all three peptides, the ideal concentration for
minimum cytotoxic impact was likely between 20 μM and 1 μM. Interestingly, very high
concentrations of D8 and WLBU2 produced unexpected amounts of cell death. In both peptides,
100 μM had a lower percentage of cell death than 20 μM of the same peptide. It may be that
extremely high concentrations of these peptides may not only perforate the cell membrane but
also cause significant damage to DNA. As STYOX Orange, a nucleic acid stain, would be
incapable of binding to the damaged DNA, the result is an underrepresented percentage of cell
death. The experiment was repeated to verify the notion that high concentrations of peptide

21
damage DNA, thus leading to low cell death, and not that the initial results were simply a
consequence of poor lab technique. Mean values for U937 Trials 1 and 2 (Figure 2) suggested
earlier assumptions were likely correct, as high concentrations of peptide returned low overall
percentages of cell death in each of the three peptides once again.
For U937 Trials 3 and 4, the intent was to capture cell death data in the 1 μM to 40 μM
range that was previously unexamined in detail and determine if the cells were predictably
insensitive to small concentrations of peptide. Therefore, a fivefold dilution series was
introduced. Mean values from U937 Trials 3 and 4 (Figure 3) fail to demonstrate any major
differences between concentrations of peptide < 8 μM and untreated controls. This was not a
surprising outcome as the cells were basically being incubated overnight in their preferred media
at these low peptide concentrations. The only unusual value was the low percentage of cell death
at 40 μM of D8, however given the high percentage of cell death in U937 Trials 1 and 2 at the
same concentration, the outcome was likely an outlier. It became clear that the range at which
cytotoxicity gradually decreases as concentrations decrease was going to be between 1 μM to 20
μM.
U937 Trials 5, 6 and 7 (Figure 4) utilize the concentrations that were reiterated
throughout the rest of the assays. After running the experiment in triplicate, A4S7 and WLBU2
displayed a clear contrast between 5 μM and 10 μM where, as measured by percentage of cell
death, the cytotoxic outcomes noticeably diverged despite the small range. The percentage of
cell death sharply dropped for D8 from noticeably cytotoxic to negligible as concentration
decreased. A multiple comparisons test was performed as the goal of the experiment to assess
cytotoxicity of each concentration, individually, against an untreated control. Dunnett’s test was
used because this particular test is ideal for analyses that compare many experimental outcomes

22
against the same control samples. Using an alpha of 0.05, Dunnett’s multiple comparisons test
confirmed that A4S7 and WLBU2 both showed significant differences in cell death for all
concentrations >= 10 μM when compared to untreated controls. This could indicate that both
peptides are unfavorable as treatment AMPs as 1) small changes in concentrations have dramatic
outcomes in cytotoxicity and 2) small concentrations are necessary for negligible human cell
cytotoxicity which might undermine effectiveness against bacteria. Conversely, a minimum of
40 μM of D8 was required to produce results significantly different than untreated controls, and
(assuming there is a concentration at which D8 is effective against bacteria like Mtb) the gradual
transition in cytotoxicity and low overall cytotoxic effects suggest D8 is a better, potential
therapeutic candidate.
THP-1 Trials 1, 2 and 3 (Figure 5) were undertaken to see if the results obtained in the
U937 trials were only applicable to that particular cell line, or if other monocytes would show
similar results. Based on mean percentage of cell death, THP-1 cells appeared to be more
sensitive to exposure to the various AMPs than their U937 counterparts. (Table 2) In both A4S7
and WLBU2, concentrations >= 10 μM were still necessary for a significant difference to emerge
from untreated controls, but the p values were less uncertain when compared to the U937 trials.
Interestingly, concentrations as low as 5 μM for D8 were sufficient to indicate a significant
difference from untreated controls. This is a sharp contrast from U937 trials and lends a degree
of uncertainty to the likelihood of D8 as a viable intervention option if we assume that THP-1
cells are a sufficient indicator of outcomes in actual human monocytes. While D8’s cytotoxicity
in this experiment may only be slightly higher than A4S7 and WLBU2, the inconsistency
between cell lines is a cause for concern.

23
The administration of AMPs in the treatment of Mtb could possibly be best accomplished
through inhalation, and not ingestion or intravenous administration. This has a few clear
advantages: 1) More targeted approach to the sites of infection, potentially increasing
effectiveness 2) Less opportunity for unintended side effects as the peptides are not circulating
through the body en masse before arriving at their destination, and 3) even if the peptides cannot
penetrate granulomas and destroy latent Mtb, they might be capable of clearing extracytosolic
bacteria and reduce transmission. Therefore, A549 Trials 1 and 2 (Figure 6) were completed to
observe the predicted effects of the experimental peptides on lung epithelia. If the peptides are
too toxic to be administered to lung cells, then the ability of the AMPs to degrade Mtb is largely
irrelevant. The adherent cell line required a greater degree of maintenance and manipulation
than the cells in suspension, and this likely contributed to the elevated percentage of cell death in
the untreated controls. (Table 3) Consistent with the previous experiments in non-adherent cells,
concentrations >= 10 μM in both A4S7 and WLBU2 demonstrated a significant difference in cell
death when compared to untreated controls. The consistency of A4S7 and WLBU2’s percentage
of cell death across all experimental cell lines is reassuring for making predictions, however the
cytotoxicity at lower concentrations continues to be a cause for concern. No concentration of D8
significantly differed from untreated controls at an alpha of 0.05. This outcome further
contributes to the inconsistency of D8’s cytotoxicity and complicates the possibility of the
peptide as a possible treatment tool.

24
4.1 FUTURE DIRECTIONS
The largest limitation of the study is the inability to do much with this information as the
bacterial assays are still presently underway. Each conclusion regarding the efficacy of
individual peptides are best interpreted tentatively until additional replications are completed. In
the future, administration of these seven concentrations of peptides will be repeated on BCG and
clinical isolates of Mtb. The minimum inhibitory concentration can be compared to the
cytotoxicity data obtained here to see if there exists a plausible intervention. Additional factors
like cytotoxicity over time will need to be introduced in the replications. A disk diffusion
protocol with BCG is presently ongoing to visually demonstrate the extent of each peptide’s
ability to inhibit growth. Lastly, we will want to repeat these experiments with BCG- and Mtb-
infected macrophages to determine whether AMPs have the ability to kill mycobacteria
extracellularly and intracellularly.
Despite the dearth of data on bacteria, we have learned a few important things. Both
WLBU2 and A4S7 are likely cytotoxic to monocytes and epithelial cells at concentrations >=10
μM for 24 hours of sustained exposure. This result was consistent and significant across all
repeated trials for both peptides. D8 has no significant cytotoxicity to A549 cells when
compared to untreated controls, limited cytotoxicity to U937 cells only at very high
concentrations and pronounced cytotoxicity to THP-1 cells at any concentration above 5 μM.
The inconsistency of D8 across cell types will likely pose a challenge to its use as a viable
treatment.

25
BIBLIOGRAPHY
1. World Health Organization. (2018, May 24). The top 10 causes of death. Retrieved 11 December 2017, from http://www.who.int/mediacentre/factsheets/fs310/en/
2. Zink, A., Sola, C., Reischl, U., Grabner, W., Rastogi, N., Wolf, H., & Nerlich, A. (2003). Characterization of Mycobacterium tuberculosis Complex DNAs from Egyptian Mummies by Spoligotyping. Journal of Clinical Microbiology, 41(1), 359-367. http://dx.doi.org/10.1128/jcm.41.1.359-367.2003
3. World Health Organization. (2017). Global tuberculosis report 2017. Retrieved 14 December 2017, from http://www.who.int/tb/publications/global_report/en/
4. Kirigia, J., & Muthuri, R. (2016). Productivity losses associated with tuberculosis deaths in the World Health Organization African region. Infectious Diseases of Poverty, 5(1). http://dx.doi.org/10.1186/s40249-016-0138-5
5. World Health Organization. (2015). World Health Organization: end TB strategy. Retrieved 4 January 2018, from http://www.who.int/tb/post2015_strategy/en/
6. Houben, R., Menzies, N., Sumner, T., Huynh, G., Arinaminpathy, N., & Goldhaber-Fiebert, J. et al. (2016). Feasibility of achieving the 2025 WHO global tuberculosis targets in South Africa, China, and India: a combined analysis of 11 mathematical models. The Lancet Global Health, 4(11), e806-e815. http://dx.doi.org/10.1016/s; 2214-109x(16)30199-1
7. Wessner, D., Charles, T., & Dupont, C. (2013). Microbiology. Hoboke, NJ: Wiley.
8. U.S. Health and Human Services, Centers for Disease Control and Prevention. (2013). Core curriculum on tuberculosis: what the clinician should know. Retrieved from https://www.cdc.gov/tb/education/corecurr/
9. Desikan, K.V. and Sreevatsa. (1995). Extended studies on the viability of Mycobacterium leprae outside the human body. Lepr. Rev, 66(4), 287–295.
10. Katz, R., & Vaught, A. (2016). Controlling Tuberculosis in the United States: Use of Isolation and Other Measures Throughout the Country. Disaster Medicine and Public Health Preparedness, 11(03), 337-342. doi: 10.1017/dmp.2016.138
11. Murphy, K., Weaver, C., Mowat, A., Berg, L., Chaplin, D., & Janeway, C. et al. (2017). Janeway's Immunobiology. New York: Garland Science.

26
12. Wayne, L., & Sohaskey, C. (2001). Nonreplicating Persistence of Mycobacterium Tuberculosis. Annual Review of Microbiology, 55(1), 139-163. doi: 10.1146/annurev.micro.55.1.139
13. Ghosh, J., Larsson, P., Singh, B., Pettersson, B., Islam, N., & Sarkar, S. et al. (2009). Sporulation in mycobacteria. Proceedings of the National Academy of Sciences, 106(26), 10781-10786. doi: 10.1073/pnas.0904104106
14. Barry, C., Boshoff, H., Dartois, V., Dick, T., Ehrt, S., & Flynn, J. et al. (2009). The spectrum of latent tuberculosis: rethinking the biology and intervention strategies. Nature Reviews Microbiology, 7(12), 845-855. doi: 10.1038/nrmicro2236
15. Daniel, T. (2006). The history of tuberculosis. Respiratory Medicine, 100(11), 1862-1870. doi: 10.1016/j.rmed.2006.08.006
16. Horsburgh, C., Barry, C., & Lange, C. (2015). Treatment of Tuberculosis. New England Journal of Medicine, 373(22), 2149-2160. doi: 10.1056/nejmra1413919
17. Volmink, J., & Garner, P. (2007). Directly observed therapy for treating tuberculosis. Cochrane Database of Systematic Reviews. doi: 10.1002/14651858.cd003343.pub3
18. Zasloff, M. (2002). Antimicrobial peptides of multicellular organisms. Nature, 415(6870), 389-395. doi: 10.1038/415389a
19. Bahar, A., & Ren, D. (2013). Antimicrobial Peptides. Pharmaceuticals,6(12), 1543-1575. doi: 10.3390/ph6121543
20. Deslouches, B., Phadke, S., Lazarevic, V., Cascio, M., Islam, K., Montelaro, R., & Mietzner, T. (2004). De Novo Generation of Cationic Antimicrobial Peptides: Influence of Length and Tryptophan Substitution on Antimicrobial Activity. Antimicrobial Agents and Chemotherapy, 49(1), 316-322. doi: 10.1128/aac.49.1.316-322.2005