assessing the e ectiveness of olap exploration approaches
TRANSCRIPT

Assessing the effectiveness of OLAP explorationapproaches
Technical report
Mahfoud Djedaini1, Pedro Furtado2, Nicolas Labroche1, Patrick Marcel1, andVeronika Peralta1
1 University of Tours, [email protected]
2 University of Coimbra, [email protected]
Abstract. Supporting interactive database exploration (IDE) is a prob-lem that attracts lots of attention these days. Exploratory OLAP (OLAP:On-Line Analytical Processing) is an important use case where tools sup-port navigation and analysis of the most interesting data, using the bestpossible perspectives. While many approaches were proposed (like queryrecommendation, reuse, steering, personalization or unexpected data rec-ommendation), a recurrent problem is how to assess the effectiveness ofan exploratory OLAP approach. In this paper we propose a benchmarkframework to do so, that relies on an extensible set of user-centric met-rics that relate to the main dimensions of exploratory analysis. Namely,we describe how to model and simulate user activity, how to formal-ize our metrics and how to build exploratory tasks to properly evaluateIDE systems under test (SUT). To the best of our knowledge, this is thefirst proposal of such a benchmark. Experiments are two-fold: first weevaluate the benchmark protocol and metrics based on synthetic SUTswhose behavior is well known. Second, we concentrate on two differentrecent SUTs from IDE literature that are evaluated and compared withour benchmark. Finally, potential extensions to produce an industry-strength benchmark are discussed in the conclusion.
1 Introduction
While there exist a set of benchmarks recognized by the database communityas relevant for evaluation and comparison of performance of database systems,such as the benchmarks from TPC organization, there is yet no commonly agreedupon benchmark for evaluating to what extent database systems help the userduring data exploration. Roughly speaking, TPC benchmarks assess data re-trieval, and not data exploration. However, supporting exploration of databasesis of prime importance, especially in a context of big, distributed and hetero-geneous data, as shown in a recent survey of the topic [17]. Both researchersand companies that supply data analysis tools are increasingly focused on mech-anisms for improving user experience, in particular aids for effective data ex-ploration. This is partly because better data exploration experiences will give a

competitive edge to the companies selling those tools. As researchers and com-panies implement, test and tune alike their Interactive Data Exploration (IDE)solutions, a major issue they face is how to assess and compare solutions, im-provements and alternatives.
In this work we focus on the context of OLAP analysis of data, as an im-portant use case of IDE. OLAP is defined as the process of analyzing multidi-mensional datasets (cubes), online, interactively, summarizing key performanceindicators (called measures) from different perspectives or axes of analysis (calleddimensions). For example, consider sales of products over time at different shops.Dimensions include product, time and shop, and measures include the amountof sales. Dimension hierarchies are another important concept as they allow an-alyzing data at different levels of detail. For instance, we might analyze salesby product, brand or type of product, taking advantage of a product hierarchy,study weekly, montly and yearly evolution, according to a time hierarchy, andcompare shops, locations, and zones, depending on the way shops are hierarchi-cally organized. Most frequent OLAP queries consist of aggregating measures atspecific hierarchical levels, and then comparing measure values, analyzing theimpact of specific dimensions, and explaining, somehow, the visualized values.Both beginner and proficient users need to navigate the cube in order to un-derstand the data and to accomplish their analysis tasks. We call this process,an interactive data exploration (IDE) approach. All kinds of data navigationaids, such as query reuse, query steering or query personalization, can be usedto suggest next course of actions to users during their exploration.
In order to motivate our work, let’s now consider the following toy example:a user navigating OLAP sales cube faces an unexpected difference between salesin year 2014 and year 2015 for a product P in France. The user will then explorethe surrounding region of the cube by mean of OLAP operators such as roll-up(at the Europe level for example), drill-down (at the month level for example)and slices (for other products) to find evidences that may explain and corrob-orate the first fact. The use might even get some support from a system thatautomatically proposes next moves in the analysis [2,13]. We consider that thesurrounding region of the first interesting fact corresponds to a neighborhoodthat has to be covered to ensure the exploration task success. If one wants toevaluate this particular data exploration, it is then possible to measure severalmetrics such as the number of queries that the user needed to cover this neigh-borhood, the ratio of this area that has been finally discovered, the ratio of therest of the cube that the user had to visit to reach this result etc. So far, theassessment of data exploration through quality measures has been overlookedby the database community, but we can benefit from experience in the fields ofinformation retrieval and exploratory search [34], which are particularly drivenby the quality of the user’s experience and metrics for measuring it.
In this paper we propose a benchmark to compare approaches for aidingin exploratory OLAP. The main objective of the benchmark is to provide aframework where a System Under Test (SUT) executes and produces suggestionsfor next data analysis moves, and those suggestions are evaluated according to

a set of metrics that measure the quality of exploration. In this way, a developercan easily test and evaluate alternatives. The benchmark can be used with anySUT, to evaluate any strategy that one may design. It reports objective measuresfor a set of metrics that characterize the degree to which the SUT fulfills certainobjectives.
The benchmark was designed with a set of guiding principles in mind. It hasto be easy to use by anyone, considering that a developer or researcher work-ing in an OLAP exploration tool or algorithm, should be able to quickly plughis approach to the benchmark and use it, without requiring complex develop-ment or setting up of schema, dataset or OLAP exploration characteristics. Thebenchmark should also return objective evaluation metric results that are inde-pendent of the approach being tested. This means that both the mechanisms ofthe benchmark and the evaluation metrics must be agnostic of the IDE approach.We fulfill this objective by making sure that the user and evaluation models ofthe benchmark are open and published as part of the benchmark specification,not based on some specific proposed exploratory OLAP approach, and by defin-ing metrics that classify the quality of exploratory OLAP using state-of-the-artquality-of-exploration metrics.
So far, the assessment of data exploration through quality measures has beenoverlooked by the database community, but we can benefit from experience inthe fields of information retrieval and exploratory search [34], which are partic-ularly driven by the quality of the user’s experience and metrics for measuringit. We were able to adapt metrics that include Engagement and Enjoyment,Information Novelty, Task Success, Task Time and Learning and Cog-nition to our context. For those identified metrics we defined how they shouldbe implemented and evaluated in exploratory OLAP.
We conduct two kind of experiments in order to validate the benchmarkand to compare actual exploratory OLAP approaches. For validation, we createthree ”synthetic” SUTs with expected outcomes: a baseline SUT which returnspurely random next move suggestions (called ”random”), and a naive SUT,which changes just one attribute in the query (called ”naive”). The comparisonof results between random and naive helps validate that the benchmark is ableto rank according to the quality of exploration.
Concerning evaluation of existing exploratory OLAP approaches, we analyzetwo state-of-the-art interactive data exploration approaches, Cinecubes [13], andfalseto [1], that are two different approaches that were never compared before.The ability to compare and to reach conclusions about these approaches usingthe benchmark shows the importance of the benchmark. With the benchmark,we can finally characterize and compare the approaches in an independent way.
The paper is organized as follows. Section 2 discusses related work. Section3 explains how interactive explorations can be scored and defines the bench-mark metrics. Section 4 presents the benchmark itself. First it describes how theSUT is interfaced with the benchmark, then it discusses how the benchmark isinitialized with data and sessions, and how it simulates the user accomplishingtasks and finding interesting answers to those tasks. Experimental results are

InputCategory DB instance Query log Current query Output
[6] Automatic exploration X X Tuples[2] Automatic exploration X X Sequence of queries[12] Automatic exploration X X X Queries[4] Automatic exploration X X Queries[13] Visual optimization X X Queries
Automatic exploration result highlighting[14] Visual optimization X Query[30] Data prefetching X X X Tuples[29,31] Data prefetching X X Tuples[18] Data prefetching X X Sequence of queries[28] Data prefetching X X Queries
Table 1. Interactive cube exploration techniques signatures
discussed in section 5, including both validation of the benchmark and analy-sis of existing exploratory OLAP approaches. Finally, section 6 concludes thepaper with considerations on potential extensions to produce industry-strengthbenchmark.
2 Related Work
The variety of database exploration approaches Many approaches have recentlybeen developed to support interactive database exploration (IDE), as illustratedby a recent survey of the topic [17]. Techniques range from Visual optimization(like query result reduction [5]), automatic exploration (like query recommen-dation [9]), assisted query formulation (like data space segmentation [32]), dataprefetching (like result diversification [19]) and query approximation [16]. Thecore of most of these approaches consists of a function that, given the databaseinstance and users’ history with the database (i.e., past and current queries),computes new relevant queries, tuples or visualizations that are meant to sup-port user exploration.
Given the exploratory nature of OLAP analysis of multidimensional data(see e.g., [30,18]), many exploration techniques have been specifically developedin the context of interactive OLAP exploration of data cubes. Table 1 lists theseexploration approaches, indicating their categories (in terms of those proposed in[17]), and report their inputs and outputs. For instance, the PROMISE prefetch-ing approach [28], that predicts a query based on a Markov Model constructedout of the server’s log, corresponds to a function with signature 〈L, 〈q〉〉 → 〈q′〉,where L is the query log, q is the current user query and q′ is the predictedquery.
Measuring the quality of an exploration Measuring the quality of exploration hasattracted a lot of attention in Information Retrieval, in particular in the field

of Exploratory Search3 [34] that can be defined as a search paradigm centeredon the user and the evolution of their knowledge. It is particularly driven bythe quality of the user’s experience, and metrics for measuring it have beencategorized as follows. Engagement and Enjoyment measures the ”degreeto which users are engaged and are experiencing positive emotions”. It includes”the amount of interaction required during exploration”, the ”extent to whichthe user is focused on the task”. Task Success assesses ”whether the userreaches a particular target” and finds a ”sufficient amount of information anddetails” along the way. Information Novelty measures the ”amount of newinformation encountered”. Task Time measures the ”time spent to reach a stateof task completeness”. Learning and Cognition measures the ”attainment oflearning outcomes”, ”the amount of the topic space covered” and ”the numberof insights acquired”. While these categories have been proposed in the contextof web search, they make perfect sense for interactive database exploration, andwe next focus on measures that have been proposed in the literature in thesecategories.
User engagement measures are popular in web search to measure how a useris engaged in using a website or search engine. Many implicit measures havebeen proposed [23] to track online behavior. These measures are classically cate-gorized in activity (how a website is used), loyalty (return of users to a website)and popularity (how much a website is used). While loyalty and popularity essen-tially make sense for relative comparison of websites, activity enables measuringengagement for a particular website independently of other websites. The mostcommonly used activity metrics include number of queries per session, numberof clicks, number of clicks per query, dwell (presence) time (see e.g., [10,33]).
Task success is well studied in information retrieval, with even conferencesdevoted specifically to this, like the TREC conference4. Task success is tradi-tionally measured with precision/recall-based measures, which supposes that thetarget of the task is known. In this case, roughly speaking, recall measures howcomplete the answer to a query is, while precision measures how noisy the answerto a query is.
Many works have been interested with measuring information novelty in re-lational databases. For instance, in [11], the authors propose to describe the dataspace covered by a session with a vector of the tuples accessed by the queriesof the session. In [24], the authors propose the notion of access area to capturethe portion of the dataset a user is interested in. In [19], the authors use a sim-ilar notion to propose query result diversification. In data cubes exploration,Sarawagi [30] assimilates novelty with the most informative constraints so thatthe expected distribution of a cube’s cell values - based on a maximum entropyprinciple - is closer to the actual observed values. Here, a constraint is defined atan aggregate level of the observed cells and is expressed as a sum over the valuesof a subset of the observed cells. It is then expected that bringing more con-straints modifies the expected distribution of values and thus allows to reduce
3 http://wp.sigmod.org/?p=11834 http://trec.nist.gov/

the divergence between the observation and the expectation. The constraintsthat best reduce this divergence is declared to be the most informative.
Measuring task time may seem straightforward, but one needs to carefullydefine what is timed and how to report it. Performance related metrics like queryper hour can be adapted from TPC benchmarks to this end.
Finally, measuring learning and cognition has attracted lots of attention inlearner models [8]. Learner models are central components of intelligent tutoringsystems, that infer a student’s latent skills and knowledge from observed data.A very influential and widespread accepted model is the Knowledge Tracingmodel [7]. Knowledge tracing is a Bayesian network allowing to measure theprobability that a skill is mastered when resolving a problem (opportunity to usethe skill). The model relies on four parameters, usually experimentally tuned:P (L0): the probability the skill is already mastered before the first problem,P (T ): the probability the skill will be learned at each opportunity to use theskill (transition from not mastered to mastered), g: the probability the resolutionis correct if the skill is not mastered (guess), s: the probability a mistake is madeif the skill is mastered (slip). The probability that the skill L at opportunity nis mastered is the probability the skill is learned at step n− 1 or not learned atstep n− 1 but learned at this step n. It can be computed as: P (Ln|Xn = xn) =P (Ln−1|Xn = xn) + (1− P (Ln−1|Xn = xn))× P (T ) where:
P (Ln−1|Xn = 1) = P (Ln−1)(1−s)P (Ln−1)(1−s)+(1−P (Ln−1))g
P (Ln−1|Xn = 0) = P (Ln−1)sP (Ln−1)s+(1−P (Ln−1))(1−g)
Xn = 1 (resp. 0) means problem n has been correctly (resp. not correctly)resolved.
Current benchmarks for decision support, big data and analytic workloads TPCproposes a number of popular benchmarks and metrics for assessing the per-formance of database systems, covering time, performance, price, availabilityor energy consumption (see Table 2). However, while TPC acknowledges theimportance of the explorative nature of decision support queries (see e.g., theOLAP interactive queries in the TPC-DS benchmark), none of the existing TPCmetrics are appropriate for measuring database exploration support in the senseof the categories proposed in Exploratory Search. A recent benchmark targetsanalytical workloads [22], but it too overlooks assessing the quality of interactivedata exploration by proposing metrics covering only query response time, tuningoverhead, data arrival to query time, storage size and monetary cost.
OLAP-specific literature for the benchmark implementation Interestingly, theliterature on OLAP already provides the building blocks for benchmarking cubeexploration. OLAP has been the subject of specific benchmarks, like the TPC-H-based Star Schema Benchmark (SSB) [25]. SSB models a realistic use case ofsales analysis, for which realistic instances with skewed data can be producedwith the PDGF data generator [26]. Realistic OLAP workloads can be gener-ated with the CubeLoad session generator [27]. CubeLoad takes as input a cubeschema and creates the desired number of sessions according to templates mod-

Metrics TPC-H TPC-DS TPC-DI TPCx-HS TPCx-BBQuery per hour X X XPrice/performance X X X X XAvailability date X X X X XPower/performance X X X XPower XThroughput X X X XLoad time XPower test elapsed time X
Table 2. Metrics of relevant TPC benchmarks
eling various user exploration patterns: users with limited OLAP skills pursuinga specific analysis goal, more advanced users navigating with a sequence of sliceand drill operations, users tracking unexpected results with explorative sessions.OLAP literature also provides techniques for characterizing analytic behaviors[28,4]. In these works, the user’s behavior is defined as a Markov model, whosestates are built from the past queries of the user, and the transitions betweenstates are weighted by the probability of observing a query after another inthe user’s query log. Finally, OLAP literature also provides characterizationsof interesting data in the multidimensional space. Discovery-driven analysis ofdata cube [29,30,31,6] aimed at measuring potentially surprising data, know-ing already evaluated queries. These work characterize surprising data as beinggroups of tuples that are connected (usually one OLAP operation apart), andthat, taken altogether, appear to be meaningful (usually unexpected, in the senseof e.g., information theoretic measures).
3 Evaluating an exploration
This section precisely describes how interactive explorations can be scored, byimplementing the metrics related to user experience identified in the previoussection. We first start with presenting formally the concepts needed to define anexploration in an OLAP context.
3.1 Exploration in an OLAP context
Our benchmark incorporates the explorative and interactive nature of IDE byconsidering user sessions as first class citizens. We define a session as a sequenceof queries over a datawarehouse and a log as a set of sessions. In what follows,a log can be associated to one particular user profile (representing this user’sactivity) or can represent the overall activity (being the union of all user logs).
Definition 1 (Session and log). A session s = 〈q1, . . . , qk〉 of length |s| = kis a sequence of k OLAP queries over a multidimensional schema. A log L ={s1, . . . , sp} is a finite set of sessions.

Fig. 1. Multidimensional schema used in the examples
The OLAP queries we consider are dimensional aggregate queries over a datacube [15]. To keep the formalism simple, we consider cubes under a ROLAP per-spective, described by a star schema [20]. We consider that a dimension consistsof one hierarchy, and we consider simple hierarchies without branches, i.e., con-sisting of chains of levels. Formally, a cube schema consists of i) n hierarchies,each hierarchy being a set Lev(hi) = {L0, . . . , Ld} of levels together with a roll-up total order �hi
of Lev(hi), ii) a measure attribute m, defined on a numericaldomain Dom(m). For a n-dimensional cube, a group-by set is an element ofLev(h1)× . . .× Lev(hn).
More precisely, let L be a set of attributes called levels, and for L ∈ L, amember is an element of Dom(L). A hierarchy hi is a set Lev(hi) = {L0, . . . , Ld}of levels together with a roll-up total order �hi
of Lev(hi), which is such that,for any Lj and Lk in Lev(hi), Lk �hi
Lj if Rollup(Lj) = Lk.A multidimensional schema (or, briefly, a schema) is a tripleM = 〈A,H,M〉
where:
– A is a finite set of levels, whose domains are assumed pairwise disjoint,– H = {h1, . . . , hn} is a finite set of hierarchies, (such that the Lev(hi)’s for
i ∈ {1, . . . , n} define a partition of A);– a finite set of measure attributes M , each defined on a numerical domain
Dom(m). In what follows we consider that M is a singleton.

Example 1. Figure 1 displays the conceptual model for a multidimensional schemathat will be used in the following examples. This schema is based on that of theSSB [25]. It is formalized by the triple SSB = 〈AS , HS ,MS〉 where:
– AS = {namec, cityc, nationc, . . .} is the set of all levels,– H = {hCUSTOMER, . . . , horderDATE} is the set of hierarchies, such that, for
instance, nationc �hCUSTOMERcityc
– MS = {SUMrevenue}, is the measure.
Definition 2 (OLAP query). A query q over a n-dimensional cube schema isa pair 〈g, P 〉 where g is a group by set and P = {p1, . . . , pn} is a set of Booleanpredicates, one for each hierarchy, whose conjunction defines the selection pred-icate for q; they are of the form L = v, or L ∈ V , with L a level, v a value, V aset of values. Conventionally, we note pi = TRUEi if no selection on hi is madein q (all values being selected);
Example 2. Consider schema SSB = 〈AS , HS ,MS〉. A query over this schemais q1 = 〈〈nationc, allp, yearod, allcd, alls〉, {TRUEc, TRUEp, yearod = 2014 or2015, TRUEcd, TRUEs}〉. It asks for the yearly revenue by customer nations,for year 2014 or 2015.
During their sessions, after each query is processed, users inspect the cubecells retrieved by the query. A cell is an element of a cube that has a particularcoordinate (called reference) and measure value. The answer to a query q =〈g, P 〉, denoted answer(q), is the set of cells whose references are defined by gand P .
Definition 3 (Cells). Let g = 〈L1, . . . , Ln〉 be a group by set. A referencer = 〈m1, . . . ,mn〉 is an element of Dom(g) = Dom(L1)× . . .×Dom(Ln). A cellis a pair 〈r, v〉 where r is a reference and v a numerical value in Dom(m).
Example 3. Here are two cells retrieved by query q1:c1 = 〈〈FRANCE, all, 2015, all, all〉, 10000〉,c2 = 〈〈Italy, all, 2015, all, all〉, 20000〉.
Thanks to the the popular OLAP operations (roll-up, drill-down, slice-and-dice), users navigate the cube by exploring cells neighborhood, by querying atcoarser granularity (roll-up), finer granularity (drill-down) or reaching siblingsin a hierarchy. This is formalized through relations between cells.
Let Lj and Lk be two levels of a hierarchy h such that Lk �h Lj , and letmj ∈ Dom(Lj) and mk ∈ Dom(Lk). We note mk �h mj if mj is the ancestor ofmk in hierarchy h. �h is a transitive relation whose transitive closure is denoted�∗h. We note mk ≈h mj if mj is the sibling of mk (they have the same directancestor) in hierarchy h. Given two cells c = 〈r, v〉 and c′ = 〈r′, v′〉, we considerthe classical roll-up relation over cells defined by: c �∗ c′ if, for all hierarchies hi
it is either r(i) = r′(i) or r(i) �∗hir′(i). The sibling relation between cells, noted
≈, is defined as c ≈ c′ if there exist a hierarchy hi for which r(i) ≈hir′(i)) while
for all other hierarchies j 6= i it is r(j) = r′(j).

Example 4. Consider cells c1 = 〈〈FRANCE, all, 2015, all, all〉, 10000〉,c2 = 〈〈Italy, all, 2015, all, all〉, 20000〉 from the previous example, and cellc2 = 〈〈Europe, all, 2015, all, all〉, 100000〉. It is c1 ≈ c2 and c1 � c3.
Definition 4 (Neighborhood of a cell). The rollup neighborhood of a cell cis the set of all cells c′ such that c′ �c c. The drilldown neighborhood of a cellc is the set of all cells c′ such that c �c c′. The sibling neighborhood of a cell cis the set of all cells c′ such that c ≈ c′. The OLAP neighborhood of a cell c isthe union of its rollup neighborhood, its drilldown neighborhood and its siblingneighborhood.
The neighborhood of a group of cells C, noted neighborhood(C) is the unionof the neighborhoods of each cell of the group. Intuitively, the neighborhood ofa group of cells defines a zone of the cube to be explored to analyze this groupof cell.
A user is represented by a log, i.e., the user’s past explorations. This allowsto characterize a user’s behavior by constructing a generative model, in the spiritof what has been successfully applied in OLAP for data prefetching [28]. We nowgive the formal definition the generative model representing a user’s behavior.
Definition 5 (Generative model). Let L be a set of sessions characterizinga user. The generative model to represent this user’s behavior is a Markov modelof order one, i.e., a graph 〈S, P 〉 where S is the set of queries of L and P :S×S → [0, 1] denotes the probability function for the state transition, computed
as P (q1, q2) = sessions(〈q1,q2〉)sessions(〈q1〉) where q1 and q2 are queries and sessions(s) gives
the number of sessions where the sequence s appears.
Definition 6 (User). Let S be a set of sessions and x be a percentage. A userux is a tuple ux = 〈slog, sseed, g〉 where S = slog ∪ sseed, |slog| = x× |S| and g isthe generative model built from slog.
Finally, a task for a session consists of a set of cells to be analyzed by a user.This set of cells is given under the form of a session, i.e., consists of the cellsretrieved by the queries of this session.
Definition 7 (Task). Let s be a session and u be a user. A task is a pair 〈s, u〉.
3.2 Metrics
We now present the metrics used to score an OLAP exploration. As explainedin Section 2, we adopt a categorization of the metrics proposed in the field ofExploratory Search [34]. For each category, we propose a primary metric and asecondary metric, with the idea that secondary metrics can be used to counter-balance primary ones. Note that metrics of different categories have been definedso that the overlapping between them is minimal: User engagement relates onlyto the number of queries, novelty to cells, task success to cell neighborhood andtask time only to time. Only Learning and cognition overlaps with novelty task

success since it aims at measuring the skill of finding new and relevant informa-tion. In what follows, let u = 〈slog, sseed, g〉 be a user, let t = 〈s0, u〉 be a taskfor user u and let s = 〈q1, . . . , qk〉 be a session produced for the resolution of atask t.
User engagement and enjoyment We use two popular and simple activity metricsused in web search: click depth as primary metric, to represent overall activity,and number of clicks per query to represent how focused this activity is. Dwelltime, another popular activity metric, better fits in the Task time category.In the web search context, a click correspond to following a hyperlink (i.e., anHHTP query). In the context of the benchmark, a click corresponds to a newquery. The metrics are defined as follows:
– Query depth (QD, primary) = k, i.e., the number of queries in thesession, needed for resolving a task.
– Focus (F, secondary) = max({|focus(q)||q∈s})|s| , where focus(q) = 〈q, . . . , q′〉 ⊆
S such that for all qi, qi+1 ∈ focus(q) the cells retrieved by qi+1 are in one ofthe neighborhood of the cells retrieved by qi. Intuitively, this is to measurefor a query q, the length of the chain of queries starting from q that aresuccessively distant of only one OLAP operation.
Information Novelty Capturing user interest in the data explored can be doneby measuring the access area [24]. In our context, this access area would be theset of tuples (recorded in a fact table) contributing to form the cells of a queryresult. As this area corresponds to tuples that are not actually presented asanswers to queries (since, being an OLAP context, these tuples are aggregated),data of interest is better captured with view area, i.e., the cells presented in theanswers. This is defined by: given a set of query Q = {q1, . . . , qn}, the view areaof Q is va(Q) =
⋃q∈Q answer(q).
In a view area, not all data is interesting in the sense that it brings novelknowledge.
We measure interestingness degree as a simple normalized entropy:
interest(C) =
(−
m∑i=1
p(i) log(p(i))
)/ log(m) (1)
with |C| = m, C(i) is the ith value of the set C and p(i) = C(i)∑mi=1 C(i) denotes the
estimated value of cell i or its probability.The primary metric then quantifies the amount of interesting data found in
the session. The secondary metric measures the increase in view area comparedto the user’s log view area.
The metrics are defined as follows:
– Relevant new information (RNI, primary) = maxq∈s(interest(va(q))).
– Increase in view area (IVA, secondary) = |va(s)\va(slog)||va(s)∪va(slog)| ,

Task Success Intuitively, a task consists of investigating what can be said of agroup of cells C coming from a task 〈s, u〉. The extent to which a task is completeconsists of assessing how much of the neighborhood of this group of cells hasbeen retrieved during the resolution of the task. A simple way of measuring it iswith recall and precision. Recall is the primary metrics since consistently withexploratory search, we consider OLAP navigation as a recall oriented activity(what matters most is to minimize the number of false negative). The metricsare defined as follows, for a group of cells C:
– Recall (R, primary) = |va(s)∩neighborhood(C)||neighborhood(c)| .
– Precision (P, secondary) = |va(s)∩neighborhood(C)||va(s)|
Task Time Measuring task time is done by adapting metrics of existing TPCbenchmarks. We need to measure the time for the SUT to produce its outputand to process the queries needed for the resolution of the task. The primarymetric comes from the TPC-DS benchmark and measures the number of queriesper the time taken to resolve the task. The secondary metric simply measuresthe task elapsed time. The metrics are defined as follows:
– Query per seconds (QpS, primary) = k√To×Te
, where To is the overall
time for the SUT to produce its outputs and Te is the overall query executiontime.
– Task elapsed time (TET, secondary) = To +Te, where To is the overalltime for the SUT to produce its outputs and Te is the overall query executiontime.
Learning and cognition We adapt the Knowledge Tracing model to our context.Recall that knowledge tracing is a Bayesian network for measuring the proba-bility that a skill is mastered when resolving a problem. In our context, the skillassessed is the ability of finding interesting information in the neighborhood ofa group of cells C, neighborhood(C).
The problem to solve (the opportunity to test the skill) is the creation of anew query, i.e., an opportunity to find more interesting cells in neighborhood(C).Xn = 1 if the nth query finds at least one more unknown cell of this neighborhoodwhere novelty increases for those cells compared to query n−1. It is 0 otherwise.
The challenge is then to define the four parameters of the knowledge tracing.In our context, it makes sense to set these parameters based on the generativemodel since this model represents the past of the user. Intuitively, the skillimproves if the queries of the past sessions retrieve cells that are novel and inthe neighborhood of C. Parameters P (L0), g and s are set as follows.
– P (L0) is the average novelty of the cells in neighborhood(C) retrieved bythe generative model, weighted by the fraction of cells of this neighborhoodin the generative model.
– P (g) is the probability that novelty increases for the cells in neighborhood(C),from one query to the next one in the generative model.

– P (s) is the probability that novelty decreases for the cells in neighborhood(C),from one query to the next one in the generative model.
– P (T ) is the proportion of queries of the sessions for which the novelty of cellsin the neighborhood of C increases compared to that of the previous query.
The primary metric is defined as in the classical knowledge tracing model,by: Learning (L, primary) = P (Ln|Xn = xn) = P (Ln−1|Xn = xn) + (1 −P (Ln−1|Xn = xn))×P (T ) where: P (Ln−1|Xn = 1) = P (Ln−1)(1−s)
P (Ln−1)(1−s)+(1−P (Ln−1))g
and P (Ln−1|Xn = 0) = P (Ln−1)sP (Ln−1)s+(1−P (Ln−1))(1−g) .
The secondary metric measures the average progression of the learning curve.It is defined by the geometric mean of the proportional growth of the probabili-ties: Learning growth rate (LGR, secondary) =
m∏i=1
(1 +
P (Li|Xi = xi)− P (Li−1|Xi−1 = xi−1)
P (Li−1|Xi−1 = xi−1)
)1/n
(2)
where n is the length of the session.
4 The Benchmark
We define a System Under Test (SUT) as being an Exploratory OLAP system tobe evaluated. The main functionality of an exploratory OLAP tool is to supportuser navigation over the data, to learn some insights from the data. Navigation isdefined as a sequence of views that corresponds to a sequence of queries that aresubmitted to the system. In this context, the sequences the SUT helps to developare the target of our evaluation. In this section we define the interface betweenthe SUT and the benchmark and how the benchmark runs an experiment.
4.1 Interfacing with a SUT
In order to assess a SUT, the benchmark, simulates a user and interacts withthe SUT. The SUT first builds its inner structures, if any, and obtains inputmetadata from the benchmark. Conceptually, a SUT requires as input all or partof the following parameters: the database (schema and instance), user traces (i.e.,sequences of queries collected into the query log) and the active user’s currentexploration (a sequence of queries). Let D denote the set of all database instancesfor a given schema, Q denotes the set of all possible queries over this schema,S denotes the set of all sequences of queries (i.e. Q × Q × . . . × Q), and 2A
denotes the power-set of a set A. The functionality of a SUT can be definedgenerically as doing the transformation: 〈D, 2S , S〉 → S. Once the SUT is ready,the evaluation protocol starts resolving a task, successively calling the SUT toprovide suggestions.
In practice, the benchmark is a Java program where SUTs can be pluggedto be evaluated. Its code and javadoc are available for SUT programmers on

BitBucket5. Basically, a SUT is sought twice, (1) before starting the evaluationso it can initialize, and (2) whenever a next move suggestions is requested. Fromthe benchmark point of view, SUTs are only seen as a black boxes that performwhat they are asked to perform, through a contract. Practically, a SUT is aclass that implements an interface that exposes two functions readMetadata andnextSuggestion. Function readMetadata is called before starting the actualevaluation process, so the SUT can read and initialize its internal structure. Itsparameter is a Metadata object whose getters allow to access the cube, the listof users, past user traces, etc. Function nextSuggestion is called many timesduring a task resolution. It provides to the SUT a given user and a currentexploration (sequence of queries), and asks the SUT to recommend. It is theresponsibility of the benchmark to orchestrate the whole process, and to makesure the functions are called with the right arguments.
4.2 How the Benchmark Works
The benchmark process is composed of three components. The first componentinitializes the benchmark. It generates the context: the database (i.e., the cube),some sequences of queries (i.e., the log), data skews to simulate interesting obser-vations, and creates user profiles. You do not need to run this component if youreuse an existing context, but you can also create a new context with differentschema or generation parameters.
The second component is responsible for the actual evaluation of a SUT. Theevaluation is a simulation of a user’s actual navigation, whereby the benchmarksuggests some initial sequence of queries asks the SUT for next move suggestions,then it proposes some continuation, it switches to ask the SUT again, and soon. This allows the benchmark to ask the SUT for suggestions multiple times,in multiple phases and focusing multiple view areas.
The third component is in charge of computing scores and reporting results.It considers the sessions produced with the SUT, and computes values for thequality metrics presented in Section 3.2. The final step is to provide a reportaggregating these metrics, the main output of the benchmarking process. if wedo so
4.3 Component 1: Benchmark Initialization
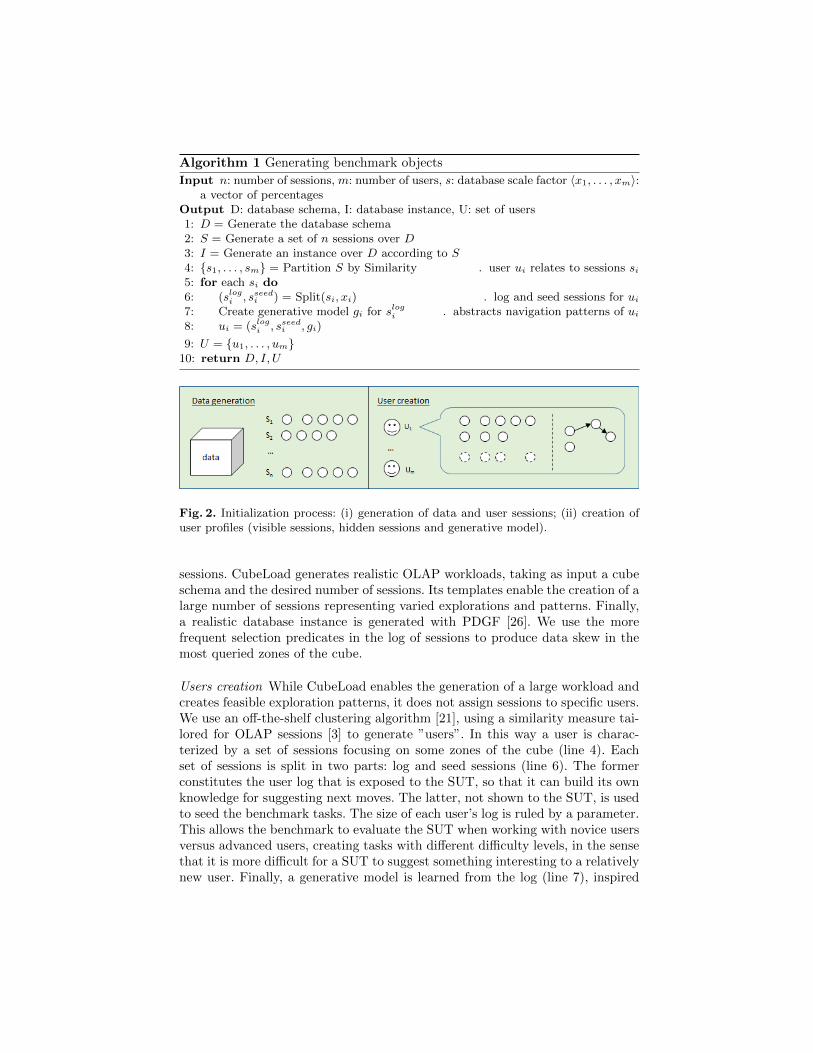
Initialization consists of the synthesis of an OLAP user environment. The bench-mark initialization process is sketched in Algorithm 1 and Figure 2, and consistsmainly of data creation and user generation.
Data generation An OLAP database (schema and instance) and a set of usersessions over it are generated in lines 1-3. The default database schema is theone of SSB benchmark [25], but the benchmark can be initialized with anyother OLAP schema. We use CubeLoad [27] for automatically generating user
5 https://bitbucket.org/mdjedaini/ea-benchmark
Algorithm 1 Generating benchmark objects
Input n: number of sessions, m: number of users, s: database scale factor 〈x1, . . . , xm〉:a vector of percentages
Output D: database schema, I: database instance, U: set of users1: D = Generate the database schema2: S = Generate a set of n sessions over D3: I = Generate an instance over D according to S4: {s1, . . . , sm} = Partition S by Similarity . user ui relates to sessions si5: for each si do6: (slogi , sseedi ) = Split(si, xi) . log and seed sessions for ui
7: Create generative model gi for slogi . abstracts navigation patterns of ui
8: ui = (slogi , sseedi , gi)
9: U = {u1, . . . , um}10: return D, I, U
Fig. 2. Initialization process: (i) generation of data and user sessions; (ii) creation ofuser profiles (visible sessions, hidden sessions and generative model).
sessions. CubeLoad generates realistic OLAP workloads, taking as input a cubeschema and the desired number of sessions. Its templates enable the creation of alarge number of sessions representing varied explorations and patterns. Finally,a realistic database instance is generated with PDGF [26]. We use the morefrequent selection predicates in the log of sessions to produce data skew in themost queried zones of the cube.
Users creation While CubeLoad enables the generation of a large workload andcreates feasible exploration patterns, it does not assign sessions to specific users.We use an off-the-shelf clustering algorithm [21], using a similarity measure tai-lored for OLAP sessions [3] to generate ”users”. In this way a user is charac-terized by a set of sessions focusing on some zones of the cube (line 4). Eachset of sessions is split in two parts: log and seed sessions (line 6). The formerconstitutes the user log that is exposed to the SUT, so that it can build its ownknowledge for suggesting next moves. The latter, not shown to the SUT, is usedto seed the benchmark tasks. The size of each user’s log is ruled by a parameter.This allows the benchmark to evaluate the SUT when working with novice usersversus advanced users, creating tasks with different difficulty levels, in the sensethat it is more difficult for a SUT to suggest something interesting to a relativelynew user. Finally, a generative model is learned from the log (line 7), inspired

Component 2 : SUT evaluation
Work session
Seed session
SUT
User
SUT
User
SUT
Useraccepted
accepted
refused
refused
SUT
STOP
Fig. 3. Task resolution process
by techniques of the OLAP literature [28,4]. This generative model is a MarkovModel that is used by Component 2, for simulating the interaction with a user.
4.4 Component 2: Evaluation of a SUT
This component is responsible for the simulation of a navigation, together withthe SUT, in order to resolve a given task. A task can be seen as an exercisethat has to be solved by SUTs. Tasks are created just before starting a SUTevaluation. The evaluation protocol first provides a seed session, which is a set ofseed queries representing part of a navigation, as a context for continuation of thenavigation. Then it asks the SUT for a first next move suggestion that consistsof one or more queries. After the SUT suggestion, the benchmark decides if itaccepts or refuses the suggestion (a real user would either follow the suggestionor not). The probability of discarding the suggestion is given as parameter. Thefollowing step is for the benchmark to indicate the next query (a real user mayevaluate their own queries). This is chosen as the closest query in the user modelto the current query. This new query is then presented to the SUT to suggestagain, and the process continues as such until a stop condition. The simulationis ran for a set of tasks (the number of tasks to run is a user-given parameter),and the whole process is preceded by the definition of tasks to accomplish.
4.5 Component 3: Scoring
All the queries recorded during a task resolution are fed to the scoring componentso it can compute a score for the SUT for the given task using the metrics definedin Section 3.2. First, each task receives a score for each metric. In practice, a

metric can be seen as a function that takes as input a task resolution (the queriesthat were played), and provides as output a number that represents the score ofthe metric for the given task.
5 Experiments
In this section we describe and report results on the experiments designed tovalidate the proposed benchmark. A first version of the benchmark applicationwas coded in Java, using PDGF [26], CubeLoad [27] and Fuzzy C-medoids [21],as explained in section 4. The tested SUTs were plugged to the benchmarkapplication using the interface class. Experiments use the default schema (SSB)[25] with a scale factor of 1, a small global log of 50 sessions and 375 queriesand 9 users with 50% of seed sessions. We generated 100 tasks for each SUTsto resolve. Tests were conducted on a laptop equiped with an i5-3210M CPU @2.50GHz and 8GB of RAM.
5.1 Experimental setup
Validation. In order to test benchmark ranking, we compared three syntheticSUTs that have simple behavior, and then expected results. ’Random’, the onehaving worst strategy, returns purely random next move suggestions. ’Naive’generates queries that are one OLAP operation away from the previous query.It naively tries to stay close from the current query, but still chooses the nextmove randomly within that neighborhood. ’Cheater’ uses ’insider information’in order to return good suggestions taken from the log, including seed sessions.Concretely, it replays queries containing cells from the neighborhood of the onesin the seed session, which should fit the user’s needs in terms of task success. Thegoal of this experiment is to confirm that the benchmark ranks these approachesas expected.
Benchmarking existing approaches. We created an experimental setup to com-pare the following approaches: CineCube [13] and Falseto [2]. CineCube is amultifaceted approach focusing on building a user-friendly sequence of explana-tions for the analysts. The approach highlights relevant cells in current viewsand explores automatically expansion into two one-distance children and twoone-distance sibling queries, also summarizing the findings. Falseto is an OLAPsession composition tool that implements a recommender system based on col-laborative filtering [2]. It features three phases: (i) search the log for sessionsthat bear some similarity with the one currently being issued by the user; (ii)extract the most relevant subsessions; and (iii) adapt the top-ranked subsessionto the current user’s session.
5.2 Analysis of Experimental Results
Table 3 shows the benchmark results for the tested SUTs. For each SUT, wereport its average score and standard deviation for the 100 tasks, for all thebenchmark primary and secondary metrics.

Engagement Novelty Success Time LearningQD F RNI IVA R P QpS TET L LGR
Random 102 0,031 1 0,834 0,104 0,001 0,005 545,88 0,855 0,045
stdev 0 0,012 0 0,190 0,166 0,002 0,003 1032,08 0,117 0,098
Naive 102 0,117 1 0,699 0,132 0,003 0,004 1005,52 0,852 0,469
stdev 0 0,083 0 0,210 0,174 0,004 0,004 1425,54 0,123 0,278
Cheater 39,50 0,232 1 0,180 0,173 0,195 0,074 285,61 0,778 0,473
stdev 21,76 0,210 0 0,353 0,186 0,380 0,135 1155,29 0,194 0,290
Falseto 473,94 0,023 1 0,867 0,444 0,003 0,001 12111,78 0,835 0,476
stdev 39,95 0,003 0 0,229 0,306 0,002 0,000 6234,34 0,103 0,293
Cinecube 100,4 0,053 1 0,947 0,388 0,215 0,084 1853,59 0,752 0,505
stdev 21.97 0,079 0 0,064 0,260 0,397 0,178 4091,07 0,284 0,300Table 3. Scores of the SUTs
Validation. Globally, the results allow us to rank ’Cheater’ highest, followed by’Naive’ and ’Random with the poorest performance, as expected. Having accessto detailed insider information (seed sessions), ’Cheater’ achieved a higher tasksuccess in less time, and devising less queries. As a consequence, it is more fo-cused, with a lower query depth. However, as it replays existing queries, increasein view are is lower and it provides less learning, but with a more consistentlearning curve. ’Random’ propose completely random jumps in the multidimen-sional space, which is less effective (lower task success) and produces unfocusedsessions. As it slowly contributes to task resolution, the stop condition (100queries) stops its execution. That is why it obtains maximum query depth forall tasks (stdev=0) but needs more execution time. Nevertheless, it randomlyexplores other cube zones, so consequently increases view area and increaseslearning. As expected, ’Naive’ stays half-way between ’Cheater’ and ’Random’.By moving always close to the current query, it was able to stay within rele-vant regions (so succeeding quite well) and being middle focused, but providingsome learning and some novelty. As ’Naive’, it executes until the stop condi-tion obtaining maximum query depth. As its has a more complex strategy than’Random’, execution times are higher.
Benchmarking existing approaches Results in Table 3 highlight the differencesbetween Falseto and Cinecube and helps deciding which is best in which case.By definition, Falseto generates longer sessions than Cinecube as reflected by theQuery Depth score. Falseto also generates queries that are not only related to theneighborhood of the last queries as Cinecube but that are based on collaborativefiltering with user past sessions to recommend next analysis moves. This leadsFalseto to have more diverse queries than Cinecube. This is an advantage whenit comes to explore the data as shown by Task Success Recall of Falseto thatis slightly better than Cinecube, but it comes at the cost of a lower precision,because more part of the cube have been explored that are not related to theobjective. Falseto is also much slower than Cinecube as reflected by Time primaryand secondary metrics.

6 Conclusion
In this paper we proposed the first benchmark for assessing OLAP explorationapproaches. Modern OLAP exploration approaches are expected to suggest nextmoves to users, but an important question is how to evaluate the quality of suchsuggestions, and how to compare alternatives. Our benchmark uses state of theart techniques to generate data and user traces, and for its metrics definition. Thebenchmark is easy to use, requiring the SUT tester to write only a well-definedinterface, and classifies the SUT according to a set of user-centric metrics. Thisis an important advance, since existing benchmarks focus almost exclusively onperformance, cost or energy. To validate the approach, we have proved that thebenchmark correctly ranks a set of strategies for which the behavior is known.
We plan to make all the details of the benchmark public for anyone to use andimprove, and our long-term goal is that it serves as a building block of a moregeneral benchmark for exploratory search over databases in general. We are cur-rently working on turning our proposal into an industry-strength benchmark: weare detailing rules, procedures, reporting procedures and documentation; we areinvestigating the benchmark robustness and its sensitivity to the data and traces;we are applying the benchmark to rank other existing exploratory approaches,as a way to create a regular use base.
References
1. J. Aligon, K. Boulil, P. Marcel, and V. Peralta. A holistic approach to OLAPsessions composition: The falseto experience. In DOLAP 2014, pages 37–46, 2014.
2. J. Aligon, E. Gallinucci, M. Golfarelli, P. Marcel, and S. Rizzi. A collaborativefiltering approach for recommending OLAP sessions. DSS, 69:20–30, 2015.
3. J. Aligon, M. Golfarelli, P. Marcel, S. Rizzi, and E. Turricchia. Similarity measuresfor olap sessions. KAIS, 39(2):463–489, 2014.
4. M.-A. Aufaure, N. Kuchmann-Beauger, P. Marcel, S. Rizzi, and Y. Vanrompay.Predicting your next olap query based on recent analytical sessions. In DaWaK,pages 134–145, 2013.
5. L. Battle, M. Stonebraker, and R. Chang. Dynamic reduction of query result setsfor interactive visualizaton. In Int’l Conference on Big Data, pages 1–8, 2013.
6. V. Cariou, J. Cubille, C. Derquenne, S. Goutier, F. Guisnel, and H. Klajnmic. Em-bedded indicators to facilitate the exploration of a data cube. IJBIDM, 4(3/4):329–349, 2009.
7. A. T. Corbett and J. R. Anderson. Knowledge tracing: Modelling the acquisitionof procedural knowledge. UMUAI, 4(4):253–278, 1995.
8. M. C. Desmarais and R. S. J. de Baker. A review of recent advances in learner andskill modeling in intelligent learning environments. UMUAI, 22(1-2):9–38, 2012.
9. M. Drosou and E. Pitoura. Ymaldb: exploring relational databases via result-drivenrecommendations. VLDB J., 22(6):849–874, 2013.
10. A. Drutsa, G. Gusev, and P. Serdyukov. Future user engagement prediction andits application to improve the sensitivity of online experiments. In WWW, pages256–266, 2015.
11. M. Eirinaki, S. Abraham, N. Polyzotis, and N. Shaikh. Querie: Collaborativedatabase exploration. TKDE, 26(7):1778–1790, 2014.

12. A. Giacometti, P. Marcel, E. Negre, and A. Soulet. Query recommendations forolap discovery-driven analysis. IJDWM, 7(2):1–25, 2011.
13. D. Gkesoulis, P. Vassiliadis, and P. Manousis. Cinecubes: Aiding data workers gaininsights from OLAP queries. IS, 53:60–86, 2015.
14. M. Golfarelli, S. Rizzi, and P. Biondi. myolap: An approach to express and evaluateOLAP preferences. TKDE, 23(7):1050–1064, 2011.
15. J. Gray, S. Chaudhuri, A. Bosworth, A. Layman, D. Reichart, M. Venkatrao, F. Pel-low, and H. Pirahesh. Data cube: A relational aggregation operator generalizinggroup-by, cross-tab, and sub totals. Data Min. Knowl. Discov., 1(1):29–53, 1997.
16. J. M. Hellerstein, P. J. Haas, and H. J. Wang. Online aggregation. In SIGMOD,pages 171–182, 1997.
17. S. Idreos, O. Papaemmanouil, and S. Chaudhuri. Overview of data explorationtechniques. In SIGMOD, pages 277–281, 2015.
18. N. Kamat, P. Jayachandran, K. Tunga, and A. Nandi. Distributed and interactivecube exploration. In ICDE, pages 472–483, 2014.
19. H. A. Khan, M. A. Sharaf, and A. Albarrak. Divide: efficient diversification forinteractive data exploration. In SSDBM, pages 15:1–15:12, 2014.
20. R. Kimball. The Data Warehouse Toolkit: Practical Techniques for Building Di-mensional Data Warehouses. John Wiley, 1996.
21. R. Krishnapuram, A. Joshi, O. Nasraoui, and L. Yi. Low-complexity fuzzy rela-tional clustering algorithms for web mining. IEEE-FS, 9:595–607, 2001.
22. J. LeFevre, J. Sankaranarayanan, H. Hacigumus, J. Tatemura, and N. Polyzotis.Towards a workload for evolutionary analytics. In DanaC ’13, pages 26–30, 2013.
23. J. Lehmann, M. Lalmas, E. Yom-Tov, and G. Dupret. Models of user engagement.In UMAP, pages 164–175, 2012.
24. H. V. Nguyen, K. Bohm, F. Becker, B. Goldman, G. Hinkel, and E. Muller. Identi-fying user interests within the data space - a case study with skyserver. In EDBT2015, pages 641–652, 2015.
25. P. E. O’Neil, E. J. O’Neil, X. Chen, and S. Revilak. The star schema benchmarkand augmented fact table indexing. In TPCTC, pages 237–252, 2009.
26. T. Rabl, M. Poess, H. Jacobsen, P. E. O’Neil, and E. J. O’Neil. Variations of thestar schema benchmark to test the effects of data skew on query performance. InICPE’13, pages 361–372, 2013.
27. S. Rizzi and E. Gallinucci. Cubeload: A parametric generator of realistic OLAPworkloads. In CAiSE 2014, pages 610–624, 2014.
28. C. Sapia. Promise: Predicting query behavior to enable predictive caching strate-gies for olap systems. In DaWaK, pages 224–233, 2000.
29. S. Sarawagi. Explaining differences in multidimensional aggregates. In VLDB,pages 42–53, 1999.
30. S. Sarawagi. User-adaptive exploration of multidimensional data. In VLDB, pages307–316, 2000.
31. G. Sathe and S. Sarawagi. Intelligent rollups in multidimensional OLAP data. InVLDB, pages 531–540, 2001.
32. T. Sellam and M. L. Kersten. Meet charles, big data query advisor. In CIDR,2013.
33. Y. Song, X. Shi, and X. Fu. Evaluating and predicting user engagement changewith degraded search relevance. In WWW, pages 1213–1224, 2013.
34. R. W. White and R. A. Roth. Exploratory Search: Beyond the Query-ResponseParadigm. Morgan & Claypool Publishers, 2009.