assessing the economic and non-economic impacts of harrah .../media/files/kenaninstitute/unc... ·...
TRANSCRIPT
ASSESSING THE ECONOMIC AND NON-ECONOMIC IMPACTS OFHARRAH’S CHEROKEE CASINO, NORTH CAROLINA
James H. Johnson Jr.John D. Kasarda
Stephen J. Appold
Frank Hawkins Kenan Institute of Private EnterpriseKENAN-FLAGLER BUSINESS SCHOOL
THE UNIVERSITY OF NORTH CAROLINA AT CHAPEL HILL
June 2011

The Eastern Band of Cherokee Indians (EBCI), mainly
descendants of those who managed to avoid being forced on
the Trail of Tears evacuation to Oklahoma in the 1830s, is based
within the 56,000 acre Qualla Boundary, located in Jackson,
Swain, and Haywood Counties. According to tribal estimates,
the EBCI has approximately 14,500 members. Approximately
60 percent of those live within the Boundary. Directly and
indirectly, the EBCI is dependent upon Harrah’s Cherokee
Casino, located in Jackson County near Cherokee, for much of
its income. The casino has an important economic impact upon
the region which extends beyond the Qualla Boundary and
beyond the enrolled members of the tribe. This report describes
the impact of the casino on the region and analyzes the routes of
its economic impact.
INTRODUCTIONINTRODUCTION
Asses s ing the e conomi c and non-e conomi c impac t s o f Har rah’s Cherokee Cas ino, Nor th Caro l ina
Page i
Executive Summary Assessing the Economic and Non-Economic Impacts of Harrah’s Cherokee Casino, North Carolina
References
About the Authors
CONTENTSTABLE OF CONTENTS
...................................................ii
...............................................................24
...................................................25
...............1

Asses s ing the e conomi c and non-e conomi c impac t s o f Har rah’s Cherokee Cas ino, Nor th Caro l ina
Page i i
EXECUTIVE SUMMARYEXECUTIVE SUMMARY
Signed into law by President Reagan on 17 October 1988, the Indian Gaming Regulatory Act paved the way for the Eastern Band of Cherokee Indians (EBCI) to leverage gambling for tribal and regional economic development. Following the passage of the federal law, the EBCI entered into a compact with the State of North Carolina and, on 13 November 1997, opened Harrah’s Cherokee Casino.
In less than two decades, the casino, which is managed by Harrah’s and owned by the EBCI, has evolved from a simple bingo operation to a large, complex resort which reportedly is the largest private tourist attraction in North Carolina. Today, Harrah’s Cherokee Casino includes 120,000 square feet of gaming space, retail shops, restaurants, three hotel towers, a 15,000 square foot conference center, a 3,000 seat event center, and three hotel towers. Additional facilities will be completed by late 2012.
As a regional export industry, casino revenues are cycled through the regional economy in the form of employee compensation, local supplier purchases, and transfers of several types. Each generates a demand for additional goods and services as households purchase consumer goods and the tribe and the Cherokee Preservation Foundation make investments in the region. Casino capital investment also supports the regional economy.
This study assesses both the economic and non-economic impacts of Harrah’s Cherokee Casino on the EBCI, Western North Carolina, and the state more generally.
Among the study’s key findings:
Harrah’s Cherokee Casino has had a clear positive impact on the economy of Western North Carolina. Without the casino, the region and the state would not have attracted equivalent revenue.
º Approximately 3.6 million people visit the casino each year.
º Visitor-generated revenue totaled $386 million in 2010 after temporarily peaking at $449 million in 2007.
º Over two-thirds of gaming revenues come from
out-of-state visitors. º In 2009, the economic impact on Jackson and Swain counties was estimated to be approximately $300 million. Capital investments added another estimated $82 million.
º A large portion of the gaming revenue, the tourist spending accompanying it, and the follow-on economic impacts would likely be lost to the state in the absence of the casino.
Ò In order to generate these revenues, the casino hires employees and contracts with vendors. In 2009:
º The casino was directly responsible for five percent of employment (1674 employees—80 percent of whom were not enrolled members of the EBCI) and approximately eight percent of all wages and salary disbursements ($74. 8 million) in Jackson and Swain counties.
º An estimated $52.4 million wage and salary income was fed into the local economy. Household spending generated an additional $8.3 million in economic output for a total employee compensation impact of $60.7 million in Jackson and Swain counties.
º Casino-purchased goods and services from local vendors in Jackson and Swain counties totaled $4.4 million—$3.8 million in direct and $557,000 in indirect economic impact.
º Casino operational spending—the combined effect of employment and local business impacts—produced an estimated $65.1 million impact on the economies of Jackson and Swain counties.
Ò In order to maximize long-term revenues, the casino has undertaken a large capital investment program. In 2009:
º One fourth of operating revenues were dedicated to new capital investments in land and improvements, equipment, and construction.
º $76.9 million was paid to local construction contractors and subcontractors which translated into an $82.5 million impact on the local economy.
Ò Above and beyond its own spending, Harrah’s Cherokee Casino injects three additional sources of

Asses s ing the e conomi c and non-e conomi c impac t s o f Har rah’s Cherokee Cas ino, Nor th Caro l ina
Page i i i
funds into the regional economy.
º $67 million provided to the Cherokee Preservation Foundation by the end of the 2009 fiscal year.
º $1.8 million transferred to the EBCI as a Tribal Levy collected directly from casino guests in lieu of sales tax in 2009.
º $226.3 million of its operating surplus (56 percent of operating revenue) transferred to the EBCI in 2009.
Ò Using resources stemming directly from the casino, the Cherokee Preservation Foundation has made 661 grants totaling nearly $51 million to further strengthen and diversify the regional economy.
º Each dollar of Cherokee Preservation Foundation funding has been matched by an average of $1.64 in support from other non-profit or government sources.
º In addition to the direct benefits of the work completed with foundation resources, the annual average Cherokee Preservation Foundation distribution (approximately $5 million) has an estimated total economic impact of $5.6 million on the local economy of Jackson and Swain counties.
Ò Half of the casino’s $226.3 million Tribal Distribution was distributed directly to enrolled members and half was devoted to local government-type expenditures.
º Representing the equivalent of eight percent of all personal income in Jackson and Swain counties, the household distribution generated an additional $12.6 million in indirect local economic impact.
º Government-type expenditures generated an additional $24 million in multiplier spending for a total regional economic impact of $229.4 million.
º The impacts of the casino are reflected in the economic trends for the region as a whole.
º Stagnate until the late 1990s, per capita income has grown coincident with the timing and growth of casino revenues, moving from approximately 70% to over 80% of the statewide average.
º Directly and indirectly, casino operation have reduced the historically high unemployment rate
in Jackson and Swain counties which was 1.87 times the state average through 1997.
º The casino also appears to have attenuated previously high seasonal fluctuations in unemployment in the Cherokee region which had sometimes peaked at 17 percent of more.
º Substantially below the statewide average prior to the casino, the employment rate in Jackson and Swain Counties is now above the state level.
º While the region’s population held steady as a proportion of the state total, employment accelerated after 1997 and with it wages and salaries, earnings, and, to a somewhat lesser degree, regional income as a proportion of the state total.
º Much of the employment in the public sector and with the tribe is supported by casino-generated funds.
º The Qualla Boundary accounts for 13 percent of the establishments , 26 percent of the employment, and 29 percent of the wages and salaries in Jackson and Swain counties.
Ò The social impacts of the casino are reflected in the trends for the region as a whole.
º Life expectancy in the Cherokee region is approximately on par with the state level.
º Revenue sharing arrangements between the casino and the tribe appear to have improved parent-child interactions by lifting families out of poverty, with the attendant benefits of reduced behavioral problems and improvements in educational performance among children and adolescents.
º Cherokee students are enrolling in community colleges at above average rates but continue to graduate from high school and enroll in UNC system schools at lower rates than other students.

Asses s ing the e conomi c and non-e conomi c impac t s o f Har rah’s Cherokee Cas ino, Nor th Caro l ina
Page 1
a January 2001 amendment to the Compact, the Tribe agreed to fund a non-profit foundation that focuses on environmental enhancement, economic and workforce development and cultural preservation. A further minor amendment was agreed to in 2002.
Expansions have followed the 1997 opening in rapid succession with a 10,000 square foot casino addition in June 1998, a further 20,000 square foot extension in May 2002, and hotel towers opening in May 2002 and June 2005. The EBCI approved a $650 million expansion program in January 2007 which is scheduled for completion in late 2012. The casino previously included 576 hotel rooms and suites, a 15,000 square foot conference center, and several restaurants. The expansion program includes two parking garages with 3,500 spaces, a third hotel tower with a total of 534 rooms and suites, a 3,000 seat event center, a spa, additional restaurants and shops, and renovated or expanded gaming space, amenities and support facilities. As of December 2010, the parking garages, event center, and third hotel tower had been substantially completed. The casino began serving alcohol late 2009.
Harrah’s Cherokee Casino has evolved in the short time of barely two decades from a simple bingo operation to a large, complex, multi-product firm which is said to be the largest private tourist attraction in North Carolina. Data provided by the casino (summarized in Table 1) indicate that approximately 3.6 million people visit each year.
In the sections which follow, we assess the economic and social impacts of casino operation on western North Carolina and on the State as a whole. We do so in two stages using
A Short History of Harrah’s Cherokee Casino The Indian Gaming Regulatory Act, signed into law by
President Reagan on 17 October 1988, paved the way for the Eastern Band of Cherokee Indians (EBCI) to leverage gambling for tribal and regional economic development. The Indian Gaming Regulatory Act was an outcome of a number of U.S. Supreme Court cases clarifying the role of states in regulating activities on sovereign Indian lands and of a growing political ideology of economic self-sufficiency championed by Senator Daniel Inouye of Hawaii, Senator John McCain of Arizona, and Representative Morris Udall of Arizona. A decade after the original act passed, the federal government gained the power to tax tribal casinos in order to finance a regulatory agency, the National Indian Gaming Commission.
While the Indian Gaming Regulatory Act allowed a good deal of tribal autonomy for some types of gaming, it also required federal or state regulation in some cases. The Indian Gaming Regulatory Act classified gaming into three categories. Class I games were defined as “social games solely for prizes of minimal value or traditional forms of Indian gaming engaged in by individuals as a part of, or in connection with, tribal ceremonies or celebrations.” Class II games included bingo and card games (other than banking card games) operated in accordance with state law regarding the amount of wagers and hours of operation. Class III games were “all forms of gaming that are not Class I gaming or Class II gaming,” including slot machines, casino-style games, banking card games, video games, and lotteries. Class III gaming (casino gambling) was to be overseen by state gambling commissions formed by “compact” (agreement) between tribes and individual state governments.
Following the passage of the federal law, the EBCI opened a small Class II operation in 1990. In 1992, the tribe initiated a process of negotiations with the State of North Carolina to allow Class III gaming on its land. In August 1994, the Tribe entered into a compact with the State of North Carolina, signed by Governor Hunt, that permitted the Tribe to conduct “raffles,” “video games,” and “other Class III gaming which may be authorized” in writing by the Governor. The compact requires an element of skill in each game played, however. The tribe opened a temporary casino in 1995 which was subsequently closed when Harrah’s Cherokee Casino opened 13 November 1997. The compact was amended in May 1996 and November 2000, allowing for expanded operations and extending the compact until 2030. As part of
Table 1 Harrah’ Cherokee Casino & Hotel Total Visitors, 1997-2010
Casino Admissions
1998 3,107,197
2000 3,491,093
2002 3,344,314
2004 3,498,146
2006 3,599,428
2008 3,543,915
2010 3,605,000
Note: Fiscal Year October - September
ASSESSING IMPACTASSESSING THE ECONOMIC AND NON-ECONOMIC IMPACT

Asses s ing the e conomi c and non-e conomi c impac t s o f Har rah’s Cherokee Cas ino, Nor th Caro l ina
Page 2
complementary methodologies to examine different aspects of the casino’s impact. In the first stage, we measure the economic and social impact of the casino on regional income, employment and well-being. In the second stage, we “follow the money” as it enters and circulates through the regional and state economy, documenting the direct and indirect impacts as it flows.
Harrah’s Cherokee Casino in ContextThe western portion of the state has always lagged
economically. It was the last settled, the last to receive transportation infrastructure, and the last to develop administratively (as evidenced by the dates of county incorporation). It is perhaps also the least urbanized. The topography, difficult access, and lack of urbanism meant that western North Carolina was not well suited for commercial farming, most manufacturing, and even less so for much of the emerging service economy. The region has long been the target of poverty alleviation programs. It was not until Piedmont prosperity gave the regional tourist industry a boost several decades ago that the western portion of the state began to find a viable economic niche.
In examining economic trends, we examined four geographic regions in addition to the state of North Carolina
as a whole. (See Figure 1.) These are the Qualla Boundary territory, the Cherokee Seven region, the Mountain North region, and the Cherokee Two region. The Qualla Boundary territory straddles two counties, Jackson and Swain, which comprise the Cherokee Two region. The addition of Cherokee, Clay, Graham, Haywood, and Macon Counties completes the Cherokee Seven region. The Mountain North region, consisting of Alleghany, Ashe, Avery, McDowell, Mitchell, Watauga, and Yancey Counties – all north of Buncombe County and the City of Asheville, provides a basis of comparison for the economic and social health of the Cherokee region as affected by the operation of Harrah’s Cherokee Casino.
Income and EarningsTrends in income and income per capita provide a direct
measure of aggregate improvements in regional welfare. Over the last several decades, North Carolina economic growth has been concentrated mainly in the Piedmont. Charlotte has long been a banking center and more recently a favored location for advanced manufacturing and distribution. The Triangle is home to the state capitol and the three research universities which have helped fuel regional growth for the last half century. By contrast, the eastern and western portions of the state have largely been left behind economically.
Figure 1North Carolina Regions Examined in the Study

Asses s ing the e conomi c and non-e conomi c impac t s o f Har rah’s Cherokee Cas ino, Nor th Caro l ina
Page 3
of the last decade, corresponding closely with the timing of the growth in casino revenues.
The resilience of the Cherokee region economy during difficult times can be seen at the right in Figure 2. The Cherokee Seven region has surpassed the Mountain North region in income per capita since the beginning of the decade. The Cherokee Two region began to perform better in the second half of the decade after lagging behind for much of the 1990s.
Figures 4 and 5 trace the trends in earnings per employee and wages and salary per employee over the same time period. These trends are also generally upward throughout the state with a more pronounced softening over the last decade. During the 1970s and early 1980s, Cherokee region earnings and wages appeared to be in a free fall compared to state trends but began to turn around by the mid-1980s. The gap between the western regions and the state as a whole has widened over time as the Piedmont region in particular prospered for much of the period under consideration.
The situation in the Cherokee region has improved, however; it began to perform better than the Mountain North region after 2001 with the Cherokee Two region doing especially well. The relative level of wages and salaries in the Cherokee Region began to improve during the late 1990s as casino operations got underway. Figure 6 illustrates the development of relative wages and salary levels in the West.
EmploymentThe level of participation in the money economy is
an important indicator of social integration and economic participation. Figure 7 charts monthly unemployment rates in North Carolina and the set of western Carolina regions analyzed above from 1990 to mid-2010, based on North Carolina Employment Security Commission data. Three points stand out in the figure. First, the seasonal fluctuations in unemployment in the Cherokee region have historically been high – higher than in the state as a whole and higher than in the comparison, “Mountain North,” region. In the Cherokee Two region, the seasonal unemployment variations were especially severe, sometimes peaking at 17 percent or more.
Second, the unemployment rates in the Cherokee region have historically been high. In the Cherokee Seven region monthly unemployment rates averaged over one and a half
Figure 2 charts the change in per capita income for the State of North Carolina and the selected regions – the “Cherokee Seven” region, the “Mountain North” comparison region, and the “Cherokee Two” region consisting of Jackson and Swain Counties – which surround Harrah’s Cherokee Casino and the EBCI Qualla Boundary lands. Income data are available for a four-decade, 1969-2008, period from the U.S. Bureau of Economic Analysis, allowing the effects of the Harrah Cherokee Casino on the regional economy to be placed in historical and geographic context. The estimates have been adjusted to constant 2005 dollars, mitigating the effect of inflation on this measure of prosperity.
Income per capita in North Carolina has risen from approximately $13,000 (2005 dollars) in 1969 to nearly $32,500 in 2008. Western North Carolina has largely followed the same upward trend. Income per capita was $10,400 in the Cherokee Seven region in 1969 and rose to $26,750 in 2008, remaining at approximately 80 percent of the state average level throughout the entire period. The Mountain North region began at $9,600 and ended at $25,575, increasing from approximately 73 percent of the state level in 1969 to 80 percent in the early 1990s, remaining close to that level since. In the Cherokee Two region, income per capita began at less than $9,500, grew to $26,500, and increasing from approximately 70 percent of the state level to over 80 percent. As seen in Figure 3, after an early increase in the late 1970s and early 1980s, per capita income stagnated in the Cherokee Two region only to rise in the late 1990s and over the course
5,000
10,000
15,000
20,000
25,000
30,000
35,000
1969 1972 1975 1978 1981 1984 1987 1990 1993 1996 1999 2002 2005 2008
2005
dol
lars
North Carolina Cherokee seven North mountain Cherokee two
Figure 2Trends in per capita income in selected
North Carolina regions, 1969-2008

Asses s ing the e conomi c and non-e conomi c impac t s o f Har rah’s Cherokee Cas ino, Nor th Caro l ina
Page 4
times as high as the statewide level. In the Cherokee Two region, they were 1.87 times the state average through 1997.
Third, those historical patterns changed dramatically during the late 1990s as the casino opened. Seasonal fluctuations in unemployment have attenuated and, although the region has not escaped the impacts of the recession and the ongoing difficulties in the labor market, the region’s labor market now performs as well as the state as a whole.
Unemployment rates are based on the number of people who are either working or actively seeking work. Therefore, unemployment data often under-estimate the degree of labor market stress because discouraged workers (those who have given up actively searching for employment) are not included. In order to corroborate the findings with respect to unemployment, we examined regional employment rates. These are available for a longer time period but only on an annual basis. As seen in Figure 8, employment
0.62
0.64
0.66
0.68
0.7
0.72
0.74
0.76
0.78
0.8
0.82
0.84
1969 1974 1979 1984 1989 1994 1999 2004Cherokee seven North mountain Cherokee two
Figure 3Relative level of per capita income for
the western regions, 1969-2008
15,000
20,000
25,000
30,000
35,000
40,000
45,000
1969 1974 1979 1984 1989 1994 1999 2004
2005
dol
lars
North Carolina Cherokee seven North mountain Cherokee two
Figure 4Trends in earnings per employee in
selected North Carolina regions, 1969-2008
10,000
15,000
20,000
25,000
30,000
35,000
1969 1974 1979 1984 1989 1994 1999 2004
2005
dol
lars
North Carolina Cherokee seven North mountain Cherokee two
Figure 5Trends in wages per employee in
selected North Carolina regions, 1969-2008
0
0.1
0.2
0.3
0.4
0.5
0.6
0.7
0.8
0.9
1
1969 1974 1979 1984 1989 1994 1999 2004
Cherokee seven North mountain Cherokee two
Figure 6Relative level of per employee wages for
the western regions, 1969-2008

Asses s ing the e conomi c and non-e conomi c impac t s o f Har rah’s Cherokee Cas ino, Nor th Caro l ina
Page 5
began to decrease and employment began to rise even though relative population continued its downward trend. The picture is slightly different in the Cherokee Two region. While population held steady as a proportion of the state total, employment took off after 1997 and with it wages and salaries, earnings, and, to a somewhat lesser degree, regional income as a proportion of the state total, suggesting that the casino has had a region-wide impact.
Regional Employment CompositionWhat a region and its people do for a living has an
impact on how they live now and the prospects for growth in the future. Many North Carolina regions have economies based on stagnant or declining sectors. As implied above, western North Carolina has been in that situation for much of its history. Information on the sectoral composition of employment is available on a consistent basis for the 1990-2009 period from the U.S. Bureau of Labor Statistics’ Quarterly Census of Employment and Wages program. We focus here on a comparison of the Cherokee Two region – the immediate surroundings of the casino – with a state-wide
rates have grown throughout the state over the 1969-2008 period, with fluctuations tied to the business cycle and other shocks. Employment rates in the western portions of the state have grown faster than average, indicating a growing integration of the labor force into the commercial economy. The employment rate in Jackson and Swain Counties (the Cherokee Two region) began, like the rest of the west, substantially below the state average but is now somewhat above the state’s level.
Figures 9 and 10 summarize the trends in income, earnings, wages and salaries, employment, and population as proportions of the state total for the Cherokee Seven and the Cherokee Two regions, respectively, from 1969 to 2008. A constant share of each would be indicated by a flat horizontal line. A positive slope to the line indicates relative growth and a negative slope, relative decline.
In the Cherokee Seven region, after the 1970s, four of the five trends moved generally downward in approximate parallel but, after 1997, the decline in income and earnings
0.0
0.5
1.0
1.5
2.0
2.5
3.0
3.5
4.0
4.5
0.0%
2.0%
4.0%
6.0%
8.0%
10.0%
12.0%
14.0%
16.0%
18.0%
20.0%
Cherokee Seven Cherokee Two
Mountain Seven North Carolina
Cherokee Two / State ratio
Figure 7Unemployment rate in selected North Carolina Regions, 1990-2010

Asses s ing the e conomi c and non-e conomi c impac t s o f Har rah’s Cherokee Cas ino, Nor th Caro l ina
Page 6
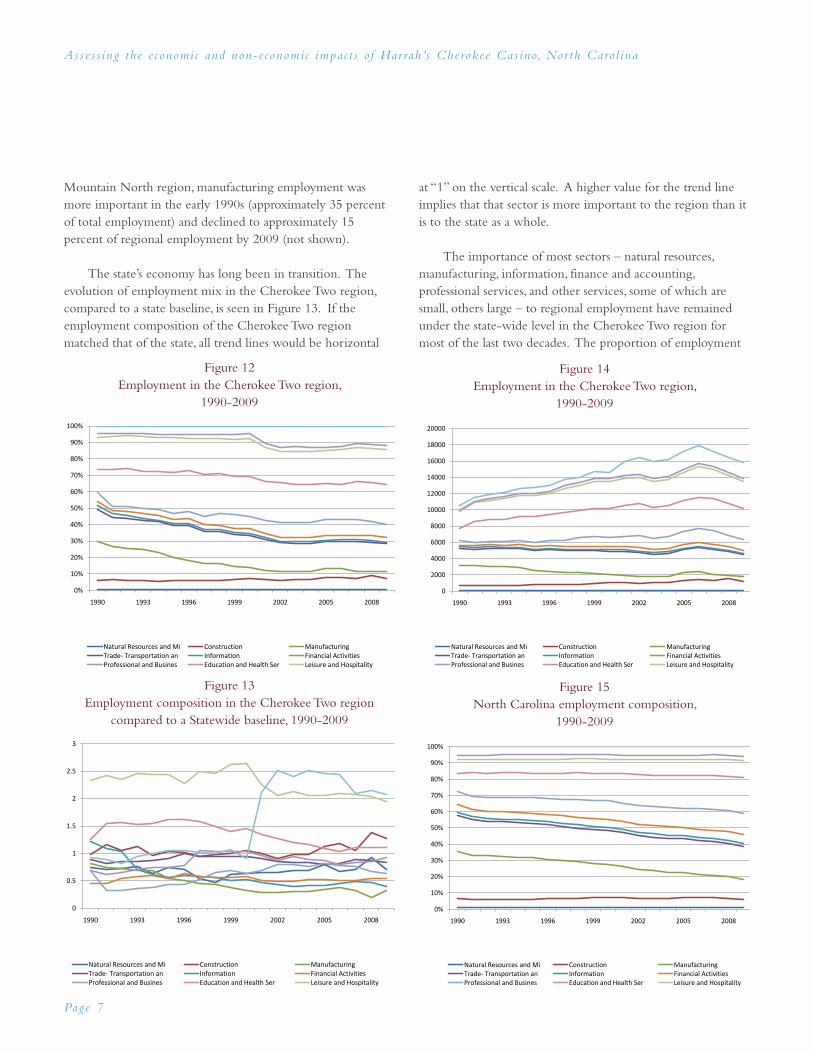
baseline. Figures 11 and 12 chart the trends in employment composition for the state as a whole and for the Cherokee Two region, respectively. The figures show the proportion of employment in each broad sector. As noted above, employment grew significantly over the time period.
Figure 11 shows that the continuing decline of manufacturing employment and its partial replacement by the
expansion of education and health employment throughout the state stands out as the dominant ongoing employment trend. As seen in Figure 12, that shift came more quickly to the Cherokee Two region with the manufacturing employment largely gone before the recession at the beginning of the decade. The decline in manufacturing helped bring about an early boost to the relative importance of education and health employment in the two-county region. In the
0.2
0.25
0.3
0.35
0.4
0.45
0.5
0.55
0.6
0.65
1969 1972 1975 1978 1981 1984 1987 1990 1993 1996 1999 2002 2005 2008
Perc
ent o
f reg
iona
l pop
ulat
ion
North Carolina Cherokee seven North mountain Cherokee two
Figure 8Trends in employment in selected
North Carolina regions, 1969-2008
0.00
0.01
0.01
0.02
0.02
0.03
1969 1972 1975 1978 1981 1984 1987 1990 1993 1996 1999 2002 2005 2008
Personal income ($000) Earnings by place of workWage and salary disbursements Total employment
Figure 9The Cherokee Seven region as a proportion of
the North Carolina economy, 1969-2008
0
0.001
0.002
0.003
0.004
0.005
0.006
0.007
1969 1972 1975 1978 1981 1984 1987 1990 1993 1996 1999 2002 2005 2008
Personal income ($000) Earnings by place of workWage and salary disbursements Total employment
Figure 10The Cherokee Two region as a proportion of
the North Carolina economy, 1969-2008
0%
10%
20%
30%
40%
50%
60%
70%
80%
90%
100%
1990 1993 1996 1999 2002 2005 2008
Natural Resources and Mi Construction ManufacturingTrade- Transportation an Information Financial ActivitiesProfessional and Busines Education and Health Ser Leisure and Hospitality
Figure 11North Carolina employment composition,
1990-2009
Asses s ing the e conomi c and non-e conomi c impac t s o f Har rah’s Cherokee Cas ino, Nor th Caro l ina
Page 7
Mountain North region, manufacturing employment was more important in the early 1990s (approximately 35 percent of total employment) and declined to approximately 15 percent of regional employment by 2009 (not shown).
The state’s economy has long been in transition. The evolution of employment mix in the Cherokee Two region, compared to a state baseline, is seen in Figure 13. If the employment composition of the Cherokee Two region matched that of the state, all trend lines would be horizontal
at “1” on the vertical scale. A higher value for the trend line implies that that sector is more important to the region than it is to the state as a whole.
The importance of most sectors – natural resources, manufacturing, information, finance and accounting, professional services, and other services, some of which are small, others large – to regional employment have remained under the state-wide level in the Cherokee Two region for most of the last two decades. The proportion of employment
0%
10%
20%
30%
40%
50%
60%
70%
80%
90%
100%
1990 1993 1996 1999 2002 2005 2008
Natural Resources and Mi Construction ManufacturingTrade- Transportation an Information Financial ActivitiesProfessional and Busines Education and Health Ser Leisure and Hospitality
Figure 12Employment in the Cherokee Two region,
1990-2009
0
0.5
1
1.5
2
2.5
3
1990 1993 1996 1999 2002 2005 2008
Natural Resources and Mi Construction ManufacturingTrade- Transportation an Information Financial ActivitiesProfessional and Busines Education and Health Ser Leisure and Hospitality
Figure 13Employment composition in the Cherokee Two region
compared to a Statewide baseline, 1990-2009
0
2000
4000
6000
8000
10000
12000
14000
16000
18000
20000
1990 1993 1996 1999 2002 2005 2008
Natural Resources and Mi Construction ManufacturingTrade- Transportation an Information Financial ActivitiesProfessional and Busines Education and Health Ser Leisure and Hospitality
Figure 14Employment in the Cherokee Two region,
1990-2009
0%
10%
20%
30%
40%
50%
60%
70%
80%
90%
100%
1990 1993 1996 1999 2002 2005 2008
Natural Resources and Mi Construction ManufacturingTrade- Transportation an Information Financial ActivitiesProfessional and Busines Education and Health Ser Leisure and Hospitality
Figure 15North Carolina employment composition,
1990-2009

Asses s ing the e conomi c and non-e conomi c impac t s o f Har rah’s Cherokee Cas ino, Nor th Caro l ina
Page 8
accounted for by construction has risen somewhat to be over-represented somewhat in recent years.
The education and health sector has been over-represented, although in recent years, its relative size has decreased. Interestingly, the relative size of the hospitality sector, by far the most over-represented sector in the 1990s, although also still over-represented has also decreased despite the significant employment growth. Public administration grew over three and a half-fold over the past two decades. Total two-county employment peaked in 2006, as seen in Figure 14, but the change seen in Figure 12 is not due to disproportionate shrinkage in those two sectors. Rather, they have been eclipsed by the rapid growth in public administration employment in the region over the past decade.
Public employment makes up an even larger share of earnings in the Cherokee Two region, now accounting for some 40 percent of the total. This is roughly twice the statewide level of approximately 20 percent of the total, which has remained roughly constant for the last four decades. Many of the jobs in education and health are not well paid,
so that the sector generates more employment than income. Finally, the under-representation of producer services which has helped generate a lot of the wealth enjoyed by North Carolina’s major metropolitan areas reduces the effectiveness of that sector as a regional income producer.
The Cherokee region has become more prosperous over the last decade or so. In contrast to Charlotte and the Triangle, the Cherokee region has prospered on the basis of a sector, tourism, which has not been the primary growth sector for the state and the nation.
Qualla Boundary employment compared to the Cherokee Two region
Our analysis has so far centered on relatively large geographic units built up of multiple counties. We have done so for two reasons. First, we wanted to document the broader impacts of the casino. Second most economic information is available at no more detail than the county level. The Qualla Boundary spans the Jackson-Swain county border but does not encompass the whole of either county (see Figure 1). In order to place Qualla Boundary employment in the context of the Cherokee Two region, we examined establishment-level data for a recent year.
The results of our analysis are summarized in Table 2. The Qualla Boundary accounts for 13 percent of the establishments in the Cherokee Two region, 26 percent of the employment, and 29 percent of the wages and salaries in the two-county area. That is, the establishments within the Qualla Boundary are larger and they pay somewhat higher wages than those in the surrounding area.
Table 3 provides further detail on employment within the Qualla Boundary. Differences in definitions and measurement methods mean that the figures in this table are not fully compatible with those discussed above. We focus our discussion on seven sectors, comparing the number of establishments, employment, and wages and salaries inside and outside the Qualla Boundary in the two-county region.
As could be expected, the arts, entertainment, and recreation sector is over-represented within the Qualla Boundary in terms of the number of establishments, employment, and wages paid. The accommodation and food service sector inside the Qualla Boundary has more establishments than might be expected but less employment
Table 2 Distribution of establishments, employment, and wages
within Jackson and Swain County employersValue Percent
Establishments Qualla 158 13.1%
non-Qualla 1,049 86.9%
Jackson-Swain County Total
1,207 100.0%
Employment Qualla 4,456 25.7%
non-Qualla 12,890 74.3%
Jackson-Swain County Total
17,346 100.0%
Wages and salaries
Qualla $34,138,084 28.9%
non-Qualla $84,172,196 71.1%
Jackson-Swain County Total
$118,310,280 100.0%

Asses s ing the e conomi c and non-e conomi c impac t s o f Har rah’s Cherokee Cas ino, Nor th Caro l ina
Page 9
and wages. On average, the accommodation and food service establishments are smaller and pay less than those outside the boundary in the two-county region. The retail sector follows a similar pattern. Construction is also less prominent within the Qualla Boundary than our baseline model predicts. Health care and social assistance and educational services also follow that pattern. In contrast, public administration employment within the Qualla Boundary is nearly three times the expected level. Total wages and salaries are two and one half times as high as expected.
The aggregate economic indicators suggest that increased income and well-being has come to Western Carolina coincident with the establishment of Harrah’s Cherokee Casino which is reflected in increased income, earnings, and employment within the Qualla Boundary, the Cherokee Two Region and the Cherokee Seven Region. That increased prosperity is seen in long-term trends and in comparisons with other regions. Economic improvement should be visible in enhanced social welfare.
Social IndicatorsThe broadest impact of economic growth may be in social
advancement – the improvement in the amount and quality of life available to regional residents. In measuring the social development of the Cherokee region we followed the broad lead of Nobel-prize winning economist Amartya Sen. Sen was among the creators of a simple, yet powerful, measure of human well-being which combined indicators of health and
access to knowledge with income. A recent effort has adapted the measure to U.S. data availability and calculated the scores for areas of the U.S.
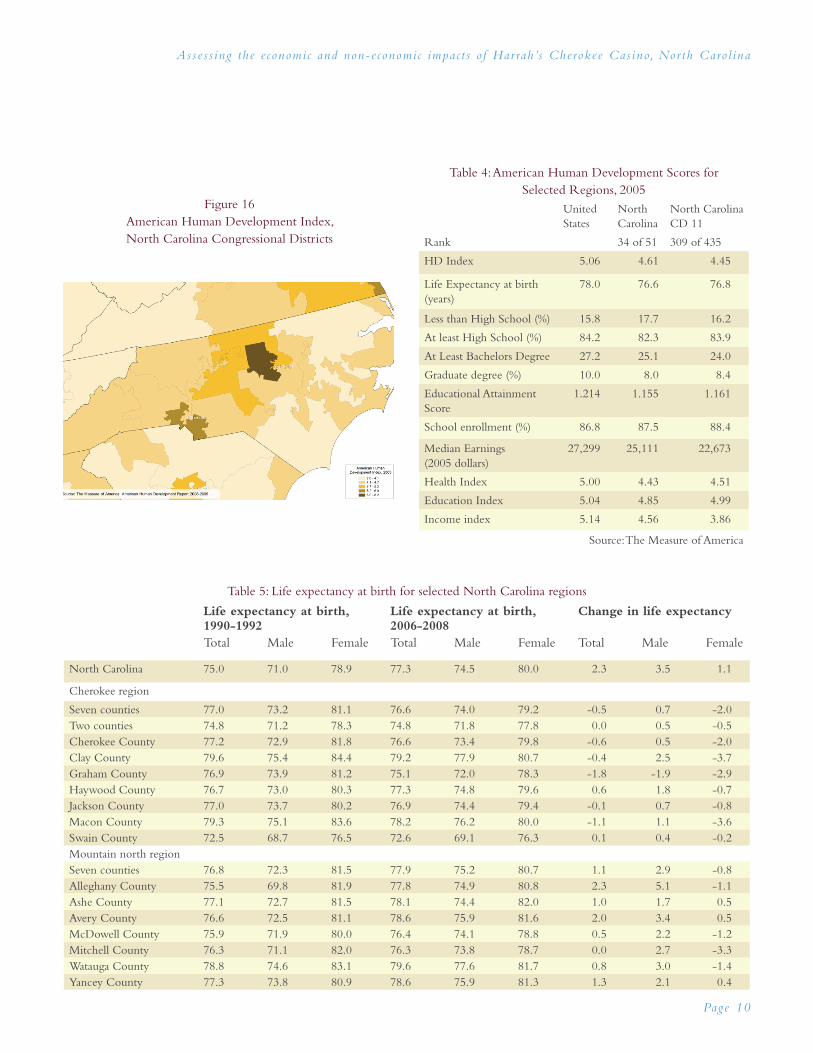
Figure 16 shows the levels of the American Human Development Index for North Carolina Congressional Districts, the smallest geographic units for which the measure is available. Table 4 provides the scores and sub-scores for The United States, North Carolina, and Congressional District 11 in the western portion of the state. Among all states, North Carolina ranks thirty-fourth, at 4.61. At 4.45, Congressional District 11 in western North Carolina ranks 309th out of the 435 districts in the U.S. Closer examination reveals that the health sub-index for the region is higher than that of the state as a whole and that the education sub-index for the region approaches the national level. Income scored lower.
Because the boundaries of the congressional district do not coincide with the Cherokee region, because the index has been calculated for only one point in time, and because consistent data are not available for smaller areas, we examined three indicators of social health in addition to the income information discussed above. The first of these is life expectancy at birth. Life expectancy at birth is regarded as perhaps the best all round indicator of human welfare.
Table 5 displays life expectancy data for the State as a whole, each of the seven Cherokee region counties in far western North Carolina along with average values for the
Table 3: Composition of establishments, employment, and Wages and salary within the Cherokee Two region
Qualla over (under)- representation
Qualla over (under)- representation
Qualla over (under)- representation
Jackson-Swain County Total
Utilities 1.5278 0.1024 0.0523 $17,212.95
Construction 0.1698 0.0914 0.0928 $7,712.19
Retail Trade 1.8519 0.3361 0.1999 $5,109.15
Transportation and Warehousing 0.4244 0.0683 0.0403 $5,575.31
Educational Services 0.6366 0.2149 0.2027 $7,130.11
Health Care and Social Assistance 0.8127 0.7295 0.6032 $8,327.89
Arts, Entertainment, and Recreation 2.3342 3.1566 2.9719 $8,152.01
Accommodation and Food Services 2.4965 0.8462 0.7021 $2,819.04
Public Administration 1.0913 2.7717 2.5314 $8,572.17
(baseline) 1.000 1.000 1.000 $6,820.61
Asses s ing the e conomi c and non-e conomi c impac t s o f Har rah’s Cherokee Cas ino, Nor th Caro l ina
Page 10
Figure 16American Human Development Index, North Carolina Congressional Districts
Table 5: Life expectancy at birth for selected North Carolina regions
Life expectancy at birth, 1990-1992
Life expectancy at birth, 2006-2008
Change in life expectancy
Total Male Female Total Male Female Total Male Female
North Carolina 75.0 71.0 78.9 77.3 74.5 80.0 2.3 3.5 1.1
Cherokee region
Seven counties 77.0 73.2 81.1 76.6 74.0 79.2 -0.5 0.7 -2.0Two counties 74.8 71.2 78.3 74.8 71.8 77.8 0.0 0.5 -0.5Cherokee County 77.2 72.9 81.8 76.6 73.4 79.8 -0.6 0.5 -2.0Clay County 79.6 75.4 84.4 79.2 77.9 80.7 -0.4 2.5 -3.7Graham County 76.9 73.9 81.2 75.1 72.0 78.3 -1.8 -1.9 -2.9Haywood County 76.7 73.0 80.3 77.3 74.8 79.6 0.6 1.8 -0.7Jackson County 77.0 73.7 80.2 76.9 74.4 79.4 -0.1 0.7 -0.8Macon County 79.3 75.1 83.6 78.2 76.2 80.0 -1.1 1.1 -3.6Swain County 72.5 68.7 76.5 72.6 69.1 76.3 0.1 0.4 -0.2Mountain north regionSeven counties 76.8 72.3 81.5 77.9 75.2 80.7 1.1 2.9 -0.8Alleghany County 75.5 69.8 81.9 77.8 74.9 80.8 2.3 5.1 -1.1Ashe County 77.1 72.7 81.5 78.1 74.4 82.0 1.0 1.7 0.5Avery County 76.6 72.5 81.1 78.6 75.9 81.6 2.0 3.4 0.5McDowell County 75.9 71.9 80.0 76.4 74.1 78.8 0.5 2.2 -1.2Mitchell County 76.3 71.1 82.0 76.3 73.8 78.7 0.0 2.7 -3.3Watauga County 78.8 74.6 83.1 79.6 77.6 81.7 0.8 3.0 -1.4Yancey County 77.3 73.8 80.9 78.6 75.9 81.3 1.3 2.1 0.4
Table 4: American Human Development Scores for Selected Regions, 2005
United States
North Carolina
North Carolina CD 11
Rank 34 of 51 309 of 435
HD Index 5.06 4.61 4.45
Life Expectancy at birth (years)
78.0 76.6 76.8
Less than High School (%) 15.8 17.7 16.2
At least High School (%) 84.2 82.3 83.9
At Least Bachelors Degree 27.2 25.1 24.0
Graduate degree (%) 10.0 8.0 8.4
Educational Attainment Score
1.214 1.155 1.161
School enrollment (%) 86.8 87.5 88.4
Median Earnings (2005 dollars)
27,299 25,111 22,673
Health Index 5.00 4.43 4.51
Education Index 5.04 4.85 4.99
Income index 5.14 4.56 3.86
Source: The Measure of America

Asses s ing the e conomi c and non-e conomi c impac t s o f Har rah’s Cherokee Cas ino, Nor th Caro l ina
Page 11
region as a whole and for the two counties which contain the central portion of the EBCI lands. Similar information is also presented for the Mountain North comparison region to the north of Asheville and its surrounding county, Buncombe. Data for males, females, and both combined are shown for two time points (1990-1992 and 2006-2008) straddling the casino opening.
Table 5 shows a state-wide gain in life expectancy of 2.3 years between the early 1990s and the latter portion of the first decade of the new millennium. Males benefitted from the increase more than females. The Mountain North region also benefitted from health status improvements during this period. The Cherokee region, having started at a higher level, showed no improvement over the period and is now approximately on par with the state level.
Changes in infant mortality rates constitute yet another indicator of improvements in health status and reflect improvements in both the quality of health care and changes in parental behavior, especially with respect to pre-natal care. Data for selected North Carolina regions are shown in
Table 6. North Carolina’s infant mortality rate declined from 9.8 infant (less than one year of age) deaths per 1,000 live births in the early 1990s to 8.5 at the beginning of the decade to 8.3 in the second half of this decade. Although much improved, the mortality rate is still substantially higher than the overall U.S. rate (6.7) and much higher than that found in multi-racial Singapore (2.3) which has the world’s lowest recorded infant mortality rate.
The Cherokee Seven region is at approximate parity with the state but it should be noted that Swain County, in particular, reduced its infant mortality rate dramatically over the course of the 1990s. The last decade has been one of much less rapid improvement. Infant mortality rates in the Mountain North Counties are generally below the state average. While the casino has positively affected regional employment and income, the gain in employment and income have not yet translated into measurable impacts on these key health indicators.
Besides health and income, access to knowledge is the other key dimension of social development. Educational
Table 6: Infant Mortality Rates for selected North Carolina Regions, 1990s to the present
County 1992-1996 1999-2003 2005-2009 90s 00s
North Carolina 9.8 8.5 8.3 -1.3 -0.2
Cherokee region
Seven counties 9.0 6.7 8.1 -2.3 1.4
Two counties 11.7 7.1 7.4 -4.7 0.3
Cherokee County 9.1 9.1 9.1 0.0 0.0
Clay County 3.1 5.1 11.7 2.0 6.6
Graham County 6.5 3.9 8.1 -2.6 4.2
Haywood County 7.9 5.7 6.8 -2.2 1.1
Jackson County 9.1 8.3 8.2 -0.8 -0.1
Macon County 13.0 9.0 6.4 -4.0 -2.6
Swain County 14.3 5.8 6.5 -8.5 0.7
Mountain north region
Seven counties 8.2 6.8 6.6 -1.3 -0.2
Alleghany County 0.0 5.9 9.4 5.9 3.5
Ashe County 10.3 12.2 4.3 1.9 -7.9
Avery County 14.8 2.3 6.9 -12.5 4.6
McDowell County 7.8 8.3 6.5 0.5 -1.8
Mitchell County 8.8 9.6 6.2 0.8 -3.4
Watauga County 8.9 6.4 6.3 -2.5 -0.1

Asses s ing the e conomi c and non-e conomi c impac t s o f Har rah’s Cherokee Cas ino, Nor th Caro l ina
Page 12
attainment provides a high-level indicator of such access. Educational attainment is also an important contributor to individual and regional earning power as well as a measure of the cultural achievement and exposure of a region. Because the educational levels of all adults reflect achievements over many decades, we examined high school retention rates in the recent past. The data are summarized in Table 7. Between the late 1990s and 2007-2008 (the latest data available), the statewide dropout rate remained roughly constant. During the period, the dropout rates in the two seven-county regions also remained roughly constant but Jackson County’s dropout rate rose.
In Jackson and Swain Counties, American Indian students have graduated from high school at rates lower than other students. American Indian graduates have enrolled in UNC system schools at rates lower than those of other regional
graduates but recently they have been enrolling in community colleges at above average rates. These trends are consistent with American Indian educational performance throughout the state.
Graduation and dropout information for Cherokee Central Schools is presented in Table 8. The available data cover a shorter time period than those in the previous table. Moreover, they are reported to a different agency than the preceding schools, so the definitions may not be fully comparable. The dropout rates are high at Cherokee Central Schools and show no sign of decreasing. We caution, however, that the number of enrolled member students is low and that small annual variations can result in large shifts in rates. The generally low graduation rates are a puzzle because tribal members are entitled to access their accumulated personal share of casino earnings when they are 18 years old if they
Table 7: Public School dropout rates for selected North Carolina regions, 1997-1998 and 2007-20081997-1998 2007-2008
Grade 9 Estimated Enrollment base
Grades 7-12 Reported Dropouts
Dropout Rate
Grade 9 Estimated Enrollment base
Grades 7-12 Reported Dropouts
Dropout Rate
North Carolina 99,195 18,501 3.43 North Carolina 109,163 23,078 3.4
Cherokee region Cherokee region
Seven counties 269 51 3.5 Seven counties 264 62 3.6
Two counties 223 53 4.6 Two counties 227 68 5.1
Cherokee County 338 51 3.15 Cherokee County 285 49 2.8
Clay County 106 13 2.03 Clay County 102 16 2.5
Graham County 111 17 3.22 Graham County 101 13 2.5
Haywood County 532 103 3.05 Haywood County 601 159 4.2
Jackson County 305 60 3.52 Jackson County 311 87 5.1
Macon County 347 68 3.62 Macon County 309 59 2.9
Swain County 141 45 5.61 Swain County 142 49 5.1
Mountain north region
Seven counties 285 52 3.4 North mountains 266 61 3.8
Alleghany County 127 28 3.89 Alleghany County 136 21 2.9
Ashe County 343 65 4.02 Ashe County 236 63 4.2
Avery County 201 40 3.61 Avery County 156 26 2.5
McDowell County 465 98 3.49 McDowell County 535 126 4.1
Mitchell County 213 16 1.48 Mitchell County 200 51 4.8
Watauga County 426 78 3.26 Watauga County 400 78 3.4
Yancey County 223 42 3.77 Yancey County 201 62 4.9

Asses s ing the e conomi c and non-e conomi c impac t s o f Har rah’s Cherokee Cas ino, Nor th Caro l ina
Page 13
graduate high school. Those who do not graduate high school must wait until they are 21 to gain access to their accumulated funds but do begin receiving their annual share of earnings at age 18.
The Great Smoky Mountain Study of Youth has been following several cohorts of people, tribal members and not, who were aged 9, 11, and 13 in 1993. The study continues today with interviews and tests administered to the sampled research subjects continuing into early adulthood. The study was not designed to evaluate the social effects of the casino but it does provide positive evidence for the impact of the casino on young people because operations began several years after the study was initiated. The central finding of the study is that the revenue sharing arrangements of the casino and tribe improve child-parent interactions by raising families out of poverty. The consequent improved family interactions result in reduced rates of behavioral problems among children and adolescents and some improvement in educational performance. Although not the aim of the study, positive impacts on adults were also found.
Harrah’ Cherokee Casino Economic Impacts in DetailThe previous section surveyed the broad impacts of the
casino’s operation on the region. In this section, we attempt a more direct estimate of the economic impact and its constituent components. Specifically, we examine the revenue flows in more detail and separate out the impacts due to casino capital investment, casino operations, and casino disbursements. Figure 17 provides an overview of the tourism data relevant to assessing the economic impact of the casino on the regional and North Carolina economy. Our data extends to cover on-site spending at the casino resort but not the off-site spending
by casino guests or the off-site spending by those who were attracted to the region in part, by the facilities and amenities which the casino’s operation helped make possible but did not, in fact, visit the casino. The following discussion is therefore limited to describing and analyzing the impacts of on-site spending.
Our interest extends to three broad areas of casino cash flows. As shown in Figure 18, these include operating income, expenditures stemming from casino operation, including the several types of transfers to the EBCI (disussed in detail below), and capital expenditures. Examining the sources
Table 8: Cherokee Central Schools High School Graduation and Dropout Rates
Year Graduation rate Dropout rate
2004-2005 66.2 6.8
2005-2006 67.8 8.4
2006-2007 50.0 4.6
2007-2008 65.5 12.5
2008-2009 57.1 12.8
Source: Bureau of Indian Education, School Report Cards, available years;
www.bie.edu\HowAreWeDoing\Scorecards\index.htm On-site Spending
On-site Spending
On-site Spending
GamingRevenue
Off-site Spendingby Casino Guests
Off-site Spendingby Non-casino GuestsWho Were Attracted by
Amenities Made Possible by the Casino
Food & Beverage
Accomodations
Other Revenue
Off-site Spending
Off-site Spending
Off-site Spending
Figure 17Casino-linked Tourism Revenue
Figure 18Relevance of Casino Cash Flows to
Regional Economic Impact
Operational
Inflows Outflows
Relevant Relevant
RelevantInflowsCapital

Asses s ing the e conomi c and non-e conomi c impac t s o f Har rah’s Cherokee Cas ino, Nor th Caro l ina
Page 14
of income indicates the degree to which the casino draws money to the state. The importance of gaming in the resort’s revenue flows suggests the degree to which the revenues are not merely displacements of leisure income which could be flowing to other North Carolina resorts. The separate types of expenditures have different types and routes of economic impact.
Casino revenuesWe begin with an overview of casino income and
expenditure. Table 9 provides a high-level summary of the cash flows of Harrah’s Cherokee Casino. These are important in tracing the source and route of the economic impact of the casino on the North Carolina economy. The cash flows are divided into four categories: operating income, operating expenses, capital income, and capital expenditures. The source of the operating income, the operating expenses which remain in North Carolina, the capital expenditures in North Carolina, and the transfers to the Eastern Band of the Cherokee Indians are relevant to understanding the impact of the casino.
Having started operation in November 1997, the left side of the table begins with a summary of the operating revenue for selected years (based on October-September fiscal year). Gaming revenue began at $134 million in the year ending in September 1998 and grew to an estimated $386 million in
2010 after temporarily peaking at $449 million in 2007.
The casino also raises funds in the capital market, which adds to the cash flows, and earns a modest amount of interest on its cash holdings. These are critical to the operation of the casino but are included here only for completeness. The manner in which the casino spends these funds is of more direct interest.
The next column of figures summarizes the casino’s operating expenses. Payments are made to business partners and employees. Non-operational expenditures, mainly capital spending, are also shown. The casino also makes a number of financial transfers to the Eastern Band of the Cherokee Indians, the Cherokee Preservation Foundation, and regional non-profit organizations. These stem mainly from the operating surplus. Critical aspects of these financial flows are detailed below.
Table 10 summarizes information on casino revenues, breaking down the non-gaming revenues into food, hotel, retail, and showroom receipts. Non-gaming revenue has been relatively modest, hovering at approximately three percent of the total operating revenues. Those revenues have been generated by an annual flow of visitors of over three million, which reached a peak of 3.6 million in 2007 before the
Table 9: Harrah’ Cherokee Casino & Hotel Financial Overview, 1997-2010Dollar numbers are in thousands
Income Outflow
Total Operating Revenues
Non-operating income (including borrowing)
Total Revenue
Operational costs
Non-operational costs
Distributions to EBCI
Total
1998 133,985 30,465 164,450 123,418 37,059 43,412 153,532
2000 249,907 687 250,594 175,677 31,157 121,458 259,823
2002 322,173 41,899 364,072 202,105 86,001 161,398 374,067
2004 358,523 (419) 358,104 203,073 50,848 180,106 361,800
2006 426,133 97,076 523,209 232,066 129,924 236,834 515,608
2008 442,443 38,847 481,290 246,461 83,102 249,114 492,198
2010 385,786 215,052 600,838 126,547 296,167 209,304 575,271
Note: Fiscal Year October - September

Asses s ing the e conomi c and non-e conomi c impac t s o f Har rah’s Cherokee Cas ino, Nor th Caro l ina
Page 15
Table 10: Harrah’ Cherokee Casino & Hotel Total Revenues, 1997-2010Dollar numbers are in thousands
Income
Gross Gaming Revenue
Non-Gaming Revenue
Non-Gaming Total
Cash incentives included in revenue
Total Operating Revenues
Food Hotel Retail Showroom Meals Served
1998 127,972 3,974 511 446 4,931 133,985
2000 241,976 4,943 2,661 327 7,931 249,907
2002 318,359 4,055 738 5,483 246 10,522 (6,708) 322,173 1,543,689
2004 358,850 4,237 583 5,580 207 10,607 (10,934) 358,523 1,698,047
2006 429,138 5,070 1,189 6,509 162 12,930 (15,935) 426,133 2,195,052
2008 449,856 5,283 681 6,116 239 12,319 (19,732) 442,443 2,448,396
2010 377,967 6,972 584 5,089 239 12,884 (5,065) 385,786 2,415,642Note: Fiscal Year October - September
Figure 19Harrah’s Cherokee Casino Market Zones

Asses s ing the e conomi c and non-e conomi c impac t s o f Har rah’s Cherokee Cas ino, Nor th Caro l ina
Page 16
recession began taking its toll on household recreation budgets. In 2008, the casino served a total of nearly 2.5 million meals. Food accounts for a large portion of the non-gaming revenue but retail sales have exceeded meal sales in some years. Hotel rooms and conferences, along with entertainment and events have generated smaller proportions of the revenue. In part to soften the impact of gaming losses, the casino returns a percentage of its gaming revenues to guests, mainly in the form of cash incentives to stimulate return visits and discounts on rooms, food and other services.
Gaming is clearly the main source of revenue and likely the main motivation for tourist visits. Without the gaming attraction, it is unlikely that the non-gaming revenue would be generated and it is also likely that the surrounding region outside the casino would suffer a substantial loss of tourism revenue. The significant increase in regional income over the past several years likely owes its existence to the attractions of gaming and the unique attractions of the Harrah’s Cherokee Casino.
Table 11 contains information on “rated revenues,” which is the spending the casino can link to individuals and home addresses because those individuals use “player’s cards”. A significant portion of guests choose to use player’s cards because the casino bases special offers and complimentary discounts on the tracked play. In addition, a large proportion of the casino’s games are raffle entry devices which are dependent on the use of a player’s card to identify players and award prizes to the raffle winners. The use of a card is not mandatory on non-raffle games; therefore, the rated revenues are less than total gaming revenues. The proportion of revenue tracked via the use of player’s cards reached nearly 95 percent in 2007 before diminishing and then increasing again.
Figure 19 shows the geographic zones used by the casino in its marketing analysis. Several of these zones cross North Carolina state lines. Approximately half of the casino’s gaming revenue stems from the regions which are unambiguously out-of-state, reaching a few percentage points above half in some years and a few below in others. Approximately one-fourth of the gaming revenue is from the three zones closest to the casino (Local, Local South, and Local North). With a growing proportion of gaming revenues, now estimated at over two-thirds, stemming from out-of-state visitors, the data in the table suggest that a large portion of the gaming revenue, the tourist spending accompanying it, and the follow-on economic
impacts would not be generated in the state in the absence of the casino.
The Economic Impact of Casino OperationsThe previous paragraphs detailed the revenue sources.
The next several sections discuss the revenue expenditures and how they ripple through the regional economy. Figure 20 provides a schematic overview of the three types of economic impacts to be considered. The ongoing expenses incurred by the casino in the course of its daily operation are likely the source of the most important impacts on the state’s economy. Those operations also generate a profit which is transferred to the EBCI and then distributed further in the form of employment, spending, and direct transfers. Finally, capital expenditures, such as those incurred in the ongoing physical expansion, generate additional employment and purchases.
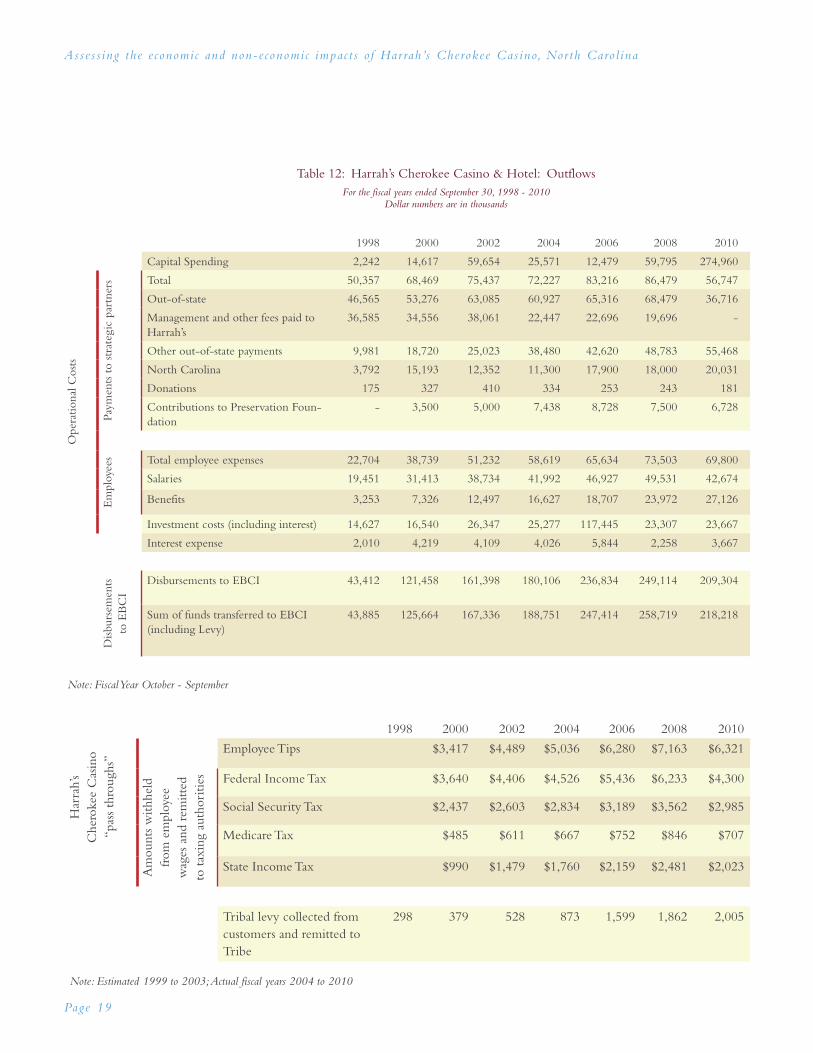
Table 12 provides a summary of casino financial outflows. The outflows include operating expenses, disbursements, and capital spending. Spending on employees includes net wage payments, federal income taxes, employee and employer contributions to social security and Medicare, and the employer cost of benefits. Tips, which are not considered casino revenue or expenditure but which are earnings, are listed at the bottom of the table. Employee tax withholdings and combined contributions to Social Security and Medicare are also listed.
The casino employed 1674 people in 2009, the most recent available count, 80 percent of whom were not enrolled members of the EBCI. Collectively, they earned a total of $67.7 million in 2009 (down slightly from $73.5 million in 2008) but up from $22.7 million in 1998. Employee salary and benefits have averaged around 15 percent of operating revenues, with the proportion decreasing to 12 percent in 2009. The casino was directly responsible for approximately eight percent of all wages and salary disbursements in the Cherokee Two region and five percent of the employment.
Aside from employee-related financial flows, the casino makes payments to suppliers and other organizations which are business partners. Payments to partners inside and outside North Carolina are shown separately. Out-of-state payments are critical to the casino’s operation but they do not circulate further through the North Carolina economy. The payments to employees and North Carolina organizations and firms circulate further through the State’s economy. These also

Asses s ing the e conomi c and non-e conomi c impac t s o f Har rah’s Cherokee Cas ino, Nor th Caro l ina
Page 17
Table 11: Harrah’ Cherokee Casino & Hotel Total Rated Revenues, 1997-2010Dollar numbers are in thousands
2003 2004 2005 2006 2007 2008 2009 2010 (Through June )
Regional revenue origin
228,686 267,297 317,592 385,407 431,540 376,814 352,286 364,055
01 ) Local Ultra-high Freq
15,526 19,929 22,659 25,050 26,703 21,931 20,125 19,335
02 ) Local South 10,663 12,978 15,893 19,038 20,838 16,553 14,582 13,999
03 ) Local North 34,994 41,047 46,587 54,337 60,971 53,541 47,247 45,226
04 ) Atlanta MSA 31,630 36,631 43,043 53,594 60,571 53,080 48,966 56,573
05 ) Knoxville MSA 16,121 19,644 23,805 27,481 30,900 26,729 24,374 24,858
06 ) Greenville MSA 13,286 15,469 18,078 21,554 22,965 21,384 21,705 22,871
07 ) West Inner Regional
13,681 16,518 20,651 24,210 27,734 23,874 22,966 23,034
08 )Charlotte MSA 16,968 19,023 21,457 26,326 30,067 26,911 24,711 25,622
09 ) NC Regional 26,504 29,653 34,513 39,909 45,137 37,960 35,216 34,499
10 ) Athens-Augusta Area
12,281 13,791 16,215 20,628 22,963 19,453 19,173 20,828
11 ) Columbia Area 6,926 7,140 8,318 10,557 12,310 12,311 12,129 12,860
12 ) Coastal 8,409 9,064 11,348 15,749 17,412 16,100 15,528 16,145
13 ) Outer North 6,385 7,514 9,055 11,638 12,729 11,902 11,456 11,817
14 ) Outer South 2,661 3,108 4,244 5,648 6,070 5,174 4,838 5,625
15 ) Florida 3,794 4,778 7,081 9,897 10,450 8,588 8,430 8,445
Undefined 8,857 11,009 14,645 19,793 23,720 21,324 20,841 22,317
Note: Fiscal Year October - September
Total Gaming Revenue
343,200 358,900 379,100 429,100 454,200 449,900 404,100 377,967
Percent Rated 66.6% 74.5% 83.8% 89.8% 95.0% 83.8% 87.2% 96.3%
Out of state 139,858 163,187 195,669 239,793 267,526 235,112 221,303 233,221
Percent 63.6% 63.7% 64.6% 65.6% 65.6% 66.1% 66.8% 68.2%
Close by 61,183 73,954 85,139 98,424 108,512 92,024 81,954 78,560
Percent 27.8% 28.9% 28.1% 26.9% 26.6% 25.9% 24.7% 23.0%
Capital Spending Vendors Employees
Dire
ct D
onat
ions
Pre
serv
atio
n Fu
nd
Trib
al D
istri
butio
n
Trib
al L
evy
Each type of spending has a different type of economic impact, varying in geographic and temporal extent and magnitude.
On-site SpendingAll to Vendors On-site SpendingOperational Expenses On-site SpendingDisburesements
Figure 20Three Key Routes of Immediate Economic Impact
Asses s ing the e conomi c and non-e conomi c impac t s o f Har rah’s Cherokee Cas ino, Nor th Caro l ina
Page 18
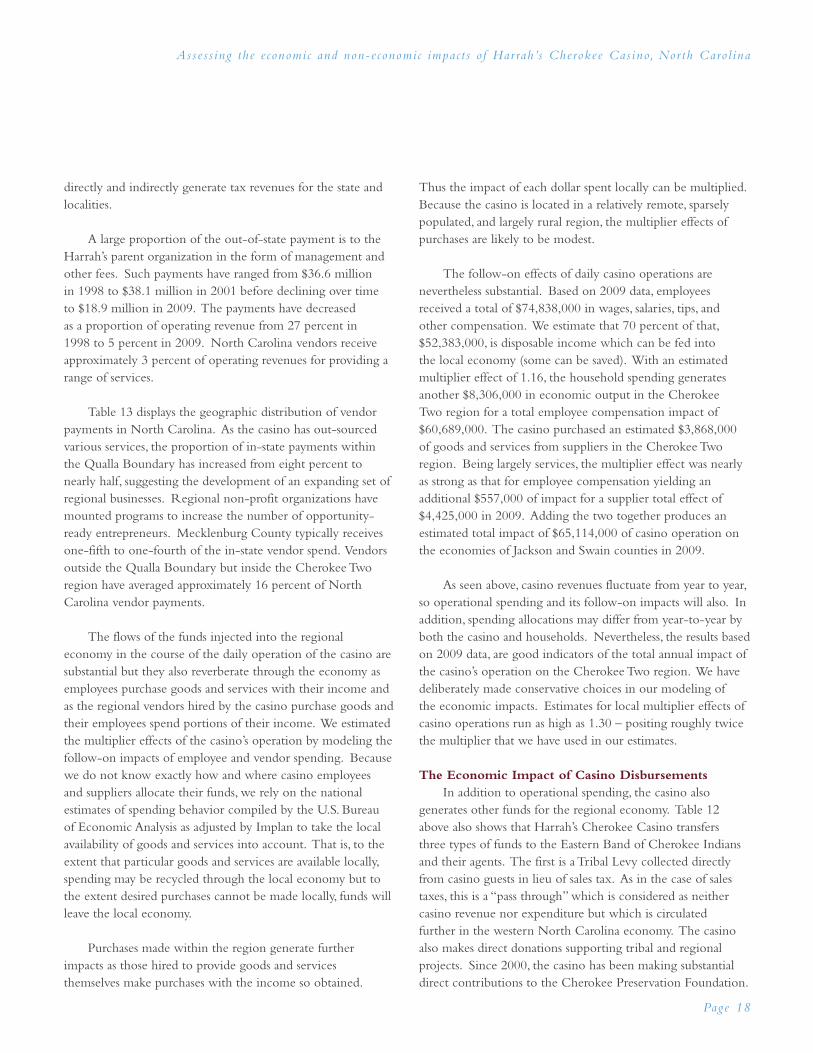
directly and indirectly generate tax revenues for the state and localities.
A large proportion of the out-of-state payment is to the Harrah’s parent organization in the form of management and other fees. Such payments have ranged from $36.6 million in 1998 to $38.1 million in 2001 before declining over time to $18.9 million in 2009. The payments have decreased as a proportion of operating revenue from 27 percent in 1998 to 5 percent in 2009. North Carolina vendors receive approximately 3 percent of operating revenues for providing a range of services.
Table 13 displays the geographic distribution of vendor payments in North Carolina. As the casino has out-sourced various services, the proportion of in-state payments within the Qualla Boundary has increased from eight percent to nearly half, suggesting the development of an expanding set of regional businesses. Regional non-profit organizations have mounted programs to increase the number of opportunity-ready entrepreneurs. Mecklenburg County typically receives one-fifth to one-fourth of the in-state vendor spend. Vendors outside the Qualla Boundary but inside the Cherokee Two region have averaged approximately 16 percent of North Carolina vendor payments.
The flows of the funds injected into the regional economy in the course of the daily operation of the casino are substantial but they also reverberate through the economy as employees purchase goods and services with their income and as the regional vendors hired by the casino purchase goods and their employees spend portions of their income. We estimated the multiplier effects of the casino’s operation by modeling the follow-on impacts of employee and vendor spending. Because we do not know exactly how and where casino employees and suppliers allocate their funds, we rely on the national estimates of spending behavior compiled by the U.S. Bureau of Economic Analysis as adjusted by Implan to take the local availability of goods and services into account. That is, to the extent that particular goods and services are available locally, spending may be recycled through the local economy but to the extent desired purchases cannot be made locally, funds will leave the local economy.
Purchases made within the region generate further impacts as those hired to provide goods and services themselves make purchases with the income so obtained.
Thus the impact of each dollar spent locally can be multiplied. Because the casino is located in a relatively remote, sparsely populated, and largely rural region, the multiplier effects of purchases are likely to be modest.
The follow-on effects of daily casino operations are nevertheless substantial. Based on 2009 data, employees received a total of $74,838,000 in wages, salaries, tips, and other compensation. We estimate that 70 percent of that, $52,383,000, is disposable income which can be fed into the local economy (some can be saved). With an estimated multiplier effect of 1.16, the household spending generates another $8,306,000 in economic output in the Cherokee Two region for a total employee compensation impact of $60,689,000. The casino purchased an estimated $3,868,000 of goods and services from suppliers in the Cherokee Two region. Being largely services, the multiplier effect was nearly as strong as that for employee compensation yielding an additional $557,000 of impact for a supplier total effect of $4,425,000 in 2009. Adding the two together produces an estimated total impact of $65,114,000 of casino operation on the economies of Jackson and Swain counties in 2009.
As seen above, casino revenues fluctuate from year to year, so operational spending and its follow-on impacts will also. In addition, spending allocations may differ from year-to-year by both the casino and households. Nevertheless, the results based on 2009 data, are good indicators of the total annual impact of the casino’s operation on the Cherokee Two region. We have deliberately made conservative choices in our modeling of the economic impacts. Estimates for local multiplier effects of casino operations run as high as 1.30 – positing roughly twice the multiplier that we have used in our estimates.
The Economic Impact of Casino DisbursementsIn addition to operational spending, the casino also
generates other funds for the regional economy. Table 12 above also shows that Harrah’s Cherokee Casino transfers three types of funds to the Eastern Band of Cherokee Indians and their agents. The first is a Tribal Levy collected directly from casino guests in lieu of sales tax. As in the case of sales taxes, this is a “pass through” which is considered as neither casino revenue nor expenditure but which is circulated further in the western North Carolina economy. The casino also makes direct donations supporting tribal and regional projects. Since 2000, the casino has been making substantial direct contributions to the Cherokee Preservation Foundation.
Asses s ing the e conomi c and non-e conomi c impac t s o f Har rah’s Cherokee Cas ino, Nor th Caro l ina
Page 19
Table 12: Harrah’s Cherokee Casino & Hotel: OutflowsFor the fiscal years ended September 30, 1998 - 2010
Dollar numbers are in thousands
1998 2000 2002 2004 2006 2008 2010
Capital Spending 2,242 14,617 59,654 25,571 12,479 59,795 274,960
Ope
ratio
nal C
osts
Paym
ents
to s
trat
egic
par
tner
s Total 50,357 68,469 75,437 72,227 83,216 86,479 56,747
Out-of-state 46,565 53,276 63,085 60,927 65,316 68,479 36,716
Management and other fees paid to Harrah’s
36,585 34,556 38,061 22,447 22,696 19,696 -
Other out-of-state payments 9,981 18,720 25,023 38,480 42,620 48,783 55,468
North Carolina 3,792 15,193 12,352 11,300 17,900 18,000 20,031
Donations 175 327 410 334 253 243 181
Contributions to Preservation Foun-dation
- 3,500 5,000 7,438 8,728 7,500 6,728
Em
ploy
ees Total employee expenses 22,704 38,739 51,232 58,619 65,634 73,503 69,800
Salaries 19,451 31,413 38,734 41,992 46,927 49,531 42,674
Benefits 3,253 7,326 12,497 16,627 18,707 23,972 27,126
Investment costs (including interest) 14,627 16,540 26,347 25,277 117,445 23,307 23,667
Interest expense 2,010 4,219 4,109 4,026 5,844 2,258 3,667
Disb
urse
men
ts
to E
BC
I
Disbursements to EBCI 43,412 121,458 161,398 180,106 236,834 249,114 209,304
Sum of funds transferred to EBCI (including Levy)
43,885 125,664 167,336 188,751 247,414 258,719 218,218
Note: Fiscal Year October - September
1998 2000 2002 2004 2006 2008 2010
Har
rah’
s
Che
roke
e C
asin
o “p
ass
thro
ughs
”
Employee Tips $3,417 $4,489 $5,036 $6,280 $7,163 $6,321
Am
ount
s w
ithhe
ld
from
em
ploy
ee
wag
es a
nd r
emitt
ed
to ta
aut
hori
ties Federal Income Tax $3,640 $4,406 $4,526 $5,436 $6,233 $4,300
Social Security Tax $2,437 $2,603 $2,834 $3,189 $3,562 $2,985
Medicare Tax $485 $611 $667 $752 $846 $707
State Income Tax $990 $1,479 $1,760 $2,159 $2,481 $2,023
Tribal levy collected from customers and remitted to Tribe
298 379 528 873 1,599 1,862 2,005
Note: Estimated 1999 to 2003; Actual fiscal years 2004 to 2010

Asses s ing the e conomi c and non-e conomi c impac t s o f Har rah’s Cherokee Cas ino, Nor th Caro l ina
Page 20
Finally, the casino operating profits, minus a contribution to capital funds, are distributed to the tribe. The Tribal Distribution has increased from 32 percent of operating revenue ($43.4 million) in 1998 to approximately 50 percent for 2000 through 2004, further increasing to 60 percent ($225.8 million) in 2005, and stabilizing at 56% for 2006 through 2009, dipping to 54% in 2010.
Table 14 summarizes the allocation of the Tribal Distribution. Half of the casino’s transfer is paid to individual enrolled members by the Tribe. The accounts of the children are held in trust until they reach age 21 (or 18, if they complete high school). The other half of the distribution is used to finance collective benefits to the tribe. The largest proportion of the collective portion of the distribution is used to finance the government and administration of the tribe. The EBCI employed 1116 persons in 2009. Another 287 were employed by Cherokee Hospital and 556 by the Cherokee Boys Club, for a total of 1979 jobs, largely supported by the casino Tribal Distribution and Tribal Levy on visitors to the
casino. Debt service accounts for the next largest portion of the distribution. Education and health care each receive 4.5 percent of the distribution.
We estimated the follow-on impacts of the Tribal Distribution using the methods described above. In doing so, we performed the analysis in two parts. Half of the Tribal distribution is allocated directly to households, so we modeled the impacts of those funds as if it were household income. In 2009, an estimated $113,446,000 was distributed to households. That equals eight percent of all personal income in the two-county region. Using our estimate of 70 percent of the income being disposable, we arrived at $79,412,000 being available for spending. The spending results in an additional $12,592,000 being generated in the local economy. The other half of the tribal distribution was devoted to local government-type expenditures. That spending resulted in an estimated additional $23,988,000 in multiplier spending. (The multiplier ratio for the latter spending turned out to be slightly higher than for consumer spending.) Summing the
Table 13: Casino North Carolina Vendor Spend by Geographic RegionDollar numbers are in thousands
2000 2002 2004 2006 2008 2010
Mecklenburg 37% 36% 23% 28% 18% 28%
Buncombe 12% 7% 8% 10% 8% 5%
Jackson 9% 7% 3% 6% 2% 2%
Haywood 2% 2% 11% 3% 2% 2%
Macon 1% 0% 1% 0% 0% 0%
Swain 1% 2% 3% 3% 15% 10%
Qualla Boundary 26% 40% 48% 43% 43% 43%
Other 13% 5% 3% 7% 12% 10%
13% 12% 18% 12% 19% 15%
Total Vendor Spend $13,285 $15,691 $15,000 $12,100 $20,800 $20,031
Mecklenburg 4,870 5,625 3,450 3,388 3,744 5,513
Buncombe 1,535 1,162 1,200 1,210 1,664 1,072
Jackson 1,201 1,113 450 726 416 460
Haywood 270 379 1,650 363 416 367
Macon 74 42 150 - - -
Swain 176 341 450 363 3,120 2,081
Qualla Boundary 3,490 6,304 7,200 5,203 8,944 8,623
Other 1,669 726 450 847 2,496 1,915

Asses s ing the e conomi c and non-e conomi c impac t s o f Har rah’s Cherokee Cas ino, Nor th Caro l ina
Page 21
total impacts, $92,004,000 and $137,434,000, of both types of spending yields a total impact of $229,438,000.
Cherokee Preservation Foundation grantsThe Cherokee Preservation Foundation was established
to build community capacity within the Qualla Boundary region. Beginning in the October 2000-September 2001 fiscal year, Harrah’s Cherokee Casino has provided substantial funds to the Cherokee Preservation Foundation. The initial endowment was $5,000,000 per year for the first three years. In years since, the endowment has been based on the increase in net gaming revenue realized by the Tribe as a result of the amended contract. By the terms of the Tribal compact, funding is set to be at least $5,000,000 but not more than $10,000,000 per year for the life of the compact.
By the end of the 2010 fiscal year, those donations totaled $74 million. Correspondingly, since its formation in 2001 through mid-2010, the Cherokee Preservation Foundation has made a total of 661 grants totaling nearly $51 million. Grants
have averaged over $5.65 million each year and, after a start-up and catch-up period, settling down to approximately that level each year. Each dollar of Cherokee Preservation Foundation funding has been matched by an average of $1.64 in support from other non-profit or government sources.
Over half of those grant funds have gone to cultural preservation. Another third has been spent on economic development projects with an additional 6.4 percent spent specifically on developing employment opportunities. The remaining 7.6 percent has been devoted to environmental preservation. Figure 21 charts the disbursements over time. Despite the apparent diversity of the funding, the Cherokee Preservation Foundation’s grants have the aim of further strengthening and diversifying the regional economy away from its present heavy dependence on gaming.
Nearly 80 percent of the total has been dispersed within the Qualla Boundary. Another eight percent has been spent outside the Qualla Boundary within the two surrounding
Table 14: Casino Tribal Distribution by Category of UseDollar numbers are in thousands
2000 2002 2004 2006 2008 2010
Tribal Distribution $116,664 $161,000 $177,482 $239,310 $243,860 $210,118
EBCI Allocation of Distribution
Per Capita 50% 50% 50% 50% 50% 50%
General Fund 13.59% 20.00% 20.00% 20.00% 20.00% 20.00%
Endowment Fund 14.41% 8.00% 8.00% 7.00% 7.00% 7.00%
Health Supplement Fund 1.00% 3.00% 3.00% 3.50% 4.50% 4.50%
Cherokee Home Improvement 2.00% 1.00% 0.25% 1.00% 1.00% 1.00%
Cherokee Schools 2.00% 2.00% 2.00% 2.00% 2.00% 2.00%
Capital Improvement 3.00% 3.25% 4.00% 3.50% 3.00% 3.00%
Higher Education 0.50% 0.75% 2.00% 2.50% 2.50% 2.50%
Debt Service Sinking Fund 12.00% 10.00% 8.00% 8.00% 6.25% 6.25%
Housing Infrastructure 1.50% 1.00% 1.00% 1.50% 1.50% 1.50%
Mutual Help 1.00% 0.75% 0.50% 0.50% 0.50%
Roads Infrastructure 1.00% 0.50% 0.50% 0.50%
Police & Corrections 1.25% 1.25%
Total 100.00% 100.00% 100.00% 100.00% 100.00% 100.00%Every month’s profits are sent to the Tribe monthly as a Tribal Distribution. The Tribe then uses the funds in the above manner. The community reports give a
more thorough explanation of the funds and their uses.

Asses s ing the e conomi c and non-e conomi c impac t s o f Har rah’s Cherokee Cas ino, Nor th Caro l ina
Page 22
counties, Jackson and Swain. An additional eight percent of the funds have gone to the remaining portions of the Cherokee Seven region. The final five percent were spent further afield. (Figures may not add to the total because of rounding error.) The Cherokee Preservation Foundation distributes an average of $4,972,000 in the Cherokee Two region, those grants have an estimated total economic impact of $5,636,000 on the local economy in addition to the benefits of the work completed with those resources.
The Economic Impact of Casino Capital InvestmentThe casino has mounted an aggressive capital investment
program. Table 15 provides an overview of the allocation of the casino’s capital spending. Capital investment was relatively low after the initial opening of the casino in 1998 but has since increased in waves. In 2009, one fourth of operating revenues were dedicated to new capital investment. Capital spending distributed among land and improvements, equipment, and construction. The expansion of the casino generates construction employment along with orders to North Carolina-based suppliers. The final two columns of the table are estimates of the degree to which the capital spending is out-of-state and in-state – further circulating through the economy. A portion of the equipment purchases remains in-state. We estimate that of the $119,753,000 spent on construction in 2009, $76,870,253 was to Cherokee Two sources as prime or sub-contractors. We estimate a total impact of $82,494,000 on the local economy. The multiplier effects are modest in this case because a large proportion of construction spending goes to materials which are not locally produced.
ConclusionWestern Carolina was and continues to be an
economically lagging region. By attracting significant gaming tourist spending to the region, a majority of which comes from out of state, the opening of Harrah’s Cherokee Casino has had a clear positive impact on the economy of Western North Carolina. The long term economic trends indicate that, without the casino, the region and the state would not have attracted that revenue.
0
1000000
2000000
3000000
4000000
5000000
6000000
7000000
8000000
9000000
10000000
2002 2003 2004 2005 2006 2007 2008 2009 2010
Dollars
Cultural Preservation Economic Development
Employment Opportunities Environmental Preservation
Figure 21Cherokee Preservation Foundation grants by
program area, 2002-2010
Table 15: Harrah’ Cherokee Casino Capital Investment SpendingDollar numbers are in thousands
Year Total Capital Investment
Land & land Improvements
Equipment Construction Out-of-state Spending
North Carolina Spending
1998 22,432 n/a n/a n/a n/a
2000 14,617 5,917 5,086 3,614 7,497 7,120
2002 59,654 2,832 5,480 51,342 39,725 19,929
2004 25,751 5,385 4,017 16,349 14,922 10,829
2006 12,479 107 5,308 7,064 10,020 2,459
2008 59,795 3,826 14,949 41,020 42,309 17,486
2010 274,960 37,003 76,101 161,856 184,059 90,901
Note: Fiscal Year October - September
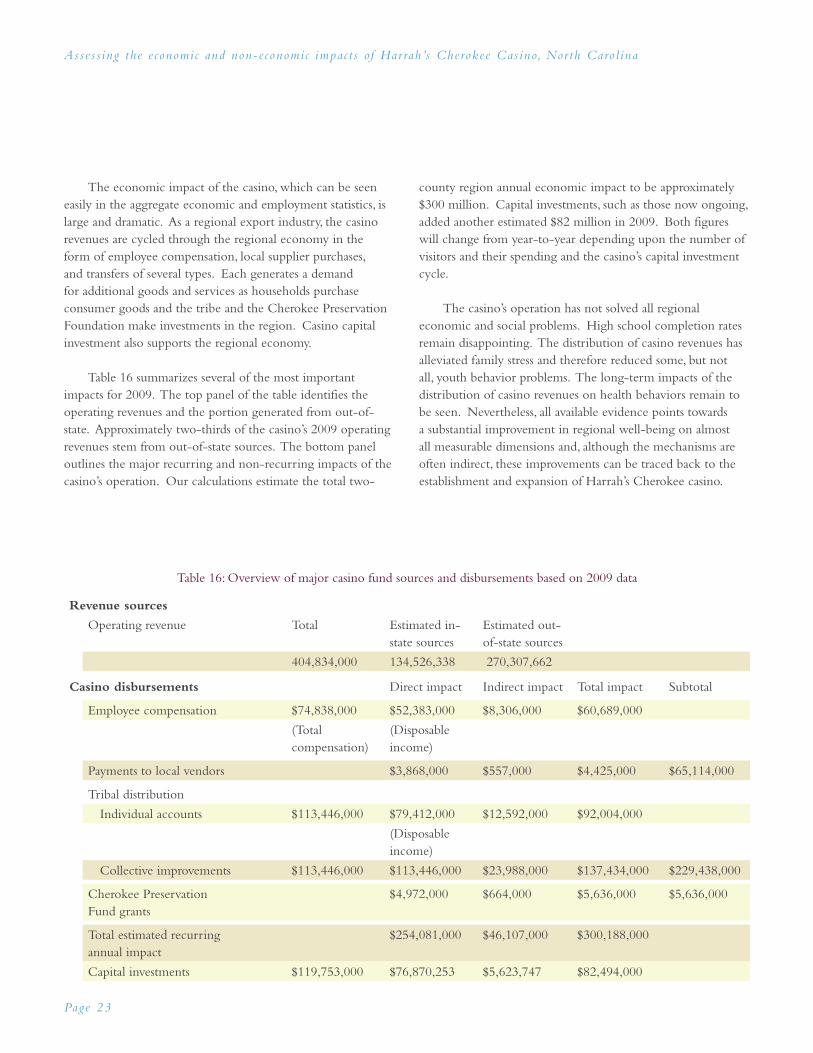
Asses s ing the e conomi c and non-e conomi c impac t s o f Har rah’s Cherokee Cas ino, Nor th Caro l ina
Page 23
The economic impact of the casino, which can be seen easily in the aggregate economic and employment statistics, is large and dramatic. As a regional export industry, the casino revenues are cycled through the regional economy in the form of employee compensation, local supplier purchases, and transfers of several types. Each generates a demand for additional goods and services as households purchase consumer goods and the tribe and the Cherokee Preservation Foundation make investments in the region. Casino capital investment also supports the regional economy.
Table 16 summarizes several of the most important impacts for 2009. The top panel of the table identifies the operating revenues and the portion generated from out-of-state. Approximately two-thirds of the casino’s 2009 operating revenues stem from out-of-state sources. The bottom panel outlines the major recurring and non-recurring impacts of the casino’s operation. Our calculations estimate the total two-
county region annual economic impact to be approximately $300 million. Capital investments, such as those now ongoing, added another estimated $82 million in 2009. Both figures will change from year-to-year depending upon the number of visitors and their spending and the casino’s capital investment cycle.
The casino’s operation has not solved all regional economic and social problems. High school completion rates remain disappointing. The distribution of casino revenues has alleviated family stress and therefore reduced some, but not all, youth behavior problems. The long-term impacts of the distribution of casino revenues on health behaviors remain to be seen. Nevertheless, all available evidence points towards a substantial improvement in regional well-being on almost all measurable dimensions and, although the mechanisms are often indirect, these improvements can be traced back to the establishment and expansion of Harrah’s Cherokee casino.
Table 16: Overview of major casino fund sources and disbursements based on 2009 data
Revenue sources
Operating revenue Total Estimated in-state sources
Estimated out-of-state sources
404,834,000 134,526,338 270,307,662
Casino disbursements Direct impact Indirect impact Total impact Subtotal
Employee compensation $74,838,000 $52,383,000 $8,306,000 $60,689,000
(Total compensation)
(Disposable income)
Payments to local vendors $3,868,000 $557,000 $4,425,000 $65,114,000
Tribal distribution
Individual accounts $113,446,000 $79,412,000 $12,592,000 $92,004,000
(Disposable income)
Collective improvements $113,446,000 $113,446,000 $23,988,000 $137,434,000 $229,438,000
Cherokee Preservation Fund grants
$4,972,000 $664,000 $5,636,000 $5,636,000
Total estimated recurring annual impact
$254,081,000 $46,107,000 $300,188,000
Capital investments $119,753,000 $76,870,253 $5,623,747 $82,494,000
REFERENCES

Asses s ing the e conomi c and non-e conomi c impac t s o f Har rah’s Cherokee Cas ino, Nor th Caro l ina
Page 24
1 Johnson, Tadd (September 1998). Regulatory Issues and
Impacts of Gaming in Indian Country. Increasing Understanding
of Public Problems and Policies: Proceedings of the 1998 National
Public Policy Education Conference. pp. 140–144. http://
ageconsearch.umn.edu/bitstream/17932/1/ar980140.pdf.
2 North Carolina court of Appeals, 22 December 2009, www.
aoc.state.nc.us/www/public/coa/opinions/2009/pdf/090431-1.pdf
3 Principal Chief Michell Hicks, undated, Eastern Band of
Cherokee Indians, Powerpoint presentation.
4 U.S. Bureau of Economic Analysis, Regional Economic
Information System (REIS), www.bea.gov/regional/docs/
reis2008dvd.cfm
5 The Employment Security Commission of North Carolina
Labor Market Information http://esesc23.esc.state.nc.us/d4/
LAUSSelection.aspx
6 The Quarterly Census of Employment and Wages (QCEW)
program publishes a quarterly count of employment and wages
reported by employers covering 98 percent of U.S. jobs, available at
the county, MSA, state and national levels by industry. In the late
1990s, the U.S. government switched to an industrial classification
system (NAICS) which is better suited to tracking employment in
a service economy but data for the entire decade was reprocessed to
create an historical baseline for comparison. www.bls.gov/cew/
7 Nationally, public administration employment is approximately
40 percent higher within tribal areas than it is for the U.S. as a whole.
Employment in producer services tends to be under-represented.
8 Sarah Burd-Sharps, Kristen Lewis, and Eduardo Borges
Martins, eds., 2008, The Measure of America: American Human
Development Report, 2008-2009, New York: Columbia University
Press for the Social Science Research Council.
9 North Carolina State Center for Health Statistics, Life
Expectancy: North Carolina 1990-1992 and 2006-2008, State and
County, www.schs.state.nc.us/SCHS/data/lifexpectancy/
10 North Carolina State Center for Health Statistics, Infant
Mortality Statistics, www.schs.state.nc.us/SCHS/data/vitalstats.cfm
11 Public Schools of North Carolina (Department of Public
Instruction; State Board of Education), Statistical Profile, selected
years, www.ncpublicschools.org/fbs/resources/data/
12Weaving Innovative Opportunities for American
Indian Students, State Advisory Council on Indian Education,
2009 Report to the North Carolina State Board of Education,
www.ncpublicschools.org/docs/americanindianed/reports/
2009indianedreport.pdf
13 Costello, E. Jane; Compton, Scott N.; Keeler, Gordon;
Angold, Adrian,” (2003), “Relationships Between Poverty and
Psychopathology: A Natural Experiment,”JAMA: Journal of the
American Medical Association, 290(15):. 2023-2029; Randall K. Q.
Akee, William E. Copeland, Gordon Keeler, Adrian Angold and E.
Jane Costello, (2010), “Parents’ Incomes and Children’s Outcomes:
A Quasi-experiment Using Transfer Payments from Casino Profits,”
American Economic Journal: Applied Economics, 2(1): 86-115;
Costello, E. Jane; Erkanli, Alaattin; Copeland, William; Angold, Adrian,
(2010) “Association of family income supplements in adolescence
with development of psychiatric and substance use disorders in
adulthood among an American Indian population,” JAMA: Journal of
the American Medical Association, 303(19): 1954-1960. The degree
to which the positive impacts extend into adulthood is not yet clear.
14 No confidential information was revealed for this analysis.
15 The casino market zones included in the out-of-state
calculations are 04) Atlanta MSA, 05) Knoxville MSA, 06) Greenville
MSA, 07) West Inner Regional, 10) Athens-Augusta Area, 11)
Columbia Area, 13) Outer North, 14) Outer South, 15) Florida,
three-fourths of 02) Local South, one half of 03) Local North, one
fifth of 08) Charlotte MSA, and one half of 12) Coastal.
16 A portion of employee compensation is absorbed by pension
contributions, Social Security, and other institutions which remove
funds from immediate circulation in the regional economy.
17 A multiplier of 1.16 implies that each dollar of spending
induced by casino employee compensation creates a total of $1.16 in
local spending as the supermarket clerks, automobile mechanics, and
dentists which serve casino employees themselves make purchases.
REFERENCESREFERENCES CITED

Asses s ing the e conomi c and non-e conomi c impac t s o f Har rah’s Cherokee Cas ino, Nor th Caro l ina
Page 25
AUTHORSABOUT THE AUTHORS
James H. Johnson Jr.
Jim Johnson is the William Rand Kenan, Jr. Distinguished Professor of Management at UNC ’s Kenan-Flagler Business School and director of the Urban Investment Strategies Center at the Frank Hawkins Kenan Institute of Private Enterprise. He holds
degrees from North Carolina Central University (B.S., 1975), the University of Wisconsin at Madison (M.S., 1977), and Michigan State University (Ph.D., 1980).
Selected by Fast Company magazine as one of the “17…brightest thinkers and doers in the new world of work,” Johnson’s research and consulting activities focus on the workforce and workplace implications of demographic changes in the United States and on how to create highly competitive and sustainable business enterprises and communities. His research on these and related topics has been widely cited in a number of national media outlets, including the New York Times, Wall Street Journal, Washington Post, Detroit Free Press, Newsweek, Time Magazine, U.S. News and World Report, and Business Week. He also has appeared on a number of national television shows, including The Today Show on NBC, CNN Headline News, CBS Evening News, ABC Nightly News, Sunday Morning on CBS, Inside Politics on CNN , and This Week in Review on ABC.
John D. Kasarda
John Kasarda is the Kenan Distinguished Professor of Management at UNC ’s Kenan-Flagler Business School and the director of the Frank Hawkins Kenan Institute of Private Enterprise. He received his B.S. and M.B.A. (with distinction) from Cornell University and his
Ph.D. from the University of North Carolina at Chapel Hill.
Kasarda has published more than one- hundred scholarly articles and nine books on economic development and business issues. He is frequently quoted in the Wall Street
Journal, New York Times, and other national and international media. He has served as a consultant to the Carter, Reagan, Bush, and Clinton administrations and has testified numerous times before U.S. Congressional Committees on urban and economic development. Kasarda had been elected as a fellow of the American Association for the Advancement of Science for his research on demographics and job creation and is a trustee of the Urban Land Institute.
Stephen J. Appold
Stephen J. Appold is Senior Research Associate at the Frank Hawkins Kenan Institute of Private Enterprise at the University of North Carolina at Chapel Hill. He has a PhD from UNC Chapel Hill and has taught at Carnegie-Mellon University and the National
University of Singapore. Appold specializes in regional and community development with an emphasis on measuring the economic impact of demographic change and of infrastructure and human capital investments. He has contributed to Kenan Institute reports on the economic implications of Hispanic and African-American populations.


The Frank Hawkins Kenan Institute of Private Enterprise pursues leading-edge programming and research in the areas of entrepreneurship, economic development, and global competitiveness. It is part of Kenan-Flagler Business School at The University of North Carolina at Chapel Hill.
FRANK HAWKINS KENAN INSTITUTE OF PRIVATE ENTERPRISE
CB 3440, Kenan Center • Chapel Hill, NC 27599-3440
Phone: 919/962-8201 • Fax: 919/962-8202
E-mail: [email protected] • www.kenaninstitute.unc.edu