assessing the feasibility of processing and marketing...
TRANSCRIPT

ASSESSING THE FEASIBILITY OF PROCESSING AND MARKETING NICHE SOY OIL
Sergio H. Lence and Sanjeev Agarwal
MATRIC Research Paper 03-MRP 6 August 2003 (Revised)
Midwest Agribusiness Trade Research and Information Center Iowa State University
Ames, Iowa 50011-1070 www.matric.iastate.edu
Sergio H. Lence is an associate professor of economics and Sanjeev Agarwal is an associate professor of marketing, both at Iowa State University. Available online on the MATRIC website: www.matric.iastate.edu. Permission is granted to reproduce this information with appropriate attribution to the authors and to MATRIC at Iowa State University. MATRIC is supported by the Cooperative State Research, Education, and Extension Service, U.S. Department of Agriculture, under Agreement No. 92-34285-7175. Any opinions, findings, conclusions, or recommendations expressed in this publication are those of the authors and do not necessarily reflect the view of the U.S. Department of Agriculture. For questions or comments about the contents of this paper, please contact Sergio Lence, 166C Heady Hall, Iowa State University, Ames, IA 50011-1070; Ph: 515-294-8960; Fax: 515-294-4545; E-mail: [email protected]. Iowa State University does not discriminate on the basis of race, color, age, religion, national origin, sexual orientation, sex, marital status, disability, or status as a U.S. Vietnam Era Veteran. Any persons having inquiries concerning this may contact the Director of Equal Opportunity and Diversity, 1350 Beardshear Hall, 515-294-7612.

Table of Contents
Abstract.................................................................................................................... iv 1. Introduction............................................................................................................1 2. Characteristics of niche soy oil and by-products ...................................................2
2.1. Technologies to extract oil from soybeans ....................................................3 2.2. Technologies to refine soybean oil ................................................................4
2.2.1. Degumming .........................................................................................5 2.2.2. Neutralization ......................................................................................5 2.2.3. Bleaching .............................................................................................6 2.2.4. Deodorization – physical removal of free fatty acids..........................6
3. Current supply and demand structure of relevance to niche soy oil......................7 3.1 General supply and demand aspects of soybeans, oil, and meal ....................7 3.2 U.S. supply and demand of soybeans used to extract niche soy oil..............10
3.2.1. Factors influencing the decision to produce either GM or non-GM soybeans .........................................................................12
3.2.2. Soybean prices ...................................................................................14 3.3. Commercialization of soybeans used to extract niche soy oil .....................17 3.4. Supply and demand of niche soy oil ............................................................18
3.4.1. Production of niche soy oil ................................................................18 3.4.2. Consumption of niche soy oil ............................................................19 3.4.3. Oil prices............................................................................................21
3.5. Demand for meal by-product from extraction of niche soy oil ...................22 4. Sensitivity analysis of niche soy oil and meal premiums in the long-run ...........23 5. Summary and conclusions ...................................................................................27 Figures .....................................................................................................................30 Endnotes ..................................................................................................................40 Appendix A: Business profiles of U.S. producers of niche soy oil ........................42 Appendix B: List of individuals and firms interviewed for the present study........46 References................................................................................................................48

Tables Table 1. Typical composition of soybean oils from different processes ....................... 4 Table 2. World disposition of soybeans, 1996/97–2001/03........................................... 9 Table 3. U.S. area planted to soybeans, by type (1,000 acres) .................................... 12 Table 4. U.S. soybean usage, by type (1,000 mt/year) ................................................ 12 Table 5. Estimated costs of production of soybeans following corn in Iowa
for 2002, assuming yields of 45 bushels/acre ................................................ 15 Table 6. U.S. average farm prices received for soybeans, by type ($/bu) ................... 15 Table 7. Spread between value of products and soybean prices, for solvent
extraction process........................................................................................... 25
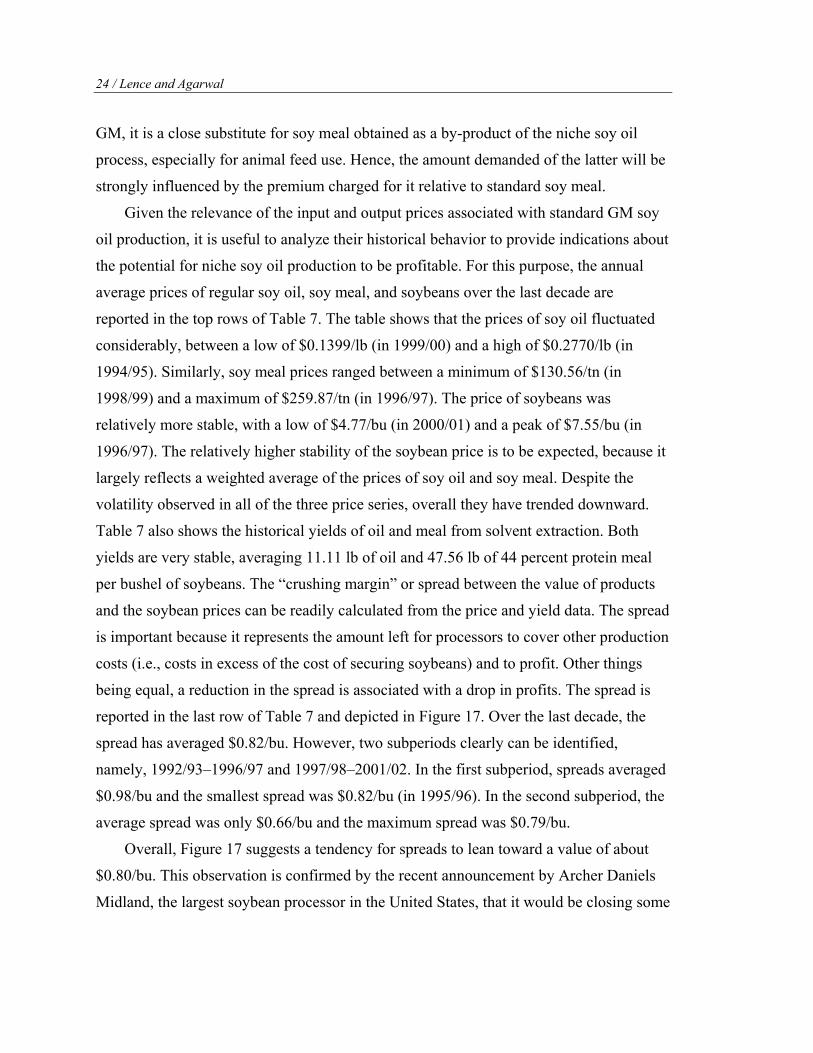
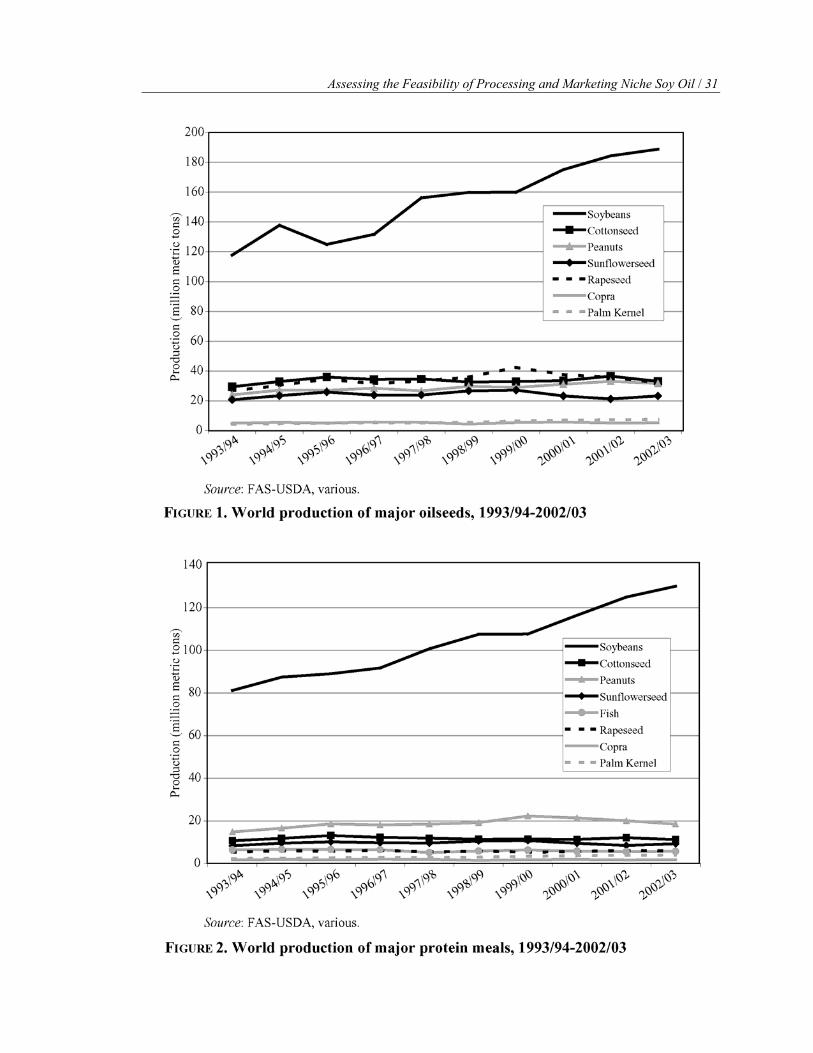
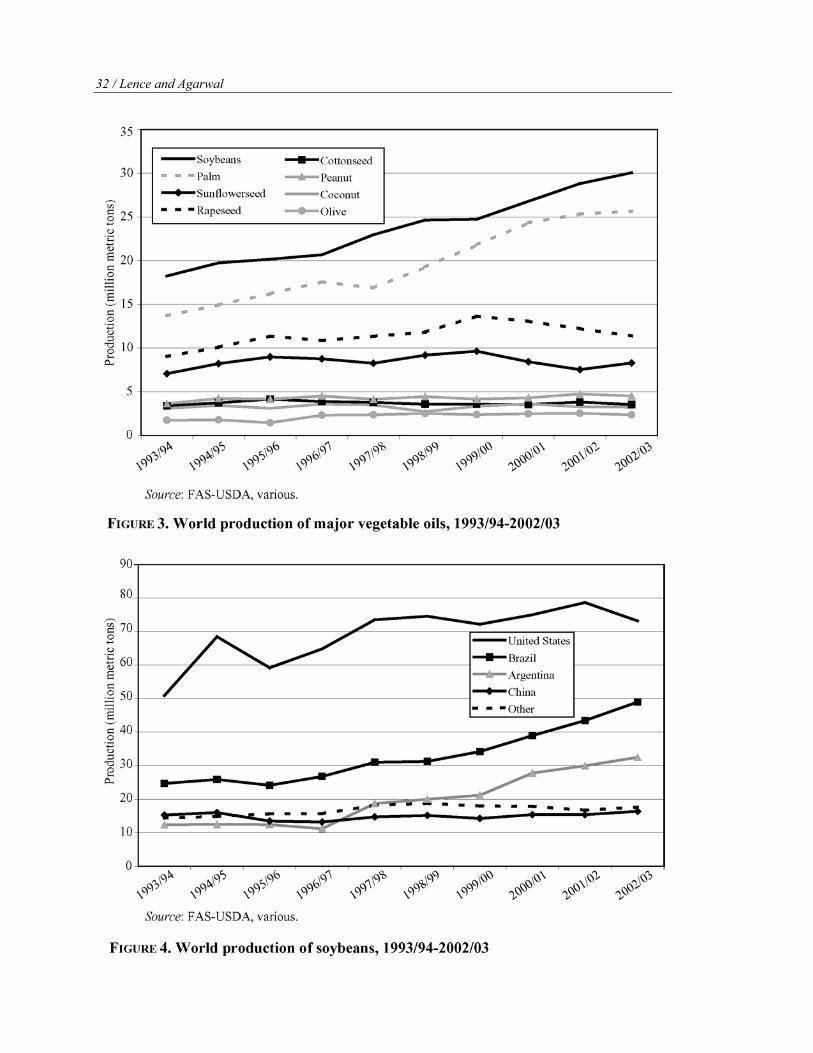
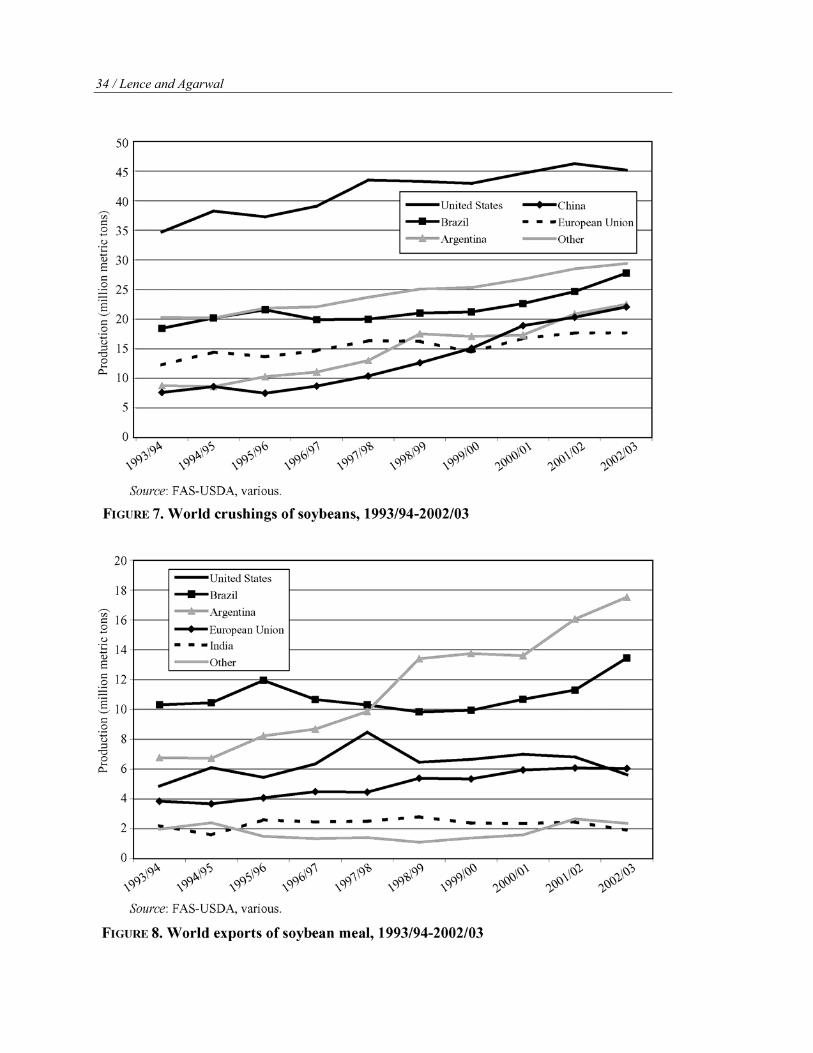
Figures Figure 1. World production of major oilseeds .............................................................. 31 Figure 2. World production of major protein meals...................................................... 31 Figure 3. World production of major vegetable oils ..................................................... 32 Figure 4. World production of soybeans ....................................................................... 32 Figure 5. World exports of soybeans............................................................................. 33 Figure 6. World imports of soybeans ............................................................................ 33 Figure 7. World crushings of soybean........................................................................... 34 Figure 8. World exports of soybean meal ..................................................................... 34 Figure 9. World imports of soybean meal, 2002/03...................................................... 35 Figure 10. World consumption of soybean meal, 2002/03 ............................................. 35 Figure 11. World exports of soybean oil ......................................................................... 36 Figure 12. World imports of soybean oil ........................................................................ 36 Figure 13. World consumption of soybean oil, 2002/03................................................. 37 Figure 14. Premiums for identity preserved Iowa, Ohio, and Michigan
non-genetically modified soybeans implicit in the futures prices of the Tokyo Grain Exchange ........................................................................ 37
Figure 15. World prices of vegetable oils ....................................................................... 38 Figure 16. U.S. prices of vegetable oils .......................................................................... 38 Figure 17. Spread between value of products and soybean prices.................................. 39 Figure 18. Spreads plus non-genetically modified soybean premiums for different
combinations of premiums for niche soy oil and high-energy soy meal ....... 39

Abstract
Demand in the marketplace for foods with “natural” attributes, such as organic
produce, continues to grow. Similarly, interest has developed in creating a technology
that allows “physical” rather than chemical refinement of soybean oil to create a
“natural” soy oil product. The physical refinement of non-genetically modified (non-GM)
soybeans greatly strengthens the marketing claim to natural properties for that product.
The oil derived in this manner, designated here as “niche soy oil,” and its related inputs
(non-GM soybeans) and by-products (high-energy non-GM soy meal) are the objects of
our analysis. We find premiums of $0.03 to $0.43 per pound for niche soy oil compared
to commodity soy oil. However, our price analysis suggests that only relatively optimistic
combinations of premiums for niche soy oil, non-GM soybeans, and high-energy non-
GM meal result in spreads above the estimated minimum economically feasible level.
Keywords: high-energy non-GM soy meal, natural soy oil, niche soy oil, non-genetically
modified soybeans.
ASSESSING THE FEASIBILITY OF PROCESSING AND MARKETING NICHE SOY OIL
1. Introduction Demand in the marketplace for foods with “natural” attributes, such as organic
produce, has been increasing. There are many reasons for this trend. Proponents of
organic foods have long argued that chemicals, such as pesticides and herbicides, used in
the production of grains can be harmful to consumers’ health. The proliferation of
genetically modified (GM) grains has also caused concern among consumers. First-
generation GM crops are convenient and therefore attractive to modern farmers.
However, many consumers are increasingly worried about the health implications of GM
grains. Consumers also may be concerned that traces of non-food-grade chemicals used
in the preparation of many foods may contaminate the food. A prime example of the use
of non-food-grade chemicals to process food is in the manufacture of soybean oil, which
typically involves extracting oil from the beans by means of solvents and then using
caustic soda and phosphoric acid to refine the crude oil.
Consequently, interest has developed in creating a technology that allows “physical”
refining of soybean oil. Unlike conventional refining that uses caustic soda to remove free
fatty acids from the crude oil, physical refining relies on evaporation (a physical process) to
achieve the same objective. In addition, citric acid (a food-grade chemical) is employed to
remove phosphatides under physical refining, whereas phosphoric acid is used for the same
purpose in conventional refining. Therefore, when physical refining is applied to crude oil
obtained by mechanical extrusion (instead of the far more popular solvent extraction
method), the resulting refined oil can be marketed as having more “natural” characteristics
than commodity soy oil. Clearly, applying the mechanical expelling–physical refining
technology to non-GM soybeans substantially strengthens the oil’s claim to natural
properties. The oil thus obtained is designated here as “niche soy oil.”
2 / Lence and Agarwal
Niche soy oil and its related inputs and by-products (i.e., non-GM soybeans and
high-energy non-GM soy meal) are the objects of our study. The analysis proceeds as
follows. First, the technology used to obtained niche soy oil is described in more detail in
section 2. Section 3 is devoted to a discussion of the supply and demand structure
relevant to niche soy oil. We pay particular attention to the supply of non-GM soybeans,
their commercialization and price behavior, as well as to the current supply of and
demand for niche soy oil. The market for high-energy non-GM soy meal is also
discussed, because the latter is obtained as a by-product from the production of niche soy
oil. This is followed in section 4 by a sensitivity analysis of niche soy oil and meal
premiums in the long run. A summary and conclusions are provided in section 5.
2. Characteristics of Niche Soy Oil and By-products The objects of this analysis are niche soy oil and its related inputs and by-products
(i.e., non-GM soybeans and high-energy non-GM soy meal). The term niche soy oil will
be used throughout to denote soybean oil recovered from non-GM soybeans by
mechanical (as opposed to solvent) extraction and refined using physical (as opposed to
conventional) refining. Niche soy oil’s main property is that it can be touted as a highly
natural food, because niche soy oil is obtained from a non-GM input and is extracted and
refined without resorting to non-food-grade chemicals. As discussed later, non-food-
grade chemicals (e.g., solvents, caustic soda, and phosphoric acid) are key inputs in the
methods typically employed to recover oil from soybeans and to refine crude soy oil.
The “natural” properties of niche soy oil are likely to be greatly enhanced by using
“identity preserved” (IP) organic non-GM soybeans (instead of “commodity” non-GM
soybeans) as inputs. This is true because it would be possible to advertise such oil as
“natural” based on the way the soybeans are grown. At the time of this writing, however,
niche oil from IP organic non-GM soybeans essentially is nonexistent in the market. As
discussed later, one possible reason for this situation is the very high premium over the
standard soy oil that IP organic non-GM soy oil would require to render its production
profitable.
It is important to note that GM soybeans also can be subjected to mechanical
extraction with the resulting oil physically refined. However, the GM oil thus obtained is

Assessing the Feasibility of Processing and Marketing Niche Soy Oil / 3
likely to be far less appealing to customers than its non-GM counterpart. For this reason,
throughout this study, the niche soy oil designation is restricted to oil obtained only from
non-GM soybeans.
The proportion of the beans’ fat content extracted by means of mechanical expelling
is considerably smaller than the proportion recovered using solvent extraction. As a
result, processing non-GM soybeans into niche soy oil yields high-energy (i.e., high-fat)
non-GM soy meal as a by-product. High-energy soy meal often is used as an ingredient in
rations for dairy cattle and poultry. In the future, some of the soy meal obtained as a by-
product from the production of niche soy oil is likely to be used for human consumption,
because of its “natural” properties.
2.1. Technologies for Extracting Oil from Soybeans Soybean seeds contain an average of 17 percent to 20 percent oil. The most popular
method for recovering soy oil is solvent extraction. Each bushel (i.e., 60 lb) of soybeans
processed by solvent extraction yields approximately 11.1 lb (18.5 percent) of oil, 44.3 lb
(73.8 percent) of soybean meal with 48 percent protein content, and 3.3 lb (5.5 percent)
of hulls.1 An alternative method for extracting soy oil is mechanical expelling, which
consists of simply applying pressure to the seeds to take out their oil. The mechanical
(non-solvent) method of recovering soy oil yields 7.2 lb (12 percent) of oil, 50.5 lb (84.2
percent) of high-energy meal, and 1.5 lb (2.5 percent) of hulls.
The disadvantages of the mechanical method compared to the solvent extraction
method are that (1) oil recovery is low, and (2) the utility of a high-fat (or high-energy)
meal is low. Both concerns have limited the commercial use of the mechanical method
thus far. In some instances, soybeans are passed through extruders before being subjected
to mechanical expelling. Soy oil obtained in this manner is even better because it has
lower phosphatide content (see Table 1).
Solvent extraction is normally applied in very large capacity plants that produce
commodity soy oil. Small manufacturers that aim to produce specialty oils of high quality
use the mechanical expelling process. Niche soy oil can be produced in smallscale plants
that are one hundredth the size of today’s large commercial plants (i.e., plants based on
solvent extraction and conventional refining). Research efforts are underway at Iowa
State University to develop “mini-mills” that may be ten thousandth the size of today’s

4 / Lence and Agarwal
TABLE 1. Typical composition of soybean oils from different processes Crude Oil
Composition Solvent Method
Expeller Method
Extruder and
Expeller Method Degummed Refined Oil
Moisture (%) 0.3 0.3 0.3 0.3 < 0.1 Phosphatide/gums (%) 1.3–3.0 1.5–2.0 1.0–1.5 0.7 0.003–0.05 Phosphorous (ppm) 450–900 450–600 300450 200 10–15 Unsaponifiable matter (%) 1.6 1.6 1.6 1.5 0.3 Free fatty acids (%) 0.3–1.0 0.3–1.0 0.3–1.0 0.3–1.0 < 0.05
large commercial plants. Mini-mills may allow individual farmers to process their own
beans into gourmet oils right on their farms (Licht 2001).
2.2. Technologies for Refining Soybean Oil The oil directly recovered from the soybean seeds, whether through solvent
extraction or mechanical expelling, is “crude” and contains impurities, such as lecithins,
free fatty acids, and undesirable color and odor. These impurities are removed in a series
of processes that yield “refined” oil. The refining of oil can be achieved by means of two
methods, namely, “conventional” refining and “physical” refining. Conventional refining
consists of four steps:
1. Degumming to remove phosphatides
2. Neutralization with caustic soda to get rid of free fatty acids
3. Bleaching and filtration to eliminate color pigments
4. Deodorization for removal of odors
In contrast, physical refining involves only three steps:
1. Degumming to remove phosphatides
2. Bleaching and filtration to eliminate color pigments
3. Deodorization and physical removal of free fatty acids
There are two fundamental differences between conventional and physical refining.
First, conventional refining relies on chemicals (caustic soda) to remove free fatty acids,
whereas physical refining eliminates such acids through evaporation (a physical process).
Second, phosphoric acid is employed to remove phosphatides under conventional

Assessing the Feasibility of Processing and Marketing Niche Soy Oil / 5
refining, whereas citric acid (which is a food-grade chemical) can be used for the same
purpose in physical refining. That is, the physical refining method avoids using non-food-
grade chemicals such as caustic soda and phosphoric acid.
Next, we describe these refining steps in more detail.
2.2.1. Degumming. Degumming consists of removing phosphatides from the crude
oil. Degumming is required by both the conventional and the physical refining methods.
Degumming of soybean oil is done for the following reasons:
• To produce lecithin as a valuable by-product
• To obtain degummed oil for long-term storage and transportation
• To prepare degummed oil for conventional (caustic) or physical refining
Soybean oil has a comparatively higher content of phosphatides (gums) than do other
vegetable oils. There are two types of phosphatides in crude soybean oil, the hydratable
type and the non-hydratable type. Degumming can be accomplished using several
methods depending upon requirements.
Hydratable phosphatides are readily removed by the addition of water. The quantity
of water needed for degumming is about 0.8 to 1.0 times the content of phosphatides. The
precipitated phosphatides are separated from the oil by means of a centrifugal machine.
The separated phosphatides are used to manufacture lecithin.
Non-hydratable phosphatides are unaffected by water and tend to be more soluble
in oil (i.e., they remain in the oil phase). Non-hydratable phosphatides generally contain
the calcium and magnesium salts of phosphatidic acids. Non-hydratable phosphatides,
with calcium and magnesium salts, require demineralized water and phosphoric (or
acetic) acid for degumming. Physical refining employs citric acid (a food-grade
chemical) instead of phosphoric acid. The use of acids in degumming is not
recommended for gums intended for use as lecithins, because the acids darken the
lecithin.
2.2.2. Neutralization. Neutralization is the key difference between conventional and
physical refining, because neutralization is performed only under the conventional
refining method. The purpose of neutralization is to eliminate the free fatty acids from
the oil (see Table 1). The simplest and most common neutralization method consists of
mixing calculated amounts of caustic soda to the oil so that it reacts with the free fatty

6 / Lence and Agarwal
acids. The soap stock formed by the action of caustic soda is allowed to settle at the
bottom of the tank and is then drained. Alternatively, it can be separated in a centrifuge.
The remaining oil contains trace quantities of soap (about 500 ppm). The traces of soap
are removed by washing the oil with hot water and eliminating the wash water from the
bottom after adequate settling or by passing it through a centrifuge. Washing is
repeated three or four times in a batch operation for maximum removal of the soap
from the oil. The residual soap content in the oil can be reduced to an almost zero level
by washing the oil with citric acid.
2.2.3. Bleaching. Bleaching is a step in both conventional and physical refining.
Bleaching is performed to remove color pigments. Neutralized and washed oil contains a
moisture level of 0.2 percent to 0.5 percent. This oil is transferred to the bleacher vessel,
where it is heated to 90ºC under a vacuum to remove the moisture. Once the water is
eliminated, bleaching agents such as Fuller’s earth and/or activated carbon are mixed
with the oil to remove the color pigments. The amounts of bleaching agents used depend
upon the initial color of the oil and the desired bleaching level. After a certain time, the
oil is cooled to 70ºC for filtration.
2.2.4. Deodorization—Physical Removal of Free Fatty Acids. The purpose of
deodorizing oil is to eliminate undesirable odors. Deodorization involves a steam-
stripping process wherein good-quality steam, generated from de-aerated and properly
treated feed water, is injected into the neutralized and bleached oil under low absolute
pressure (1–6 mm) and high temperature (200ºC to 210ºC) to vaporize the odoriferous
compounds.
Free fatty acids can also be removed in a similar manner, but the oil needs to be
heated beyond the temperature required for deodorization. The physical removal of free
fatty acids eliminates the need for neutralization. Therefore, physical refining has
several advantages over conventional refining. First, there is no production of messy
soap stock as in neutralization. Second, water washings of oil are not required after
neutralization, thereby shortening the refining process. In addition, fatty acids can be
recovered and sold separately.

Assessing the Feasibility of Processing and Marketing Niche Soy Oil / 7
3. Current Supply and Demand Structure of Relevance to Niche Soy Oil
3.1. General Supply and Demand Aspects of Soybeans, Oil, and Meal
Soybeans are the main oilseed produced in the world. Figure 1 illustrates graphically
the dominance of soybeans over other oilseeds. The output of soybeans not only exceeds
the production of all of the other major oilseeds taken together but also this differential
has increased noticeably in recent years. Because most of the soybeans are made up of
proteins, soybeans are a major source of protein meal. In fact, soy meal is the world’s
most important protein meal (see Figure 2). The share of soybeans in the protein meal
market has gone up from slightly over 60 percent a decade ago to almost 70 percent in
2002/03. The oil content (17 percent to 20 percent) of soybeans is not large compared to
some of the other major oilseeds. However, because of the sheer magnitude of the
soybean crop, soy oil accounts for the largest share of the vegetable oil market as well
(see Figure 3). This share has trended upwards from about 28 percent a decade ago to
approximately 32 percent in 2002/03.
World production of soybeans has risen from 117.75 mmt in 1993/94 to an estimated
188.81 mmt in 2002/03 (see Figure 1). Figure 4 demonstrates that the United States has
been the world’s largest producer, with an estimated 39 percent share of the world output
in 2002/03. Brazil and Argentina are the second and third largest soybean producers, with
estimated shares of 26 percent and 17 percent of world output, respectively, in 2002/03.
China is a distant fourth largest supplier, providing 9 percent of the world production.
Overall, soybean output is extremely concentrated, with the top four producers supplying
approximately 90 percent of the market.
Importantly, soybean output in the main producing countries has been growing at
very different rates. By far, Argentina and Brazil have exhibited the fastest growth, with
output increasing by 162 percent and 98 percent, respectively, between 1993/94 and
2002/03. U.S. output also grew over the same period, but at a much smaller proportion, at
44 percent. As a result, in 2002/03 it is estimated that the combined output of Brazil and
Argentina will overtake U.S. production for the first time. Between 1993/94 and 2002/03,
China’s output increased only 7 percent.

8 / Lence and Agarwal
The United States, Brazil, and Argentina are also the top three exporters of soybeans,
accounting respectively for 40, 34, and 16 percent of total exports in 2002/03. Paraguay
is the fourth largest exporter, with a 4 percent market share. Figure 5 shows soybean
exports for these exporting countries from 1993/94 through 2002/03. Mirroring the
pattern of growth in output, exports from Brazil and Argentina grew at a much faster pace
than U.S. exports over the past decade. Between 1993/94 and 2002/03, exports from
Brazil, Argentina, and the United States increased by 285, 216, and 53 percent,
respectively.
As shown in Figure 6, the European Union is the largest importer of soybeans, taking
one-third of all shipments in 2002/03.2 China is the second largest buyer of soybeans,
with 23 percent of total imports. None of the other major importers (i.e., Japan, Mexico,
and Taiwan) accounts individually for more than 10 percent of total imports. The most
important development in the patterns of imports is the sudden emergence of China as a
major player. China went from importing as little as 0.16 mmt as recently as 1994/95 to
buying 14 mmt in 2002/03.
Table 2 shows that by far most (about 85 percent) of the soybeans are processed
(crushed) to obtain soy oil and meal. Direct consumption of soybeans as human food
accounts for about 7 percent of total disposition. The remaining 8 percent of soybean
consumption is used as seed, feed, and waste. Of the three consumption categories, seed,
feed, and waste have grown the fastest, and direct food use has grown the slowest,
increasing respectively by 44 and 11 percent between 1996/97 and 2001/02.
Figure 7 reports annual crushings of soybeans by country. The United States is the
world’s largest crusher of soybeans, with a market share of about 28 percent for 2002/03.
Brazil is the second largest crusher, with a share of 17 percent. Argentina and China crush
approximately 13 percent of the world’s crushings each. The European Union is the fifth
largest crusher, accounting for approximately 11 percent. It can be seen from Figure 7 that
crushings in China and Argentina have grown much faster than elsewhere. From 1993/94
through 2002/03, crushings in China and Argentina grew respectively by 190 and 157
percent. In contrast, over the same period, crushings increased by 50 percent in Brazil, 44
percent in the European Union, and 30 percent in the United States. Crushing of

Assessing the Feasibility of Processing and Marketing Niche Soy Oil / 9
TABLE 2. World disposition of soybeans, 1996/97–2001/03 Disposition 1996/97 1997/98 1998/99 1999/00 2000/01 2001/02 Crushings (mmt) 113.54 123.20 135.48 135.50 146.83 158.48 Direct food use (mmt) 10.10 10.35 10.94 11.33 11.03 11.21 Feed/seed/
waste (mmt) 10.10 11.89 13.09 12.92 13.98 14.53 Total (mmt) 133.74 145.44 159.51 159.75 171.84 184.22 Crushings (%) 84.90 84.71 84.94 84.82 85.45 86.03 Direct food use (%) 7.55 7.12 6.86 7.09 6.42 6.09 Feed/seed/residual (%) 7.55 8.18 8.21 8.09 8.14 7.89 Source: Calculated from data reported by FAS-USDA 2003.
soybeans yields soy meal and oil in fairly fixed proportions of roughly 79 and 18 percent,
respectively (see, e.g., Table 7). Thus, production of meal and oil by different countries is
approximately proportional to the magnitudes depicted in Figure 7.
World soy meal exports and imports are summarized in Figures 8 and 9, respec-
tively. Over the past decade, one of the most noticeable developments in the export
market was the growth in exports from Argentina, which increased by 159 percent
between 1993/94 and 2002/03. As a result, Argentina is currently the leading exporter of
soybean meal, accounting for 37 percent of world exports. Brazil is the second major
exporter, with a 29 percent share. Next in export volumes are the European Union and the
United States, each with approximately 13 percent of world exports. As shown in Figure
9, the import market is dominated by the European Union, which absorbs almost half of
world’s soy meal shipments.3 About 20 percent of the soy meal imports go to Asia and
Oceania, and the remainder is relatively evenly distributed among the Mideast/Northern
Africa, Latin America, and Eastern Europe.
The world largest consumers of soy meal are the United States and the European
Union, each accounting for about 23 percent of world usage in 2002/03 (see Figure 10).
China is the third largest consumer, with approximately 13 percent of world
consumption. Other large consumers of soymeal in decreasing order of importance are
Brazil, Mexico, Japan, and the Republic of Korea.
World oil exports are shown in Figure 11. As with meal exports, Argentina is not
only the main exporter of oil, with 40 percent of the world shipments, but also had the
10 / Lence and Agarwal
fastest growth in exports over the past decade. Brazil’s export volume also has grown
very fast in recent years; the country is projected to overtake the European Union as the
second largest exporter of oil in 2002/03. The United States is a distant fourth largest
exporter, with about 10 percent of total exports.
Oil imports are distributed among many countries (see Figure 12). India is now the
single largest buyer, with 20 percent of the market. Interestingly, India’s imports were
virtually negligible a decade ago. Iran is the second largest importer, accounting for
approximately 10 percent of the purchases. China is the third largest importer; after having
been the main importer a decade ago, it drastically reduced imports in the late 1990s.
Figure 13 depicts world consumption of soy oil. The United States is the largest
consumer, with 17 percent of the world total. China is the second largest consumer and
Brazil is the third largest, accounting for 10 and 7 percent of world consumption,
respectively. Other large consumers of soy oil in order of importance are India, the
European Union, Mexico, and Iran.
3.2. U.S. Supply and Demand of Soybeans Used to Extract Niche Soy Oil Historically, virtually all niche soy oil has been produced using only “commodity”
non-GM soybeans. “Commodity” non-GM soybeans are non-GM soybeans segregated
from their GM counterparts, but which are not IP (identity preserved) to segregate them for
such things as variety, region of origin, and growing practices. The American Soybean
Association and United Soybean Board (n.d.) define segregation and IP as follows:
Segregation is a process whereby non-specialized crops are kept separate/isolated from
other non-specialized crops. For instance, commodity crops like soybeans and corn are
kept separate for obvious commercial reasons.
Identity Preservation (IP) is a process by which a crop is grown, usually under contract,
and handled, processed and delivered under controlled conditions, whereby the end user of
the product is assured that it has maintained its unique identity from farmgate to end-use.
Segregation requires that crops be maintained separately during transportation,
loading, unloading, and storage, to avoid commingling. IP is more expensive than simple
segregation because it additionally requires tracking of the crop’s identity.
IP soybean output in the United States consists almost entirely of non-GM varieties.
IP non-GM soybeans could be used for niche soy oil extraction, but so far they have not

Assessing the Feasibility of Processing and Marketing Niche Soy Oil / 11
been employed for this purpose. Of potential interest is the possibility of extracting
organic niche soy oil from IP organic soybeans, as this oil might command an additional
premium over the regular niche soy oil that is being produced. At this time, however, it is
unclear whether consumers would be willing to pay the premium required to render
production of organic niche soy oil economically feasible. As we will discuss, the price
of IP organic soybeans is substantially higher than the price of commodity non-GM
soybeans. Therefore, organic niche soy oil would have to fetch a substantial premium
over standard niche soy oil to be profitable.
Table 3 reports estimates of the area planted with GM, certified organic, and
commodity non-GM soybeans in the United States for the years 1998 through 2002. The
figures show a dramatic increase in the area planted with GM soybeans after their
commercial introduction in 1996. According to the U.S. Department of Agriculture, 75
percent of the area planted to soybeans corresponded to GM varieties in 2002. Table 3
also shows that the area planted with certified organic soybeans is very small, taking less
than 0.3 percent of the total area devoted to soybeans in the United States. By far, most of
the area devoted to non-GM soybeans consists of commodity non-GM soybeans.
Estimates of U.S. usage of GM, certified organic, and other IP non-GM soybeans are
shown in Table 4. Most U.S. soybean usage occurs as GM, either because soybeans are
actually GM or because they are non-GM but were commingled with GM varieties at
some point in the commercialization channel. In 2002, 98 percent of the U.S. soybean
usage was of the GM soybean type. Non-GM soybean usage was composed mostly of IP
soybeans that were not certified organic (approximately 1.5 percent).
Comparison of the area planted to commodity non-GM soybeans (Table 3) with
usage of these soybeans (Table 4) reveals that most of the commodity non-GM soybeans
produced are eventually commingled with GM soybeans. In 2002, less than 8 percent of
the non-GM soybeans produced was kept separate from GM soybeans throughout the
commercialization channel and eventually used as non-GM soybeans. As we will discuss,
the prevalence of commingling largely is due to the relatively high costs and
contamination risks of segregating non-GM and GM soybeans at grain elevator facilities.
It is important to note, however, that usage of commodity non-GM soybeans that are not
commingled with GM soybeans has increased steadily over time, from 1.2 million tons in

12 / Lence and Agarwal
TABLE 3. U.S. area planted with soybeans, by type (1,000 acres) Type of Soybeans 1998 1999 2000 2001 2002 GM 31,835 41,289 40,104 50,391 54,745 Non-GM
Certified organic 100 118 136 174 212 Commodity and other
identity preserved 40,090 32,323 34,026 23,540 18,036 Total all types 72,025 73,730 74,266 74,105 72,993 Sources: Total acreage is from NASS-USDA 2001, 2002a, 2002b. GM acreage is calculated from data in Fernandez-Cornejo and McBride 2000, 2002; NASS-USDA 2001, 2002a, 2002b. Certified organic acreage is calculated from Greene 2001 and Greene and Kremen 2003.
TABLE 4. U.S. soybean usage, by type (1,000 mt/year) Type of Soybeans 1998 1999 2000 2001 2002 Commodity GM and
non-GM commingled with GM 69,461 72,668 74,992 78,407 72,538
Non-GM: Certified organic 98 118 140 187 215 Other identity preserved 1,088 1,138 1,175 1,229 1,135
Total all types 70,647 73,924 76,306 79,823 73,890 Sources: Total usage is from NASS-USDA 2002b. Certified organic usage is calculated from Greene 2001 and Greene and Kremen 2003. Identity preserved usage is calculated from data on confidentiality-clause contracts and percentage contracts reported in NASS-USDA 2003.
1998 to 1.4 million tons in 2002, even though the area planted to non-GM soybeans has
trended strongly downward, from 40.1 million acres in 1998 to 18.2 million acres in
2002. That is, the proportion of commodity non-GM soybeans segregated from GM
soybeans has increased substantially since 1998.
3.2.1. Factors Influencing the Decision to Produce Either GM or Non-GM Soybeans.
Fernandez-Cornejo and McBride (2000, 2002) analyzed the factors affecting adoption of
GM soybeans. In the 2000 study, the majority (65.2 percent) of farmers who had adopted
GM soybeans reported that the main reason for adoption was “to increase yields through
improved pest control.” A distant second rationale was “to decrease pesticide input
costs,” with merely 19.6 percent of adopting farmers citing it as the main incentive for

Assessing the Feasibility of Processing and Marketing Niche Soy Oil / 13
adoption. Only 15.2 percent of adopting farmers mentioned some other motive as the
major reason underlying adoption of GM soybeans.
Employing a probit analysis in 2002, Fernandez-Cornejo and McBride found that
farmers who had more experience, had marketing and/or production contracts, and
displayed higher risk aversion were more likely to adopt GM soybeans. In contrast, use of
GM soybeans was lower for farmers with fewer resources (low levels of assets and
household income). The farmer’s level of education and the size of the farm operation
proved to be statistically insignificant explanatory variables in the adoption regression.
Interviews with producers of both GM and non-GM soybeans were conducted during
the fall of 2002 to obtain first-hand information about the main factors affecting the
decision to produce one type of soybean over the other.4 Non-GM producers stated the
following as the main three reasons for planting non-GM soybeans:
• The high technology fee required to produce GM soybeans
• The fact that non-GM soybeans can be planted using seed retained from the
previous harvest
• The historically higher yields per acre of non-GM soybeans compared to GM
soybeans
Non-GM soybean producers were of the opinion that the cost of planting non-GM
soybeans is $5 to $10 per acre lower than the cost of planting GM soybeans.
GM producers cited two major advantages of planting GM soybeans. First,
especially in wet areas, GM soybeans have eliminated weed control problems and
farmers are reluctant to give that up. Second, GM soybeans greatly simplify crop
management. This is true because the timing of herbicide applications is far less critical
for GM soybeans than for non-GM varieties. The relative simplicity of growing GM
soybeans is a particularly significant advantage cited by large farmers with custom
operations.
GM producers stated that net premiums ranging from $0.25/bu to $0.75/bu of non-
GM soybeans over GM soybeans would be necessary to make them switch from planting
GM soybeans to planting non-GM soybeans.5 The variation in premiums was closely
related to the other farming activities of the producers. Farmers requiring the smallest
premiums to switch were mostly full-time farmers who did a lot of custom spraying for

14 / Lence and Agarwal
other farmers. In contrast, the largest premiums were required by those producers who
did custom work on many acres or by producers who also had livestock operations.
The crop budgets prepared by Iowa State University Extension (Duffy and Smith
2002), shown here as Table 5, are another useful source of information about the relative
profitability of growing GM versus non-GM soybeans. The budgets show that the main
differences in costs are due to seeds, herbicides, labor, and pre-harvest machinery. Seeds
are about $7.20/acre to $11.40/acre more expensive for GM soybeans. In contrast,
herbicides are between $5.00/acre and $8.00/acre less expensive, labor is about
$1.60/acre and $5.60/acre less expensive, and pre-harvest machinery is between
$2.77/acre and $6.31/acre less expensive for GM soybeans. Overall, GM soybeans
produced under conventional tillage are estimated to cost $0.12/bu less than non-GM
soybeans, and no-till GM beans are even less expensive ($0.17/bu). It must be noted that
these cost differentials do not include GM soybean crops’ additional advantage of being
much easier to manage from a production standpoint.
Still another rough gauge of the implicit cost savings induced by GM soybeans is the
difference in the soybean prices received by farmers before and after the widespread
adoption of GM soybeans. Other things being equal, economic theory indicates that a
cost reduction such as the one achieved by using GM technology should be reflected in a
change in market prices. Further, the change in the market price should typically
underestimate the cost reduction. In this regard, it must be noted that the median soybean
price over the period 1989–95 was $5.69/bu, compared to a median price of $4.59/bu for
1998–2002. That is, a coarse analysis of market prices suggests cost savings of about
$1.10/bu associated with GM soybeans.
3.2.2. Soybean Prices. Historical prices received by producers for different types of
soybeans are shown in Table 6. Producers of food-grade certified organic soybeans
received the highest prices, averaging a price of about $14.30/bu over the five-year
period from 1998 to 2002. Clear-hylum soybeans received the next highest prices, with
an average of $5.79/bu over the same period. The lowest prices of the IP soybean
category corresponded to the generic non-GM IP soybeans and STS® soybeans, with an
average of about $5.00/bu from 1998 through 2002.6 Not surprisingly, producers of
commodity GM and commingled non-GM soybeans received the lowest prices, at an

Assessing the Feasibility of Processing and Marketing Niche Soy Oil / 15
TABLE 5. Estimated costs of production of soybeans following corn in Iowa for 2002, assuming yields of 45 bu/acre Cost Item ($/acre) Non-GM GM Till GM No Till Preharvest machinery 22.16 19.39 13.85 Seed, chemical, etc.
Seed 18.00 25.20 29.40 Phosphate 8.75 8.75 8.75 Potash 9.10 9.10 9.10 Lime (yearly cost) 6.00 6.00 6.00 Herbicide 31.00 23.00 26.00 Crop insurance 3.15 3.15 3.15 Miscellaneous 7.00 7.00 7.00 Interest 4.46 4.37 4.64
Harvest machinery Combine 17.08 17.08 17.08 Haul 1.35 1.35 1.35 Handle 0.80 0.80 0.80
Labor 19.60 18.00 14.00 Land 125.00 125.00 125.00 Total cost ($/acre) 273.45 268.19 266.12 Total cost ($/bu) 6.08 5.96 5.91 Source: Duffy and Smith 2002.
TABLE 6. U.S. average farm prices received for soybeans, by type ($/bu) Type of Soybeans 1998 1999 2000 2001 2002 Commodity GM and
non-GM commingled with GM 4.93 4.63 4.54 4.35 5.50
Non-GM: Food-grade certified organic 18.00 13.00 13.00 13.50 14.00 Clear-hylum 5.93 5.63 5.54 5.35 6.50 STS® soybean 5.23 4.88 4.74 4.55 5.70 Generic IP 5.18 4.88 4.74 4.60 5.80
Source: Prices for commodity GM and non-GM commingled with GM are from ERS-USDA various,b. Prices for food-grade certified organic are averages from Delate, Cambardella, and Burcham 1998; Delate et al. 2003; Glasgow 2002; University of Minnesota Extension Service 2002; and the University of Illinois n.d. Prices for clear-hylum soybeans are from Good, Bender, and Hill 2000; Frerichs et al. 2000; Fulton, Pritchett, and Pederson 2003; and University of Minnesota Extension Service 2002. Prices for STS® soybeans are from Good, Bender, and Hill 2000; Fulton, Pritchett, and Pederson 2003; and University of Illinois n.d. Prices for generic IP non-GM soybeans are from Good, Bender, and Hill 2000; Frerichs et al. 2000; and the University of Illinois n.d.

16 / Lence and Agarwal
average of $4.79/bu over the same period. In general, premiums for non-GM IP soybeans
with respect to commodity GM soybeans have been stable. However, the actual
premiums obtained by individual producers for food-grade certified organic soybeans and
clear-hylum soybeans varied widely depending on quality and other contract specificities.
For example, prices for food-grade certified organic soybeans ranged between $12/bu and
$20/bu, and premiums for clear-hylum soybeans ranged between $0.20/bu and $2.00/bu.
The food-grade certified organic prices reported in Table 6 are consistent with
information provided by Mr. Gary Bogenrief, president of ProfiSeed International Inc.
ProfiSeed specializes in the marketing of IP soybeans. According to Bogenrief, the highest-
priced organic soybeans are the high-protein, food-type IP varieties (e.g., Vinton 81),
which can fetch between $13/bu and $16/bu. The price of lower-protein organic varieties
ranges between $12/bu and $13/bu. Grains of damaged organic soybeans (e.g., damaged
due to discoloration caused by virus) can be sold for $8/bu. Mr. Bogenrief stated that
organic soybean prices have not changed over the last three years and that prices have
fluctuated only within a $2/bu to $3/bu range over the last ten years.
A relevant source of premiums for non-GM IP soybean premiums is Japan’s Tokyo
Grain Exchange. Historically, the Tokyo Grain Exchange has traded futures contracts on
U.S. soybeans and other agricultural commodities. However, because of the Japanese
interest in non-GM soybeans, on May 18, 2000, the exchange started trading a separate
contract for non-GM soybeans produced in the United States and delivered to Japanese
warehouses. For the GM soybean contract, the standard grade is GM soybeans or a
mixture of GM and non-GM No. 2 yellow IOM soybeans, non-screened and stored in
silos at specified warehouses in Japan.7 For the non-GM soybean contract, the standard
grade is IP IOM non-GM No. 2 yellow soybeans, non-screened and stored in silos at
specified warehouses in Japan.8
Figure 14 depicts the behavior of the premiums implicit in the nearby and far futures
contracts traded at the Tokyo Grain Exchange since November 2000. The figure shows
that the nearby premium has been quite volatile, fluctuating from lows of almost $0/bu up
to highs exceeding $1/bu. Interestingly, the highest nearby premiums have been
registered very recently. The far premium has been much more stable. This is not
surprising because the far premium reflects expectations about premiums relatively far

Assessing the Feasibility of Processing and Marketing Niche Soy Oil / 17
into the future. For this reason, the far premium provides a better estimate of the longer-
term cost differential between IOM GM and IP IOM non-GM soybeans. The far premium
has hovered slightly below $0.40/bu most of the time, which is consistent with the non-
GM IP premiums reported in Table 6.
In the interviews with grain elevators discussed in the next subsection, the reported
premiums bid for generic non-GM IP soybeans ranged from $0.10/bu to $0.40/bu, with
$0.30/bu being the most often cited premium for the year 2002. Such premiums are
consistent with the premiums reported in Table 6. Also consistent with the generic non-
GM IP premiums shown in Table 6 are the data gathered at the interviews with farmers
(see subsection 3.2.1). This is true because farmers stated that they would require
premiums of about $0.25/bu to $0.75/bu to switch production from GM to non-GM
soybeans.
3.3. Commercialization of Soybeans Used to Extract Niche Soy Oil To gain insights about the commercialization channel for non-GM soybeans,
personnel at 14 grain elevators in Iowa were interviewed (see list in Appendix B) during
the fall of 2002. By far, the most common practice among the firms interviewed was to
not segregate between GM and non-GM soybeans. Most elevators do not pay a premium
for non-GM soybeans received in their facilities, as they commingle them with GM
soybeans. These results are consistent with the study by Lin, Chambers, and Harwood
(2000), who reported that in the fall of 1999 only 8 percent of Midwest grain elevators
segregated between non-GM and GM soybeans, and just 3 percent paid a premium for
non-GM soybeans.
Interestingly, most of the 14 elevators represented in the interviews either arrange or
are willing to orchestrate transactions of non-GM soybeans between farmers and
interested processors. In such instances, non-GM soybeans are stored in the farmer’s own
facilities and are shipped directly to the processor when requested, bypassing the
elevator’s facilities altogether. The reasons provided for handling non-GM soybeans in
this manner are twofold. First, most of the elevator operators felt that the risk of
contaminating non-GM soybeans with GM soybeans would be extremely high if they
were handled in the same facility. Second, most elevator operators argued that the
volume of non-GM soybeans they handle is too small to justify either dedicating some of

18 / Lence and Agarwal
the existing storage capacity to them or building new facilities to accommodate only non-
GM soybeans.
Lin, Chambers, and Harwood argue that segregation between non-GM and GM
soybeans raises problems for elevators because it greatly reduces the turnover rate in a
business characterized by high volume. Profit margins in the grain elevator business are
very small, and profits depend greatly on handling large volumes as fast as possible.
Segregation causes delays because of the need for testing and for having multiple queues
for delivery into the elevator.
For the typical grain elevator operator, the cost of segregating between non-GM and
GM soybeans in its facilities seems very high. The vast majority of the operators
interviewed argued that they would not be interested in segregating at any premium,
because of the extra expenses and the contamination risks involved. Two of the fourteen
interviewees said that they would need premiums of about $0.30/bu to $0.50/bu to cover
the costs of segregating between non-GM and GM soybeans. These figures are consistent
with those cited by Lin, Chambers, and Harwood, who estimated that segregating non-
GM soybeans along the marketing chain from country elevator through subterminal
would cost about $0.54/bu on average.
Because most of the elevator operators interviewed do not segregate at their
facilities, many of them were unable to quantify what percentage of the soybeans they
receive is non-GM. For elevators that provided such estimates, the reported percentage
ranged from a low of virtually zero to a high of 20 percent of non-GM soybeans.
3.4. Supply and Demand of Niche Soy Oil 3.4.1. Production of Niche Soy Oil. Just as we found that different types of soybeans
are not widely segregated at the elevator stage, we found that soy oil is not widely
segregated either. Historically, there has been little recognition of the value of
differentiating oil produced from organic, non-GM, and GM soybeans. It is important
to note, however, that soybean oil is sold generically in U.S. grocery stores as
“vegetable oil” rather than as “soybean oil.” In contrast, the main competing oils are
sold by their respective names, for example, canola oil, corn oil, and sunflower oil. In
other words, producers of soybean oil have not been particularly aggressive about
marketing their product to end consumers. Consequently, soybean oil does not
Assessing the Feasibility of Processing and Marketing Niche Soy Oil / 19
command any price advantage even though it compares favorably with competing oils
in terms of the level of unsaturated fat.9 This point is made clear by Figures 15 and 16,
which compare the prices of leading vegetable oils in the world and U.S. markets,
respectively. Palm oil, which has the lowest percentage of unsaturated fats and is
widely regarded as low quality, is the only oil that consistently has exhibited a lower
price than that of soybean oil over the last decade.
A few U.S. oil producers have recognized the importance of differentiating different
types of soy oils. They produce specialty oils such as organic and/or non-GM oils. To the
best of our knowledge, the only companies currently involved in the production of niche
soy oil are the following:
• Adams Vegetable Oils, Inc., Arbuckle, CA
• American Natural Soy Processors, LLC, Cherokee, IA
• Liberty Vegetable Oil Co., Sante Fe Springs, CA
• Thumb Oilseed Producers’ Cooperative (TOPC), Ubly, MI
Appendix A provides the business profiles of these companies. The total installed
capacity of the four firms, according to Bogenrief of Profiseed International, is about 80
million pounds of oil per year. However, annual production of niche soy oil is almost
surely below that level. This is true because the installed capacity need not be used
exclusively to produce niche soy oil.10
To put the current output of niche soy oil in perspective, total production of soybean
oil in the United States averaged 18.4 billion pounds per year from 1999/00 through
2001/02. Hence, even if niche soy oil output were optimistically estimated to be as high
as 80 million pounds per year, it would represent only a tiny fraction (less than 0.5
percent) of U.S. soybean oil production. Importantly, however, industry sources asserted
that niche soy oil production has shown an upward trend.
3.4.2. Consumption of Niche Soy Oil. Information provided by TOPC, a major
producer of niche soy oil, indicates that 80 percent of its sales are destined for the
domestic market. The distribution of its sales is approximately 50 percent for the food
service industry to produce fried foods, 20 percent for food ingredients, 20 percent as an
ingredient in baby formula, and 10 percent for producers of baked goods. Liberty

20 / Lence and Agarwal
Vegetable Oil, a California producer of niche soy oil, also reported selling mostly to the
domestic market, in particular to the West Coast.
The 20 percent of sales at TOPC destined to foreign markets have been shipped to
various countries. So far, Korea, Canada, and Guatemala have been the major buyers.
The firm started selling into the Japanese market in September 2002.
According to Bogenrief, the food companies in the European Union, Japan, and
Australia are good prospects for selling organic and/or non-GM soy oil, because
consumers in those countries have a strong preference for non-GM food products. The
European Union’s proposed mandatory labeling of GM foods is pending; however, that
has not stopped countries as disparate as South Korea, Japan, Israel, Egypt, and Mexico
from adopting E.U.-style labeling proposals. In the summer of 2001, China caused a row
with the United States when it imposed biotech rules that crimped the inflow of U.S.
soybeans. Meanwhile, the fight over whether to allow planting of GM seeds has grown
intense in Africa, India, and parts of Latin America. Some countries, such as Switzerland,
have banned GM crop trials, and many other countries, such as Zambia, are refusing even
to accept donations of GM crops (BBC News World Edition 2002).
The E.U. biotech moratorium, in place since 1998, has hit U.S. corn exporters
hardest by blocking an estimated $250 million in annual sales. The six E.U. states
backing the ban, among them Austria and France, say they will stick to it until the
European Union puts in place proposed consumer rules that U.S. food exporters say
could cause even more harm (King 2002). Consequently, these countries are the best
prospects for sales of organic/non-GM soy oil.
The U.S. market for such specialty soy oils, on the other hand, is in its infancy. Many
consumers in the United States have accepted GM soy oil. Therefore, the current
prospects for selling soy oil in the U.S. market touting the non-GM aspect alone do not
seem particularly encouraging. One possible exception could be soy oil that is produced
(extracted and refined) without use of non-food-grade chemicals. Customers are getting
increasingly concerned about the use of chemicals in food products. However, even in
this regard, E.U. and Japanese consumers are more concerned than are U.S. consumers.
Therefore, it may prove difficult to identify U.S. consumers willing to pay a premium for
soy oil with more “natural” characteristics.

Assessing the Feasibility of Processing and Marketing Niche Soy Oil / 21
There are reasons not to be overly pessimistic, however. The U.S. government has
recently endorsed the use of health claims on labels of foods containing soy protein
(FDA 1999).11 Even though soy oil is not covered under the government endorsement,
there may be a halo effect. Consumers may, inadvertently, attribute the same benefits to
soy oil as they attribute to soy protein meal. In addition, soybean oil is included in the
American Heart Association’s (2000) The New 2000 Food Guidelines, which lists
recommended oils.
In fact, a study by the United Soybean Board (1999) that looked at consumers’ health
perceptions of soybean oil found that 89 percent of respondents indicated they believed
soybean oil to be “very healthy” or “somewhat healthy.” This is interesting because olive
and canola oil, rated at 87 and 86 percent respectively, fell behind soybean oil. Further,
70 percent of respondents indicated vegetable oil was very or somewhat healthy. The
latter is an important finding because, unlike the main competing oils, soybean oil is
retailed under the generic label of “vegetable oil” (see subsection 3.4.1). According to
Frank Flider (1999), United Soy Board’s contributing editor, “It may be time to put the
‘vegetable oil’ label out to pasture and start labeling soybean oil in a manner consistent
with other vegetable oils.” It is no wonder that only 69 percent of consumers surveyed
were found to be familiar with soybean oil, whereas 93 percent could recognize corn,
canola, and peanut oils.
Other possibilities include development of other genetically engineered niche soy
oils that provide benefits to consumers, as opposed to benefiting only farmers as is the
case with the first-generation GM soybeans currently in the market. For example,
soybean oils with a high proportion of monounsaturated fats, or a low percentage of
saturated fats, are likely to be appealing to some consumers.
3.4.3. Oil Prices. We collected via electronic mail the prices of niche soy oil charged
by the four processors we identified earlier. The premiums of niche soy oil with respect
to commodity soy oil ranged from a low of $.03/lb to a high of $.43/lb. Premiums were
the same for refined and crude oil. Although premiums for organic soy oil were higher,
they were not clearly specified. We also found that solvent-extracted non-GM soy oil
(whose price should be lower than the price of niche soy oil) is offered in the market at
premiums ranging between $.05/lb and $.09/lb.

22 / Lence and Agarwal
It is worth pointing out that, with the exception of palm oil, soybean oil is the
cheapest oil in the market (see Figures 15 and 16). Thus, consumers are accustomed to
paying premiums for other oils. As measured in the E.U. port of Rotterdam, over the
period 1999/00–2001/02 such premiums averaged $0.0119/lb for rapeseed oil, $0.0224/lb
for coconut oil, $0.0407/lb for cotton oil, $0.0497/lb for sunflowerseed oil, and
$0.1509/lb for peanut oil. Over the same period, the average premiums for other oils
relative to soy oil in U.S. markets were $0.0155/lb for corn oil, $0.0188/lb for canola oil,
$0.0306/lb for cottonseed oil, and $0.0388/lb for sunflowerseed oil. These premiums are
useful in that they provide guidance about the range of feasible premiums that might be
paid for niche soy oil if the latter were produced at a significantly larger scale. This is
true because at substantially greater output levels, niche soy oil would have to compete
against these other oils for a place in the market.
3.5. Demand for Meal By-product from Extraction of Niche Soy Oil Currently, there are both domestic and international buyers of the meal by-product
from the extraction of niche soy oil. This meal has the following three major
distinguishing features relative to standard soy meal:
1. Being non-GM
2. Having a high energy level
3. Being produced without using non-food-grade chemicals
At present, 98.5 percent of soy meal produced in the world is used for animal feed (FAS-
USDA 2003).
However, because of the “natural” properties of the meal by-product from the
extraction of niche soy oil, a greater percentage of its usage is likely to be devoted to
human consumption compared to regular soy meal.12 Further, it is reasonable to expect
more human consumption of meal from niche soy oil production because of increasing
awareness of non-food-grade chemicals and concerns about GM foods.
For the animal feed market, the fact that the by-product of niche soy oil is obtained
without resorting to non-food-grade chemicals does not represent any major advantage.
Hence, any premium animal feeders may pay for meal from niche soy oil must arise from
either being non-GM or having a high level of energy. In this context, however, the non-

Assessing the Feasibility of Processing and Marketing Niche Soy Oil / 23
GM and high-energy properties can be analyzed and priced separately. This is true because
the sources of energy for animal rations are highly substitutable depending on price.
High-energy soy meal is usually fed to dairy cattle and poultry. Buyers acquiring
high-energy meal for these purposes usually pay a premium commensurate with the
amount of energy in the meal. More specifically, the fat content of the high-energy soy
meal is roughly valued at a slight discount with respect to the price of crude soy oil. That
is, the premium paid for high-energy meal relative to standard soy meal on any particular
date depends largely on the price of soy oil at that time. Currently, the premium for high-
energy soy meal over regular soy meal is around $15/ton.
Regarding the non-GM property of the meal by-product, so far it has not received
any premium in the United States. However, meal produced from non-GM soybeans
receives a premium in the European Union and other countries that have banned the use
of GM crops. In this respect, it is interesting to note that Ag Processing Inc (AGP), the
third largest processor of soybeans in the United States, has been crushing non-GM
soybeans one week per month in its Manning, Iowa, plant. The main buyer of the
resulting non-GM soy meal is Tegel, the largest poultry producer in New Zealand. Unlike
the meal obtained from the extraction of niche soy oil, AGP’s non-GM soy meal is not
high-energy because it is a by-product of solvent extraction. Therefore, it commands a
premium in New Zealand solely for being non-GM. Based on information about recent
export sales, it is estimated that the price premium paid by some foreign buyers for the
non-GM characteristic alone is around $20/ton.
4. Sensitivity Analysis of Long-Run Niche Soy Oil and Meal Premiums The main input and products from the production of niche soy oil are intrinsically
related to the input and products from the standard solvent extraction process. This is so
because producers of niche soy oil must pay a premium to farmers and/or grain elevators
to compensate for the disadvantages of supplying non-GM soybeans relative to the GM
soybeans used for solvent extraction. Also, niche and regular soy oil generally are
substitutes in the eyes of consumers. Hence, the amount of niche soy oil consumed will
depend greatly on its premium compared with regular soy oil. In addition, even though
soy meal obtained by solvent extraction has a lower energy content in addition to being
24 / Lence and Agarwal
GM, it is a close substitute for soy meal obtained as a by-product of the niche soy oil
process, especially for animal feed use. Hence, the amount demanded of the latter will be
strongly influenced by the premium charged for it relative to standard soy meal.
Given the relevance of the input and output prices associated with standard GM soy
oil production, it is useful to analyze their historical behavior to provide indications about
the potential for niche soy oil production to be profitable. For this purpose, the annual
average prices of regular soy oil, soy meal, and soybeans over the last decade are
reported in the top rows of Table 7. The table shows that the prices of soy oil fluctuated
considerably, between a low of $0.1399/lb (in 1999/00) and a high of $0.2770/lb (in
1994/95). Similarly, soy meal prices ranged between a minimum of $130.56/tn (in
1998/99) and a maximum of $259.87/tn (in 1996/97). The price of soybeans was
relatively more stable, with a low of $4.77/bu (in 2000/01) and a peak of $7.55/bu (in
1996/97). The relatively higher stability of the soybean price is to be expected, because it
largely reflects a weighted average of the prices of soy oil and soy meal. Despite the
volatility observed in all of the three price series, overall they have trended downward.
Table 7 also shows the historical yields of oil and meal from solvent extraction. Both
yields are very stable, averaging 11.11 lb of oil and 47.56 lb of 44 percent protein meal
per bushel of soybeans. The “crushing margin” or spread between the value of products
and the soybean prices can be readily calculated from the price and yield data. The spread
is important because it represents the amount left for processors to cover other production
costs (i.e., costs in excess of the cost of securing soybeans) and to profit. Other things
being equal, a reduction in the spread is associated with a drop in profits. The spread is
reported in the last row of Table 7 and depicted in Figure 17. Over the last decade, the
spread has averaged $0.82/bu. However, two subperiods clearly can be identified,
namely, 1992/93–1996/97 and 1997/98–2001/02. In the first subperiod, spreads averaged
$0.98/bu and the smallest spread was $0.82/bu (in 1995/96). In the second subperiod, the
average spread was only $0.66/bu and the maximum spread was $0.79/bu.
Overall, Figure 17 suggests a tendency for spreads to lean toward a value of about
$0.80/bu. This observation is confirmed by the recent announcement by Archer Daniels
Midland, the largest soybean processor in the United States, that it would be closing some

TABLE 7. Spread between value of products and soybean prices, for solvent extraction process 1992/93 1993/94 1994/95 1995/96 1996/97 1997/98 1998/99 1999/00 2000/01 2001/02Prices:
Oil (cents/lb)a 20.96 26.78 27.70 24.89 22.49 25.65 20.49 15.81 13.99 16.05 Meal ($/tn)b 192.68 194.98 162.03 227.95 259.87 186.55 130.56 158.04 165.60 166.59 Hulls ($/tn)c 61.33 Soybeans ($/bu)d 5.95 6.59 5.73 7.39 7.55 6.64 5.00 4.90 4.77 4.79
Products from processing soybeans: Oil (lb/bu of soybeans) 10.84 10.87 11.08 11.15 10.91 11.25 11.30 11.34 11.24 11.14 Meal (lb/bu of soybeans) 47.54 47.62 47.33 47.69 47.37 47.41 47.25 47.76 48.06 44.27
Hulls (lb/bu of soybeans)
3.33
Spread between value of products and soybean prices ($/bu) 0.90 0.96 1.18 0.82 1.06 0.67 0.40 0.66 0.78 0.79
Source: ERS-USDA Various, b. Note: Before 2001/02, calculations are performed assuming hulls added to meal to yield 44% protein meal. For 2001/02, hulls are assumed to be sold separately, so the meal sold is 48% protein meal. aCrude, tanks, F.O.B. central Illinois. bMeal at 44% solvent, Decatur before 2001/02; 48% solvent, Decatur in 2001/02. cCentral Illinois, bulk. dNo. 1 yellow, Illinois processor.
Assessing the Feasibility of Processing and Marketing N
iche Soy Oil / 25

26 / Lence and Agarwal
processing plants and reducing operating rates at other facilities because of low spreads
(Reuters News Service 2002). Spreads were $0.60/bu during the week before the
announcement on December 16, 2002.
As discussed earlier, processing plants that extract and refine niche soy oil are much
smaller than the processing plants used to obtain commodity soybean oil. Therefore,
overhead costs can be spread over a substantially smaller production. In addition, the
variable costs associated with mechanical extraction are higher than the variable costs of
solvent extraction. For these reasons, if spreads were the same for both niche and
standard soy oil production, the former would typically yield smaller profits than the
latter.13 Hence, the margins reported in Table 7 are relevant because they provide a lower
bound for the potential margins at which producers of niche soy oil should be able to
operate profitably.
Processing of soybeans to produce niche oil typically yields 7.2 lb of crude soy oil14
and 50.5 lb of high-energy soy meal. Such yields can be used to compute the spread
associated with niche oil production under different scenarios regarding premiums paid
for niche oil and high-energy soy meal. Figure 18 provides a summary of the results from
such a sensitivity analysis. The horizontal axis displays potential premiums for niche soy
oil (e.g., a niche soy oil premium of $0.05/lb means that niche soy oil is sold for
$0.2340/lb when the regular soy oil price is $0.1840/lb). Similarly, potential premiums
for high-energy soy meal are plotted against the vertical axis. Each downward-sloping
line in Figure 18 represents all of the combinations of oil and meal premiums that result
in the same amount of spread plus the non-GM soybean premium. For example, a
$0.16/lb niche oil premium and a respective $9.82/ton meal premium yield a spread plus
non-GM soybean premium of $1.40/bu. But the latter amount also can be obtained when
the niche oil premium is $0.02/lb and the corresponding meal premium is $49.74/ton. A
spread plus non-GM soybean premium equal to $1.40/bu means that the niche soy oil
processor’s spread will be $0.00/bu if a premium of $1.40/bu over the GM soybean price
has to be paid to acquire non-GM soybeans. In the opposite situation, if the processor is
able to purchase non-GM soybeans at the same price as GM soybeans (i.e., the non-GM
soybean premium equals $0.00/tn), its spread will be $1.40/bu.

Assessing the Feasibility of Processing and Marketing Niche Soy Oil / 27
Given the previous discussion about non-GM soybean premiums and production
costs, it seems reasonable to assume that the non-GM soybean premium will be
approximately $0.30/bu to $0.40/bu in the future. Also, the historical behavior of spreads
in the processing sector using solvent extraction points toward an equilibrium spread of
around $0.80/ton. Therefore, a sensible working hypothesis is to postulate that the spread
plus non-GM premium should be at least $1.20/ton for niche soy oil production to be an
economically viable enterprise in the long run. This implies that only the combinations of
premiums for niche soy oil and high-energy soy meal to the northeast of the $1.20/bu line
(denoted by the empty circles) are economically viable.
Historically, the premiums for niche soy oil have hovered around $0.05/lb to
$0.08/lb. As mentioned earlier, high-energy soy meal premiums recently have been
about $15.00/ton. Based on the historical prices of soy oil,15 it also seems extremely
unlikely for the high-energy soy meal premium to exceed $25.00/ton in the long run.
Further, as noted in section 3.5, the non-GM soy meal premiums currently can be
estimated optimistically at $20.00/ton. These premiums on niche oil and the resulting
meal by-product yield the shaded area in Figure 18 as the “likely” combinations of
premiums. Interestingly, the $1.20/bu isoline crosses this area. However, only relatively
optimistic combinations of premiums yield values for the spread plus non-GM soybean
premium above the $1.20/bu level considered the minimum economically feasible
level.16
5. Summary and Conclusions Demand for foods in the marketplace with “natural” attributes, such as organic
produce, has been increasing steadily. For this reason, interest has developed in creating a
technology that allows “physical” rather than chemical refinement of soybean oil to
create a “natural” soy oil product. Unlike conventional refining that uses caustic soda to
remove free fatty acids from the crude oil, physical refining relies on evaporation (a
physical process) to achieve the same objective. In addition, citric acid (which is a food-
grade chemical) is employed to remove phosphatides under physical refining, whereas
phosphoric acid is used for the same purpose in conventional refining. Therefore, when
physical refining is applied to crude oil obtained by mechanical extrusion (instead of the

28 / Lence and Agarwal
far more popular solvent extraction method), the resulting refined oil can be marketed as
having more “natural” characteristics than does commodity soy oil. Clearly, applying the
mechanical expelling–physical refining technology to non-GM soybeans substantially
strengthens the oils claims to natural properties. The oil thus obtained is designated here
as “niche soy oil.”
To the best of our knowledge, only four companies currently are producing niche soy
oil. Their total installed capacity is estimated at about 80 million pounds of oil per year.
Even if niche soy oil output were optimistically estimated to be as high as 80 million
pounds per year, it would represent only a tiny fraction (less than 0.5 percent) of U.S.
soybean oil production. Importantly, however, niche soy oil production has shown an
upward trend. Most of the niche oil sales are destined for the domestic market. The main
destinations are to the food service industry to produce fried foods, to use as a food
ingredient, to use as an ingredient in baby formula, and to produce baked goods. Sales
destined to foreign markets have been shipped to various countries, including Korea,
Japan, Canada, and Guatemala. Premiums for niche soy oil with respect to commodity
soy oil ranged from a low of $0.03/lb to a high of $0.43/lb. Premiums were the same for
refined and crude oil. Although premiums for organic soy oil were higher, they were not
clearly specified. Solvent-extracted, non-GM soy oil (whose price should be lower than
the price of niche soy oil) is offered in the market at premiums ranging between $0.05/lb
and $0.09/lb.
Currently, there are both domestic and international markets for the meal by-product
from niche soy oil extraction. This meal has three major distinguishing features relative
to standard soy meal, namely, that (1) it is non-GM, (2) it has a high energy level, and (3)
it is produced without using non-food-grade chemicals. High-energy soy meal usually is
fed to dairy cattle and poultry. For this purpose, high-energy meal commands a premium
commensurate with the amount of energy in the meal. Currently, the premium of high-
energy soy meal over regular soy meal is approximately $15/ton. So far, the non-GM
property of the meal by-product has not received any premium in the United States.
However, it is estimated that the price premium paid by some foreign buyers for the non-
GM property alone is around $20/ton.

Assessing the Feasibility of Processing and Marketing Niche Soy Oil / 29
The “spread” between the value of products and the soybean prices is important
because it represents the amount left to processors to cover other production costs (i.e.,
costs in excess of the cost of securing soybeans) and to profit. The price analysis
performed in this study suggests that only relatively optimistic combinations of premiums
for niche soy oil, non-GM soybeans, and high-energy non-GM meal result in spreads
above the estimated minimum economically feasible level.

Figures
Assessing the Feasibility of Processing and Marketing Niche Soy Oil / 31
32 / Lence and Agarwal

Assessing the Feasibility of Processing and Marketing Niche Soy Oil / 33
34 / Lence and Agarwal

Assessing the Feasibility of Processing and Marketing Niche Soy Oil / 35
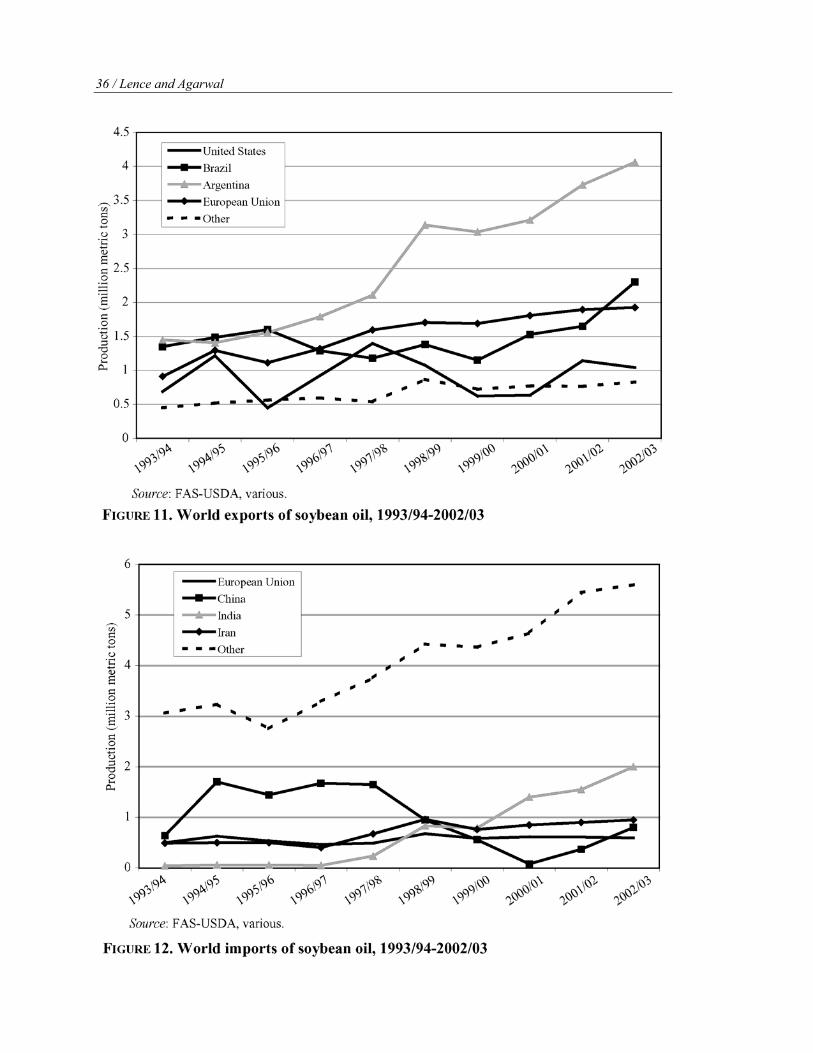
36 / Lence and Agarwal

Assessing the Feasibility of Processing and Marketing Niche Soy Oil / 37

38 / Lence and Agarwal
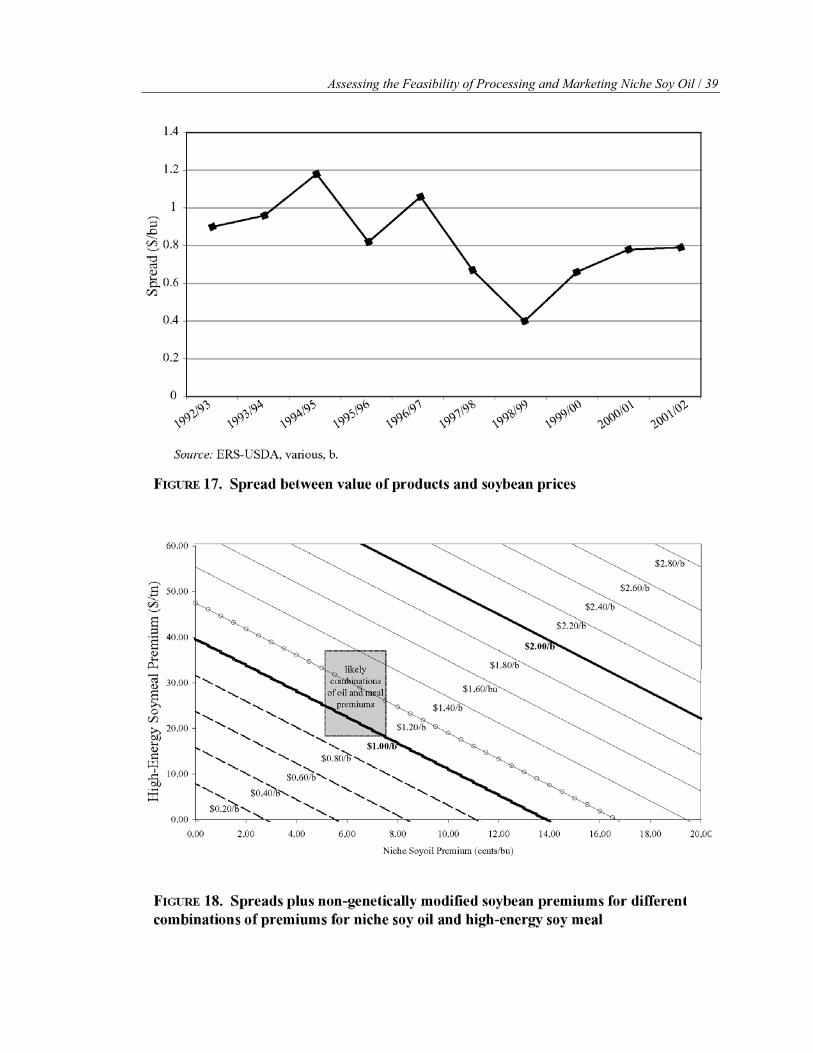
Assessing the Feasibility of Processing and Marketing Niche Soy Oil / 39

Endnotes
1. Alternatively, one bushel of soybeans may yield 11.1 lb (18.5 percent) of oil and 47.6 lb (79.3 percent) of meal with 44 percent protein content.
2. The Netherlands, Germany, and Spain are the main importers within the European Union. Of the 20.17 million metric tons that the European Union is projected to import in 2002/03, the Netherlands will take 23 percent; Germany, 30 percent; and Spain, 17 percent.
3. Within the European Union, the major importers are France, Italy, the Netherlands, and Germany. In 2002/03, the respective shares of E.U. imports were 22, 15, 13, and 8 percent.
4. The list of farmers interviewed is provided in Appendix B.
5. Note that the premiums are net of trucking and other commercialization costs.
6. STS® soybeans are tolerant to sulfonylurea herbicides because they carry the Als1 gene. STS® soybeans are non-GM because they were developed by means of traditional breeding methods.
7. IOM stands for Indiana, Ohio, and Michigan. Soybeans grown in these states have higher protein content and are more suitable for food use than soybeans grown in other states. GM or a mixture of GM and non-GM No. 2 yellow soybeans of Iowa, Illinois, and Wisconsin origin produced in the United States also are deliverable grades.
8. The non-GM contract also allows delivery of IP non-GMO No. 2 yellow soybeans of Iowa, Illinois, and Wisconsin origin.
9. Soybean oil has approximately 85 percent unsaturated fat. Analogous figures for rapeseed oil, sunflowerseed oil, corn oil, cottonseed oil, and palm oil are 95, 89, 87, 73, and 49 percent, respectively.
10. For example, Ag Processing Inc. (AGP) produces crude non-GM soybean oil using solvent extraction in its plant located in Manning, Iowa. But AGP processes non-GM soybeans for one week each month; the rest of the time, it uses GM soybeans.

Assessing the Feasibility of Processing and Marketing Niche Soy Oil / 41
11. The Food and Drug Administration provides the following example of a health claim on the label of a food containing soy protein: “Diets low in saturated fat and cholesterol that include 25 grams of soy protein a day may reduce the risk of heart disease. One serving of [name of food] provides [number of] grams of soy protein.”
12. Indeed, TOPC grinds some of the meal it produces into flour.
13. Recall that the spread equals costs plus profits.
14. One lb of crude oil yields 0.97 lb of refined oil.
15. Recall from section 3.5 that high-energy soy meal premiums are based on the contemporary prices of crude soy oil.
16. It is also worth emphasizing that the markets for niche oil and its meal by-product are currently very thin. Thus, there is a non-negligible risk that the increased production due to the entry of relatively few additional plants into the niche soy oil industry may cause sharply smaller premiums at current demand levels.

Appendix A. Business Profiles of U.S. Producers of Niche Soy Oil
Adams Vegetable Oils, Inc.
P.O. Box 956
Arbuckle, CA 95912
Phone: (916) 476-2030
Fax: (916) 476-2315
History. Adams Vegetable Oils, Inc., is owned by the Adams Group. The oldest
Adams Group company is Adams Grain Company, Inc., which dates back to the early
1920s. Adams Trucking, Inc., was founded in the 1960s to complement the grain
company. Adams Vegetable Oils, Inc., was formed in 1982 to further diversify in
Northern California agricultural products. In 1995, Adams Vegetable Oils formed a U.S.–
based partnership with Sumitomo Corp. (51 percent of which is owned by the former and
49 percent by the latter) to extract and refine canola and safflower oil from certified
organic seeds grown by the Organic Crop Improvement Association. The oil obtained by
the joint venture is exported to Japan.
Business Focus. Manufacturing and wholesaling of specialty vegetable oils. Adams
Vegetable Oils is one of the largest safflower oil producers in the United States.
Markets. Adams Vegetable Oils sells specialty oils both domestically and interna-
tionally. Japan is one of the company’s largest foreign customers. Buyers include
companies that package specialty oils or incorporate them into processed foods.
Products. The organic oils marketed by Adams Vegetable Oils include almond,
canola, corn, jojoba, olive, palm, peanut, safflower, sesame, soybean, sunflower, and
walnut.
Processing Facilities. The processing plant of Adams Vegetable Oils can produce
40 tons of oil per day.

Assessing the Feasibility of Processing and Marketing Niche Soy Oil / 43
American Natural Soy Processors, LLC
Cherokee, IA
Phone: (712) 225-3500
History. American Natural Soy Processors plans to process organically produced
oilseeds through the extrusion and expelling method of processing. The group was awarded
$478,578 in 2001 and $250,000 in 2002 by the U.S. government through the “Value-Added
Agricultural Product Market Development” grant program. American Natural Soy
Processors will use grant funds to establish a working capital account to assist in the start-
up and operation of an organic soy processing facility in Cherokee, Iowa.
Liberty Vegetable Oil Co.
15306 S. Carmenita Rd
Sante Fe Springs, CA 90670
Phone: (562) 921-3567
Fax: (562) 921-8837
History. Liberty Vegetable Oil Co. was founded in 1948 by Isaac D. Sinaiko. It
commenced operations as a small expeller mill producing linseed oil and meal from
California-grown flaxseed; soybeans were added in the 1950s. During the latter half of
the 1960s, the current chair, Irwin S. Field, refocused the company’s long-term objectives
toward the development and marketing of tree nut oils and other specialty oils.
Business Focus. The company focuses on development and marketing of tree nut oils
and other specialty oils.
Markets. The oil is sold mainly on the West Coast to small customers in drum
quantities of 25 or less at a time.
Products. Liberty specializes in tree nut oils (almond, walnut, hazelnut, pecan, and
macadamia), organic oils (soybeans and sunflowerseed), and other specialty oils (canola,
corn, peanut, safflower, sunflower, and non-GM soybeans).
Product Quality Requested by Customers. Liberty refines the oil to the normal
quality that the vegetable oil industry has established.

44 / Lence and Agarwal
Inputs. Liberty does not crush soybeans. Instead, Liberty purchases crude non-GM
soybean oil and refines it into an edible product. Crude non-GM soybean oil is bought in
truckloads as needed, depending on demand.
Technology. Liberty’s crushing mill, with eight Andersen Super Duo Expellers,
allows for the efficient processing of products. The flexibility of Liberty’s system design
allows batch processing of quantities as small as 25 tons, or continuous processing at the
rate of 75 tons per day for nuts and kernels.
Processing Facilities. Crushing and refining capacity was expanded during the 1970s
to accommodate custom processing, which today is a significant part of the business.
Current operations are located on four acres of land that include expeller processing and
oil refining (including bleaching, winterizing, and deodorizing capabilities). The crushing
and refining capacities are proprietary information and not disclosed.
Thumb Oilseed Producers’ Cooperative (TOPC)
(Most of the information provided is based on information from TOPC n.d.)
2145 Leppek Road
Ubly, MI 48475
Phone: (866) 658-2344, (989) 658-2344
Fax: (989) 658-2372
History. TOPC was formed as a farmers’ cooperative in 1997. The initial stock
offering was held in 1998. Crushing operations began in mid-1999, and refining in late
2001.
Business Model. TOPC is a “new-generation” cooperative (Moser 1999). It is a
closed cooperative (i.e., it will not accept new members or additional raw product until
demand increases) and its shares are transferable. TOPC consists of 210 shareholders
from ten mid-Michigan counties. There are over 1,500 shares of the cooperative
outstanding, and ach share gives a producer both the right and the obligation to deliver
500 bushels of soybeans to the processing facility (Moser 1999).
Business Focus. TOPC’s mission is “To create a processing business that increases
farm income by adding value to the oilseed products produced by the member.” TOPC’s

Assessing the Feasibility of Processing and Marketing Niche Soy Oil / 45
strategy is to create value in the soybean oil category by creating a high-quality oil from
non-GM soybeans using mechanical, non-chemical extraction and refining.
Products. TOPC produces all-natural, non-hexane extracted soybean oil under the
brand name “NexSoy®.” TOPC offers refined, bleached, and deodorized non-GM
soybean oil and certified organic soybean oil. TOPC also produces meal as a by-product
of oil production, some of which is ground into flour.
Inputs. TOPC uses generic non-GM IP soybeans. Seed and soybeans delivered to the
plant are tested with ELISA strip test. In addition, CropVerifeye, LLC representatives
walk all members/growers fields to verify the non-GM seed planted and document the
field locations.
Technology. TOPC uses extrusion/expelling to recover oil from soybeans. Refining
is done physically (e.g., water-based degumming) or with the use of food-grade
chemicals (e.g., bleaching).
Processing Facilities. TOPC has two plants, a crushing facility and an oil refinery,
both in Ubly, Michigan. The crushing facility has the capacity to process over one million
bushels of soybeans per year, whereas the refining facility can process 18 million pounds
of RBD soybean oil per year.

Appendix B. List of Individuals and Firms Interviewed
Producers of Non-GM soybeans
Roger Hade, Don Sandell, Loyd Stewart
Producers of GM soybeans
Kelly Blair, Larry Byland, Dave Casteson, Miller Farms, Kent Fors, Steve Grettenberg,
Chuck Gustafson, Dale Johnson, Kevin Lambert, Duane Peterson, Steve Sandeen, Don
Sandell, Kevin Sandstrom, Steve Spielman, Shawn Wade
Grain Elevators
Bartlett Grain Co., Council Bluffs, IA (712) 322-3444
Bruntlett Elevator, Gowrie, IA (515) 352-3118
Emerson Farm Supply Co., Hastings, IA (712) 624-8541, 800-535-7420
Farmer’s Coop., Jordan, IA 800-922-5103
Farmers Coop Co., Macksburg, IA (641) 768-2436
Farmers Coop Assn., Farnhamville, IA (515) 544-3213
FSC/ADM, Manilla, IA (712) 654-2012
Heartland Coop, Des Moines, IA (515) 225-1334 ext.135
New Co-operative, Inc., Fort Dodge, IA (515) 955-2040
Runnels Grain, Runnels, IA 800-245-6221
Smith Fertilizer and Grain, Knoxville, IA (641) 848-5000
United Farmers Mercantile Coop, Stanton, IA (712) 829-2117
West Central, Guthrie Center, IA 800-522-1946
Wilkins North Elevator, Osceola, IA (641) 342-6021
IP Soybean Merchandisers
ProfiSeed International, Inc., Hampton, IA (641) 456-5955

Assessing the Feasibility of Processing and Marketing Niche Soy Oil / 47
Soybean Processors
Archer Daniels Midland (ADM), Decatur, IL (217) 424-5200
Ag Processing Inc. (AGP), Manning, IA 800-247-1345
Cargill, Des Moines, IA 800-435-5714
Liberty Vegetable Oil Co., Sante Fe Springs, CA (562) 921-3567
References
American Heart Association. 2000. The New 2000 Food Guidelines. Dallas, TX.
American Soybean Association and United Soybean Board. n.d. “Identity Preservation versus Segregation.” <http://www.tomorrowsbounty.org/library/usb2.htm> (accessed January 2003).
BBC News World Edition. 2002. “Zambia Turns Down GM Aid.” August 17. <http://news. bbc.co.uk/2/hi/africa/2199189.stm> (accessed January 2003).
Delate, K., C. Cambardella, and B. Burcham. 1998. “Comparison of Organic and Conventional Corn, Soybean, Alfalfa, Oats, and Rye Crops at the Neely-Kinyon Long-Term Agroecological Research (LTAR) Site - 1998.” Unpublished manuscript, Iowa State University. <http://extension.agron.iastate.edu/organicag/researchreports/n-kltar98.pdf> (accessed July 2003).
Delate, K., M. Duffy, C. Chase, A. Holste, H. Friedrich, and N. Wantate. 2003. “An Economic Comparison of Organic and Conventional Grain Crops in a Long-Term Agroecological Research (LTAR) Site in Iowa.” American Journal of Alternative Agriculture 18(2003):59-69.
Duffy, M., and D. Smith. 2002. “Estimated Costs of Crop Production in Iowa—2002.” Iowa State University Extension Publication FM 1712. Ames, IA. January.
Economic Research Service, U.S. Department of Agriculture (ERS-USDA). Various, a. Oil Crops Outlook. Washington, DC.
———. Various, b. Oil Crop Situation and Outlook Yearbook. Washington, DC.
Fernandez-Cornejo, J., and W. McBride. 2000. “Genetically Engineered Crops for Pest Management in U.S. Agriculture.” Agricultural Economic Report No. 786. Washington, DC. May.
———. 2002. “Adoption of Bioengineered Crops.” Agricultural Economics Report No. 810. Washington, DC. May.
Flider. F. 1999. “Soybean Oil Emerges from the Pack.” Prepared Foods. November. <http://www.preparedfoods.com/archives/1999/9911/9911toc.htm> (accessed January 2003).
Food and Drug Administration, U.S. Department of Health and Human Services (FDA). 1999. “FDA Approves New Health Claim for Soy Protein and Coronary Heart Disease.” FDA Talk Paper. Rockville, MD. October 20.
Foreign Agricultural Service, U.S. Department of Agriculture (FAS-USDA). Various. Oilseeds: World Markets and Trade. Washington, DC.
———. 2003. Production, Supply and Distribution Online Database. <http://www.fas.usda.gov/ psd/intro.asp> (accessed July 2003).

Assessing the Feasibility of Processing and Marketing Niche Soy Oil / 49
Frerichs, R.L., E.D. Nafziger, B.E. Swanson, S. Eckhoff, and D.H. Lattz. 2000. Specialty Corn and Soybean Fact Sheets. Department of Agricultural and Consumer Economics AE-4736. University of Illinois. Urbana-Champaign, IL.
Fulton, J., J. Pritchett, and R. Pederson. 2003. “Contract Production and Market Coordination for Specialty Crops: The Case of Indiana.” Paper presented at the Symposium Product Differentiation and Market Segmentation in Grains and Oilseeds: Implications for Industry in Transition. Sponsored by the Economic Research Service, USDA, and The Farm Foundation. Washington, DC. January 27-28.
Glasgow, T. 2002. Comparing the Economics of Conventional, No-Till, Three Crop, and Organic Cropping Systems—Final Report of the Farming Systems Comparison Study. <http://www.aces.uiuc.edu/ ~asap/research/stew_farm/Report-2-02.htm> (accessed July 2003).
Good, D., K. Bender, and L. Hill. 2000. “Marketing of Specialty Corn and Soybean Crops.” Department of Agricultural and Consumer Economics AE-4733. University of Illinois, Urbana-Champaign.
Greene, C. 2001. “U.S. Organic Farming Emerges in the 1990s: Adoption of Certified Systems.” Agricultural Information Bulletin No. 770. Washington, DC. July.
Greene, C., and A. Kremen. 2003. “U.S. Organic Farming in 2000-2001: Adoption of Certified Systems.” Agricultural Information Bulletin No. 780. Washington, DC. February.
King, N., Jr. 2002. “U.S. Ponders Next Course in EU Biotech-Food Fight.” The Wall Street Journal. December 2.
Licht, M.R. 2001. “Mini Mills Could Turn Iowa into Gourmet Oil Site.” Inside Iowa State. Ames, IA: Iowa State University. July 20.
Lin, W.W., W. Chambers, and J. Harwood. 2000. “Biotechnology: U.S. Handlers Look Ahead.” Agricultural Outlook 270 (April). Washington, DC: Economic Research Service, U.S. Department of Agriculture.
Moser, L. 1999. “Thumbs Up: Michigan Soybean Farmers Keeping Value at Home with New-Generation Cooperative.” Rural Cooperatives, November/December, pp. 20-25. Center for Cooperatives, University of Wisconsin, Madison.
National Agricultural Statistics Service, U.S. Department of Agriculture (NASS-USDA). 2001. Acreage. Washington, DC. June.
———. 2002a. Acreage. Washington, DC. June.
———. 2002b. Agricultural Statistics 2002. Washington, DC: U.S. Government Printing Office.
———. 2003. Corn, Soybeans, and Wheat Sold Through Marketing Contracts—2001 Summary. Washington, DC. February.
Reuters News Service. 2001. “China Says Will Tread Carefully on GMO Imports.” July 5.
———. 2002. “ADM to Reduce Soybean Crush, Close Plants.” December 16.
Thumb Oilseed Producers’ Cooperative (TOPC). n.d. “A New Michigan Value-Added Contract Cooperative.” <http://www.thumboilseed.com/> (accessed July 2003).
United Soybean Board. 1999. “1999-2000 National Report on Consumer Attitudes about Nutrition.” Chesterfield, MO.

50 / Lence and Agarwal
University of Illinois. n.d. “Illinois Specialty Farm Products: Organic Food-Grade Soybeans.” College of Agricultural, Consumer, and Environmental Sciences, University of Illinois, Urbana-Champaign. <http://web.aces.uiuc.edu/value/factsheets/fact-organic.htm> (accessed January 2003).
University of Minnesota Extension Service. 2002. Southeast District Research and Demonstration 2002 Summary. University of Minnesota Extension Service, SE District Office, Rochester, MN.