assessing the features of the quality management system at
TRANSCRIPT
Assessing the features of the Quality Management System at Powertech
Transformers
by
Patricia N Ngomane
04359984
Submitted in partial fulfilment of the requirements for
the degree of
BACHELORS OF INDUSTRIAL ENGINEERING
in the
FACULTY OF ENGINEERING, BUILT ENVIRONMENT AND INFORMATION
TECHNOLOGY
UNIVERSITY OF
PRETORIA
Mentor: Prof K Adendorff
October 2011

i
Executive Summary
Quality Management Systems (QMS) are developed for many companies to forecast and manage the
quality of products. It is the responsibility of a company to manage its QMS and its suppliers. The
development of the International Organization of Standardization (ISO) and the South African Bureau of
Standards (SABS) has made it compulsory for companies that are accredited to comply with the
standards. Over the time companies tend to deviate from these standards which causes problems such
as customer dissatisfaction, short life expectancy of the product and poor product reliability. Many
companies have experienced large costs and losses due to non-conformance to the standards; therefore
it is necessary to constantly test the level of compliance with the standards and to meet the customer’s
requirements adequately. This is important for companies to remain competitive and allow them to
compete globally in their respective industries. The use of analysis techniques allows for diagnosing
problems in systems so as to focus the efforts of the company to eliminate them.
ii
Table of Contents List of Abbreviations ................................................................................................................................... vii
1. Introduction and Background ............................................................................................................... 1
1.1 Problem definition ................................................................................................................................ 2
2. Project Aim and deliverables ................................................................................................................ 2
2.1 The stakeholders ........................................................................................................................... 3
3. Project Scope ........................................................................................................................................ 3
4. Literature Review .................................................................................................................................. 4
4.2 Continual Improvement ................................................................................................................ 6
4.3 Quality Audits ................................................................................................................................ 6
4.3.1 The procedure of the quality Audit ..................................................................................... 12
4.3.2 The Audit report .................................................................................................................. 13
4.3.3 Analysis of the Quality Audit Findings ................................................................................ 13
4.4 Cost of Poor Quality .................................................................................................................... 15
4.5 Root Cause Analysis .................................................................................................................... 17
4.5.1 Human performance variation............................................................................................ 23
4.5.2 A3 brainstorming methods ................................................................................................. 24
5. Analysis of the current environment .................................................................................................. 27
5.1 The IO System ............................................................................................................................. 27
5.2 Cost of Poor Quality .................................................................................................................... 28
5.3 RCA method ................................................................................................................................ 28
6. Project Data and Analysis.................................................................................................................... 29
6.1 Case Study Analysis ..................................................................................................................... 29
6.2 Analysis of root cause trends ...................................................................................................... 29
6.3 Comparison and selection of the RCA tools ................................................................................ 31
6.3.1 Reality Charting ....................................................................................................................... 33
6.4 Human Performance Analysis ..................................................................................................... 35

iii
6.5 Analysis of the Cost of Poor Quality............................................................................................ 35
6.6 The Quality Audit ........................................................................................................................ 37
7. Development of the solution .............................................................................................................. 38
7.1 Root cause analysis ..................................................................................................................... 38
8. Results ................................................................................................................................................. 41
8.1 Results from the Quality Audit .................................................................................................... 41
8.2 Results from the Root Cause Analysis ......................................................................................... 43
8.3 Results human performance analysis ......................................................................................... 48
9. Key performance indicators (methods to testing) .............................................................................. 50
10. Recommendations .............................................................................................................................. 52
11. Conclusion ........................................................................................................................................... 54
Bibliography ................................................................................................................................................ 55
Appendix A .................................................................................................................................................. 57
Appendix B .................................................................................................................................................. 59
Appendix C .................................................................................................................................................. 61
Appendix D .................................................................................................................................................. 67
Appendix E .................................................................................................................................................. 68

iv
List of figures
Figure 1: Powertech Customers .................................................................................................................... 1
Figure 2: The conformance cycle (Stevenson: 1996) .................................................................................... 5
Figure 3: Continuous Improvement cycle (ISO 9001:2008) .......................................................................... 6
Figure 4: Characteristics of all the Audits (Arter, 1947) .............................................................................. 10
Figure 5: The phases of a quality audit (I.A Bechmerhagen, 2004) ............................................................ 12
Figure 6: The cost of poor quality categories (Beercroft, Dennis Inc) ........................................................ 16
Figure 7: The Ishikawa diagram (Latino R. J., 2007) .................................................................................... 20
Figure 8: The process flow diagram template (Northrop Grumman Corporation, 2006) .......................... 20
Figure 9: Frequency diagram (Northrop Grumman Corporation, 2006) .................................................... 21
Figure 10: Pareto Chart (Gitlow, Oppenheim, Oppenheim, & Levine, 2005) ............................................. 21
Figure 11: The error-change phenomenon (Latino & Latino, 2002) ........................................................... 24
Figure 12: the scope of the A3 process ....................................................................................................... 25
Figure 13: The steps of A3 process (AaronscreationsCompany, 2008-2011) ............................................. 26
Figure 14: SharePoint process flow ............................................................................................................ 27
Figure 15: Root causes classifications ......................................................................................................... 31
Figure 16: The wizard from RealityCharting (Apollonian LLC, 2011) .......................................................... 34
Figure 17: The problem definition (Apollonian LLC, 2011) ......................................................................... 34
Figure 18: The structure of the Reality Chart (Apollonian LLC, 2011) ........................................................ 34
Figure 19: Human performance analysis procedure .................................................................................. 35
Figure 20: Summary of the total cost of poor quality ................................................................................. 36
Figure 21: The cost breakdown of the Production department ................................................................. 37
Figure 22: sporadic events compared to chronic events ............................................................................ 41
Figure 23: Reality Chart of Type 1 IOs ......................................................................................................... 44
Figure 24: Reality Chart for Type 2 IOs ....................................................................................................... 45
Figure 25: Reality Chart for Type 3 IO ......................................................................................................... 46
Figure 26: Reality Charting for Type 4 IO .................................................................................................... 47
Figure 27: Human error categories ............................................................................................................. 48
Figure 28: Human error comparison over three years ............................................................................... 49
Figure 29: Balance scorecard categories (Kasselman G, 2011)) ................................................................. 51
Figure 30: Product manufacturing Process ................................................................................................. 57

v
Figure 31: Winding manufacturing process ................................................................................................ 57
Figure 32: Manufacturing process for Active Parts department ................................................................ 59

vi
List of Tables
Table 1: Format of a Reason-Pain Matrix ................................................................................................... 14
Table 2: Tools and methods of RCA ............................................................................................................ 19
Table 3: IOs to be used for case study purposes ........................................................................................ 29
Table 4: Comparison and ranking of tools and methods ............................................................................ 32
Table 5: The detailed IOs ............................................................................................................................ 39
Table 6: Further analysis of the cases ......................................................................................................... 40
Table 7: The R-P matrix for the audit findings ............................................................................................ 42
Table 8: Root cause classifications .............................................................................................................. 60
Table 9: The classification of the Audit findings as per department .......................................................... 66

vii
List of Abbreviations
PTT-Powertech Transformers
QMS-Quality Management System
ISO- The International Organization of Standardization
SABS- The South African Bureau of Standards
COPQ-Cost of Poor Quality
CoQ-Cost of Quality
RCA-Root Cause Analysis
KPI-Key Performance Indicators
CRT-Current Reality Tree

1
1. Introduction and Background
In general terms, Powertech Transformers formerly known as ABB Powertech transformers is a company
focused on the supply, distribution and storage of electricity across South Africa. Power and distribution
transformers are manufactured in three factories situated in Pretoria west, Booysens and Cape Town.
This project is based on the factory that is situated in Pretoria west. The factory in Pretoria west is one
of the largest within Sub-Saharan Africa. The facility is capable of manufacturing one of the largest
transformers (up to 795MVA, 500kV) and distribution transformers (up to 10MVA to 20MVA). One of
their major clients that they supply their product to is ESKOM and Municipalities as shown in the
customer segmentation below. According to the company profile, PTT is an SABS ISO 9001 listed
company. Furthermore the company has ISO 14001 accreditation for its environmental awareness and
ISO 18001 accreditation for health and safety.
Figure 1: Powertech Customers
In April 2008, ABB Powertech transformers changed its name to Powertech Transformers. After the
name change, Powertech Transformers seeks to test the effectiveness of certain procedures and
systems in the factory. The QMS is one of systems that is being assessed and tested for effectiveness by
continual improvement, internal audits and patrol inspections.
There are three main sizes of the power transformers. The standard and complex small power
transformers (SPT) range from 20MVA to 63MVA and up to 172KV. There are different transformers in
the SPT range including the double bound or the Auto-connected, Standard or high impedance
transformer and the low sound pressure level transformers. The standard and complex medium power
transformers (MPT) range up to 200MVA and 275KV. The standard and complex large power
transformer (LPT) has a three phase power rating reaching higher than 200MVA and the voltage ratings
higher than 275kV. The range of transformers for the MPT and LPT are similar to the SPT.

2
1.1 Problem definition
The Powertech Transformers (PTT) quality management system has been identified as a possible project
due to the possible inefficiency of the system. The company plans to test the QMS to ensure that it is
aligned to ISO and SABS standards. The Quality Manual is in the process of being updated and revised
and several changes will be made.
The company manages their documents using a program called Microsoft SharePoint. According to the
Wikipedia dictionary (2011), Microsoft SharePoint is a web application platform that has been
established by Microsoft. It is an application that is designed to centralise and replace multiple web
applications. It supports many different combinations of business website requirements. It is usually
associated with content and document management for many companies. It provides functions like
intranet portals, file management, social networking tools and many others. The system is very effective
and it is also used by PTT to manage the quality management system.
PTT must identify possible areas in the QMS that could be improved to make the system more efficient.
There are a large number of non-conformances stored on SharePoint but the data must be evaluated for
possible trends for the trends to be analysed and ultimately to improve the efficiency of the QMS. The
Costs of Poor Quality are to be analysed as these costs increase yearly. The current state of the system is
to be analysed if improvements are to be made to the QMS.
2. Project Aim and deliverables
The main aim of the project is to assist PTT in the development of an effective QMS for the winding and
the active part departments. The aim will be achieved by assessing the various features of the QMS
using the tools that will be explored in the literature review. The objectives are stated below:
Objective 1: This analysis aims to find the possible root causes using the best suitable
method for PTT. The root cause trends will be analysed using root cause analysis (RCA) tools
and methods.
Objective 2: The COPQ will be analysed and recommendations will be made on a possible
method of managing the costs.
Objective 3: The analysis of root cause data will be used to deduct the trends and
recommendations will be made.
Objective 4: The project aims to also define Key Performance Indicators (KPIs) for PTT.

3
Objective 5: Analysis of the Quality Auditing procedure and testing its effectiveness.
After the evaluation of the various aspects using different approaches for the assessment, a
recommendation will be made to identify possible problems or trends that may be revealed. In this
report the data that will be collected from the PTT Quality Management System. At the end of the
project the deliverables will be as follows:
Deliverable 1: The results from the analysis of trends in the Cost of Poor Quality (COPQ) and a
method that was selected to be used when analysing the Cost of Quality (CoQ).
Deliverable 2: The results from the analysis of trends and behaviour of the Root causes obtained
from Sharepoint.
Deliverable 3: The results of the analysis of a Quality Audit using researched methods.
Deliverable 4: The KPIs defined for the QMS.
Deliverable 5: The results from the RCA and recommendations of the methods to be used for
RCA.
2.1 The stakeholders
In this project the stakeholders are the student for responsibility of conducting the proper research and
analysis. The mentor at the Department of Industrial is also a major stakeholder along with the project
sponsor from Powertech Transformers (PTT). PTT is a stakeholder as the results from this project may
highlight important trends and information that was not realised prior to the project. If the project
reveals important information then the Quality Department stands to gain momentum to implement
some of the recommendations or further investigate the problems.
3. Project Scope
The scope of the project is based in two main departments, manufacturing of the windings and the
active parts departments. There are four stations in the windings department which are the
manufacturing station, the assembly station, the drying station and the packaging station. There are two
main stations for the active parts department.
1. The student will be required to observe the manufacturing process along with the supervisors
and the quality auditing technician; this will allow the student to identify the non-conforming
products during the Quality Audit.

4
2. The winding stations that will be investigated are for the small, medium and large transformers
since the processes are similar for all the transformers.
3. A quality audit will be performed for the four departments and recommendations will be made
from the audit findings.
4. The costs of poor quality will be analysed for trends and recommendations will be made to
manage the costs.
5. A number of selected cases will be analysed using Root cause analysis (RCA) techniques. The
techniques will be compared and the best fitting techniques will be selected.
6. The RCA techniques will be used to analyse variation in human performances for the PTT
employees.
7. The recommendations that will be made will only diagnose problems and not solve actual
problems in the QMS.
4. Literature Review
4.1 Conformance and non-conformance
The general definition of a non-conformance is that it is an item, process or event that does not match
the requirements that have been defined for it. A non-conformance usually has costs with which
impacts the overall system negatively. The term “non-conformance” is derived from the root word
“conformance”; conformance is defined in the Total Quality management (TQM) magazine (Stevenson:
1996) as carrying out an action according to a set of specified standards. The main purpose of a
conformance is to find a balance between empowerment and control. The conformance cycle is used to
describe all the elements that are involved in conformance.

5
Figure 2: The conformance cycle (Stevenson: 1996)
The main focus of the conformance cycle is customer satisfaction. To attain customer satisfaction with
the product or service there must be a focus on issues like reducing the overall production time,
increasing the efficiency of production and reducing the cost of production. The conformance cycle is
fundamentally focused on specifications. The specification is implemented and the conformance to the
specification is analysed using various methods like auditing. The specification may also be analysed and
revised after audits.
Non-conformances in an organisation need to be addressed to ensure that the final product is not
affected. The ISO standards (ISO 9001:2008) state that an organisation should define procedures to
address non-conforming products before they are delivered to the customer. According to the
standards, action should be taken to eliminate nonconformities even after the product has been
delivered to the customer.
Customer satisfaction
Reduce production time
Reduce costIncrease
effeciency
Increase employee job satisfaction

6
4.2 Continual Improvement
The ISO standards (ISO 9001:2008) state that organizations must frequently improve the effectiveness of
their quality management systems through the use of quality policies, audit results and many other
methods. This is an important aspect that would make the company more competitive. The model for
continuous improvement is illustrated in the ISO 9001:2008(E) standards.
The model illustrated below is the core of Quality Management Systems (QMS) that are implemented in
many companies including PTT.
Figure 3: Continuous Improvement cycle (ISO 9001:2008)
The project is however focused on the process of dealing with products that do not conform to the
quality standards that have been defined. Solving of non-conformances usually requires that preventive
and corrective measures be specified for that situation to avoid future re-occurrences and costs. The
need for improvement of quality via QMS is an essential part of continuous improvement.
4.3 Corrective action
According to (Russel & Regel, 2000), a corrective action is the action taken to remove the cause of non-
conformities that have been detected in order to ensure that they do not re-occur. It is important to
note that corrective action is a part of continuous improvement but it is not the entire QMS because a
QMS has more components and aspects to it. This implies that an effective corrective action initiative
does not mean continuous improvement. Complimentary to this definition, corrective action is defined
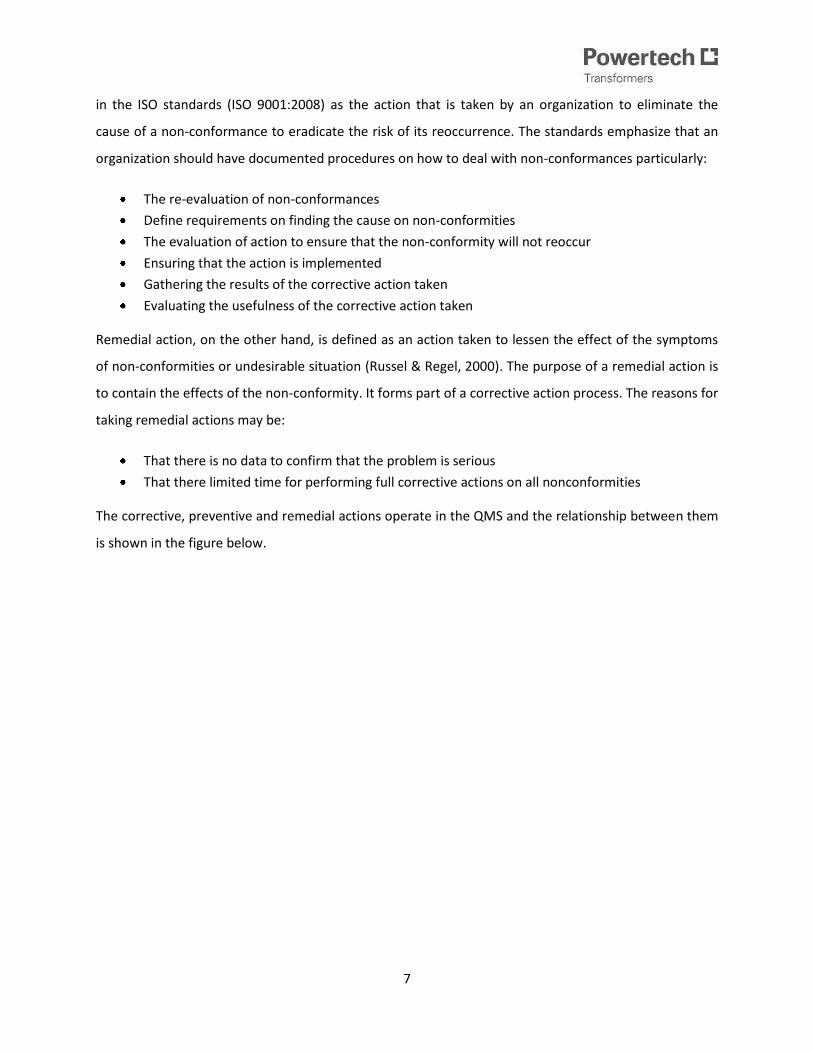
7
in the ISO standards (ISO 9001:2008) as the action that is taken by an organization to eliminate the
cause of a non-conformance to eradicate the risk of its reoccurrence. The standards emphasize that an
organization should have documented procedures on how to deal with non-conformances particularly:
The re-evaluation of non-conformances
Define requirements on finding the cause on non-conformities
The evaluation of action to ensure that the non-conformity will not reoccur
Ensuring that the action is implemented
Gathering the results of the corrective action taken
Evaluating the usefulness of the corrective action taken
Remedial action, on the other hand, is defined as an action taken to lessen the effect of the symptoms
of non-conformities or undesirable situation (Russel & Regel, 2000). The purpose of a remedial action is
to contain the effects of the non-conformity. It forms part of a corrective action process. The reasons for
taking remedial actions may be:
That there is no data to confirm that the problem is serious
That there limited time for performing full corrective actions on all nonconformities
The corrective, preventive and remedial actions operate in the QMS and the relationship between them
is shown in the figure below.

8
Figure 4: Corrective and preventive action process inputs and outputs (Russel & Regel, 2000)
The process begins with the results from testing and inspecting products then the non-conformance of a
product will be detected from the results. The non-conformance will then be screened and filtered to
see whether it is a minor issue that can easily be resolved or a more complex issue. Once this has been
analysed, the action chosen can either be to do nothing, to perform a remedial action because the issue
is minor or to take corrective action because the issue is serious.
Dennis (Arter, 1947) adds that the general program for executing a corrective action consists of three
core components. The first component is to identify the problem using the tools that are available in the
organisation. The second component is to fix the problem and then to find the underlying cause of the
problem and to correct it.
4.4 Preventive action
Preventive action is defined by J.P Russel (Russel & Regel, 2000) as an action taken to eliminate a
potential cause of a nonconformity in order to prevent its occurrence. Wikipedia (Corrective and
preventive action) states that the purpose of a preventive action is to prevent potential failures from
Inspections and
tests done on the
product
Inputs to Corrective
Action
FilterRemedial
Action
Corrective
Action
Quality Policy
Management
Review
Corrective
ActionInputs to Preventive
Action
All Quality
records
New Products
and services
Statistical
Techniques
Nonconforming
product.
Audit Findings
Customer
complaints
Analyze
formal
and
informal
Do nothing

9
occurring. J.P Russel also relates to Figure 4 and states that inputs to the preventive action program are
as follows:
Collect data- this data can be in the form of quality records relating to nonconforming data,
audit findings and customer complaints
Analyse the performance data-the data will be analysed by using different techniques. The
techniques for analysis of the data may include statistical techniques, Pareto charts, cause and
effects diagrams and scatter plots
Reveal trends and patterns-once the tools have been used then the trends may be observed.
These trends may mean potential improvement areas therefore plans will be made to eliminate
the potential occurrence of the failure.
Preventive action programs may be seen as proactive methods when compared to the reactive
nature of the corrective actions. The ISO standards (ISO 9001:2008) require that there be
documented procedures defined to address preventive actions:
To determine the potential causes
To test the need of the preventive action to eliminate occurrences of nonconformities
To actually implement the action that is required to eliminate the nonconformity
To keep the records of the results when the preventive action was executed
To test the effectiveness of the preventive action
4.5 Quality Audits
There are many different meanings to the term “audit”. A few sources were examined establish an apt
meaning for the word. Firstly, the Oxford Dictionary states:
“An audit is an examination of organizations accounts”
The second definition obtained from the investor’s word website (Webfinance Inc)states that the
definition of an audit is:
“An examination and verification of a company’s financial and accounting records and
supporting documents”
The definition of an audit seems to be generally focused on the examination of financial records but this
definition is incomplete since auditing is not only based on financial systems, it has more aspects to it.
When one adds the specific context into which one wishes to base the term “audit”, a different
definition is obtained.

10
The term quality audit has been defined using Wikipedia (Quality Audit, 2011)as:
“The process of examination of a quality system carried out by an auditor or an audit team”
The common ground for all the different kinds of audits is that they are all examination processes for
testing an aspect of a system. According to Dennis Arter (Arter, 1947), there are three main types of
audits based on their applications in the quality, finance and environmental areas. The quality audit is
further broken down into four kinds of audits as illustrated in the image that follows. There are process-,
product-, and system audits as well as vendor surveys.
Figure 5: Characteristics of all the Audits (Arter, 1947)
A product audit re-examines the quality of the finished product in detail before the product is delivered
to the customer. A process audit is a less extensive audit performed on a smaller scale; it measures a
selected area of the work effort. A system audit examines most or a part of the management control
components for non-conformance. Finally, a vendor survey reviews the vendor’s management of their
products.
The common characteristics of the above mentioned audits are as follows:
1. They examine a selected portion or area of a larger system.
AUDIT
Financial Quality Environmental
Product Audit
Vendor Survey
System Audit
Process Audit

11
2. The methods of the audits are to examine a portion and then make deductions for the entire
process
3. The audits are performed by a third person who is not directly involved in the area to be
audited.
Findings and observations identify the unsatisfactory elements and conditions that are found during the
audit. It illustrates a noncompliance and is detected as a weakness in the system.
The basic auditing process as defined by J.P Russel (Russel & Regel, 2000) consists of six main elements
that need procedures to be defined, these are:
Methods
o Procedures for planning the audits.
o Procedures for selecting the auditors.
o Procedures for executing the audit.
Measures
o Formats for the audit reports.
People
o Methods of training the auditors.
Equipment
o Used for communication and compiling audit reports.
Materials
o Standard company documents and procedures.
Environment
o Good working conditions.
An important aspect to note about quality audits is that the manner in which they are conducted is
important to the success of the audit. The audit is also defined by ISO standards (ISO 9001:2008) as an
important component of a QMS. ISO states, in section 8.2.2 that an internal audit must be conducted in
an organization at planned times as a part of monitoring the system. The audits must conform to the
requirements of ISO and the requirements set by the organization.

12
4.5.1 The procedure of the quality Audit
The structure of an audit mainly consists of seven phases that each have subcomponents. It is important
to follow these steps to ensure that the correct results will be obtained from the audit and that the audit
is effective. The audit phases are shown in the image below.
Figure 6: The phases of a quality audit (I.A Bechmerhagen, 2004)
The first few phases consist of setting the date, preparing the audit team, checklists, notifying the
department to be audited, planning for the audit. The execution phase is composed of gathering the
data and the analysis of the information. The reporting phase is the translating and communicating the
findings to the rest of the staff and management, and publication of the formal audit report. The closure
phase follows up on the actions planned, tracking, and further evaluation. The team addresses the
problems by corrective actions and by eliminating the root cause by preventive action.
An important phase in the audit is during the preparation for the audit. There are many key elements to
that phase and it is important that it is done thoroughly. Dennis (Arter, 1947) emphasizes that the
formal notification should contain the following elements:
1. The departments that will be audited.
2. The date of the audit (especially when there is no preliminary schedule).
3. Reason for the audit procedure.
4. The sections or the activities that will be audited.
5. The standards that will judge the performance.
6. The person (team) who will be leading the audit.
7. How the audit has been scoped.
1 •The initiation phase
2 •Determining the scope, schedule and goal
3 •Organizing of the Audit team
4 •Planning the Audit
5 •Preparation for the Audit execution
6 •Executing the audit
7 •Compiling the Audit report
8 •Closure phase

13
The next vital part of the audit is the execution of the audit where the physical data is collected from the
factory. This part is the inspection of the process, documentation or procedure. The physical
examination requires criteria that will be assessed according to the performance standards (ISO
9001:2008) stated in the audit notification. Any faults found after testing are called audit findings. The
findings are recorded and will be discussed with the respective department to resolve them.
4.5.2 The Audit report
The Audit report is a method of communicating the results and the findings of an audit to management
and other members. The characteristics of a good audit are suggested by Dennis Arter (Arter, 1947):
1. The audit results must be verifiable, meaning that the evidence to support the findings must be
easily traceable.
2. The report will contain judgements which express either approval or disapproval.
3. There should be a summary section in the report. This section should assess the overall
performance of the system from the findings.
4. The findings must be in the report and they must have supporting evidence in the report. Some
similar findings should be consolidated into one generic finding.
5. The report must be clear and unambiguous.
4.5.3 Analysis of the Quality Audit Findings
After the compilation of the audit report it is necessary that the report be discussed with the managers
and other participants to ensure that they understand the findings. The next step is the closure phase
where the audit team and the managers set up a meeting to discuss the corrective and preventive
actions for the findings. There are many tools to analyse the findings. One of the tools is named a reason
matrix and will be explored further. This matrix is a tool of analysing audit findings to see which are the
most important and need to be addressed. The purpose of a reason matrix tool is to connect the audit
findings to the defined company objectives. It is one method of analysing the cause and effect of a
finding.
The method considers the reasons for raising a finding and the possible effect of the nonconformity on
the company. The matrix plots the reasons raising findings against the effect that it may cause and then
the severity of the finding is assessed. The possible reasons for an auditor to report a problem may be in
one of the following categories:
Reason 1-Not defined or documented

14
This reason addresses the findings that do not meet the requirements of quality management
standards
Reason 2-Not implemented
This reason says that the system is designed very well but it has not been implemented properly
in all the sections of the company that were inspected.
Reason 3-Does not meet objectives
This reason means that the system meets all the requirements but the results from the
performance of the system are not in line with the objectives that were defined.
There are interests of the manager from a quality audit. These interests are referred to the “pains” and
they may be classified in to three comprehensive categories:
Pain 1: Cost
Managers need to know that if they address a problem, that costs may be reduces. These costs
may be direct product costs or decreased production costs from a more efficient system.
Pain 2: Opportunity
It is important to know that, by focusing on the findings”, there may be a new opportunities
created in the forms of new products and markets or increasing the capacity to produce more
products.
Pain 3: Risk
If it will be possible to reduce the risk of loss by addressing a finding, managers will find an
interest in it. The loss can be in the form of monetary loss or the loss of customers.
Table 1: Format of a Reason-Pain Matrix
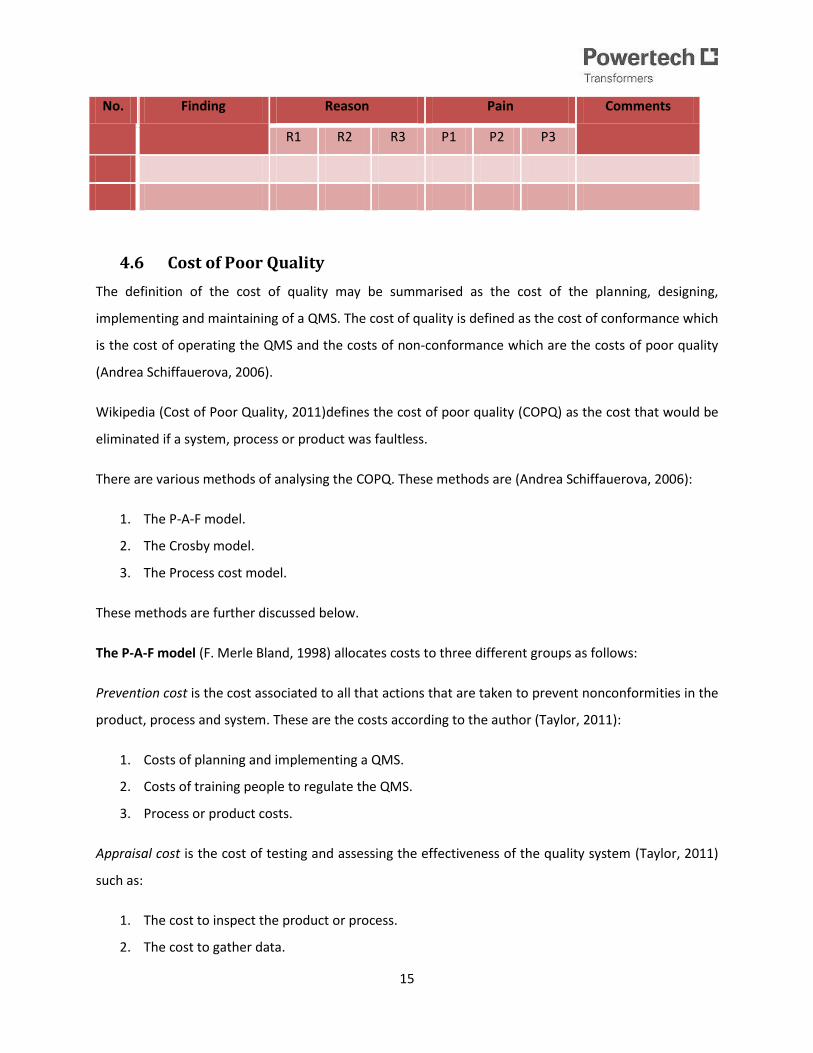
15
No. Finding Reason Pain Comments
R1 R2 R3 P1 P2 P3
4.6 Cost of Poor Quality
The definition of the cost of quality may be summarised as the cost of the planning, designing,
implementing and maintaining of a QMS. The cost of quality is defined as the cost of conformance which
is the cost of operating the QMS and the costs of non-conformance which are the costs of poor quality
(Andrea Schiffauerova, 2006).
Wikipedia (Cost of Poor Quality, 2011)defines the cost of poor quality (COPQ) as the cost that would be
eliminated if a system, process or product was faultless.
There are various methods of analysing the COPQ. These methods are (Andrea Schiffauerova, 2006):
1. The P-A-F model.
2. The Crosby model.
3. The Process cost model.
These methods are further discussed below.
The P-A-F model (F. Merle Bland, 1998) allocates costs to three different groups as follows:
Prevention cost is the cost associated to all that actions that are taken to prevent nonconformities in the
product, process and system. These are the costs according to the author (Taylor, 2011):
1. Costs of planning and implementing a QMS.
2. Costs of training people to regulate the QMS.
3. Process or product costs.
Appraisal cost is the cost of testing and assessing the effectiveness of the quality system (Taylor, 2011)
such as:
1. The cost to inspect the product or process.
2. The cost to gather data.

16
3. The cost to test equipment.
Failure cost is the cost linked to a non-conformance. There are two types of failure costs namely the
internal failure cost and the external failure cost.
1. The cost due to scrapping and wasting of material.
2. The cost of reworking.
3. The cost of downtime in the production line.
Crosby’s model
This model considers the cost of quality similar to the P-A-F model but Crosby defines the “conformance
to requirements” and emphasizes the idea of zero defects. He defines the COPQ in terms of
conformance and non-conformance and also reasons that the costs of poor quality outweigh the costs
of preventing poor quality as illustrated in the figure that follows:
Figure 7: The COPQ categories (Beercroft, Dennis Inc)
Process cost model (F. Merle Bland, 1998) allocates costs to either conformance or non-conformance
Cost of conformance is the minimum cost of a process. Cost of conformance includes the prevention and
appraisal costs as defined in the P-A-F model.
Cost of non-conformance is the cost of an efficient QMS and it composed of external and internal failure
cost from the P-A-F model
In conclusion the costs of poor quality can be divided into the following broad categories (Harrington,
1999 ):
Prevention
Cost
Appraisal
Cost
External
failure cost Internal
failure cost

17
Direct cost of poor quality
1. Controllable cost of poor quality:
a. Prevention cost,
b. Appraisal cost,
c. and non-value added cost.
2. Resulting cost of poor quality:
a. Internal cost of failure
b. and external cost of failure
3. The cost of failed equipment
Indirect cost of poor quality
1. Customer-incurred cost.
2. The cost of customer dissatisfaction.
3. The cost of losing reputation.
4. The cost of the opportunity lost.
The traditional methods of analysing the COPQ according to the TQM magazine article (Andrea
Schiffauerova, 2006) is based on the prevention, appraisal and failure costs. The P-A-F model is the most
frequently used model in most companies. The P-A-F model is an excellent model for viewing costs of
poor quality but there are also alternatives as mentioned before namely the process model cost and the
Activity Based Costing (ABC). It is important for companies to assess their situation and see which model
bests suits the needs of the company. The process model and ABC model focuses on the process and
they allow the company to observe the trends of the Cost of Quality.
The main idea behind analysing the costs of poor quality is to analyse the trends and then find methods
to reduce the costs. Once the trends are analysed it will be clear to see which costs contribute the most
to the poor quality. The analysis of the COPQ along with root cause analysis can largely reduce the
nonconformities that occur in a company.
4.7 Root Cause Analysis
Root cause analysis (RCA) is defined by James Rooney (reference) as
“a process designed for use in investigating and categorizing the root causes of events”.

18
The second definition of RCA is from an article on quality and productivity (Mahto & Kumar, 2008) which
states that
“..It is the process of defining causes of problems using a structured approach with techniques designed
to provide a focus for identifying and resolving problems”
Root cause analysis (RCA) is a tool used for identifying the underlying cause of an event. The RCA tracks
the cause and effect trail from the failure to the root cause .There are several factors that justify the use
of RCA.
1. The number of repairs that were performed during a stated period.
2. The percentage of the productivity that was delayed due to non-conformances.
3. The number of products that were rejected by the customer.
The main categories of root causes are stated below:
1. Equipment.
2. Procedure.
3. Personnel error.
4. Design problem.
5. Training deficiency.
6. Management problems.
There are seven steps for conducting a root cause analysis. It is essential to note the importance of
collecting the relevant data that will be used for the RCA.
1. Find and describe the actual root cause.
2. Describe the physical event of the root cause.
3. Organize the details of the root cause.
4. Assemble a team that will work together in finding the root cause.
5. Consider all possible root causes.
6. Verify the logical root causes and eliminate illogical root causes.
7. Separate the human-error causes from physical causes.
James Rooney (Heuvel, 2004), however, summarises the RCA process in the four main phases.

19
1. The data collection phase where all the data is collected from the different sources and studies
that are conducted in the facility.
2. The causal charting phase gives a framework for the investigators to organise the data that has
been collected.
3. The phase when the root cause is identified using the tools that will be discussed later in the
report.
4. The recommendation phase includes the presentation of the RCA results and recommends the
actions to be taken in eliminating the root cause.
The tools that are used for RCA are divided into the basic tools and the advanced tools.
Table 2: Tools and methods of RCA
Basic Tools Advanced tools
Ishikawa(cause and effect diagram) Logical tree
Pareto chart Affinity diagrams
Histograms and frequency plots Statistical Process Control
Change Analysis GAP analysis
Process Flow charts Process failure mode effects analysis (PFMEA)
Barrier Analysis Process capability analysis
Each tool is briefly explained in this report in terms of use and the logic behind the model. To effectively
use the tools and methods stated in Table 2, the criteria for comparison must be defined
The Ishikawa diagram is also known as a cause-and-effect diagram (Latino R. J., 2007). It is designed to
help stimulate creative thinking and it is framework for planning the data that will be collected. It
visually displays the causes that are being studied and may also reveal potential causes. The most
popular categories for the Ishikawa diagram are the 4Ms, 4Ps and 4Ss. The 4Ms stand for material,
methods, machines and manpower. The 4Ps stand for people, policies, procedures and places. Lastly,
the 4Ss stand for systems, suppliers, skills and surroundings. A representation of the Ishikawa diagram is
shown below.

20
Figure 8: The Ishikawa diagram (Latino R. J., 2007)
The process flow charts represent the steps of a process on a graph. It helps the users to see the entire
process from start to finish. It also shows the inputs and the outputs of a process. It is used to locate
problems in a process and shows the relationships between the steps of a process (Northrop Grumman
Corporation, 2006). There are three main types of process charts (1)the high level overview,(2) the
operational level chart that links the inputs to the outputs ,and (3) the design level chart that shows the
operator methods and materials.
Figure 9: The process flow diagram template (Northrop Grumman Corporation, 2006)
Histograms and frequency plots display large quantities of complex information. They are similar since
both give a summary of data from a process and represent the data graphically. They are normally used
to see the capability of a process to meet the needs of the customer. They are used to show the
information in an easy to read format other than tables. The frequency plot shows the relative
frequency that an event occurs as well as the distribution of the data. The histogram uses the
information from the frequency table for its construction.
Effect
Category
Category
Category
Category
Cause
Cause Cause
Cause
Cause
Cause
Primary Cause
Cause
Cause
Cause
Primary Cause
Secondary cause
Secondary cause
Secondary cause
The Process name
Outputs
Boundaries
Inputs Beginning end

21
Figure 10: Frequency diagram (Northrop Grumman Corporation, 2006)
The Pareto Chart can be used to find the underlying causes of an event. Firstly, it is used to show the
highest number of occurrences. The information is plotted on the Pareto chart so that it can be viewed
graphically. Secondly, they are often used to improve chaotic processes since they draw attention to the
major issues. For RCA, Pareto charts help to focus the efforts of the team. The basic construction of a
Pareto chart is shown below.
Figure 11: Pareto Chart (Gitlow, Oppenheim, Oppenheim, & Levine, 2005)
Affinity diagrams are techniques that are used to capture all the views, ideas and responses to
particular problems including behavioural aspects. Affinity diagrams group the data into comparable
categories so that they can be analysed (Northrop Grumman Corporation, 2006). They are also
considered as one of the less structured forms of RCA.
Process failure mode effects analysis (PFMEA) is a tool that helps in identifying occurrences and
detections of failure. It provides a guide in the creation of corrective plans and the mitigation of the
0
30
20
10
60
50
40
70
80
90
100
Events
Ho
w o
fte
n t
he
ev
en
t o
cc
urs
A EDCB F
Nu
mb
er
of
oc
cu
ren
ce
s
22
risks. The goal is to eliminate the failure mode and reduce the risk of its occurrence. The process
identifies the failure mode before it occurs, then determines the severity of the failure mode and then
identifies possible controls (Northrop Grumman Corporation, 2006)
Process capability analysis is a tool that determines whether a process is unstable, and then determines
the causes of the instability. The tool also recommends actions to be taken to remove the cause of
instability. It mainly compares the output of the process (known as the voice of the process) to the input
of the process (known as the voice of the customer). The aim is to align the inputs to the outputs of a
process (Gitlow, Oppenheim, Oppenheim, & Levine, 2005)
Change Analysis: It is a six step process that describes a problem or an effect. The same situation
without the problem is also analyses then the differences between the situations are compared. The
causes for the differences in the two situations are identified from this analysis. This method does not
provide a specific root cause but can generally identify all the causes.
Barrier Analysis: It is an incident analysis that detects all the barriers that are in place to protect an
object from harm. It investigates whether the barriers failed, held or were compromised. The conclusion
drawn from the barrier analysis identifies the reason for the barrier failure as the root cause.
There is a difference between a tool and a method. The tool is defined in the Oxford dictionary
(Catherine Soanes, 2006)as the equipment used to carry out a function. A method is the technique of
doing an action i.e. the manner in which tools are used. There are methods and tools used for RCA.
There are several methods that will be briefly explained in this report (L.Gano, 2007).
Method 1: Fault tree is used to trace an event to its root cause by identifying the sequence of the failure
and then aligns them to the cause. The results from this chart are used in the construction of a tree
diagram which is discussed below. The events and the conditions are analysed on the causal chart and
placed onto a timeline.
Method 2: Tree diagrams are very common methods of analysing root causes. The common forms of
this method are the Ishikawa diagram, the human performance evaluation systems and other methods.
The main problem is placed at the top of the tree and the categories of causes are placed as branches of
the trees. The categories are further broken down into sub–categories. At the end of the analysis the
team is asked to review the causes that are most likely.

23
Method 3: Five-Whys method aims to uncover the root causes by asking “why” five times. Through
every cycle of asking why, the answer reveals a new layer of contributing factors and the end result is
identification of the root cause. This method is usually used in conjunction with the Ishikawa diagram to
provide more effective results. This method is also ideal for defects that have more than one root-cause
associated to it.
Method 5: Current reality trees (CRT) are similar to the 5-Whys analysis during construction and are
based on the theory of constraints (TOC). The reality tree evaluates the problem or the effects and the
causes of the problem are investigated by answering the question “why?” The answers are plotted onto
the reality chart and the solutions are added to each root cause. The chart clearly shows the
relationships between the causes and all the causes must have supporting evidence added.
Failure can be classified into 4 main categories namely problems, opportunities, sporadic and chronic.
The problems category looks at failure as a disturbance to the system and failure in the opportunity
classification is the ability to perform better. The sporadic failure is dramatic and requires a great deal of
attention but only occurs occasionally. A chronic failure is the type of failure that is accepted as part of
routine and forms part of the status quo. The failure type that is mostly overlooked in companies is the
chronic failure.
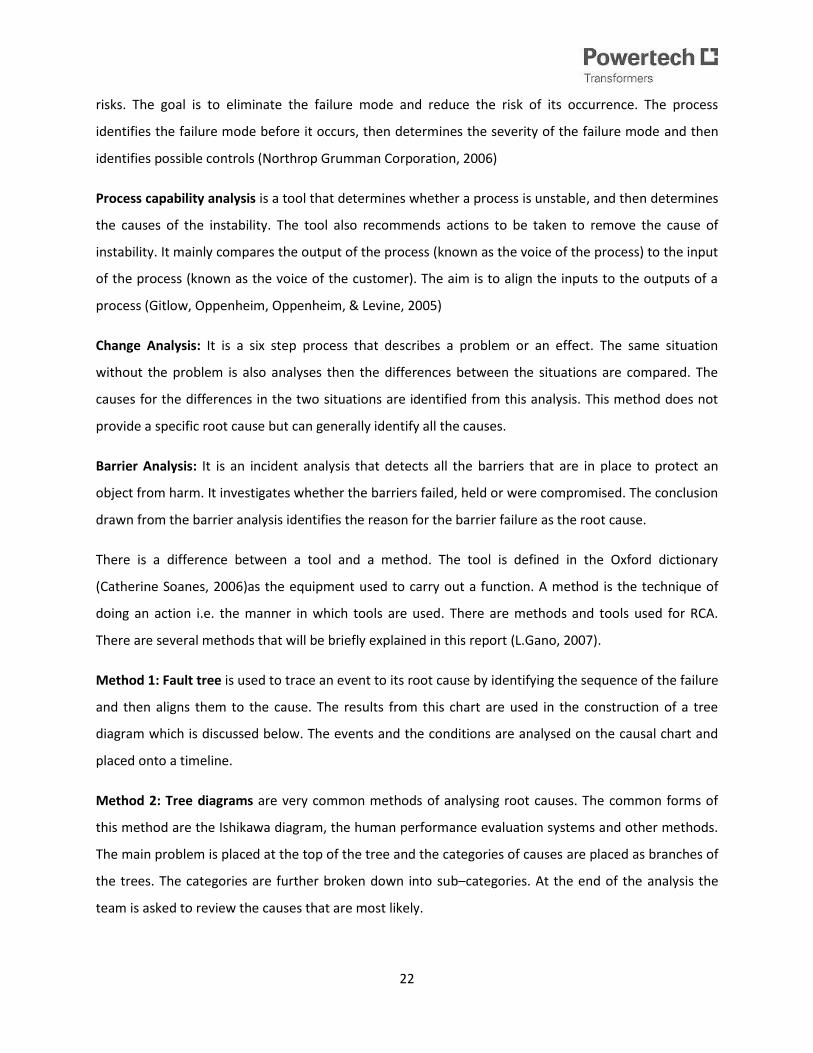
4.7.1 Human performance variation
To encourage day-to-day continuous improvement, it is important to adopt methods to manage root
causes. Human-error is a common cause of non-conformances but it is seldom easy to find the pattern
to this root cause. Human behaviour is subject to many external factors and the trend of human-error is
called the error-change phenomena. This phenomenon is shown in the Figure 12. Human error is not a
valid root cause due to the other underlying factors that can be investigated to find the reason for the
variation. Most errors committed by the employees have causes like tools, machines and the work
environment.
24
Figure 12: The error-change phenomenon (Latino & Latino, 2002)
The error-change phenomena theory states that the trend of human error can be seen as a chain that
consists of a cause and an effect. The elements are interlinked and breaking one link in the chain can
break the entire chain and eliminate the root cause.
There is variation among people and it is important to manage and reduce this variation. The sources
that contribute largely to the variation of human performance must be thoroughly investigated and
eliminated. Performance management refers to the actions taken to reduce uncontrolled variation by
eliminating the root causes and preventing reoccurrence. Performance improvement refers to the
strategies that are developed for short or long terms, to remove uncontrolled variation. The common
techniques that are used to find root causes cannot easily identify the root causes of human variation.
Pareto charts, Line and bar graphs are effective when it comes to root cause analysis for human
performance variation.
4.7.2 A3 brainstorming methods
A3 is defined traditionally by the oxford dictionary (Catherine Soanes, 2006) as a “standard size of paper
with the dimensions of 420x297mm”. The definition that is applicable to this project is the definition
from the six sigma conference (Anthony Manos, Ptofero Inc, 2009) that states that it is a “standardized
approach for team based problem solving”. A3 brainstorming uses the A3 size paper to structure a
solution to a problem. It presents the solution in one page from start to finish so it makes it easy for the
reader to trace the solution.
Most companies, like PTT, use the A3 structure as a tool of solving problems mainly due to non-
conformances in the company. According to Anthony Manos (Anthony Manos, Ptofero Inc, 2009), the
C
E
C
C
C
E
E
EC
E
C
E
E
C
E
Random
Event
E-Error
C-Change
E
E
E
E
25
method encourages “collaborative and in-depth problem solving” and it addresses many aspects of the
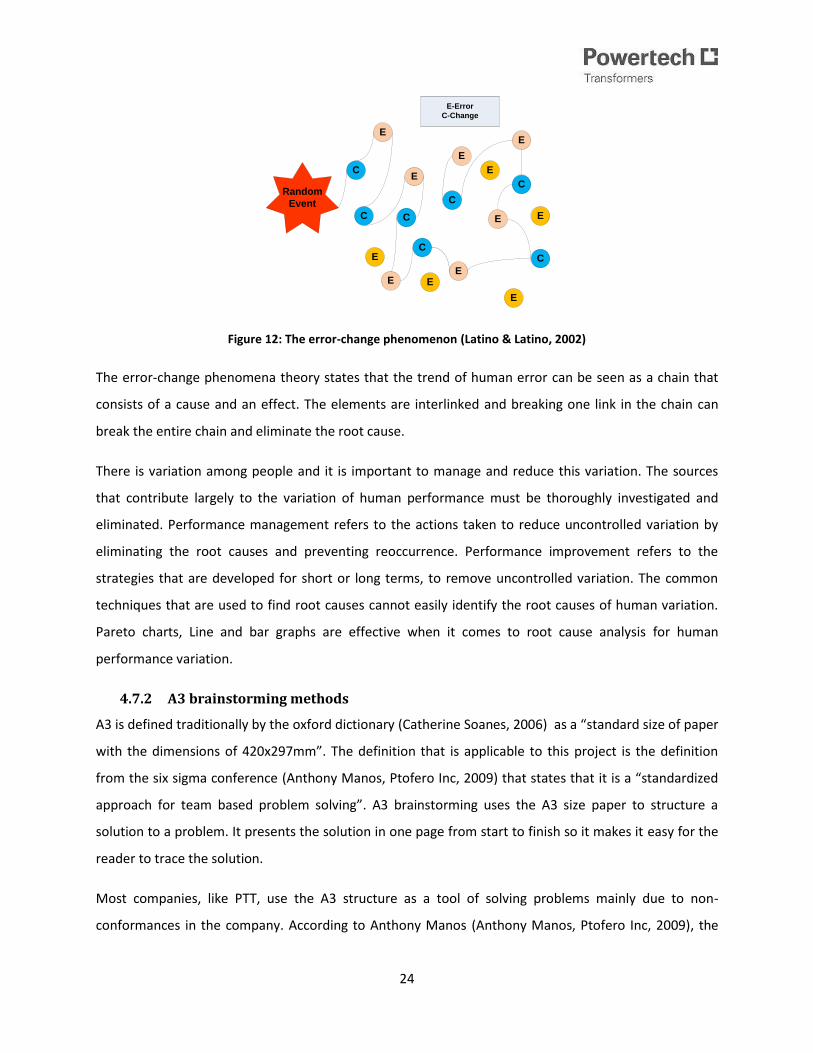
company including the strategic, system and process as illustrated in the image below.
Figure 13: the scope of the A3 process
The strategic components include business planning. The system components are the other kinds of
planning such as the design team planning and mapping of the value stream. The process is composed is
of solving problems and the work that is standard in the business. Within these components there are
forms that are related to them. The strategic forms include the Swot analysis forms, tree diagrams and
the competitor analysis. The system forms include the value stream map which consists of the
comparison between the future ideal state and the current state. The process analysis forms include the
standard combination work sheet and the problem solving from. The tools of the A3 are identical to the
root-cause-analysis tools therefore they will be analysis in-depth in the root cause analysis sections of
this report. :
Pareto diagrams
Gantt charts
Flow charts
Tree diagrams
Histograms
Ishikawa diagram
And Control charts
4.7.2.1 Procedure for A3 brainstorming
The A3 method is for addressing a specific problem in a business. The structure of the A3 brainstorming
process is based on the A3 report where the solution is laid out. A3 is a standard procedure that is
Strategic
System
Process
26
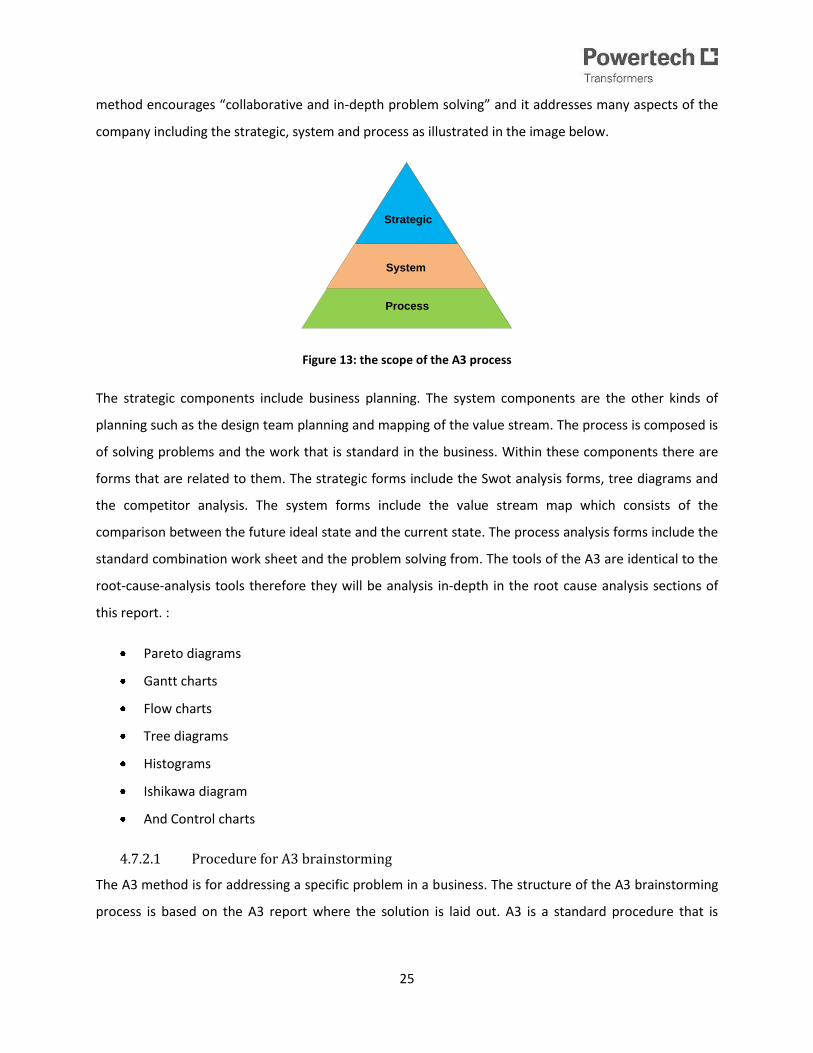
described in the figure below. The span of the A3 project could either be short, medium or long term.
The process can be summarised (AaronscreationsCompany, 2008-2011) in the diagram below.
Figure 14: The steps of A3 process (AaronscreationsCompany, 2008-2011)
The A3 process begins with the definition of the theme or the topic that will be discussed during the
barnstorming sessions to follow. The theme is usually based on a recurring nonconformity from the
company. Once the theme is established then the background of the issue is described in detail. The
next phase requires the analysis of the “as is” condition to be analysed. Analysing the current state of
does not mean defining the solution already. To illustrate the current situation graphs and data can be
used. The root cause analysis tools will then be used to investigate the root causes of nonconformity.
These tools have been mentioned in the previous section. The ideal or target condition is set and plans
are made to achieve the target. Once the solution has been laid out then it is implemented and then a
follow-up must be done to see the effectiveness of the solution. The effectiveness can be tested using
metrics and cost benefit results.
Define the theme
Describe the background
Describe the "as is" condition
Conduct a root cause analysis
Set the target
Implement the strategy
Conduct follow-ups on the progress

27
5. Analysis of the current environment
5.1 The IO System
The current system that is used to manage and control all the documents of PTT is SharePoint. This
software, as previously mentioned, is an effective system but there are still non-conformances that
occur at the plant. The non-conformances are called Improvement opportunities (IO). All of the non-
conformances are required, by the company quality policy, to be investigated internally by appointed
employees. The figure below illustrates the flow of the investigation process of an IO.
Figure 15: SharePoint process flow

28
The process is traceable and maintained on SharePoint. A section of the manufacturing process of a
transformer has been attached to Appendix A. The process begins with an IO raised on SharePoint by an
originator. The coordinator is notified via email and the IO is reviewed. An investigator will then be
assigned to the IO and the IO will be reviewed. Once the review has been completed, the IO will be
investigated. The Investigation process consists of the investigator communicating with the originator
and visiting the site where the non-conformance has been reported. The investigator will then discuss
the corrective actions that will be taken as a remedy then the preventive action will be finalised. The
costs of the non-conformance will be analysed during the investigation of IOs.
5.2 Cost of Poor Quality
As of February 2006 the COPQ method was redefined and the current cost system covers the following
aspects:
The cost factors are taken from most of the processes across the value chain.
The cost factors are easily measurable and are part of existing process / sub process measures.
The cost factors focus on specific process measures and not generic.
The measurements are mainly at the sub process levels and not generic.
The employees were trained for the current cost system and the data that was obtained from
SharePoint uses the current costing method. The current cost system is susceptible to duplication of IOs.
The duplication occurs when a new IO is defined for the COPQ to be added. The current method is said
to be time consuming as the IO is redefined for the cost to be added.
5.3 RCA method
The current method of analysing root causes is the A3 brainstorming method which has been discussed
in detail in the literature review. The A3 method allows PTT employees to follow up on the actions that
are to be taken to eliminate the root causes. In general, this is a good method and it will be compared to
other methods under the criteria that would be suitable for a manufacturing environment similar to PTT.

29
6. Project Data and Analysis
6.1 Case Study Analysis
A random sample of 13 cases was chosen from SharePoint for the purpose of analysis. The cases will be
analysed to find trends, root causes, and the corrective and preventive action that will be suitable. The
IO numbers, responsible department and the date that the IO was raised have been summarised in
Table 3.
Table 3: IOs to be used for case study purposes
The aim of the case studies is to illustrate the application of new techniques on a small scale. The results
will be recorded and recommendations will be made. If the tools are effective on the sample of cases
then the tools may be effective for larger samples.
6.2 Analysis of root cause trends
The following root causes have been obtained from the Quality Assurance Technician at PTT. The root
causes were recently updated and new root causes were added. There was a problem initially with root
causes that were repetitive and unclear to the users of SharePoint. In the revised root causes, this was
rectified. A flow diagram for the manufacturing of a transformer, the windings department and the
active parts department has been attached in Appendix A. The root causes are for the following sections
of the company:
1. large windings and assembly,
Case number IO number Responsible Section Date Raised
1 1971 Production: Insulation 5/26/2011
2 2126 Production: Large winding 8/1/2011
3 2133 Production: Paper lapping 8/3/2011
4 2111 Production: Large winding 7/25/2011
5 2099 Production: Paper lapping 7/19/2011
6 2012 Production: Large winding 7/6/2011
7 1944 Production: Assembly line 5/12/2011
8 1907 Production: Small winding shop 4/19/2011
9 1840 Production: Assembly line 3/28/2011
10 1850 Production: Large winding 3/30/2011
11 1878 Production: Large winding 4/6/2011
12 1754 Production: Small winding shop 2/23/2011
13 2036 Production: Small winding shop 6/21/2011

30
2. medium windings and assembly,
3. small windings and assembly and
4. active parts assembly.
A sample of 100 non-conformances from 2009 and 2010 was taken from SharePoint to be analysed. The
non-conformities were grouped by department, section and the root cause classification. Graphs and
charts were plotted from this information. The IO data was collected at PTT for 12 months in 2010 from
SharePoint. The data was grouped by the root cause classifications that were obtained from PTT. The
main root cause classifications are stated below. The classifications provide an option to evaluate the
root causes that have not yet been assigned by either the originator or the investigator.
1. Not Yet Assigned
2. Customer
3. Engineering
4. Environment
5. Knowledge / Training
6. Machinery /Tools /Equipment
7. Maintenance
8. Man / Human Error
9. Management
10. Material
11. Method / Procedure
12. Plant
13. Quality
14. Safety
15. Supplier
16. Systems
17. Force Majeure
18. Technology
The classifications are further broken down into more specific root causes. A pie chart, Figure 16, has
been plotted with the root cause classifications to see which root cause is the most contributing to the
total root causes.

31
Figure 16: Root causes classifications
From the pie chart above it is clear that the most contributing root cause is human error. This root cause
is one of the least understood root cause. The variation in human performance phenomena has been
discussed in the literature review. The methods for analysing the variation in human will be used to
further analyse the cases. The alarming discovery is that one of the major category of the root causes
are the root causes that have not yet been assigned. This means that there 17% of all IOs found on the
system have no root cause classification. This may be a problem if the root cause analysis was to be
further investigated as the information is incomplete. Recommendations will be made to address this
matter in the following sections.
6.3 Comparison and selection of the RCA tools
The tools and methods mentioned in the literature review have been categorized in Table 4 . The
methods will score under each category and then ranked. The ranking is used as a method of selecting
the best tool and method for RCA. The categories for ranking the methods and tools were obtained from
journals based on comparison of RCA tools (Mahto & Kumar, 2008) and (Doggett, 2005). The categories
that will be used for analysis are as follows:
17%
1%
13%
0%
1%1%
1%
17%3%
9%
12%
7%
7%
0%9%
0% 0% 1%
Root cause breakdownNot Yet Assigned Customer EngineeringEnvironment Knowledge / Training Machinery /Tools /EquipmentMaintenance Man / Human Error ManagementMaterial Method / Procedure PlantQuality Safety SupplierSystems Force Majeure Technology

32
1. the method/tool must define the problem clearly and concisely,
2. all the causal relationships should be defined,
3. the evidence to support the root cause is defined,
4. the causal path to the root causes must be traceable,
5. whether the method has a way to test its logic and accuracy,
6. whether the results from the technique are easy to document,
7. if the technique allows for categorising the root cause,
8. whether the technique is able find the specific root causes,
9. and the tool/method should explain how the solutions prevent the recurrence of the root
cause.
The RCA tools and methods are compared in Table 4. The two highest ranking techniques will be used
for the RCA of the cases.
Table 4: Comparison and ranking of tools and methods
The comparison of the tools and methods yields results that will be used to select the best techniques
that will be used for the analysis of the cases. The results of the RCA will be discussed and
recommendations will be made thereafter.
Method/Tool TypeDefines
Problem
Defines all
causal
relationships
Provides
a causal
path to
the root
causes
Delineat
es
evidence
Shows
how the
solution
prevents
re-
occurren
ce
Easy to
follow
report
Has
mechanis
m for
testing
logic
Indentify
cause
categorie
s
Ability to
find
specific
and
reasonab
le root
cause
Total
Score
Ishikawa Tool yes limited no no no no no yes no 2.5
Pareto chart Tool yes no no no no no no no yes 2
Fault tree Method yes yes yes no yes no no yes yes 6
Affinity diagrams Tool yes yes no no no no no yes yes 4Process failure
mode effects
analysis (PFMEA) Tool yes no limited no limited no yes yes yes 5
Process capability
analysis Tool yes limited no yes no no yes no limited 4
Tree Diagrams Method yes no no no no no no no limited 1.5
5 whys Method yes yes no yes no no no no yes 4Current reality
tree(reality charting) Method yes yes yes yes yes yes yes yes yes 9
Change Analysis Tool yes no no no no no no no limited 1.5
Barrier Analysis Tool yes no no no no no no no no 1
Human Performance
evaluation Method yes yes yes no limited yes no yes yes 6.5
A3 brainstorming Method yes no yes yes no yes no no yes 5

33
The RCA techniques are fundamental for diagnosing problems in a process. In Table 4, the various RCA
techniques have been analysed according to the criteria that have been discussed. The scoring is as
follows:
1. Yes = 1 point
2. No = 0 point
3. Limited = 0.5 points
The scoring method was used and the results showed that the best method is the Reality chart and the
second best method is the human performance evaluation. The least ideal method to be used for the
root cause analysis is the tree diagram according to the criteria that was defined. The reality chart will
then be used to analyse the 13 cases that will be used in the development of a solution.
6.3.1 Reality Charting
The Process of reality Charting consists mainly of seven steps and these have been outlined below:
1. The problem or effect is clearly defined.
2. The question,” why?” is asked to the stakeholders.
3. The answers given by the stakeholders must consist of a condition and an action.
4. The answers that are given are plotted on the chart.
5. The supporting evidence to the causes is added to the chart.
6. The solutions are then examined for the causes and if they are in the control of the stakeholders
then the action plan may be added.
7. All the stakeholders are involved therefore all the responsibilities are allocated during the
analysis.
The software used for reality charting is called RealityCharting version 3 (Apollonian LLC, 2011) and it is
the demonstration version that is downloadable from the website. The process of reality charting begins
with following instructions from the wizard.

34
Figure 17: The wizard from RealityCharting (Apollonian LLC, 2011)
The wizard helps to guide new users with using the software. The first step, as shown in the wizard, is to
define the problem clearly using the guidelines in the menu provided.
Figure 18: The problem definition (Apollonian LLC, 2011)
The preferences may be set by the user to make the problem definition close to reality. The next phase
consists of drawing the reality chart. The chart draws the problem or effect onto the chart then the
users are to insert the root causes and choose whether it is a condition or an action. The user also has
an option to add the supporting evidence as the plotting progresses. If currently there is no supporting
evidence that can be found then a question mark can be placed. The root cause with no supporting
evidence should be avoided as valid root causes until the supporting evidence is added.
Figure 19: The structure of the Reality Chart (Apollonian LLC, 2011)
Once the chart has been drawn, the software tests the correctness of the chart before proceeding to the
next phase. In the next phase the user inputs the possible solutions for each reason that has been
defined in the chart. The solutions are then evaluated against the following criteria:
35
1. If the solution can prevent the re-occurrence of the same problem.
2. Whether the solution stated is in the control of the user or another supportive person.
3. Whether the solution meets goals.
4. If the solution may cause another unacceptable problem.
Once all the criteria for the evaluation of the solution are tested and the correct responses have been
added, the solution is added as a valid solution. The solution may then be assigned to a stakeholder and
the due date is set. A report is then generated by the software and the reality charting process is
complete.
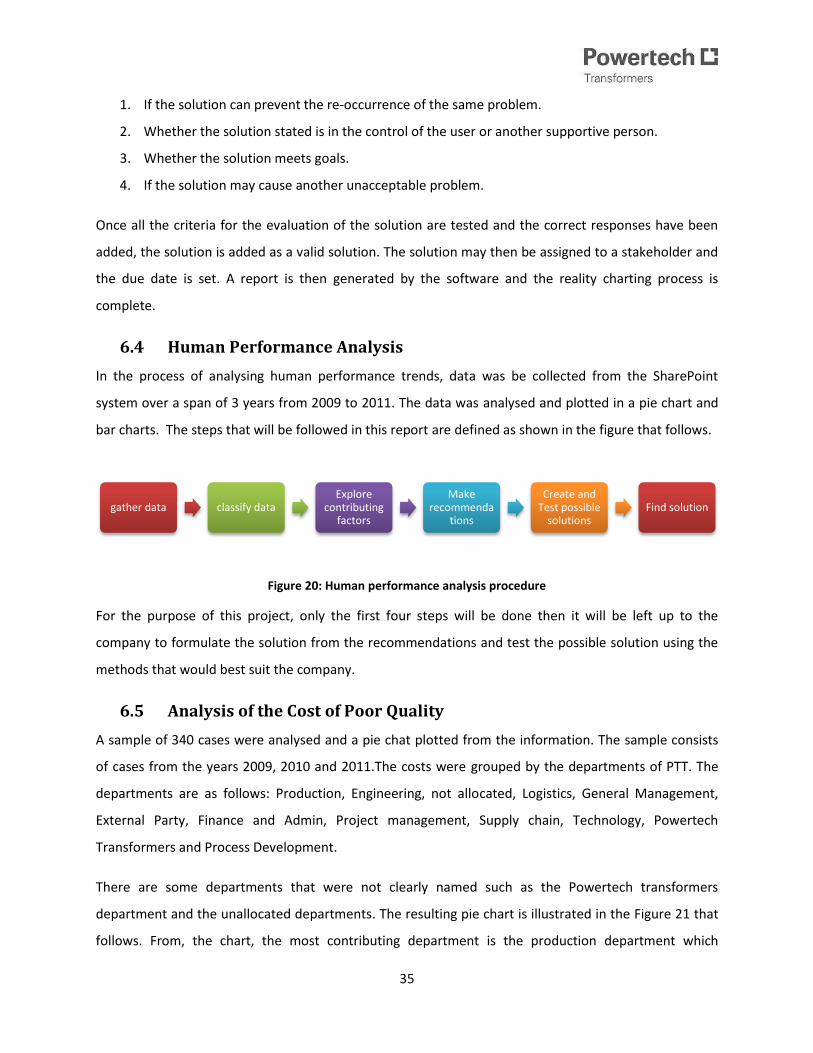
6.4 Human Performance Analysis
In the process of analysing human performance trends, data was be collected from the SharePoint
system over a span of 3 years from 2009 to 2011. The data was analysed and plotted in a pie chart and
bar charts. The steps that will be followed in this report are defined as shown in the figure that follows.
Figure 20: Human performance analysis procedure
For the purpose of this project, only the first four steps will be done then it will be left up to the
company to formulate the solution from the recommendations and test the possible solution using the
methods that would best suit the company.
6.5 Analysis of the Cost of Poor Quality
A sample of 340 cases were analysed and a pie chat plotted from the information. The sample consists
of cases from the years 2009, 2010 and 2011.The costs were grouped by the departments of PTT. The
departments are as follows: Production, Engineering, not allocated, Logistics, General Management,
External Party, Finance and Admin, Project management, Supply chain, Technology, Powertech
Transformers and Process Development.
There are some departments that were not clearly named such as the Powertech transformers
department and the unallocated departments. The resulting pie chart is illustrated in the Figure 21 that
follows. From, the chart, the most contributing department is the production department which
gather data classify dataExplore
contributing factors
Make recommenda
tions
Create and Test possible
solutionsFind solution

36
contributes 39% of the total costs of poor quality. Then the Engineering department follows with a
contribution of 31%. The Engineering department consists of the mechanical and electrical engineering
design section.
Figure 21: Summary of the total COPQ
The pie chart shows the percentages that each department contributes to the total cost of poor quality
recorded on SharePoint. The Production department is divided into 18 other sections as shown the pie
chart in Figure 22. The pie chart was plotted to show the distribution of cost is among the sections of the
production department.
Total Cost Breakdown
Production Engineering Not allocated LogisticsGeneral Management External Party Finance and Admin Project managementsupply chain Technology PTT Blank

37
Figure 22: The cost breakdown of the Production department
The large winding section and the assembly line contribute to 25% of the total costs of poor quality. The
analysis of data is essential for focusing efforts on the sections. The least contributing section is the core
stacking section which virtually contributes 0% to the COPQ. Other similar sections appear to be well
managed and maintained therefore efforts should not be focused on these sections.
6.6 The Quality Audit
The quality audit was conducted in the large windings and assembly, medium windings and assembly,
small windings and assembly, and active parts assembly. The audit procedure was followed and the
audit team consisted of two people. The audit was conducted for the following reasons:
1. to ascertain whether practice is in line with documented instructions,
2. to highlight any shortcomings within an area being audited,
3. and to ascertain to what extent ISO 9001:2008 requirements are met.
The notification was sent to the relevant departments a week prior to the audit. The audit was
conducted in four days i.e. one day for each department.
25%
13%
3%
25%
5%
0%
6%
1%9%
0%0%
0% 2% 1% 4%
7%
0% 0%
PRODUCTION COST BREAKDOWN Prod: Large winding PROD: TANKINGPROD: FABRICATION SHOP PROD: DESPATCHPROD: CORE CUTTING PROD: LINING UP & WELDINGProd: Active Part Assy, tanking & Despatch PROD: OIL PLANTPROD: SMALL WINDING SHOP PROD: ASSEMBLY LINEPROD:CORE STACKING PROD:CORE INSULATION AND WINDINGSPROD:GRINDING AND CLEANING PROD: INSULATION

38
The Auditing Technician inspected documentation and observed the work that was performed. The
auditor interviewed some employees to test whether the employees had insight to the work that was
performed. When an error was found, the auditor investigated the error further to try and resolve the
matter immediately. The auditor furthermore asked the foremen for their insight about certain errors.
The findings were written down in a notebook. The PTT formal Auditing Procedure and the formal Audit
report have been attached to Appendix C. The findings of the Audit were then documented in a report.
The findings will be presented to all relevant stakeholders and steps will be taken to address the
findings. The findings will be analysed in this report and recommendations will be made.
7. Development of the solution
7.1 Root cause analysis
The root cause cases that were collected have been further analysed. The aim of the RCA is to observe
and analyse the trends of the IO cases. In so doing the Quality Department may realise that the RCA
methods may not be efficient. The cases have been sorted under the following categories:
1. The IO status
This indicates the current state of the IO. There are mainly six states that an IO may be in and
they are shown in Figure 15.
2. The Problem description summary.
The problem that was obtained from the cases have been summarised to make it simpler. The
problem descriptions tend to be long and detailed but this is not necessary for analysis.
3. The summary of the corrective action.
The corrective action that was also obtained from SharePoint has been summarised. The
corrective actions have been discussed in detail in the literature summary.
4. The summary of the preventive action.
It is similar to the summary of the corrective action but it addresses the measures that will be
taken to prevent future re-occurrence of the non-conformance.
5. The Root Cause classification and root cause.
Each IO is associated to a root cause and the classification of the selected root cause. The
classifications of the root causes were discussed in the analysis of root causes.

39
PTT uses the A3 brainstorming method to address the IOs that have high frequencies of occurrence and
for high cost non-conformances. This technique was recently (2 years ago) implemented in the Quality
Department and has been discussed in the literature review. The method is still relatively new to PTT
and the employees are attempting to adjust to the change. The method and the other methods in this
report are suitable for a manufacturing environment. The A3 method is currently used by PTT used as a
tool to determine the preventive actions for IOs.
Table 5: The detailed IOs
Most of the IOs collected are verified and closed. Once an IO has been verified and closed then no
further investigation is required to be done on the IO. The cases were also analysed to see the severity,
chance of re-occurrence, risk priory and the type of event. This information was also obtained from
IO Number IO statusProblem Description
Summary
Summary of
Corrective Action
Summary of
Preventive Action
Root Cause
ClassificationRoot Cause
2036 IO Accepted Damaged winding Winding replaced
Supervisor, inspectors
are to verify sigma cards
Man/ Human
Error Lack of attention
1754
IO submitted for
verification
Winding cylinder
undersize Ribs reduced
Diameter
measurements are to be
verified before transfer
to Active Part
Man /Human
Error
Process incorrectly
followed
1878
IO Verified and
closed Winding undersize
Winding reduced as per
deviation request
Diameter
measurements are to be
verified before transfer
to Active Part
Method/
Procedure
Procedure
Inadequate
1840
IO Verified and
closed Windings are oversize Windings reduced to fit
A3 investigation in
progress
Man/Human
Error Inadequate training
1850
IO Verified and
closed
Cylinder could not fit over
windings
Production must not
over-rule quality
Quality must approve of
the product Management
Process incorrectly
followed
1907
B winding undersize, D
winding oversize Deviation requested
A3 investigation in
progress Material
Procedure
Inadequate
1944
IO Verified and
closed D winding undersize Deviation requested
A3 investigation in
progress Material
Process incorrectly
followed
1971
IO Verified and
closed
Former cylinder
undersize Deviation requested
Avoid the use of poor
quality material for
former cylinders Quality Incorrect material
2012
IO Verified and
closed
Copper shavings on the
windings
Emphasize method
provision during
cleaning
Method provision to be
followed by operators
Method/
Procedure
Process incorrectly
followed
2126
IO submitted for
verification Disc joints unacceptable
New conductor used for
the discs
Paper-lapping machines
to be caliberated
Man/ Human
Error
Bad packaging
marking
2099 IO Accepted
Conductor insulated
incorrectly
Send paper back to
paper-lapping to be re-
covered
Supervisors are to be
trained for the
department's products
Knowledge/
Training
Process incorrectly
followed
2133 IO Allocated Shortage in conductor none taken yet none taken yet
Not yet
assigned Not yet assigned
2111
IO submitted for
verification
Former cylinder quality
below specification
New cylinders ordered
to replace rejected
ones
A3 investigation in
progress
Method/Proce
dure
Supplier late
delivery
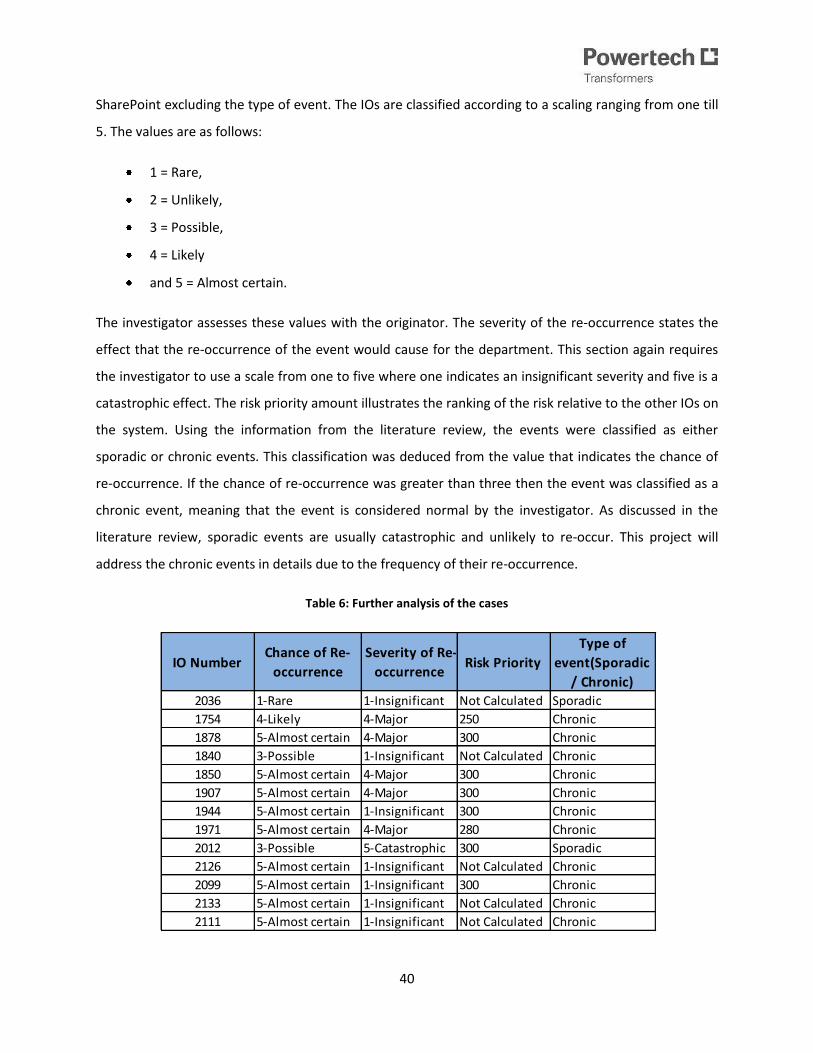
40
SharePoint excluding the type of event. The IOs are classified according to a scaling ranging from one till
5. The values are as follows:
1 = Rare,
2 = Unlikely,
3 = Possible,
4 = Likely
and 5 = Almost certain.
The investigator assesses these values with the originator. The severity of the re-occurrence states the
effect that the re-occurrence of the event would cause for the department. This section again requires
the investigator to use a scale from one to five where one indicates an insignificant severity and five is a
catastrophic effect. The risk priority amount illustrates the ranking of the risk relative to the other IOs on
the system. Using the information from the literature review, the events were classified as either
sporadic or chronic events. This classification was deduced from the value that indicates the chance of
re-occurrence. If the chance of re-occurrence was greater than three then the event was classified as a
chronic event, meaning that the event is considered normal by the investigator. As discussed in the
literature review, sporadic events are usually catastrophic and unlikely to re-occur. This project will
address the chronic events in details due to the frequency of their re-occurrence.
Table 6: Further analysis of the cases
IO NumberChance of Re-
occurrence
Severity of Re-
occurrenceRisk Priority
Type of
event(Sporadic
/ Chronic)
2036 1-Rare 1-Insignificant Not Calculated Sporadic
1754 4-Likely 4-Major 250 Chronic
1878 5-Almost certain 4-Major 300 Chronic
1840 3-Possible 1-Insignificant Not Calculated Chronic
1850 5-Almost certain 4-Major 300 Chronic
1907 5-Almost certain 4-Major 300 Chronic
1944 5-Almost certain 1-Insignificant 300 Chronic
1971 5-Almost certain 4-Major 280 Chronic
2012 3-Possible 5-Catastrophic 300 Sporadic
2126 5-Almost certain 1-Insignificant Not Calculated Chronic
2099 5-Almost certain 1-Insignificant 300 Chronic
2133 5-Almost certain 1-Insignificant Not Calculated Chronic
2111 5-Almost certain 1-Insignificant Not Calculated Chronic

41
The majority of the cases that were selected can be classified as chronic events. This is important for the
assessment of the QMS as the chronic cases have lower costs but due to the frequency at which they
occur they may contribute to large amounts in the costs of poor quality. A graph has been plotted to
show the frequency of both kinds of events.
Figure 23: sporadic events compared to chronic events
The occurrences of chronic events are much greater than sporadic events. This implies that the errors
that are considered normal in the QMS may be the cause of inefficiency.
8. Results
8.1 Results from the Quality Audit
The audit findings were obtained from the Quality Audit that was performed by the Quality Technician
on the 16th of August 2011. The details and the audit procedure have been addressed during the analysis
phase. The findings of the audit were recorded in the Audit report that has been attached to Appendix
C. As discussed in the literature study, the findings were analysed and refined for the purpose of this
report. The R-P matrix was used to classify the findings so that recommendations could be made from
the findings. The findings were organised and similar findings were grouped together.
0
2
4
6
8
10
12
sporadic chronic
Nu
mb
er o
f ca
ses
Classification of IOs

42
Table 7: The R-P matrix for the audit findings
The matrix shows only a lesser number of findings (15 findings) when compared to the 25 findings that
were recorded in the Audit Report. The findings were group together as follows:
1. Finding 3.2 was similar to the finding 3.18 because they both address the problem of jobs that
are not marked with tags.
2. Finding 3.4 and 3.8 are grouped together because they are about supervisors not signing the
sigma cards for various jobs.
No. Findings
Design not
adequate
for control
R1
Not
impleme
nted
R2
Does not
meet
objectives
R3
Cost
P1
Opportunit
y lost P2 Risk P3 Comments
3.1
Red Triangle procedure was not
available, on request, during the audit.
Risk of incorrect procedure
followed
3.2
Red triangle cards were not placed on
jobs. Risk of the job being misplaced
3.3
Checklist does not have any business
(PTT) identification . Risk of incorrect checking
3.4
Sigma cards not signed off by the
Supervisors. Risk of no inspection performed
3.5
The bottom leads of C phase D/winding
got damaged while rotating winding
platform during winding. Rework costs
3.6
Stack Iron as well as disc clamps(tools)
not available during the winding. Risk of damange to the clamps
3.7
Unmarked trolley with material was left
on the walk way, not attended too
during the whole shift.
Cost to trace and remarking. The
risk of use
3.10 Travelling files not well maintained. Control risk
3.11
Quality Objectives have not being
adequately addressed within the
audited area.
Risk that the product will not
meet quality objectives
3.12
The vertical winding machines are full of
dust on the top and material found on
the floor with dust. Cost of cleaning
3.13
Some trolleys of have broken collars
and rings mixed with good material.
Cost of labour to sort the
material
3.14
Sigma cards1ZXX209808 and 1ZXX209845
have common name
Risk of incorrect use of
procedures
3.16
The sigma cards for clack have faded
away and are found in various jobs such
as travelling files
Increased risk of error during
production
3.22
Certificate of calibration not available
and does not indicate expiry date. Risk of incorrect measurements
3.25
The leads of B and C Windings for #368
had carbon and were already crimped, C
winding had a very sharp point just
about 30mm below the ferrule Risk of product failure
Reason/Cause Pain/Effect
43
3. Findings 3.10, 3.15, 3.17, 3.19, 3.20, 3.21, 3.23 are grouped as they are about the poor
management of travelling files and procedures.
4. Findings 3.12 and 3.24 both state that the housekeeping and maintenance of materials is
insufficient.
5. Finding 3.22 and 3.26 focuses on the calibration of machines.
By grouping the similar findings, the risk of repetition is largely reduced. The R-P matrix results reveal
most findings were a result of the improper implementation of the procedures. This means that the
quality system is defined well but the procedures are not being implemented correctly. The other
majority of the findings indicate that the controls for the QMS are insufficient for the system. This
implies that the QMS of PTT must be evaluated to identify the gaps in the system. There are processes
that are insufficiently defined and the methods of controlling several processes are also insufficient. An
example of this is the control of the travelling file which is required to be maintained but there are
limited ways that this is ensured. In an attempt to assess the various features of the QMS, this is an
important point that can be deduced from the R-P matrix.
The other trend that was observed is that the majority of the Audit findings arise from the Large
windings sections. The table in Appendix C below shows the findings and the respective departments.
8.2 Results from the Root Cause Analysis
The reality chart selected after an analysis according to specific criteria. The method of constructing a
reality chart has been thoroughly discussed in the root cause tool selection section. Firstly, to make the
reality charting easier, the cases that were similar were grouped together. This was done to avoid
repetition of the reality charts. The grouping was done for similar IOs as follows:
1. Type 1: Windings or Former cylinders that were found to be under/oversized. IO numbers 1754,
1840, 1907, 1850, 1944, 1971 and 2111.
2. Type 2: Windings that were damaged during manufacturing. IO number 2036.
3. Type 3: The disc joints that were found to be unacceptable. IO number 2126.
4. Type 4: A conductor that was used incorrectly therefore leading to shortage of a conductor. IO
numbers 2033 and 2099.
Trial software was obtained from the website of Reality Charting Software (Apollonian LLC, 2011)) and
was used for a more accurate analysis of root causes. The software was used to make the case studies

44
more accurate and to add supporting evidence. The figures below only show a portion of the results
from RealityCharting and the complete reality chart has been included in Appendix D along with the
suggested solutions report. The resulting RCA from the 4 types of cases resulted in the following reality
chart diagrams.
Figure 24: Reality Chart of Type 1 IOs
The results of the root causes were similar for the four types of cases. In the Reality chart the root
causes have been identified using the criteria that were defined in the RCA section. The results from
Type 1 IOs yield the following:
Action Root Causes -Material wasted -Incorrect following of procedures
Conditional Root Causes
-Low quality of material used -Incorrect labels used -Low quality printing -Handwriting not legible

45
-Un-calibrated equipment not reported
Figure 25: Reality Chart for Type 2 IOs
The results for Type 2 IOs that were defined as the windings that failed due to over-pressing. The Reality
charting process yielded the following results:
Action Root Causes -Ignorance from the operators -Incorrectly recorded forces -Handwriting not legible
Conditional Root Causes
-Low employee morale -Large number of delays -Production errors -Formulas not readily available -Procedure files not readily available -Lack of procedure file responsibilities -Formulas used incorrectly

46
Figure 26: Reality Chart for Type 3 IO
The Type 3 IO yielded the following results
Action Root Causes -Insufficient supervision Conditional Root Causes
-Low employee morale -No accountable person -Irregular housekeeping -Irregular inspection

47
Figure 27: Reality Charting for Type 4 IO
Action Root Causes -Insufficient supervision Conditional Root Causes
-No accountable person for the file -Low staff morale -Insufficient training -Packaging incorrectly marked
The trends that have been observed in the case studies were that there appears to be a repetition of
conditional root causes. The repetition may be caused by the similar nature of the non-conformities or
the lack of evidence to support exploring other categories of root causes. The main root causes are as
follows:
1. Insufficient training,
2. insufficient supervision,
3. low employee morale,
4. no accountability or responsibility for certain tasks and
5. the incorrect marking of materials.
The main recommendation is that PTT must assess these root causes in more detail in an attempt to
eliminate them.

48
8.3 Results human performance analysis
The IOs obtained from SharePoint we analysed. A sample of 120 cases was taken from IOs over three
years i.e. 40 IOs from 2009, 40 IOs from 2010 and 40 IOs from 2011. The IOs were then filtered to find
the IOs that were caused by human error. From the 120 IOs collected, 23 were caused by human error.
It can then be estimated that 20% of all IOs are caused by the different categories of human error as
shown in the diagram that follows. The categories of human error under the Quality Assurance
Department are as follows:
1. QA - Missing / Incomplete Information,
2. QA - Drawing Interpreted Incorrectly,
3. QA - Lack of Attention,
4. QA - Process Incorrectly Followed,
5. QA - Inadequate Handling / Transport,
6. QA – Misplaced Stock,
7. QA: Engineering Design,
8. And blank entries.
Figure 28: Human error categories
0
1
2
3
4
5
6
QA - Missing / Incomplete Information
QA - Drawing Interpreted Incorrectly
QA - Lack of Attention
QA - Process Incorrectly Followed
QA -Inadequate Handling /
Transport
QA -Mislocated
Stock
QA: Engineering
Design
Blank
Nu
mb
er
of
occ
ure
nce
s
Human error categories

49
The blank category IOs only classified the root cause as human error but the investigator and originator
did not specify the category of human error. The IOs were also investigated for human error trends over
three years.
Figure 29: Human error comparison over three years
Due to the inconsistency in the capturing and recording of IOs, there are many cases observed in 2011
that have no specific root cause added to them .This makes it difficult to find the trends if the
information is incomplete therefore extra cautions are to be taken by the investigators and the
originators during the completion of the IO. The highest and the most re-occurring trends in Figure 29 is
that the drawing is regularly interpreted incorrectly. The least occurring of incidents are the inadequate
transport and engineering design. The incident of inadequate transport seems to have been
permanently eliminated by a corrective and a preventive action. The most constant IO cause is that the
process was followed incorrectly; this may mean that this problem is seen as normal and that it does not
need immediate attention. In the recommendations the following human errors have been addressed:
1. The blank root cause,
0
1
2
3
4
5
QA - Missing / Incomplete Information
QA - Drawing Interpreted Incorrectly
QA - Lack of Attention
QA - Process Incorrectly Followed
QA -Inadequate Handling / Transport
QA -Mislocated
Stock
QA: Engineering
Design
Blank
Nu
mb
er
of
occ
ure
nce
s
Human error comparison
2009
2010
2011

50
2. drawing interpreted incorrectly,
3. missing or incomplete information and
4. the process incorrectly followed.
The trend of the blank root causes has been encountered in this section for 2011. The possibilities
for such trends are as follows:
1. The investigators and originators have a limited time to complete the IOs in time.
2. The IOs are checked for completeness at the end of the year and throughout the year they
are left incomplete.
3. There is no time limit set between the time that the originator raises an IO and closing date
of an IO.
9. Key performance indicators (methods to testing)
In this section, the current state of the QMS will be analysed using the performance indicators that were
obtained from the Key Performance Indicators (KPI) library (Mirror42, 2004-2011). Currently there are
no clearly defined KPIs for PTT and by defining the indicators on a dashboard would make the
maintenance of the system easier. The KPIs are obtained from the balanced scorecard as shown in
Figure 30. The indicators are based the categories shown in the scorecard. The KPIs have been defined
under each perspective on the Balanced Scorecard.

51
Figure 30: Balance scorecard categories (Kasselman G, 2011))
Financial Perspective
1 Cost of poor Quality are the costs incurred by PTT due to the non-conformances. These costs
have been discussed in-depth in the literature review.
2 Cost due to delays are the costs that are encountered by PTT due to the number of delays in the
production system
Internal Business Processes
1 Number of certifications obtained includes certificates such as the ISO 9001 and ISO 14000
certificates that a company receives accreditation.
2 Percentage of efficiency of the process measures the overall efficiency of the system. This is a
comparative indicator as the efficiency of the systems will continuously be measured.
3 Percentage of Products delayed due to non-conformances. This percentage reflects the time
used for rework and solving all the non-conformances of an item.
Learning and Growth
Financial Perspective
1.Cost of Poor Quality.
2.Cost due to Delays.
Internal business processes
1.Number of certifications obtained.
2.Percentage of effeciency of the process.
3.Percentage of Products delayed due to non-conformances.
4.Summary of the Root causes
Learning and growth
1.Number of training hours per employee.
2.Number of certifications per employee.
Customer perspective
1.Number of customer complaints.
2.Number of products rejected by the customers.
3.Percentage of customers lost every year.
Quality
52
1 Number of training hours per employee for the full-time employees.
2 Number of certifications per employee.
Customer Perspective
1 Number of customer complaints this also includes the number warranty claims after the delivery
of the products.
2 Number of products rejected by the customers.
3 Percentage of customers lost every year
The indicators are methods of testing the efficiency of new techniques in a system. The indicators may
be used by PTT the tools suggested in this report will be implemented in the Quality Department.
Production data containing 70 products in the main assembly line was obtained for 22nd of October
2010. From the sample of 70 points, 58 products were late and 12 were early or on-time. The average
was calculated as 5.3 weeks, this implies that the average product is late by 5.3weeks i.e. 26.5 days. A
dashboard is a platform where key performance indicators may be represented in their categories. A
dashboard has been created for the purpose of observing the performance of the QMS system. The
dashboard will summarise the performances and changes in some of the KPIs. Screenshots of the
Dashboards have been added to Appendix E.
10. Recommendations
At the end of the analysis of the different aspects of QMS the following recommendations could be
made. With regards to the trend analysis that was done for the root causes, it is clear from the results
that production and engineering are the largest contributors to the root causes. The following
recommendations were made from the results:
1. According to the first objective, the trends in the root causes were analysed graphically
represented and the Reality Charting Method was selected as the best RCA method that would
be suitable to the PTT environment. RealityCharting is the recommended method to be used for
RCA but further analysis must be done to test this method. The trends from the root cause
analysis have been extensively discussed in the results section of the report.
2. For the second objective the trends in the costs of poor quality were graphically represented
and the trends were found from the data obtained from SharePoint. The recommendation is for
PTT to adopt a Benchmarking strategy to manage the COPQ. This means that PTT should test the

53
relative costs of poor quality with leading worldwide and similar companies like Rotek. This
would set the minimum in the performance and further strategies can be discussed to manage
the improvements to be made. A further recommendation would be that due to the complex
nature of the products (transformers) the best cost method is the P-A-F model. The challenge is
to find the shape of the COPQ curve and from there an optimal costs curve can be obtained. An
example of the cost curve is as follows
3. The results of the analysis of human performance variation highlight important aspects that
need to be further addressed by the company. It is recommended that the company re-
evaluates the training process and the frequency of the training provided to the operators and
supervisors. The evaluation of the human performance requires that PTT further investigate the
underlying causes of human performance variation such as
a. Causes of low staff morale.
b. Errors in the monitoring of the operators.
c. Errors related with tools and equipment and the maintenance of them.
d. Errors in the staffing system such as staff sizes and the method of staffing.
e. Errors in the supervision procedures that lead to insufficient supervision.
4. The common root causes that were identified in the RCA must be categorized and methods on
how to address the root causes must be explored in an attempt to eliminate the causes. The
possible solutions to the root causes have been added to Appendix D.

54
5. The Quality Audit yielded results that would be useful in finding the major problem section in
the Production department. The recommendation for the Quality Audit Process is that there
should be regular follow up meetings to ensure that the findings are investigated thoroughly
and to avoid the re-occurrence of the findings.
6. A dashboard was created for the purpose of observing the key performance indicators which
were defined and customised for PTT. The dashboard should be regularly maintained to find the
trends of the data that is obtained from SharePoint.
11. Conclusion
The results of the project has shown that the there are aspects of the QMS that require immediate
attention before further losses occur. The importance of preventive action was also highlighted as the
reactive methods may have a higher costs associated to it. The QMS is a system that requires constant
assessment and it is fundamental that companies invest time and resources to reduce the occurrences
of non-conforming products. The ultimate costs of an inefficient QMS may be the loss of customers and
to recover from such losses takes more effort therefore it is better to address the loss of quality in the
final product. This report assessed a small portion of the QMS, it is now the responsibility of PTT to
assess and keep track of the other features of the QMS.
55
Bibliography
Cost of Poor Quality. (2011). Retrieved September 2, 2011, from Wikipedia:
http://en.wikipedia.org/wiki/Cost_of_poor_quality
Quality Audit. (2011). Retrieved September 1, 2011, from Wikipedia:
http://en.wikipedia.org/wiki/Quality_Audit
AaronscreationsCompany. (2008-2011). Problem solving templates. Retrieved August 2011 31, 2001,
from Chart it now: templates, charts and templates: http://www.chartitnow.com
Andrea Schiffauerova, V. T. (2006). A Review of Research on Cost of Quality Models and Best Practices
(Vol. 23). (D. o. Engineering, Ed.) Montreal, Canada.
Anthony Manos, Ptofero Inc. (2009). Introduction to A3 Brainstorming: problem solving through people.
2009 Lean six sigma conference (pp. 4-24). Chicago: ASQ.
Apollonian LLC. (2011). Reality Charting . Retrieved September 23, 2011, from Reality Charting :
www.realitycharting.com
Arter, D. R. (1947). Quality Audits for Improved Performance. ASQC Quality Press.
Beercroft, Dennis Inc. (n.d.). Cost of Quality, Quality Planning and tyhe Bottom line. Retrieved
September 3, 2011, from http://www.g-dennis-beercroft.ca
Catherine Soanes, S. H. (Ed.). (2006). Compact Oxford Dictionary for University and college students.
New york: Oxford University Press.
Doggett, A. M. (2005). Root Cause Analysis:A Framework for Tool Selection. 12 number 4. ASQ.
F. Merle Bland, J. M. (1998). Quality costing of an administrative process (Vol. 10). (M. U. Press, Ed.)
TQM magazine.
Gitlow, H. S., Oppenheim, A. J., Oppenheim, R., & Levine, D. M. (2005). Quality Management (3rd Edition
ed.). New York: McGraw-Hill International Edition.
Harrington, H. J. (1999 ). Performance improvement: a total poor-quality cost system (Vol. 11). MCB
University Press.

56
Heuvel, J. J. (2004, July). Root Cause Analysis For Beginners. Quality Progress, 46-48.
I.A Bechmerhagen, H. S. (2004). On the effectiveness of quality management system audits. 16, 1, 14-25.
TQM Magazine.
ISO 9001:2008. (n.d.). Quality management systems-Requirements. (4th Edition). ISO.
Kasselman G, M. A. (2011, August 31). Support Function: Quality. Pretoria, South Africa.
L.Gano, D. (2007). Comparison of common root cause analysis tools and methods. In D. L.Gano, Apollo
Root cause analysis: A new way of thinking (3rd Edition ed.).
Latino, R. J. (2007, April). Root Cause Analysis VS.Shallow Cause Analysis. In R. J. Latino, Industrial
Maintenance & Plant Operation. Advantage Business Media.
Latino, R. L., & Latino, K. C. (2002). Root cause Analysis:Improving Performance for Bottom-Line Results
(2nd Edition ed.). CRC Press.
Mahto, D., & Kumar, A. (2008). Application of root cause analysis in improvement of product quality and
productivity. Journal of Industrial Engineering and Management, 16-53.
Mirror42. (2004-2011). Suggested KPIs. Retrieved September 6, 2011, from KPI Library:
http://kpilibrary.com/suggestions
Northrop Grumman Corporation. (2006). Flow Charts including process mapping. Retrieved 9 6, 2011,
from https://oasis.northgrum.com/general/cpa_rca_tools.htm
Russel, J. P., & Regel, T. L. (2000). After the Quality Audit: Closing the loop on the Audit Process (2nd
Edition ed.). Milwaukee, Wisconsin: ASQ.
Taylor, R. R. (2011). Operations management. Retrieved September 3, 2011, from
www.bookfiesta4u.com
Webfinance Inc. (n.d.). Audit definitions. Retrieved Septemeber 1, 2011, from Investorwords.com:
www.investorwords.com/324/audit.html

57
Appendix A
Figure 31: Product manufacturing Process
Figure 32: Winding manufacturing process
Small and Large Winding Manufacturing
Winding DryingWinding
Packaging an Storage
Insulation shopInstalling
conductor on harness frame
Insulation shop
Core Cutting Shop
Tank Fabrication
Shop
Core Assembly Shop
Paint shops
Active Part Assembly
Drying of Active Part

58

59
Figure 33: Manufacturing process for Active Parts department
Win
din
g S
ho
p
Win
din
gs
req
uir
ed
as
pe
r
Pro
du
cti
on
Pla
n
Ins
ula
tio
n S
ho
p
Ha
rna
ss
re
qu
ire
d
as
pe
r
Pro
du
cti
on
Pla
n
Ch
ec
k s
ign
ed
off
Sig
ma
Ca
rd
AP
In
sp
ec
tor
Ch
ec
k s
ign
ed
off
Sig
ma
Ca
rd
AP
In
sp
ec
tor
1Z
XX
20
9 8
45
AN
D
Ins
ula
tio
n, p
res
s
su
pp
ort
s, y
ok
e
bo
lt in
su
lati
on
etc
. is
pu
t in
pla
ce
Op
era
tor
Co
re S
tac
kin
g
Co
re r
eq
uir
ed
as
pe
r
Pro
du
cti
on
Pla
n
Pla
ce
co
re w
ith
bo
tto
m
ins
ula
tio
n o
n a
n
alig
ne
d b
as
e
Op
era
tor
Alig
n o
pe
nin
gs
of
co
re a
nd
en
d
ins
ula
tio
n
Op
era
tor
Re
mo
ve
to
p c
ore
cla
mp
s
Op
era
tor
Ap
ply
AS
EC
ON
D
wh
ere
ap
plic
ab
le
Op
era
tor
Ch
ec
k b
ott
om
lin
ing
-up
&
ins
ula
tio
n a
s p
er
dra
win
g
AP
In
sp
ec
tor
1Z
XX
20
9-8
15
CP
1
As
se
mb
le
win
din
gs
on
th
e
co
re
Op
era
tor
No
te 1
Ch
ec
k t
op
lin
ing
-
up
(a
lig
nm
en
t o
f
rib
s +
du
cts
are
op
en
)
T-I
ns
pe
cti
on
1Z
XX
20
9-8
15
CP
2
Mo
un
t to
p
ins
ula
tio
n (
top
en
d s
tac
ks
) a
nd
co
re c
lam
ps
Op
era
tor
Ap
ply
as
se
mb
ly
pre
ss
ure
to
th
e
AP
as
sp
ec
ifie
d
Op
era
tor
Pla
ce
me
nt
of
top
yo
ke
in
su
lati
on
an
d c
ore
cla
mp
ins
ula
tio
n
Op
era
tor
Sta
ck
To
p y
ok
e
Op
era
tor
N
Ra
tio
Te
st
@
50%
of
top
yo
ke
sta
ck
ing
Te
st
Ba
y
AC
TIV
E P
AR
T A
SS
EM
BL
Y
PR
OC
ES
S
PF
D-Q
-12
3
1 0
Co
mp
lete
sta
ck
ing
& c
ore
cla
mp
tig
hte
nin
g
Op
era
tor
Fit
sh
ield
s,
fla
sh
gu
ard
s &
ea
rth
str
ips
Op
era
tor
AN
D
Ch
ec
k s
ign
ed
off
Sig
ma
Ca
rd
AP
In
sp
ec
tor
1Z
BA
20
8 2
18
??
?
Fit
ha
rne
ss
to
ac
tiv
e p
art
Op
era
tor
Ch
ec
k t
ap
-
ch
an
ge
r
alig
nm
en
t
dim
en
sio
ns
wit
h
AP
la
yo
ut
drw
’sO
pe
rato
r
Co
mp
lete
all
rele
va
nt
join
ts
Op
era
tor
Me
as
ure
ph
as
e
res
ista
nc
e a
nd
co
mp
are
re
su
lts
to b
e w
ith
in
tole
ran
ce
AP
In
sp
ec
tor
Cle
an
Ac
tiv
e
Pa
rt
Op
era
tor
1Z
XX
20
9-8
15
CP
3
Me
as
ure
co
re
res
ista
nc
e &
pe
rfo
rm a
n
ins
ula
tio
n t
es
t
AP
In
sp
ec
tor
1Z
XX
20
9-8
15
CP
4
Re
vie
w
AP
de
fec
t lis
t
an
d c
orr
ec
t
ide
nti
fie
d f
au
lts
Op
era
tor
Re
qu
es
t
T-I
ns
pe
cti
on
fro
m A
P
Ins
pe
cto
r
Op
era
tor
Arr
an
ge
T-i
ns
pe
cti
on
AP
In
sp
ec
tor
Co
nd
uc
t A
P
T-I
ns
pe
cti
on
Ins
pe
cto
r +
De
sig
n
+ O
pe
rato
r
1Z
XX
20
9-8
16
Co
mp
lete
Sig
ma
Ca
rd a
nd
ob
tain
sig
no
ff f
rom
De
sig
ne
rs
AP
In
sp
ec
tor
Ha
rne
ss
Ma
nu
fac
ture
Pro
ce
ss
Ins
ula
tio
n S
ho
p
Co
re
Ma
nu
fac
ture
Pro
ce
ss
Co
re S
tac
kin
g
Win
din
g
Ma
nu
fac
ture
&
Dry
ing
Pro
ce
ss
Win
din
g S
ho
ps
No
tes:
1)
Ins
tall b
ott
om
me
ch
an
ica
l w
ind
ing
s
up
po
rt f
ram
e w
he
re r
eq
uir
ed
2)
Ph
as
e r
es
ista
nc
e v
alu
es
to
be
co
mp
are
d
wit
h E
lec
tric
al O
rde
r S
pe
cif
ica
tio
n. V
alu
e t
o
be
re
co
rde
r o
n A
cti
ve
Pa
rt R
es
ista
nc
e
Da
tab
as
e f
or
sta
tis
tic
al p
urp
os
es.
3)
Te
st
all f
ibre
op
tic
pro
be
s b
efo
re
as
se
mb
ly o
n A
cti
ve
Pa
rt, a
fte
r p
res
sin
g,
be
fore
an
d a
fte
r V
ap
ou
r P
ha
se
.
Ins
ula
tio
n S
ho
p
Ac
tiv
e P
art
Co
mp
lete
d
1Z
XX
20
9 ?
??
Dry
ing
of
Ac
tiv
e P
art
Va
po
ur
Ph
as
e
Re
vD
es
cri
pti
on
Da
teA
pp
v
Re
v
Pa
ge
Le
ge
nd
:
Ac
tiv
ity
blo
ck
Ex
tern
al P
roc
es
s b
loc
k
Su
b-p
roc
es
s b
loc
k
Tri
gg
er
or
en
d s
tate
blo
ck
Qu
ality
ch
ec
k b
loc
k
Ac
tiv
ity
Re
sp
on
sib
ilit
y
Do
cu
me
nta
tio
n
A3
FA B C D E
FA B C D E
12
34
56
78
12
34
56
78
Re
qu
es
t R
ati
o
Te
st
fro
m T
es
t
Ba
y
Su
pe
rvis
or
Cu
sto
me
r
Ins
pe
cti
on
req
uir
ed
?
Arr
an
ge
Cu
sto
me
r
Ins
pe
cti
on
Pro
jec
t M
an
ag
er
Co
nd
uc
t A
cti
ve
Pa
rt
Ins
pe
cti
on
Ins
pe
cto
r +
Op
era
tor
+
Cu
sto
me
r
1Z
XX
20
9-8
15
??
Co
mp
lete
Sig
ma
Ca
rd a
nd
ob
tain
sig
no
ff f
rom
Cu
sto
me
r
AP
In
sp
ec
tor
Y
No
tify
re
lev
an
t
Pro
jec
t M
an
ag
er
of
ac
tiv
e p
art
co
mp
leti
on
AP
In
sp
ec
tor
XO
R
N
AN
D
All d
raw
ing
s
av
aila
ble
fo
r
as
se
mb
ly
En
gin
ee
rin
g
AC
TIV
E P
AR
T A
SS
EM
BL
Y
PR
OC
ES
S
PF
DP
D0
02
01/1
DRAFT
0
Fir
st
Iss
ue
JJ
J
10-2
01
0
PF
DP
D#
##
PF
DP
D0
04
PF
DP
D#
##
PF
DP
D#
##
No
te 2
Mo
ve
to
Co
re
Ma
nu
fac
turi
ng
Ch
ec
k
ap
plic
ati
on
of
AS
EC
ON
D t
ap
e
ac
co
rdin
g t
o
dra
win
gs
AP
In
sp
ec
tor
1Z
XX
20
9-8
15
CP
1
Cu
sto
me
r
Ins
pe
cti
on
req
uir
ed
?
Arr
an
ge
Cu
sto
me
r
Ins
pe
cti
on
Pro
jec
t M
an
ag
er
Co
nd
uc
t A
cti
ve
Pa
rt
Ins
pe
cti
on
Ins
pe
cto
r +
Op
era
tor
+
Cu
sto
me
r
1Z
ZA
46
0 8
80-#
##
Co
mp
lete
Sig
ma
Ca
rd a
nd
ob
tain
sig
no
ff f
rom
Cu
sto
me
r
AP
In
sp
ec
tor
Y
No
tify
re
lev
an
t
Pro
jec
t M
an
ag
er
of
Ac
tiv
e P
art
co
mp
leti
on
AP
In
sp
ec
tor
XO
R
N
Ap
In
su
lati
on
Ins
ula
tio
n s
ho
p
PF
DP
D0
04
Co
re s
et-
up
(F
it
co
mm
on
sp
ac
er
rin
gs
)
Op
era
tor
Cle
an
ep
ox
y
fro
m le
ad
s
(Ex
tern
al
pro
ce
ss
)
Op
era
tor
CT
C c
on
du
cto
r
us
ed
?
Y
XO
R
Me
as
ure
ra
tio
an
d c
om
pa
re t
o
tole
ran
ce
Su
pe
rvis
or
1Z
XX
20
9-8
15
CP
3
Su
pe
rvis
or
req
ue
st
tes
t
bo
ard
to
co
nd
uc
t
rati
o t
es
t
Co
nn
ec
tio
n S
igm
a
Ca
rd?
?
Ins
ula
tio
n s
ho
p
AP
In
su
lati
on
req
uir
ed
as
pe
r
Pro
du
cti
on
pla
n
Ch
ec
k s
ign
ed
off
Sig
ma
Ca
rd
AP
In
sp
ec
tor
1Z
XX
20
9 ?
??

60
Appendix B
Table 8: Root cause classifications
Section Generic root cause Section Root cause
Small and medium windings
Large windings
Drawing Interpreted Incorrectly Incorrect Material/Parts used Process Incorrectly Followed Lack of Attention Material not Ordered Supplier Problem Inadequate Training Planning not Issued Procedure Inadequate Lack of Attention Material not Planned No Procedure to Follow
Cylinder damaged at the bottom due to hooking
Cylinder undersize Conductor not finishing the job Conductor undersize Incorrect covering dimensions Clacks shortage Transposition not positioned correctly by
design Oil guides not fitting/sealing Close fitting collars not equal size with
conductor Bad joints from paper lapping Tails not insulated according to drawing
Small and medium winding assembly
Large winding
Cylinders warped and undersize Cylinder bursting open Cylinder having oil bubbles Cylinder damaged at the bottom due to
hooking Bad joints Tails not lining up End insulation collapsing under pressure Bottom end stack not lining up Transposition not marked Transposition on an incorrect position Conductor tilting under pressure due to
loose discs
Large Active Parts assembly
Small Active Parts Assembly
Drawing not having measuring
dimensions Incorrect ratios on windings Core plates stacked incorrectly Connection staggering not conforming
due to space constraints Yoke bolts not flashing after lock nuts Windings not fitting over another (ID
undersize)

61
Appendix C
Internal Audit Company Procedure
Procedure
6.1 Selection of auditors
The internal auditors shall ensure that audits are conducted as per internal audit schedule. They act as lead auditors and may co-opt additional personnel to assist with audits as they deem necessary. External consultants may also be used to perform or assist in performing quality audits. As a minimum requirement, the following personnel
will be trained as internal auditors:
Q Manager
Q Technicians
Q Inspectors
Environmental Manager
Safety Manager
QA & Environmental Assistant
Occupational Health Practitioner
When an integrated audit is performed in a certain area, the audit team shall be selected to cover all areas to be audited. The objective should be to train auditors in all four disciplines (multi-skilling).
6.2 Scheduling of audits Internal quality audits are scheduled by the Q Manager or his assistant. The frequency of audits is adjusted on the basis of the current situation or when significant changes have been made to the organisation or system function elements. A schedule showing the status of internal quality audits is kept electronically in “Sharepoint”.
In some cases additional audits may be required where new contracts have been awarded or where customer requirements or trends indicate that an audit should be performed. Where possible, internal system audit schedules are adhered to unless particular circumstances prevent the conduct of the audit on the specified dates.
Continuous trend analysis are conducted on IO’s raised relating to the product / service and customer/supplier related, internal audit findings as well as external audit findings.
Where trends are evident, additional ad hoc internal quality system audits are carried out. The 4 – Q Model approach could be utilised to investigate the trends. The method and format used for conducting and reporting audits must however, ensure that the end results meet the requirements of raising audit non-conformances and follow-up action to confirm their clearance and closure.
6.3 Preparation for company QA audits

62
As per scheduled on the “Sharepoint”, e-mail is sent to the relevant department manager(s) of the system functions to be audited prior to the planned audit and should include:-
a) Audit Date;
b) Area to be audited.
c) Other Information as Required.
If needed and where applicable, checklists could be prepared and duties assigned to assistant auditors.
If required, a meeting could be held (pre-audit meeting) with the manager (and possibly the foreman as well) to discuss any particular aspects or functions to the internal audit.
6.4 Performance of the Audit
If the audit team consist of more than one auditor, a pre-audit meeting could be held to assign tasks and discuss the audit areas. Checklists may be used if required.
An IO is raised, referring to the audit report, for follow-up purposes.
Where applicable and deemed necessary, arrangements are made to have responsible contact persons from the relevant system functions available to provide information and answer questions during the audit.
Internal audits are carried out using the criteria specified in SABS ISO 9001.
ISO 19011: Guidelines for quality may be used as a guide.
The foreman or departmental manager of the area must agree upon audit findings.
Once the findings had been agreed upon the findings are captured on Sharepoint
Referencing to the audit report numbers.
6.5 Reporting of Audits Upon completion of the audit, a meeting may be held (post audit conference) if deemed necessary by the auditor and / or manager. An audit report is then generated and distributed by the auditor within 1 week from date of audit. This report must reflect at least:
(a) Purpose of the audit;
(b) Scope;
(c) Summary;
(d) Conclusion
(e) Reference number of the IO raised
The audit report is circulated electronically to all responsible department heads. A copy of the audit report is also sent to the CEO, and the report is also made available on Sharepoint
6.6 Audit follow-up activities

63
A response to the Audit Report and Audit Findings is requested as per agreed target date, not exceeding one month. Managers are responsible to ensure that agreed target Dates for the finding(s) closure are met.
When deemed necessary, a follow-up audit could be scheduled to investigate audit findings, which are overdue.
1. Records
The Audit Report, together with all relevant documentation is retained as a quality record.
Audit reports are filed electronically in a Sharepoint programme under “PTT/Engineering/Quality Department; Audit Schedule/year and are kept for a minimum period of five years.
This procedure, together with any amendments or revisions is a permanent record kept by the document co-ordinator.

64
Internal Audit Report
1Prepared By:
E Dikobe Assisted By: N P Ngomane
Date:
16/08/2011 Approved By:
HJH Pieterse Department:
Quality Department: Large & Medium Windings and their Assemblies
Process(es): Quality Management System
Report No. :ED/IA/11-04
No. of pages:
7
Revision Description Date
1 Observation changed to minor finding 03/09/2009
3 Minor and Major Findings
No Findings Action
Completion date
3.1 Red Triangle procedure was not available, on request, during the audit. (ISO 7.5.1; b)
Riaan
3.2 Red triangle cards were not placed on W1063037 jobs during the audit. (ISO 7.5.1; b)
Riaan
3.3 Checklist (appendix 7) does not have any business (PTT) identification nor neither is part of our QMS.(ISO 4.2.1; c and d)
Riaan
3.4 Sigma card no. 1ZXX209808; page 1/16, 5/16 not signed off by the Supervisor. (ISO 4.2.4)
Riaan
3.5 The bottom leads of C phase D/winding got damaged while rotating winding platform during winding. (ISO 7.5.5)
Riaan
3.6 Stack Iron as well as disc clamps not available during the winding of seq #370 D winding (ISO 7.5.1; c)
Riaan
3.7 Unmarked trolley with material was left on the walk way, not attended too during the whole shift. (ISO 7.5.3)
Riaan
3.8. New sigma Cards for the repair of # 182 C phase C/W were not signed off by the Supervisor during the audit, the inspector signed on the 29th July 2011. (ISO 4.2.4)
James
3.10 Pages 3/16 to 16/16 found in the travelling file of # 182 are not identified for which unit are they for. (ISO 4.2.3; e)
Paul
3.11 Quality Objectives have not being adequately addressed within the audited area. (ISO 4.2.1; a)
James
3.12 The vertical winding machines are full of dust on the top(ISO 4.2.3 e) Riaan
3.13 The trolleys of #358 and 373 have broken collars and rings mixed
with good material.(ISO 7.5.5)
Riaan
3.14 Sigma cards1ZXX209808 and 1ZXX209845 have common
name(ISO 4.2.3 e)
James
3.15 Some of the sigma cards of #’s 185 and 972 were found in the James
1
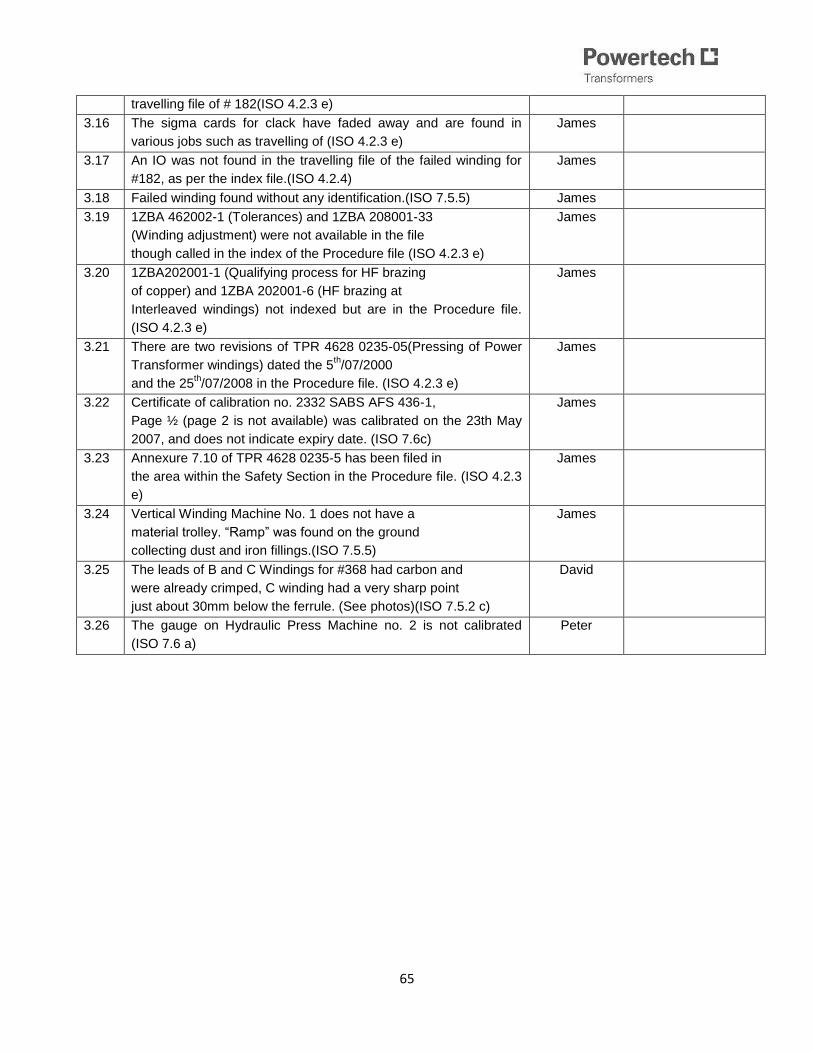
65
travelling file of # 182(ISO 4.2.3 e)
3.16 The sigma cards for clack have faded away and are found in
various jobs such as travelling of (ISO 4.2.3 e)
James
3.17 An IO was not found in the travelling file of the failed winding for
#182, as per the index file.(ISO 4.2.4)
James
3.18 Failed winding found without any identification.(ISO 7.5.5) James
3.19 1ZBA 462002-1 (Tolerances) and 1ZBA 208001-33
(Winding adjustment) were not available in the file
though called in the index of the Procedure file (ISO 4.2.3 e)
James
3.20 1ZBA202001-1 (Qualifying process for HF brazing
of copper) and 1ZBA 202001-6 (HF brazing at
Interleaved windings) not indexed but are in the Procedure file.
(ISO 4.2.3 e)
James
3.21 There are two revisions of TPR 4628 0235-05(Pressing of Power
Transformer windings) dated the 5th/07/2000
and the 25th/07/2008 in the Procedure file. (ISO 4.2.3 e)
James
3.22 Certificate of calibration no. 2332 SABS AFS 436-1,
Page ½ (page 2 is not available) was calibrated on the 23th May
2007, and does not indicate expiry date. (ISO 7.6c)
James
3.23 Annexure 7.10 of TPR 4628 0235-5 has been filed in
the area within the Safety Section in the Procedure file. (ISO 4.2.3
e)
James
3.24 Vertical Winding Machine No. 1 does not have a
material trolley. “Ramp” was found on the ground
collecting dust and iron fillings.(ISO 7.5.5)
James
3.25 The leads of B and C Windings for #368 had carbon and
were already crimped, C winding had a very sharp point
just about 30mm below the ferrule. (See photos)(ISO 7.5.2 c)
David
3.26 The gauge on Hydraulic Press Machine no. 2 is not calibrated
(ISO 7.6 a)
Peter

66
Table 9: The classification of the Audit findings as per department
Finding No department
3.1 Large windings and Assembly
3.2 Large windings and Assembly
3.3 Large windings and Assembly
3.4 Large windings and Assembly
3.5 Large windings and Assembly
3.6 Large windings and Assembly
3.7 Large windings and Assembly
3.8 Medium windings and Assembly
3.9 Medium windings and Assembly
3.1 Medium windings and Assembly
3.11 Medium windings and Assembly
3.12 Large windings and Assembly
3.13 Large windings and Assembly
3.14 Medium windings and Assembly
3.15 Medium windings and Assembly
3.16 Medium windings and Assembly
3.17 Medium windings and Assembly
3.18 Medium windings and Assembly
3.19 Medium windings and Assembly
3.2 Medium windings and Assembly
3.21 Medium windings and Assembly
3.22 Medium windings and Assembly
3.23 Medium windings and Assembly
3.24 Large Active Part Assembly
3.25 Medium Active Part Assembly

67
Appendix D
This Appendix has been attached to the disc on the back cover of the document.

68
Appendix E

69