assessing the impact of agricultural practices on phosphorous availability and loss using oxygen...
TRANSCRIPT

Kate ScowRussell Ranch
Adina PaytanIsotope Geochemistry
Asmeret BerheSoil Biogeochemistry
Phosphorus Cycling in SoilsAssessing the Impact of Agricultural
Practices on Phosphorous Availability and Loss Using Oxygen Isotopes of
Phosphate
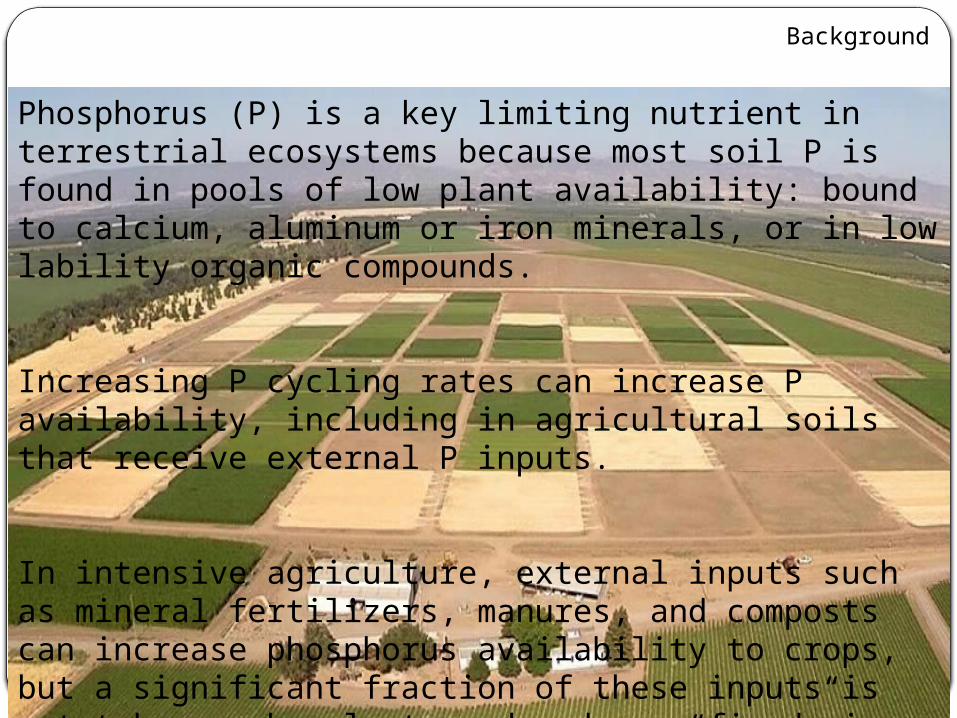
Phosphorus (P) is a key limiting nutrient in terrestrial ecosystems because most soil P is found in pools of low plant availability: bound to calcium, aluminum or iron minerals, or in low lability organic compounds.
Increasing P cycling rates can increase P availability, including in agricultural soils that receive external P inputs.
In intensive agriculture, external inputs such as mineral fertilizers, manures, and composts can increase phosphorus availability to crops, but a significant fraction of these inputs is not taken up by plants and ends up “fixed” in soil pools of low plant availability or lost through runoff.
Background

Determine soil P availability and mobility and how these characteristics vary with soil type and agriculture practices.
This should help reduce P loss from agriculture systems and contribute fundamental understanding to inform science based management plans.
Tracking P cycling, mobility in soils, and determining soils’ P availability to plants is challenging because adsorption- desorption, immobilization (occlusion by or precipitation as minerals), mineralization (conversion of organic P compounds to Pi), and uptake all occur simultaneously in the soil
Goals
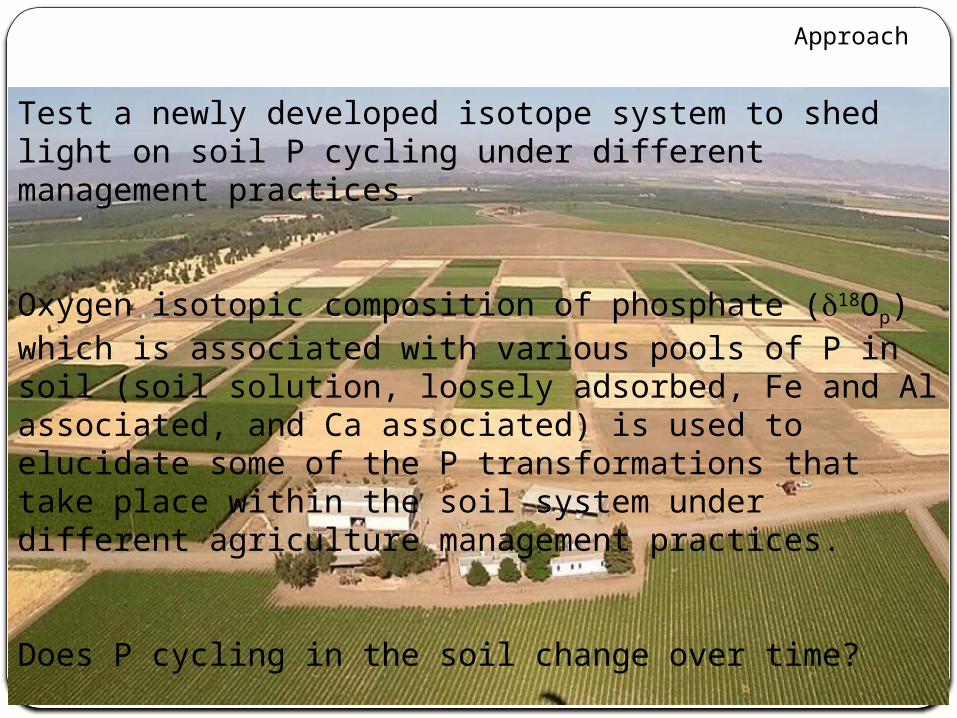
Test a newly developed isotope system to shed light on soil P cycling under different management practices.
Oxygen isotopic composition of phosphate (d18Op) which is associated with various pools of P in soil (soil solution, loosely adsorbed, Fe and Al associated, and Ca associated) is used to elucidate some of the P transformations that take place within the soil system under different agriculture management practices.
Does P cycling in the soil change over time?
Approach

Oxygen Isotopes in Phosphate

P Sources and Cycling – d18Op
The P-O bond is resistant to inorganic hydrolysis (Longinelli, 1976)
The P-O bond is broken in enzyme-mediated biochemical reactions (Dahms and Boyer, 1973; Boyer, 1978)
Intracellular oxygen isotopic exchange between phosphate and water is rapid and involves equilibrium fractionation(Paytan et al., 2002; Blake et al., 2005).
Kinetic fractionations associated with hydrolysis of specific organic P enzymatic processes(Blake et al., 2005; Liang and Blake 2006, 2009).
Oxygen Isotopes in Phosphate
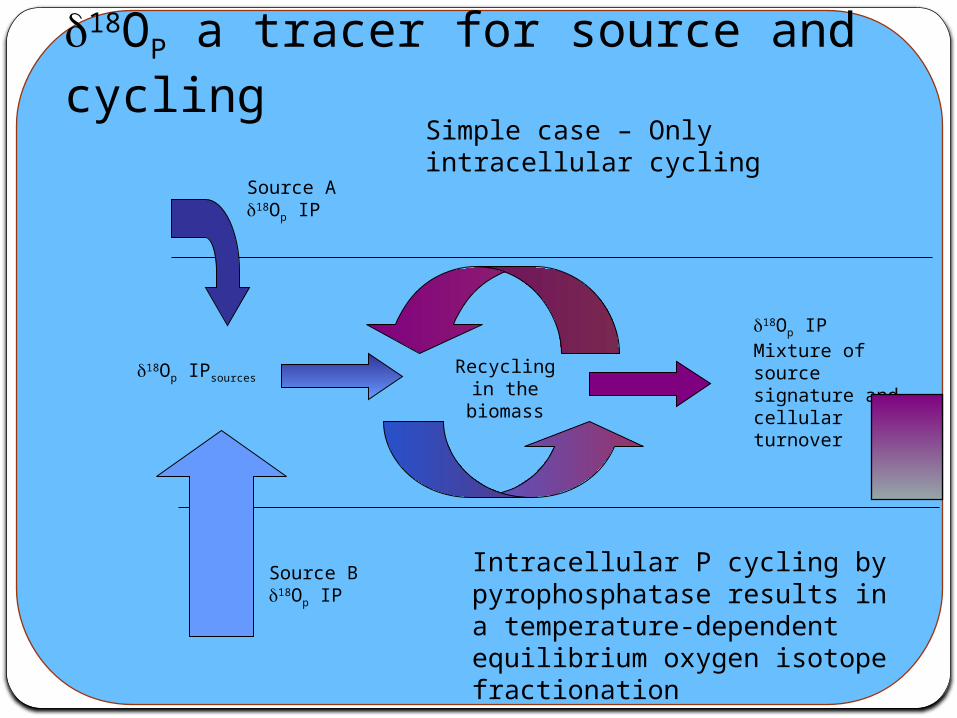
d18OP a tracer for source and cycling
Recyclingin the biomass
Source Ad18Op IP
Source Bd18Op IP
d18Op IPsources
d18Op IP Mixture of source signature and cellular turnover
Simple case – Only intracellular cycling
Intracellular P cycling by pyrophosphatase results in a temperature-dependent equilibrium oxygen isotope fractionation
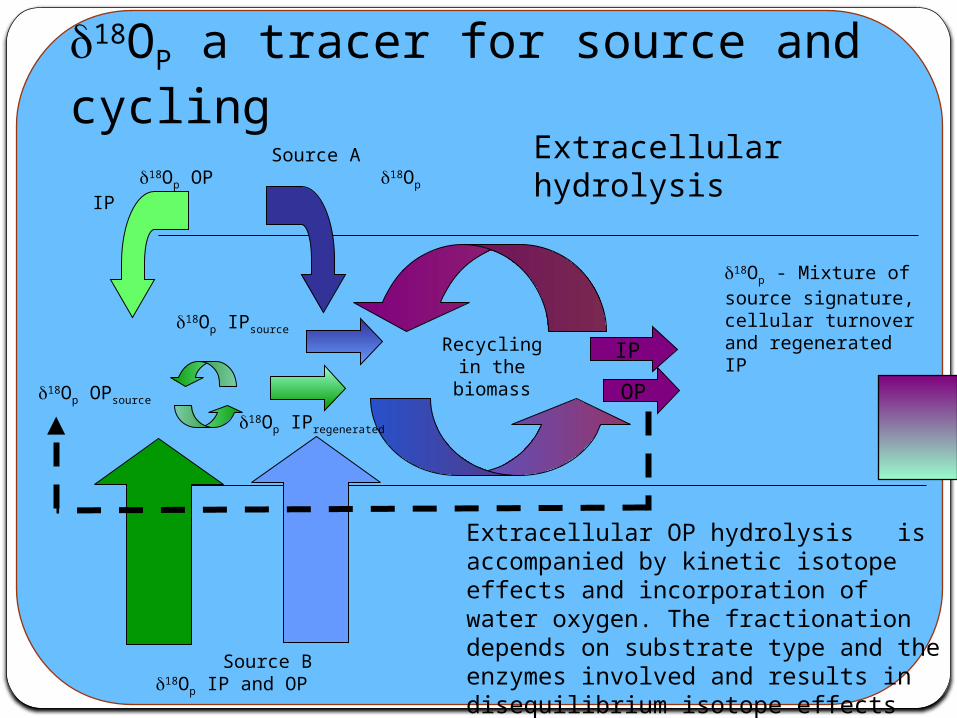
d18OP a tracer for source and cycling
IPRecyclingin the biomass
Source A d18Op OP d18Op IP
Source Bd18Op IP and OP
d18Op IPsource
Extracellular hydrolysis
Extracellular OP hydrolysis is accompanied by kinetic isotope effects and incorporation of water oxygen. The fractionation depends on substrate type and the enzymes involved and results in disequilibrium isotope effects
d18Op OPsource
d18Op - Mixture of source signature, cellular turnover and regenerated IP
d18Op IPregenerated
OP
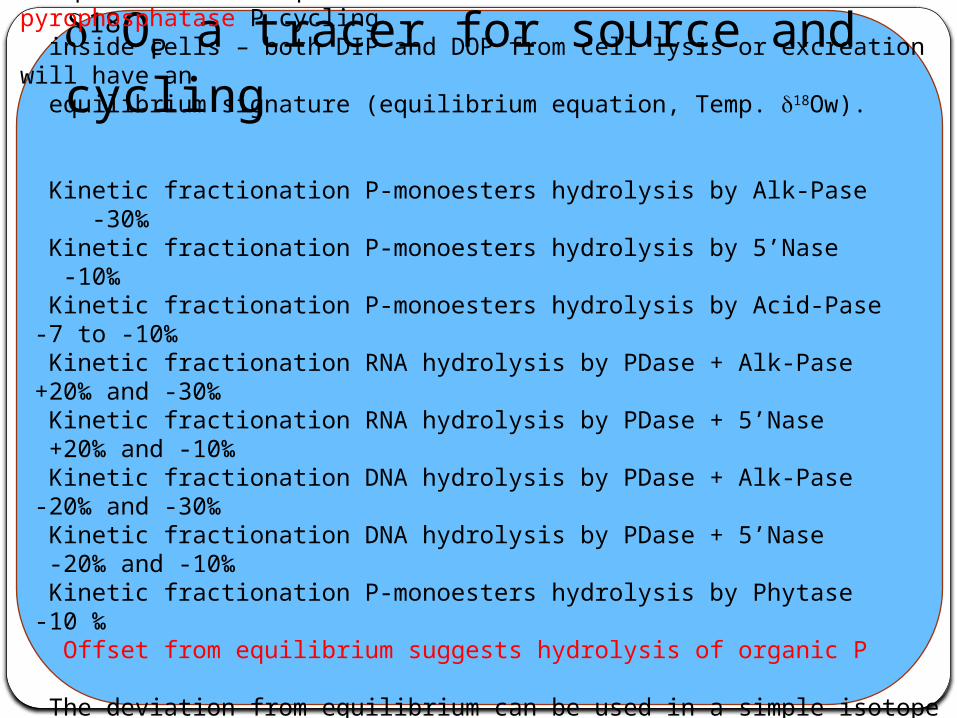
d18OP a tracer for source and cycling Equilibrium isotope fractionation associated with pyrophosphatase P cycling inside cells – both DIP and DOP from cell lysis or excreation will have an equilibrium signature (equilibrium equation, Temp. d18Ow).
Kinetic fractionation P-monoesters hydrolysis by Alk-Pase -30‰ Kinetic fractionation P-monoesters hydrolysis by 5’Nase -10‰ Kinetic fractionation P-monoesters hydrolysis by Acid-Pase -7 to -10‰ Kinetic fractionation RNA hydrolysis by PDase + Alk-Pase +20‰ and -30‰ Kinetic fractionation RNA hydrolysis by PDase + 5’Nase +20‰ and -10‰ Kinetic fractionation DNA hydrolysis by PDase + Alk-Pase -20‰ and -30‰ Kinetic fractionation DNA hydrolysis by PDase + 5’Nase -20‰ and -10‰ Kinetic fractionation P-monoesters hydrolysis by Phytase -10 ‰ Offset from equilibrium suggests hydrolysis of organic P
The deviation from equilibrium can be used in a simple isotope mass balance model to estimate the fraction of phosphate derived from DOP remineralization.
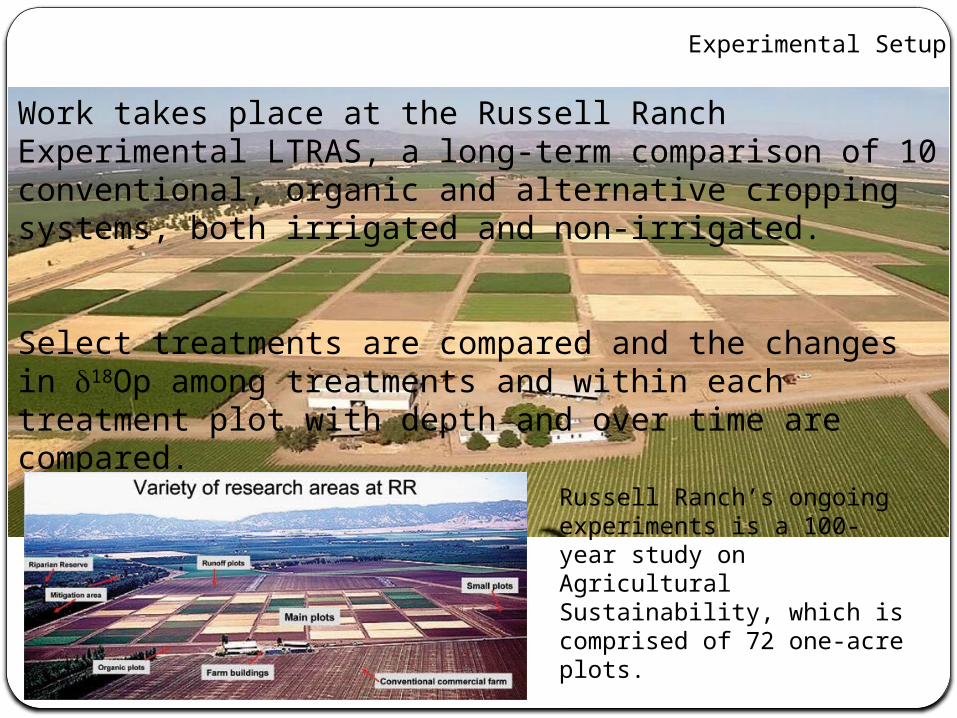
Work takes place at the Russell Ranch Experimental LTRAS, a long-term comparison of 10 conventional, organic and alternative cropping systems, both irrigated and non-irrigated.
Select treatments are compared and the changes in d18Op among treatments and within each treatment plot with depth and over time are compared.
Experimental Setup
Russell Ranch’s ongoing experiments is a 100-year study on Agricultural Sustainability, which is comprised of 72 one-acre plots.
https://www.youtube.com/watch?v=Y4tUa8lUmJ4#action=share
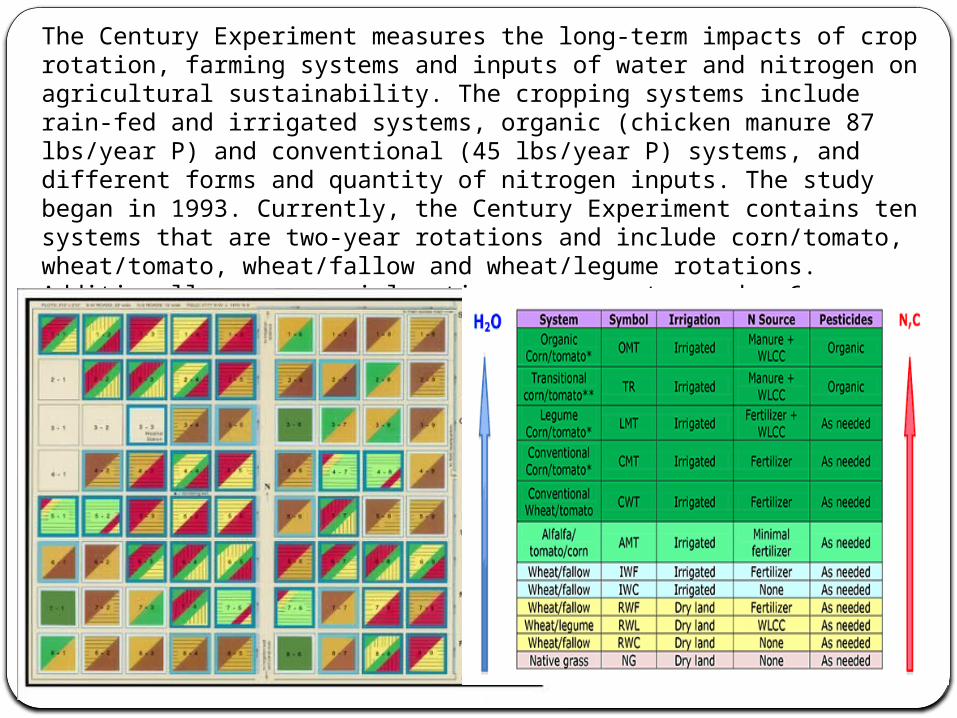
The Century Experiment measures the long-term impacts of crop rotation, farming systems and inputs of water and nitrogen on agricultural sustainability. The cropping systems include rain-fed and irrigated systems, organic (chicken manure 87 lbs/year P) and conventional (45 lbs/year P) systems, and different forms and quantity of nitrogen inputs. The study began in 1993. Currently, the Century Experiment contains ten systems that are two-year rotations and include corn/tomato, wheat/tomato, wheat/fallow and wheat/legume rotations. Additionally, a perennial native grass system and a 6-year alfalfa-corn-tomato rotation were initiated in 2012.

Soil cores from several replicate plots used:Organic fertilizer, full irrigation, corn/tomato alternating plotsOrganic fertilizer, full irrigation, tomato/corn alternating plots Mineral fertilizer, full irrigation, tomato/ corn alternating plotsMineral fertilizer, full irrigation, corn/tomato alternating plots
Depths: 0-15cm, 15-30cm, 30-60cm, and 150-200cmOrganic 87 lb ac-1 year-1 P Mineral 45 lb ac-1 year-1 P
Experimental Setup
Fertilization calculated based on N requirementsP use is inefficient (low recovery of inputs in crops, excess P in soil)Organic treatments less efficient than Mineral treatments (higher surplus)Corn - %P in crop similar across treatments; hence yields for Mineral > OrganicTomatoes - %P Organic > Mineral; hence yields similar across treatmentsSoil P accumulation less than expected from mass balance (loss?)
Maltais-Landry et al., 2015
-250
-200
-150
-100
-50
0
0.0 0.1 0.2 0.3 0.4 0.5 0.6 0.7
dept
h (c
m)
PO4-P and TP (ppm)
H2O extraction across treatments
org C/T H2O PO4-P (ppm) org C/T H2O TP (ppm)
org T/C H2O PO4-P (ppm) org T/C H2O TP (ppm)
min C/T H2O PO4-P (ppm) min C/T H2O TP (ppm)
min T/C H2O PO4-P (ppm) min T/C H2O TP (ppm)
-250
-200
-150
-100
-50
0
0.0 0.2 0.4 0.6 0.8
dept
h (c
m)
PO4-P and TP (ppm)
NaHCO3 extraction across treatments
org C/T NaHCO3 PO4-P (ppm) org C/T NaHCO3 TP (ppm)
org T/C NaHCO3 PO4-P (ppm) org T/C NaHCO3 TP (ppm)
min C/T NaHCO3 PO4-P (ppm) min C/T NaHCO3 TP (ppm)
min T/C NaHCO3 PO4-P (ppm) min T/C NaHCO3 TP (ppm)
-250
-200
-150
-100
-50
0
0.0 0.2 0.4 0.6 0.8 1.0 1.2 1.4
dept
h (c
m)
PO4-P and TP (ppm)
NaOH extraction across treatments
org C/T NaOH PO4-P (ppm) org C/T NaOH TP (ppm)
org T/C NaOH PO4-P (ppm) org T/C NaOH TP (ppm)
min C/T NaOH PO4-P (ppm) min C/T NaOH TP (ppm)
min T/C NaOH PO4-P (ppm) min T/C NaOH TP (ppm)
-250
-200
-150
-100
-50
0
0 2 4 6 8
dept
h (c
m)
PO4-P and TP (ppm)
HCl extraction across treatments
org C/T HCl PO4-P (ppm) org C/T HCl TP (ppm)
org T/C HCl PO4-P (ppm) org T/C HCl TP (ppm)
min C/T HCl PO4-P (ppm) min C/T HCl TP (ppm)
min T/C HCl PO4-P (ppm) min T/C HCl TP (ppm)
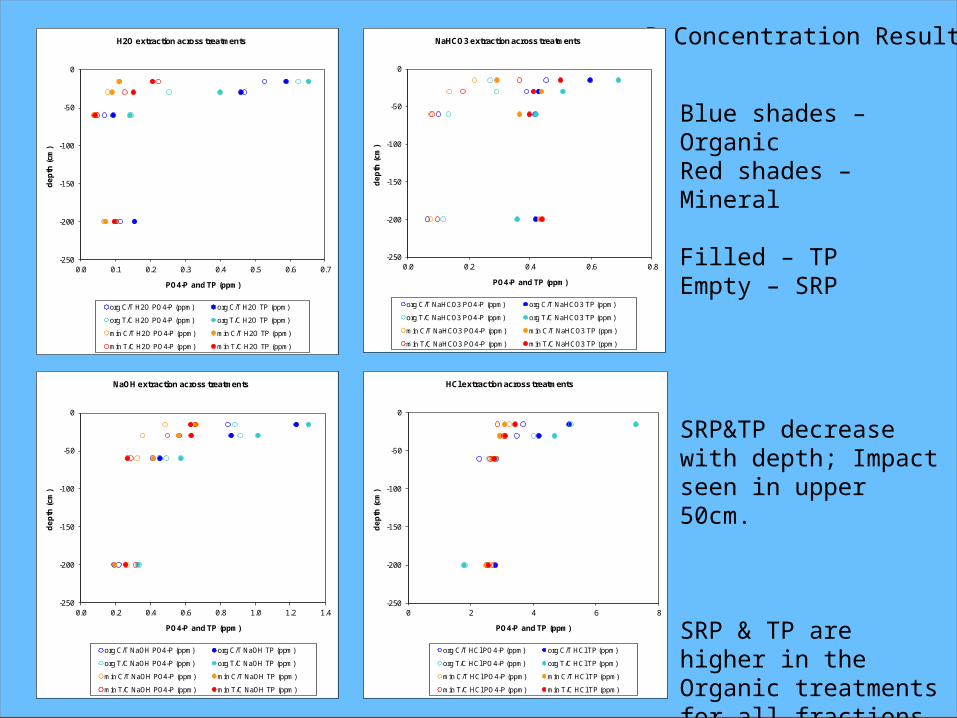
Blue shades – OrganicRed shades – Mineral
Filled – TPEmpty – SRP
SRP&TP decrease with depth; Impact seen in upper 50cm.
SRP & TP are higher in the Organic treatmentsfor all fractions.
P Concentration Results
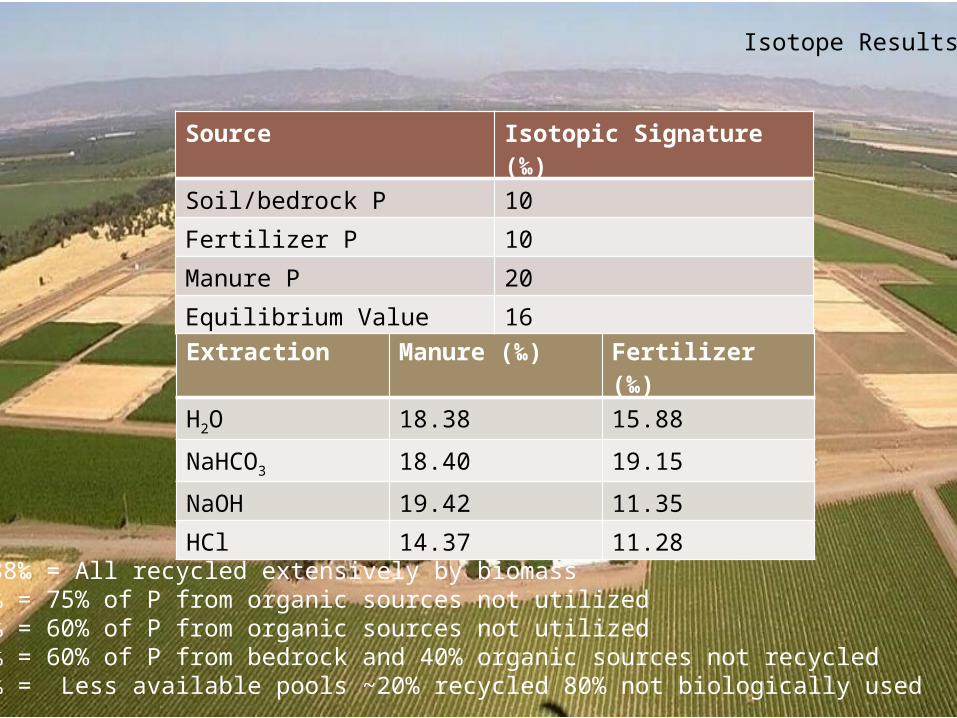
Isotope Results
Extraction Manure (‰) Fertilizer (‰)H2O 18.38 15.88NaHCO3 18.40 19.15NaOH 19.42 11.35HCl 14.37 11.28
Source Isotopic Signature (‰)
Soil/bedrock P 10Fertilizer P 10Manure P 20Equilibrium Value 16
15.88‰ = All recycled extensively by biomass19 ‰ = 75% of P from organic sources not utilized18 ‰ = 60% of P from organic sources not utilized14 ‰ = 60% of P from bedrock and 40% organic sources not recycled11 ‰ = Less available pools ~20% recycled 80% not biologically used
Thank you!