assessing the impact of imperfect diagnosis on service reliability: a parsimonious model approach...
TRANSCRIPT
Assessing the Impact of Imperfect Diagnosis on Service
Reliability:A Parsimonious Model
Approach
Networking and Security GroupAalborg University, [email protected]
European Dependable Computing Conference 2010 – Valencia, Spain April 28, 2010
<
(Presenter) Jesper Grønbæk Hans-Peter Schwefel Jens Kristian Kjærgård Thomas S. Toftegaard
Tieto IP Solutions, DenmarkAarhus School of Engineering,University of Aarhus, Denmark
Forschungszentrum Telekommunikation Wien, Austria
April 28, 2010EDCC 2010 – Valencia, Spain
2
• ConclusionsImperfect Diagnosis
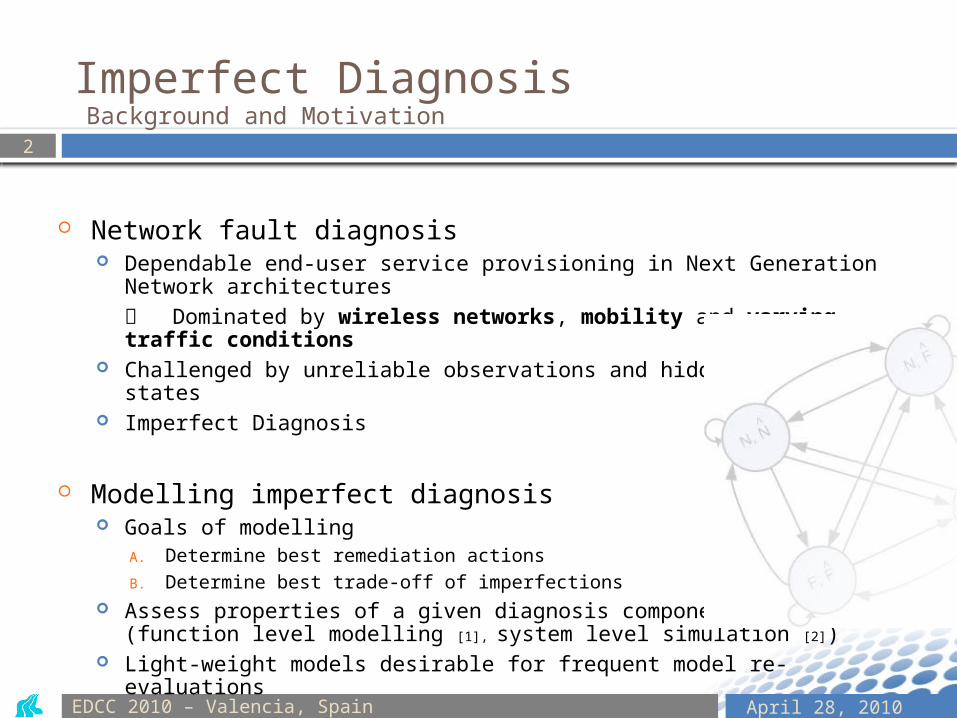
Network fault diagnosis Dependable end-user service provisioning in Next Generation Network
architectures Dominated by wireless networks, mobility and varying traffic conditions
Challenged by unreliable observations and hidden network states Imperfect Diagnosis
Modelling imperfect diagnosis Goals of modelling
A. Determine best remediation actionsB. Determine best trade-off of imperfections
Assess properties of a given diagnosis component (function level modelling [1], system level simulation [2])
Light-weight models desirable for frequent model re-evaluations
Background and Motivation
April 28, 2010EDCC 2010 – Valencia, Spain
End-NodeDevice
Observation & Pre-Processing
End-UserServices
Networks
Diagnosis Component
I – End-User services requirements
VI – System state estimates
VII – Initiate remediation actions
II - Decisions
RemediationExecute
Commands
VIII - Remediation outcome
IX – Violation of requirements
V – Pre-processed observations
Decision Component
III – Network observation
IV – Event sent
3
• ConclusionsImperfect Diagnosis
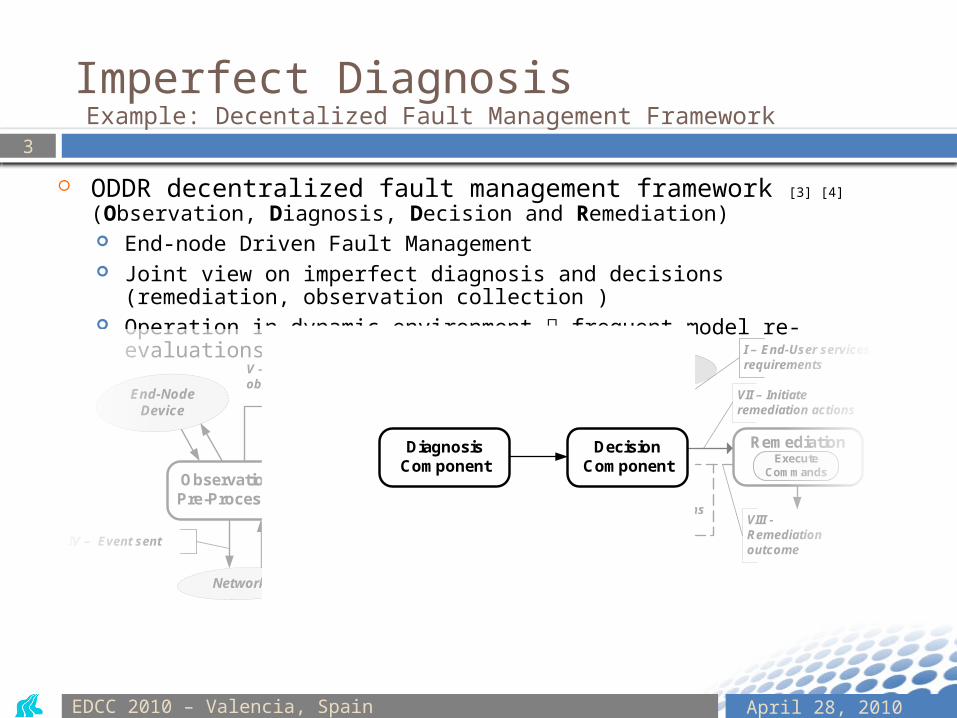
ODDR decentralized fault management framework [3] [4]
(Observation, Diagnosis, Decision and Remediation) End-node Driven Fault Management Joint view on imperfect diagnosis and decisions (remediation,
observation collection ) Operation in dynamic environment frequent model re-evaluations
Subsequent focus on trade-off of imperfections (best diagnosis settings)
Example: Decentalized Fault Management Framework
Diagnosis Component
Decision Component

April 28, 2010EDCC 2010 – Valencia, Spain
CongestionFault
WLAN APA
InfrastructureNetwork
End-Node
End-User service provider
ODDR Component
Round-Trip TimeObservation
End-User Service
Time…t=0 T
Fault (1):Normal (0):
States
Diagnosis atomic view Single observation Two network states (Normal/Fault) Discrete diagnosis steps (period T)
Generic Diagnosis (state estimation) definitions
4
• ConclusionsBackground on Diagnosis ApproachesDefinitions of Diagnosis Outcomes
True Positives (TP)
False Negatives (FN)False Positives (FP)True Negatives (TN)
False Alarm (FA)
True Alarm (TA)
Fault occurrence
April 28, 2010EDCC 2010 – Valencia, Spain
5
• ConclusionsBackground on Diagnosis ApproachesDiagnosis Classes
1 Terminology adapted from [5]
2000 repetitions
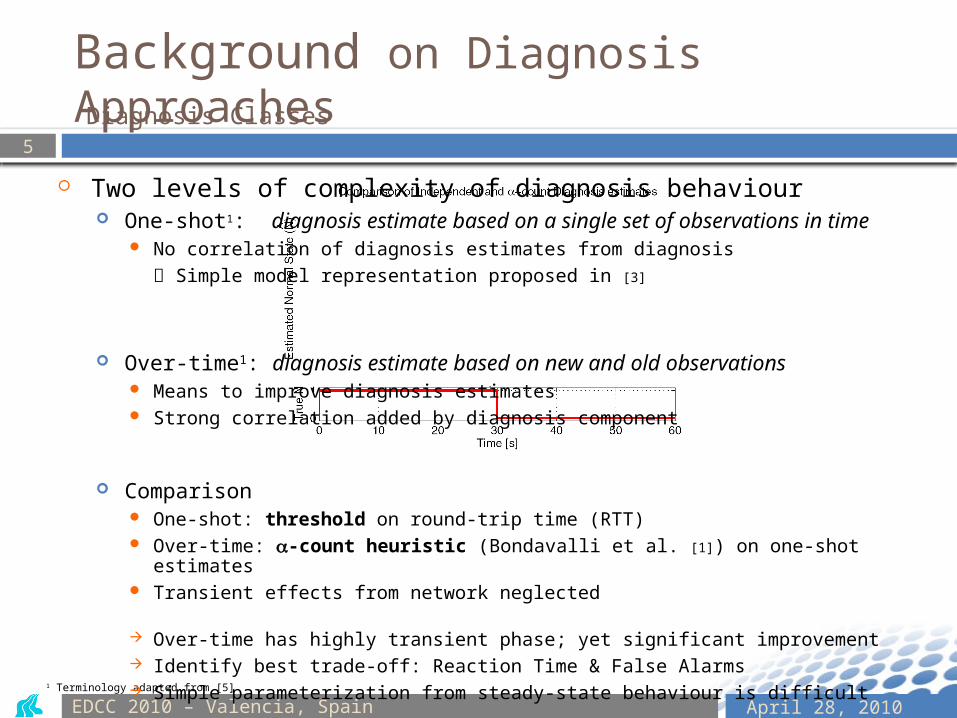
Two levels of complexity of diagnosis behaviour One-shot1: diagnosis estimate based on a single set of observations in
time No correlation of diagnosis estimates from diagnosis
Simple model representation proposed in [3]
Over-time1: diagnosis estimate based on new and old observations Means to improve diagnosis estimates Strong correlation added by diagnosis component
Comparison One-shot: threshold on round-trip time (RTT) Over-time: -count heuristic (Bondavalli et al. [1]) on one-shot estimates Transient effects from network neglected
Over-time has highly transient phase; yet significant improvement Identify best trade-off: Reaction Time & False Alarms Simple parameterization from steady-state behaviour is difficult
April 28, 2010EDCC 2010 – Valencia, Spain
True estimates False estimates
P FPTN
P TNFN
P FNTN
P F
PF
NP T
PT
N
P TPFN
Normal
Fault
(TN)
^N, N(FP)
^N, F
(TP)
^F, F(FN)
^F, N
Diagnosis state (Ds)
1
1
Net
wor
k st
ate
(Ns)
True estimates False estimates
Normal
Fault
(TN)
^N, N(FP)
^N, F
(TP)
^F, F(FN)
^F, N
Diagnosis state (Ds)
Net
wor
k st
ate
(Ns)
(1-TNR)(1-pf) (1-TNR)(1-pf)
TNR(1-pf)
TNR(1-pf)
TP
R×p
f
(1-TPR)×pf
...
......
...
......
...
...
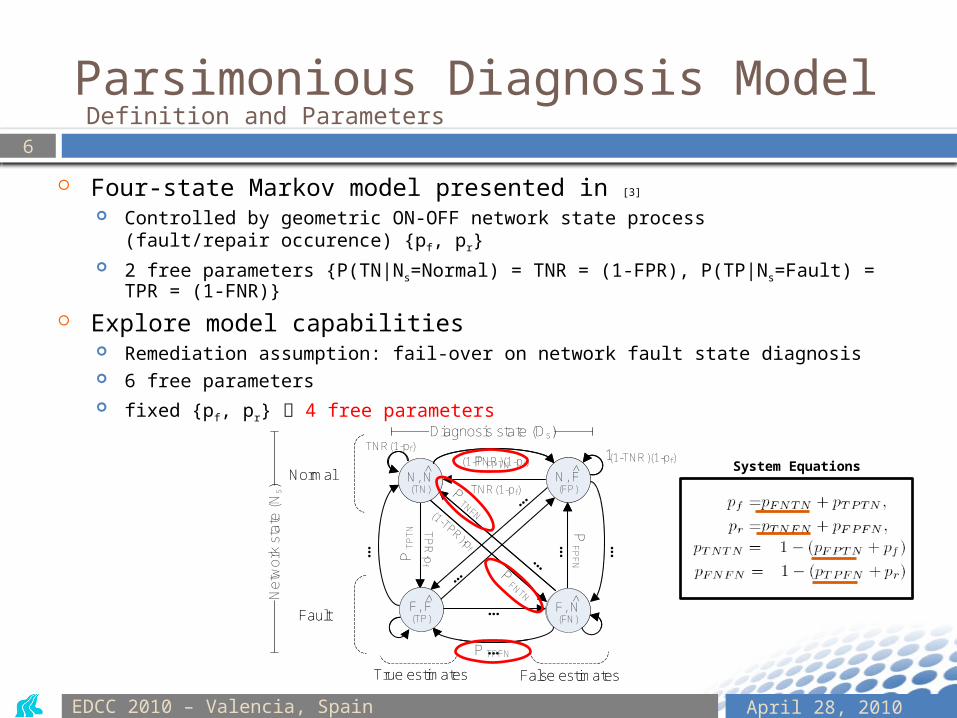
Four-state Markov model presented in [3] Controlled by geometric ON-OFF network state process
(fault/repair occurence) {pf, pr} 2 free parameters {P(TN|Ns=Normal) = TNR = (1-FPR), P(TP|Ns=Fault) = TPR = (1-
FNR)}
Explore model capabilities Remediation assumption: fail-over on network fault state diagnosis 6 free parameters fixed {pf, pr} 4 free parameters
6
• ConclusionsParsimonious Diagnosis ModelDefinition and Parameters
System Equations
April 28, 2010EDCC 2010 – Valencia, Spain
7
• ConclusionsParsimonious Diagnosis Model
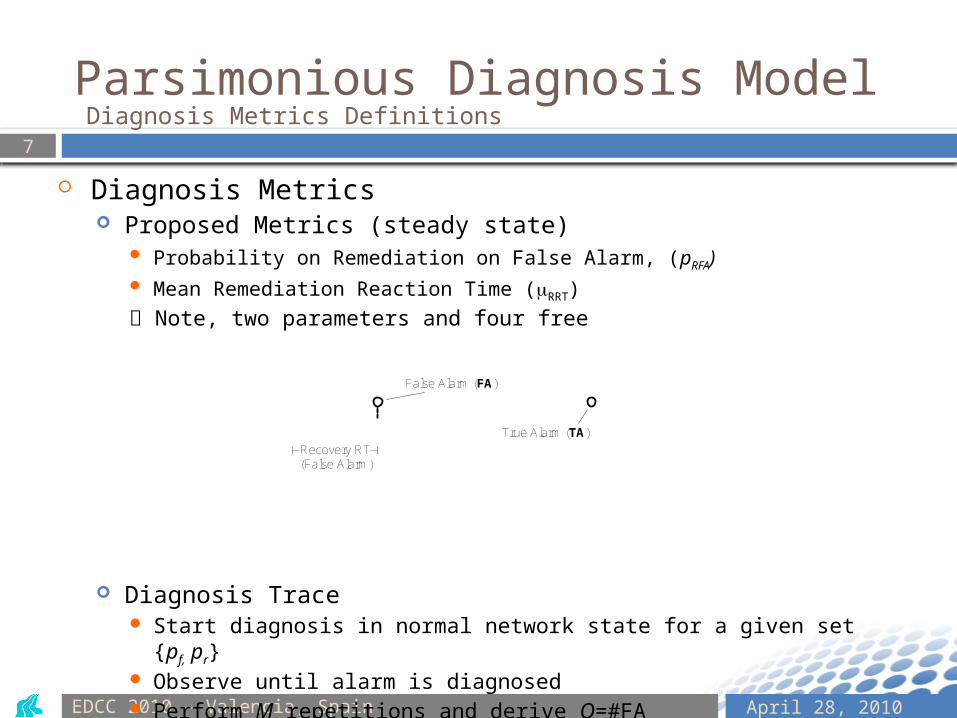
Diagnosis Metrics Proposed Metrics (steady state)
Probability on Remediation on False Alarm, (pRFA) Mean Remediation Reaction Time (mRRT)
Note, two parameters and four free
Diagnosis Trace Start diagnosis in normal network state for a given set {pf, pr} Observe until alarm is diagnosed Perform M repetitions and derive O=#FA
pRFA = O/M mRRT, mean time to remediation over all M
Diagnosis Metrics Definitions
Time…True Positives (TP)
False Negatives (FN)False Positives (FP)True Negatives (TN) False Alarm (FA)
Fault occurrence
t=0 T
Recovery RT(False Alarm)
True Alarm (TA)
Fault (1):Normal (0):
States False Alarm (FA)
Recovery RT(False Alarm)
True Alarm (TA)
April 28, 2010EDCC 2010 – Valencia, Spain
8
• ConclusionsParsimonious Diagnosis Model
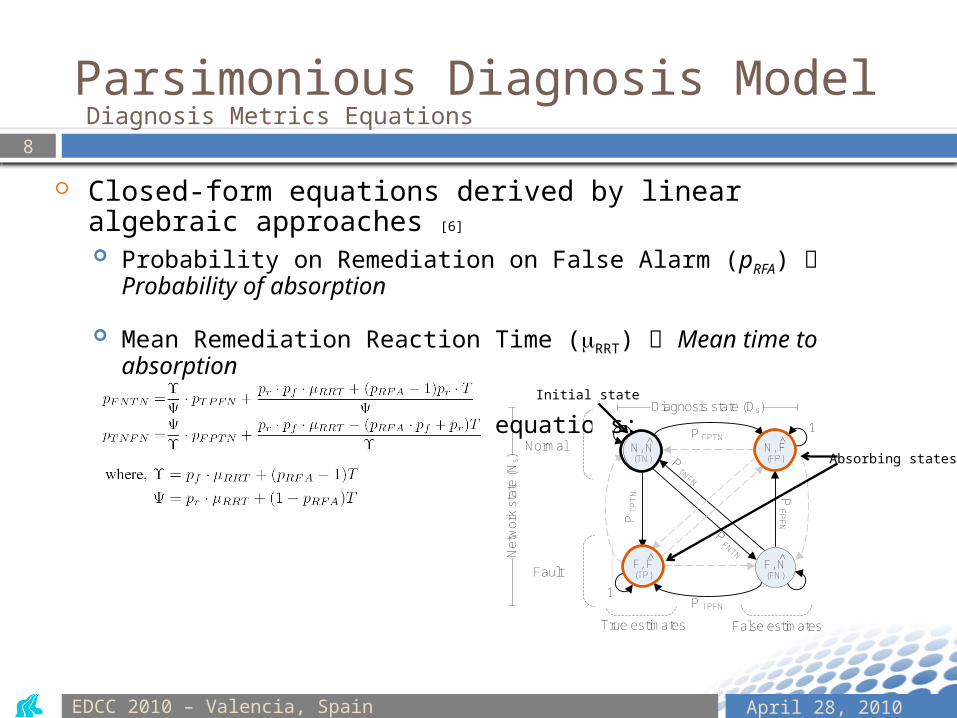
Closed-form equations derived by linear algebraic approaches [6]
Probability on Remediation on False Alarm (pRFA) Probability of absorption
Mean Remediation Reaction Time (mRRT) Mean time to absorption
Solving yields two linear equations:
Diagnosis Metrics Equations
True estimates False estimates
P FPTN
P TNFN
P FNTN
P F
PF
NP T
PT
N
P TPFN
Normal
Fault
(TN)
^N, N(FP)
^N, F
(TP)
^F, F(FN)
^F, N
Diagnosis state (Ds)
1
1
Net
wor
k st
ate
(Ns) Absorbing states
Initial state
April 28, 2010EDCC 2010 – Valencia, Spain
True estimates False estimates
P FPTN
P TNFN
P FNTN
P F
PF
NP T
PT
N
P TPFN
Normal
Fault
(TN)
^N, N(FP)
^N, F
(TP)
^F, F(FN)
^F, N
Diagnosis state (Ds)
1
1
Net
wor
k st
ate
(Ns)
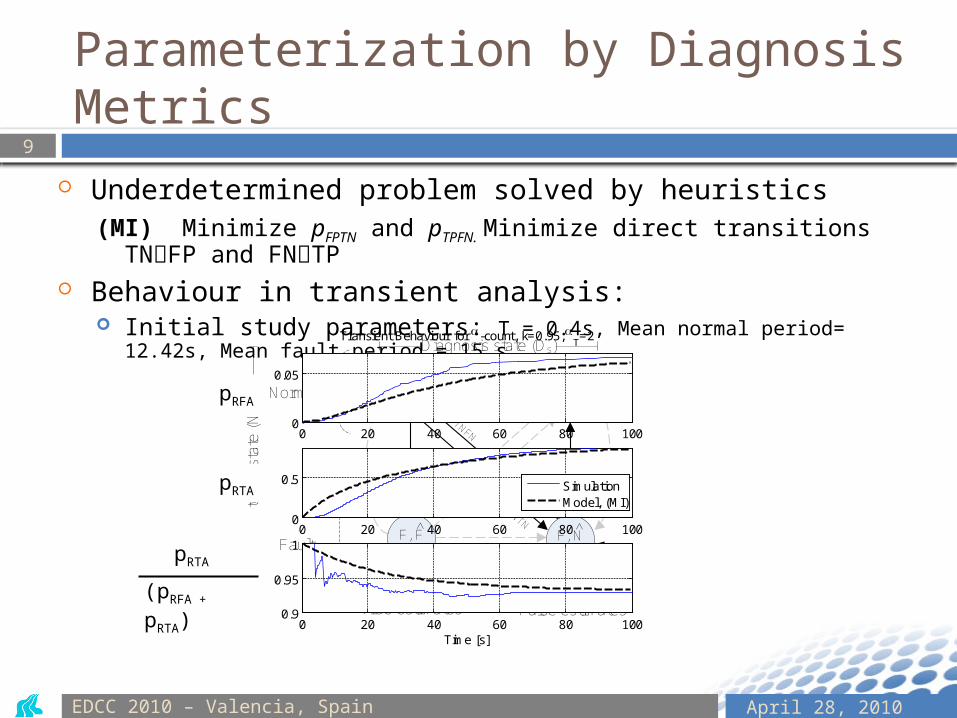
Underdetermined problem solved by heuristics(MI) Minimize pFPTN and pTPFN. Minimize direct transitions TNFP
and FNTP Behaviour in transient analysis:
Initial study parameters: T = 0.4s, Mean normal period= 12.42s, Mean fault period = 15 s
Captures an initial higher probability of pRTA over all alarms (pRTA+ pRFA)
9
• ConclusionsParameterization by Diagnosis Metrics
minimize
minimize
0 20 40 60 80 1000
0.5
pR
TA
0 20 40 60 80 1000.9
0.95
1
pR
TA/(
p RF
A+
PR
TA)
Time [s]
0 20 40 60 80 1000
0.05
pR
FA
Transient Behaviour for -count, k=0.95, T=2
SimulationModel, (MI)
pRFA
pRTA
pRTA
(pRFA + pRTA)
April 28, 2010EDCC 2010 – Valencia, Spain
CongestionFault
WLAN APB
WLAN APA
End-User service provider
Reliable Transfer End-User Service
Operator B Infrastructure
Operator A Infrastructure
Service provider
Infrastructure
Network B
Network A
End-Node
ODDR Component
10
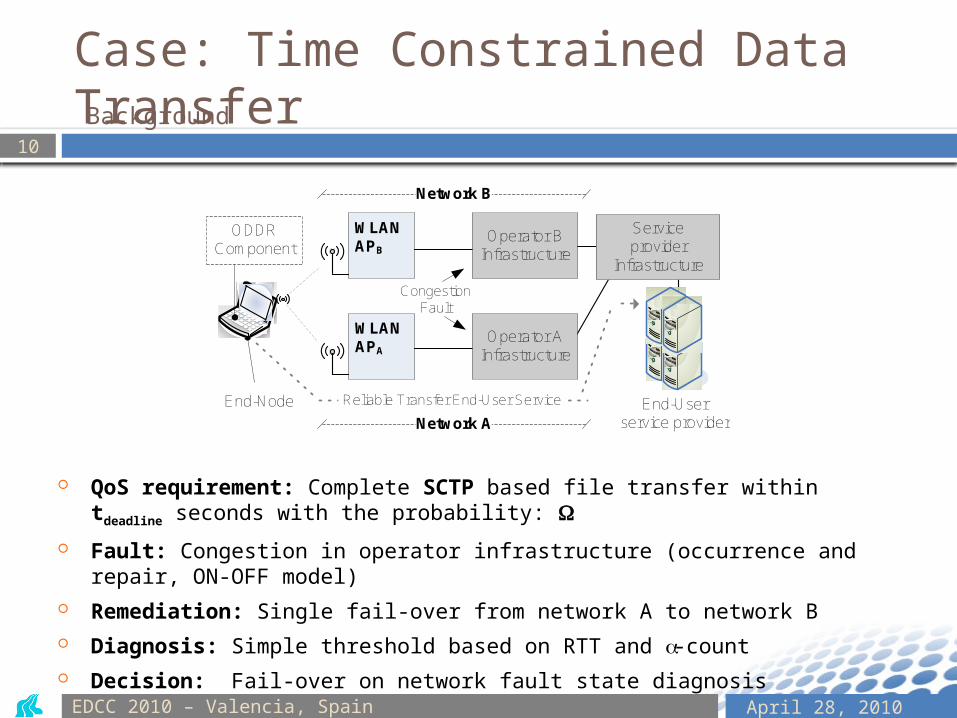
• ConclusionsCase: Time Constrained Data Transfer
QoS requirement: Complete SCTP based file transfer within tdeadline seconds with the probability: W
Fault: Congestion in operator infrastructure (occurrence and repair, ON-OFF model)
Remediation: Single fail-over from network A to network B Diagnosis: Simple threshold based on RTT and a-count Decision: Fail-over on network fault state diagnosis
Background

April 28, 2010EDCC 2010 – Valencia, Spain
11
• ConclusionsCase: Time Constrained Data Transfer
Policy Evaluation Discrete Time Markov Model (PE DTMC) [3]
State Space:
SPE = {Active network, Time progress, File progress, Network state, Diagnosis state}
Ωmodel = Σ SPEss(r, n)
Policy Evaluation Model
File Transfer Completion Time CDF
r =1
m
April 28, 2010EDCC 2010 – Valencia, Spain
12
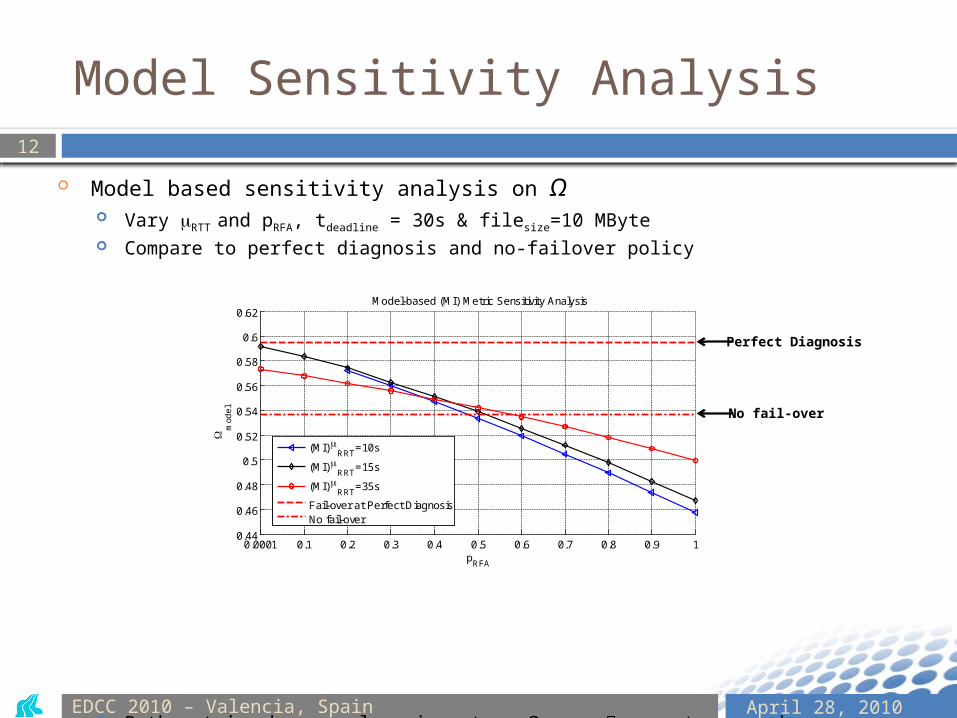
• ConclusionsModel Sensitivity Analysis
Model based sensitivity analysis on Ω Vary mRTT and pRFA, tdeadline = 30s & filesize=10 MByte Compare to perfect diagnosis and no-failover policy
Both metrics have a clear impact on Ω, mRTT promptness and pRFA -> correctness Most sensitive to high pRFA wrong fail-over cannot be remediated Can deliver significantly worse performance than no fail-over
Perfect Diagnosis
No fail-over
0.0001 0.1 0.2 0.3 0.4 0.5 0.6 0.7 0.8 0.9 10.44
0.46
0.48
0.5
0.52
0.54
0.56
0.58
0.6
0.62
pRFA
m
ode
l
Model-based (MI) Metric Sensitivity Analysis
(MI) RRT
=10s
(MI) RRT
=15s
(MI) RRT
=35s
Fail-over at Perfect DiagnosisNo fail-over
April 28, 2010EDCC 2010 – Valencia, Spain
13
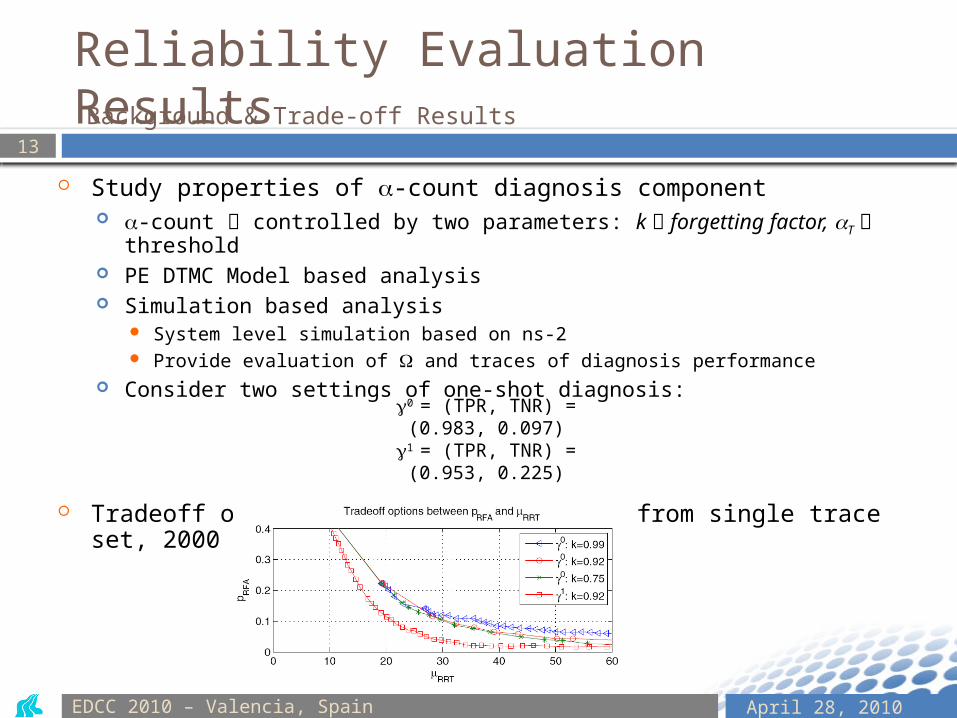
• ConclusionsReliability Evaluation Results
Study properties of a-count diagnosis component a-count controlled by two parameters: k forgetting factor, aT
threshold PE DTMC Model based analysis Simulation based analysis
System level simulation based on ns-2 Provide evaluation of W and traces of diagnosis performance
Consider two settings of one-shot diagnosis:
Tradeoff options of a-count (obtained from single trace set, 2000 runs)
Background & Trade-off Results
g0 = (TPR, TNR) = (0.983, 0.097)
g1 = (TPR, TNR) = (0.953, 0.225)
April 28, 2010EDCC 2010 – Valencia, Spain
14
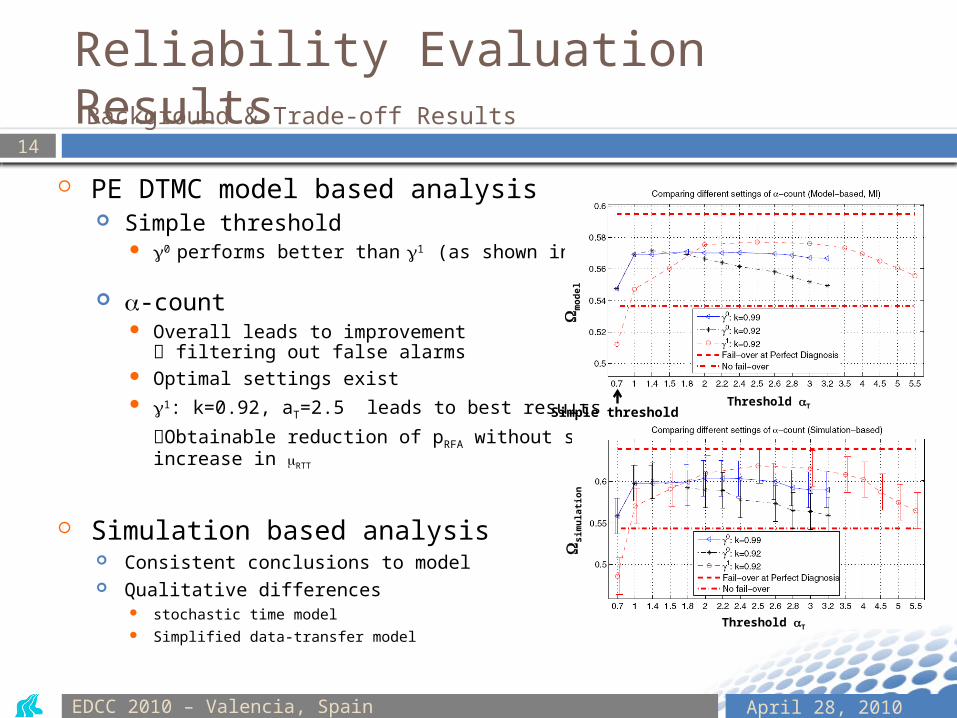
• ConclusionsReliability Evaluation Results
PE DTMC model based analysis Simple threshold
g0 performs better than g1 (as shown in [3])
a-count Overall leads to improvement
filtering out false alarms Optimal settings exist g1: k=0.92, aT=2.5 leads to best results
Obtainable reduction of pRFA without similar increase in mRTT
Simulation based analysis Consistent conclusions to model Qualitative differences
stochastic time model Simplified data-transfer model
Background & Trade-off Results
Wsi
mu
lati
on
Wm
od
el
Threshold aT
Simple threshold Threshold aT
April 28, 2010EDCC 2010 – Valencia, Spain
15
• ConclusionsConclusion & Outlook
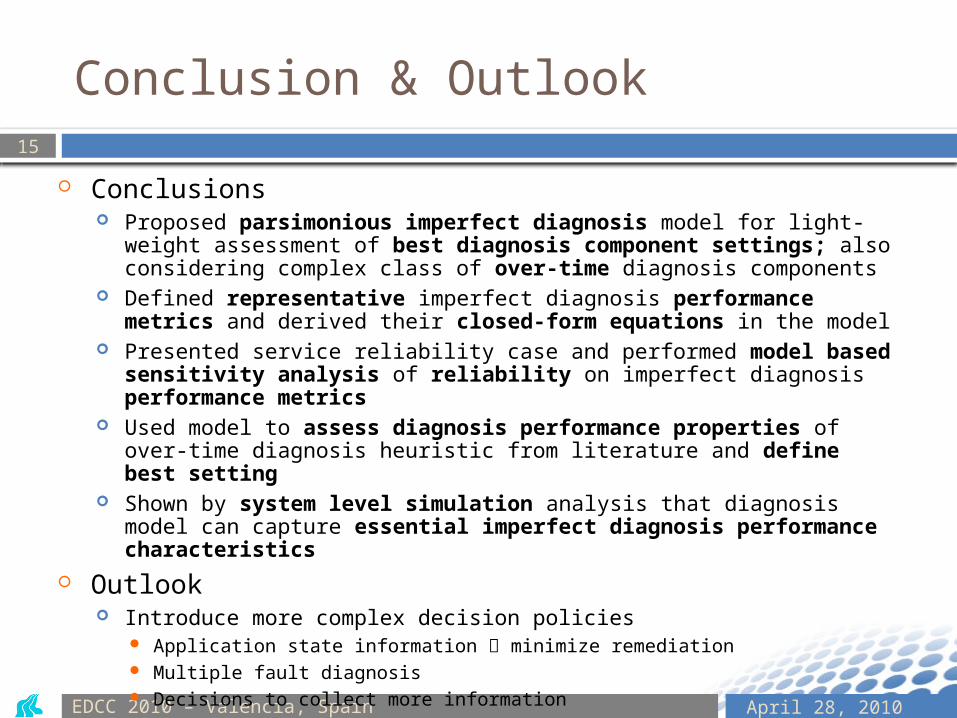
Conclusions Proposed parsimonious imperfect diagnosis model for light-weight
assessment of best diagnosis component settings; also considering complex class of over-time diagnosis components
Defined representative imperfect diagnosis performance metrics and derived their closed-form equations in the model
Presented service reliability case and performed model based sensitivity analysis of reliability on imperfect diagnosis performance metrics
Used model to assess diagnosis performance properties of over-time diagnosis heuristic from literature and define best setting
Shown by system level simulation analysis that diagnosis model can capture essential imperfect diagnosis performance characteristics
Outlook Introduce more complex decision policies
Application state information minimize remediation Multiple fault diagnosis Decisions to collect more information Need to study diagnosis model behaviour after positive diagnosis and
potentially extend

April 28, 2010EDCC 2010 – Valencia, SpainDRCN 09 - Washington DC
16
• Conclusions
Questions & Discussion
April 28, 2010EDCC 2010 – Valencia, Spain
17
References
[1] Threshold-based mechanisms to discriminate transient from intermittent faults. A. Bondavalli, S. Chiaradonna, F. Di Giandomenico, and F. Grandoni, IEEE Transactions on Computers, vol. 49, no. 3, pp. 230–245, 2000.
[2] Probabilistic Fault-Diagnosis in Mobile Networks Using Cross-Layer Observations. A. Nickelsen, J. Grønbæk, T. Renier, and H.-P. Schwefel, “” In Proceedings of AINA 09, pp. 225–232, 2009.
[3] Model based evaluation of policies for end-node driven fault recovery. J. Grønbæk, H.-P. Schwefel, and T. Toftegaard, Proc. DRCN 09, 2009.
[4] Towards self-adaptive reliable network services in highly-uncertain environments. A. Ceccarelli, J. Grønbæk, L. Montecchi, A. Bondavalli, and H. P. Schwefel, To appear in proceedings of WORNUS 10, May, 2010.
[5] Hidden Markov Models as a Support for Diagnosis: Formalization of the Problem and Synthesis of the Solution. A. Daidone, F. Di Giandomenico, S. Chiaradonna, and A. Bondavalli, in 25th IEEE Symposium on Reliable Distributed Systems, 2006. SRDS’06, 2006, pp. 245–256.
[6] Queueing Theory – A Linear Algebraic Approach. L. Lipsky, 2nd ed. Springer, 2009.
,,