assessing the link between natural disasters and poverty: the
TRANSCRIPT

United Nations Development Programme
Regional Bureau for Latin America and the Caribbean
On Shaky Ground: The Effects of Earthquakes on
Household Income and Poverty
Javier E. Baez*
Indhira V. Santos**
December, 2008
Document prepared for the ISDR/RBLAC Research Project on Disaster Risk and Poverty. This
document is part of the Latin American contribution to the Global Assessment Report on Disaster
Risk Reduction, and the Regional Report on Disaster Risk and Poverty in Latin America. The terms
natural disaster and climate-related events will be used interchangeably, understanding that
socioeconomic conditions play a role to explain the intensity and consequences of such phenomena.
Thus, no event is strictly or exclusively natural.
The World Bank and IZA ** Bruegel.
The opinions expressed here are of the authors and not represent those of the RBLAC-UNDP.
Please cite this document as: Baez, J. and I. Santos. 2008. “On Shaky Ground: The Effects of
Earthquakes on Household Income and Poverty”, RPP LAC – MDGs and Poverty – 02/2008, RBLAC-
UNDP, New York.
Research for Public Policy
RPP LAC – MDGs and Poverty – 02/2008

2
"On Shaky Ground: The Effects of Earthquakes
on Household Income and Poverty"
Javier E. Baez
World Bank and IZA
Indhira V. Santos
Bruegel
December, 2008
Draft Paper
The devastating consequences of large natural disasters on socioeconomic systems are evident to all.
Yet, little is really known about the magnitude of such negative effects on human development. For
several reasons, El Salvador --the smallest country in Central America—is very susceptible to the
effects of repeated and severe natural hazards. We use two strong earthquakes that struck El Salvador
in early 2001 together with longitudinal data in a quasi-experimental fashion. Our strategy exploits
the exogeneity implicit in the intensity of the geological events which is defined by their seismic
parameters, the geographic coordinates of the dwellings and the predominant soil types of the
villages. We find that the combined effect of both earthquakes is associated with a reduction in
household income per capita of one third of the pre-shock average for households in the upper half of
the ground shaking distribution There is also an increase in the depth and severity of poverty,
although less significant in statistical sense. The results also highlight that the pervasive effects of
natural disasters are likely to persist in the medium- and long-term. Overall, our findings do not
appear to be driven by differential trends at pre-shock time, econometric specifications and methods,
and sample attrition. Furthermore, we argue that the results are still informative when the empirical
design is confronted with the issues of measurement error in the indicator of treatment intensity or
aggregated equilibrium effects.
__________________________
* Special thanks go to Alberto Abadie, Jeffrey Liebman and Rohini Pande for helpful discussions and insightful comments to
previous work that largely motivated this paper. We are also thankful to geologists at the Structural Geology and Earth
Resources Project at Harvard, mainly Charles Brankman and Judith Hubbard. We also thank comments from Luis Felipe
Lopez-Calva and participants at the “Disaster Risk-Poverty Regional Workshop” held in Bogota and Mexico. We acknowledge
financial support from the Latin American Regional Bureau of the United Nations Development Program. The views and
conclusions do not necessarily represent the position of Bruegel or the World Bank or its member countries. Any remaining
errors are our own. Authors can be contacted at: [email protected] or [email protected]
3
1. Introduction
The world has witnessed an increase in the frequency and severity of natural disasters in
the last two decades. Such prevalence of natural hazards has disrupted social and economic
systems in a variety of ways. The adverse impacts range from human casualties, epidemics,
disabilities, dislocations and direct damages on critical infrastructure and physical capital to
potential losses in income, drops in consumption and reductions in human capital accumulation.
In contrast, inflows of resources channeled through national and international reconstruction
efforts in the aftermath of extreme natural events can increase and improve the stock of public
and private capital and revive several dimensions of human welfare –even when compared to
their pre-disaster levels. Furthermore, and in line with findings from standard neoclassical
models, regions have often experienced strong and sustained economic growth after being
struck by a large natural disaster.
At first, based on common observation, the combined effects of large disasters are expected
to hinder development in the short-term and probably to persist –at least to some extent– in the
long-term. Yet, establishing whether communities are worse off or better off as result of extreme
natural events is above all a subject that can only be resolved empirically. But while the
occurrence of a given natural disaster is largely exogenous, the impact that it has on the
population is not. The deprivation that characterizes the lives of the poor –and their attainable
choices– exacerbates the potential effects of natural disasters. It is for those families living along
rivers or in steep slopes, in housing with inappropriate walls or roof and with fragile health and
low education that these events represent the biggest risk. Likewise, the occurrence of natural
disasters intensify these deficiencies by destroying crops and livestock, reducing incomes and
consumption, and forcing households to liquidate assets and take steps that may curtail current
and future human capital accumulation.
In addition to this two-way causal story, other potential issues can confound any
association between human welfare and the vulnerability to natural disasters: varied
institutional capacity, location of settlements, economic cycles and individual choices (e.g.
migratory responses to shocks), among many others. Besides, the lack of proper data makes it

4
hard to undertake solid strategies and robust micro-econometric methods. Therefore,
disentangling the causal impacts of natural disasters on human development is rather a complex
empirical task. In this paper, we attempt to overcome these concerns by exploiting two seismic
events that hit El Salvador in 2001 in a quasi-experimental fashion.
El Salvador is by area the smallest country in Central America but its economy –measured
by the GDP– is the third in importance in the region after Costa Rica and Guatemala. Despite
noticeable progress in past years, El Salvador was one the poorest countries in Latin America at
the time of the quakes, with nearly 31% (update) of the population under extreme poverty in
2000. This degree of poverty was compounded by limitations in critical infrastructure, partial
access to social services, low levels of schooling and profound informality in the labor market,
especially in rural areas of the country. Yet, two factors have marked the recent economic and
social Salvadorian history: civil conflicts and natural disasters. Despite the fact that the war
officially ended at the beginning of the 1990’s, the country remains very susceptible to the effects
of repeated and severe natural events.
The vulnerability of El Salvador to natural hazards is explained by several factors. First, the
country has the highest population density among all the countries in Central America. Second,
several major population settlements are located along six active volcanoes and in areas highly
exposed to geological hazards such as the earthquake-prone Ring of Fire. In fact, El Salvador has
been struck by a major quake, on average, once every ten years during the last century. Third,
the country is located in the sub-tropical hurricane area and, thus, is subjected to both Atlantic
and Pacific storms. The floods triggered by these storms are at times followed by extended dry
periods with significantly below average precipitation.
Two strong earthquakes and a number of smaller follow-ups struck El Salvador in early
2001. These earthquakes and related landslides produced a death toll of more than 1,200 people,
affected nearly 300,000 dwellings (about 32% of the existing housing stock) and caused US$1.6
billion in direct and indirect damages (12% of GDP in 2000).1 Our empirical analysis is aimed at
identifying and quantifying the net impacts of these geological shocks on household income and
1 Economic Commission for Latin America and the Caribbean (CEPAL, 2001a).

5
poverty as well as exploring their possible consequences for long term human and economic
welfare. We also test some of the channels of transmission to provide some insights into the
mechanisms at play. Overall, identification is attained essentially from two specific features of
these shocks: (a) the quasi-exogenous location of the earthquakes and, (b) the quasi-exogenous
variation in treatment intensity derived from the degree of ground shaking and depth of the
earthquakes. We implement this strategy with pre- and post-shock data from four rounds of
longitudinal surveys collected in rural areas of El Salvador (approximately 700 households) and
data on the geological parameters of the earthquakes to construct measures of ground shaking,
i.e. intensity.
We find that the combined effect of both quakes is associated with a reduction of $1,760
colones in household income per capita –one third of the pre-shock average– for households in
the upper half of the ground shaking distribution. Back-of-the-envelope calculations suggest that
this decline in rural incomes roughly amount to the gains of economic growth that these
households achieved during the prosperous decade of the 1990’s. Although the results do not
show a statistical significant increase in the poverty headcount ratios among highly affected
households, other measures more likely to capture the impoverishing effects of the two disasters
such as the poverty gap indicate that there was an increase in the depth of poverty. We also
show that these findings are not driven by external issues not related directly with the impacts of
the earthquakes such as differential trends between experimental groups at pre-shock time,
econometric specification and methods or sample attrition. Furthermore, we argue that the
results are still informative when the empirical design is confronted with the issues of
measurement error in the indicator of treatment intensity or aggregated equilibrium effects.
The fall in income seems to be explained by <.. (complete this with the mechanisms).
These results together with previous findings highlight that while natural disasters have a
pervasive impact on poverty in the short term, the most dangerous effects are those that reveal
themselves only in the medium to long term. Children in households highly exposed to the 2001
earthquakes in rural El Salvador became differentially less likely to attend school as the
probability of enrollment decreased by 6 percentage points, a fall of 7% (Santos, 2007). The

6
evidence for El Salvador indicates, therefore, that sufficiently large natural disasters are likely to
have a long term and inter-generational impact on poverty, unless public policy plays both a
prevention and mitigation role.
The remainder of the paper is organized as follows. The next section summarizes the
existing empirical evidence that investigates the influence of natural shocks on socio-economic
conditions, gives background information on El Salvador at the pre-shock time and describes the
earthquakes of interest for this study. The third section presents and discusses the data, the
identification strategy and findings of the natural experiment arising from the earthquakes as
well as a series of robustness checks. Next, we examine some of the channels through which the
effects were transmitted and provide interpretation for our results. Finally, section five
concludes, focusing on the implications of the findings for the literature on risk and household
welfare, natural disasters and public policy.
2. Background
2.1. Relevant Literature
Not surprisingly, the rising prevalence and severity of natural disasters has increasingly
caught the attention of scholars in a variety of fields. Yet, the empirical side of the literature that
examines the potential causal impoverishing effects of these events for specific segments of the
population is rather scant. The main reason is probably that disentangling these impacts in a
credible way has long proved challenging. This task requires not only datasets that span many
object categories but also identification strategies that exploit suitable variation in exposure (or
intensity) to natural disasters. Often, both are hard to obtain.
What is empirically known to date in regard to the link between natural disasters and
poverty emerges basically from two strands in the literature. First, there is the dominant
approach which has examined the effects of these events on country-level variables such as GDP,
GDP growth, indebtedness, inequality and damages to the environment (Charveriat, 2000; IADB,
2000, CEPAL, 2001). Overall, this literature has highlighted the pervasive impacts of exposure to

7
natural shocks on these aggregate measures in short- and middle-run, in particular the heavy toll
in terms of the share of the GDP. Studies of this type have gathered information to document
that, for instance, the damages of the floods of Guyana (2005) and Bangladesh (2004) added up
to almost 58% and 12% of their annual GDP, whereas the losses arising from the earthquake in
Pakistan (2005) and the tsunami in Sri Lanka (2004) accounted for 5% and 7% of their GDP,
respectively (International Strategy for Disaster Reduction, ISDR, 2008). As for Latin America,
Charveriat (2000) estimated that the annual average cost of natural disasters in the region for the
period 1970-1999 was between $700 million and $3.3 billion (put this number in context).
Similarly, other works that have used different metrics to assess the impacts have also stressed
the costs in terms of lives, people’s disability and injuries and livelihoods affected. All agree that
the impacts are enormous and they are unequally distributed, with the poor and most
vulnerable carrying most of the burden of the costs.
The second approach comes from a parallel and growing interest in the literature on
microeconomic development to investigate the human welfare consequences of shocks, either
natural (e.g. climate-related disasters) or man-made (e.g. economic downturns, conflicts). This
body of research has explored the impacts of these phenomena on many different but related
household and/or individual level responses: the ability of households to smooth consumption
(Deaton, 1992; Paxson, 1992; Townsend, 1994 & 1995; Jalan et al., 1999, Morduch, 2002; Skoufias,
2002), the production and investment behavior of farmers (Biswanger et al., 1993; Rosenzweig et
al. 1993, Fafchamps et al., 1998; Kazianga et al., 2006), labor supply adjustments (Cunningham,
2001; World Bank, 2003), child labor (Beegle et al, 2003; Vakis, et al., 2004), school attendance
(Jacoby et al., 1997; De Janvry et al., 2004), nutrition and health outcomes (Foster, 1995; Jensen,
2000; Hoddinott et al., 2000 & 2001), and migration (Jalan et al., 1999). Overall, these studies have
long stressed the negative effects of these events on welfare, in particular for poor, credit
constrained and uninsured households.
Yet, just a few papers focus specifically on the susceptibility of different dimensions of
human well-being to major disasters. For instance, Foster (1995) shows that the growth of
children in landless and credit constrained households was severely affected by very destructive
floods that struck rural Bangladesh in 1988. Ureta (2005) finds a worsening in school retention

8
and progression in some areas of Nicaragua that were hit by Mitch, a category five hurricane
that hit the country in 1998; a deterioration in the nutrition status of young children and an
increase in the prevalence of child labor associated to this hurricane was also identified by Baez,
et al. (2007), even three years after the phenomenon occurred. As for the effects geological risks,
in previous work Santos (2007) found that the 2001 earthquakes in El Salvador reduced school
attendance and changed the allocation of children’s time towards more work outside of the
household –and for longer hours. To the extent that a lower accumulation of human capital
roughly means a lower future income, this evidence suggests that natural disasters can even
have long-lasting impacts on poverty rates through the inter-generational transmission of these
effects.
Three additional general features characterize the majority of the literature on the subject
and help illustrate the contributions of our work. First, most of the papers have looked at shocks
–or proxies of them– that produce transitory fluctuations in income. Therefore, with few
exceptions, existing work has ignored that large and aggregate disasters such as hurricanes,
floods and earthquakes have also wider effects on household assets and community resources.
Consequently, they can underestimate the magnitude of the impacts, attribute the effects to
drops in income solely or ignore their stronger persistence in the middle and long run. More
precise knowledge about these interactions and dynamics is crucial for the design of disaster aid
policies. Second, most of the findings from works that look exclusively at natural disasters rely
on reduced form estimates –mainly for data reasons– but do not provide insights into the
mechanisms of transmission. Finally, even though most of these studies have assessed the effects
of shocks on the proximate determinants of poverty, none –to the best of our knowledge—has
directly tested the possible impoverishing consequences of these events, especially for the Latin
American context. We attempt to do so in the next sections.
2.2 El Salvador before the Shock
The end of the civil war in 1991 brought an inflection point for the future socioeconomic
progress of El Salvador. Immediately after, a number of structural economic reforms were
enacted with the aim of achieving macro-economic stability, introducing the foundations for free

9
markets and integrating the economy to global markets. Following these reforms, the economy
expanded at an annual rate of 6 percent on average during the first half of the 1990’s, much
faster than previous years. Growth rates declined between the mid 1990’s until 2001, in part due
to a coffee crisis (a major source of income for a large fraction of rural households), a strong
hurricane and other domestic economic shocks, but they still remained well above their pre-war
levels. In all, the political, social and economic transition of the 1990’s allowed the country to
achieve substantial social and economic progress through higher incomes, education levels,
coverage of basic services (e.g. water and electricity), and better health outcomes (e.g. life
expectancy and infant mortality) and nutrition.
This success was accompanied by a remarkable reduction in poverty before the
earthquakes. The proportion of people below the poverty line fell from 64% in 1991 to 39% by
2000, whereas the corresponding measure of people in extreme poverty declined by 15
percentage points during the same period –from 31% to 16% (World Bank, 2004). By 2000, El
Salvador had a per capita income of US$2,326 (constant 2000 US$), higher than neighboring
Guatemala, Honduras and Nicaragua’s. Yet, these achievements were not homogenously
distributed between urban and rural parts of the country. Poverty was considerably higher in
the latter, where over half of the people were poor by 2000 and about 25% lived under extreme
poverty, almost twice the average ratio of urban centers. Similarly, there was substantial
variation in poverty decline at the state level, with some departments such as Cuscatlan, San
Miguel, Morazan and San Salvador having much less success on this front.
This economic and social transformation has been accompanied –and probably debilitated–
by a long history of natural disasters. The country is geographically positioned in an area
subjected to a large variety of hazards such as earthquakes, droughts, hurricanes, floods,
volcanic eruptions and mudslides. The prevalence of geological disasters is a good case in point.
El Salvador is located on the Pacific’s Ring of Fire –an area of regular seismic events and volcanic
activity– and has been confronted with a major earthquake on average once every ten years
throughout the last century. Three major seismic shocks hit the country between mid 1980’s and
early 2000’s. The geological risks are further compounded by relatively frequent volcanic
eruptions. Its location in the sub-tropical hurricane area also makes El Salvador highly exposed

10
to storms and cyclones originated in the Pacific and the Atlantic. During the five years before the
earthquakes studied in this paper, the country was hit by two powerful hurricanes: Cesar-
Douglas in 1996 and Mitch in 1998. In addition to the enormous amounts of precipitation
dropped by these events, yearly floods and mudslides are often triggered by erratic periods of
heavy rains. El Salvador has also dealt with extensive periods of rainfall well below average
precipitation like the drought that affected large areas of subsistence crops and arable land
between 1998 and 2000 and became the worst drought to hit Central America in recent years.
El Salvador’s vulnerability to natural hazards is further compounded by a combination of
existing social and economic factors. First, in addition to its high population density, numerous
urban and rural settlements are located in areas with particularly high risks of volcanic activity,
earthquakes and hurricanes.2 Unsurprisingly, the human and economic costs that arise when
natural disasters strike are relatively higher than in neighboring countries. Second, and despite
its recent economic advance, still many social challenges prevail. Low levels of education and
income, limited access to basic social services, unsafe settlements, low-quality housing and
precarious infrastructure increase the vulnerability of some individuals, especially the poor.
Third, a big part of the country relies on agro-economic activities to derive their incomes, which
are vastly dependent on natural conditions and thus, highly volatile. Finally, the country lacks
reliable and integral systems of risk identification and disaster preparedness that could reduce
its vulnerability considerably. Therefore, it is against this scenario of economic growth, prevalent
natural hazards and variation in vulnerability that we test whether the two strong earthquakes
of 2001 worsened the standards of living of those mostly affected by these shocks.
2.3 The Earthquakes of 2001
On January 13, 2001, just after 11:30 am many Salvadorians were shaken by a major
earthquake of magnitude 7.7 in the Richter scale and a number of subsequent follow-ups. The
second phenomenon, which compounded the negative effects of the January event, struck on
February 13 and had a magnitude of 6.6 in the Richter scale. Figure 1 shows the location of the
2 With approximately 330 inhabitants/km², El Salvador is the most densely-populated country in Central America and
the second in Latin America after Puerto Rico.

11
epicenters of both earthquakes. In the January event, the most affected departments were
Usulután, La Paz and San Vicente, but the whole country was affected to some extent. The
February earthquake, in contrast, generated damages in a smaller area. The most damages were
concentrated in the departments of La Paz, San Vicente, San Salvador and Cuscatlán, although
the effects of the January event were accentuated in the neighboring regions.
The series of earthquakes and related landslides had a combined death toll of more than
1200 people, affected an estimated 300,000 dwellings (approximately 32% of the existing housing
stock in the country) and caused US$1.6 billion in direct and indirect damages (12% of GDP in
2000). The total losses produced by the earthquakes were equivalent to the economic growth that
El Salvador had accumulated during the four years before the events (UNDP Human
Development Report, El Salvador, 2001). Table 1 presents information by economic sector on the
total value of the direct and indirect damages due to both earthquakes.
(creo que falta un poco aca)
3. Empirical Analysis
3.1 The data
We use panel data from the BASIS El Salvador Rural Household Surveys, comprised of
four biennial questionnaires with approximately 700 households and covering between 1996 and
2002. These surveys were organized and conducted by the Salvadorian Foundation for Economic
and Social Development (FUSADES by its Spanish acronym) with the support of the World
Bank. The BASIS surveys did a good job in following households that moved within El Salvador,
especially since 1998.3 In 1996, 628 families were interviewed, while in the 1998 round, 494
households of those included in the first round (1996) were re-interviewed. In addition, in 1998 –
in order to make the sample nationally representative once again– 25 families similar to those
who left the sample and other households were added for a sample size of 623 families. After
1998 attrition was very low. In 2000, only 4.7% of the 1998 households left the sample, while
3 When the survey started in 1996, it was not planned to have other waves in the future with the same households and,
as a result, there is a larger attrition between 1996 and 1998 (21.3%) than between the following years.
12
between 2000 and 2002 only 24 out of 696 household dropped out (3.4%).4 In general, there are
451 households that took part in the four waves. In this study, we primarily make use of the last
two rounds of the survey, namely 2000 (year before the earthquakes) and 2002 (year after the
shock) to identify the impacts of the earthquakes on household incomes and poverty.
Like most of the household-level surveys conducted in developing countries, the BASIS
collect detailed information –only in rural areas– on household and individual demographics,
employment, household income, assets, savings and other related data corresponding to the
preceding calendar year. In addition to that, the 2000 dataset includes the geographic
coordinates for each dwelling in the sample which we use in our identification strategy. In turn,
the fourth round (fielded in 2002) also has detailed information on the impact of the earthquakes
at the household level (in terms of income, assets, health, etc.), as well as module with the
actions undertaken to cope with the consequences of the shocks.5
The panel data for 2000 and 2002 covers 14 departments and 162 municipalities and 653
rural households. Selected descriptive statistics of the households in the sample for 2002 (the
pre-disaster year) are summarized in Table 2.6 Families in the sample, as is often the case in rural
areas of developing countries, are poor and vastly dependent on agriculture. The median annual
income per capita of the households is $3,444 colones or US$394 and in 2000, 34% of the
households were living in extreme poverty as they were not able to afford a basic basket of food,
while 17% more lived in relative poverty as they could afford one but not two baskets of food for
each one of its members. 70% of households have at least one member working in the
agricultural sector and, on average, more than one quarter of households’ income depends on
agriculture, which suggests that there was a non-trivial degree of income diversification among
the households in the sample. Remittances also account for an important source of income, with
28% of the households receiving remittances that represented three quarters of their total
income.
4 These 24 households – 14 which would have been in the treatment group, as examined with 1998 and 2000 data, do not
systematically differ from the other households in their group in terms of household and individual characteristics
expected to be associated with our outcomes of interest. 5 Further information from the BASIS survey is available at http://www-agecon.ag.ohio-
state.edu/programs/RuralFinance/Basis.htm 6 All monetary values are expressed in 1996 colones.

13
Households have nearly 6 members and the head is poorly educated, with less than five
years of schooling on average. In addition, less than a quarter of the households have any
savings and only half report ever having any type of credit –formal or informal. This means that,
if faced with a large negative shock like a natural disaster, many of these households have very
limited capacity to smooth consumption in the aftermath of such an event through capital
markets. The ability of their dwellings to withstand natural hazards is also fairly limited, and the
construction materials most often used –adobe and bahereque– are ill-prepared for strong winds,
flooding or strong ground shaking. Similarly, only 44% of households have a private source of
water and 68% have electricity.
In short, the longitudinal nature of the BASIS dataset, together with the richness of
information in terms of the socio-economic and demographic characteristics of the households,
make this survey well-suited for investigating the impact of the 2001 earthquakes on incomes
and poverty. In the next subsection, we describe our empirical methodology and how we exploit
the data available to provide a causal story of the microeconomic effects of the quakes in El
Salvador.
3.2 Identification
The main objective of this paper is to isolate the causal effect of the 2001 seismic events on
rural household incomes and poverty in the short-term.7 Although ideal, it is impossible for
obvious reasons to achieve this goal with a strategy that relies on a fully experimental
randomization. Instead, we attain identification through the exogeneity implicit in the intensity
of the shocks which is defined by the parameters of the earthquakes, the geographic coordinates
of the dwellings and the predominant soil types on which the villages were located. These
variables are combined in a way that allows us to construct measures of the ground shaking (i.e.
7 Although from a welfare standpoint, households are more interested in consumption than in income, the BASIS
dataset only contains information in the latter. However, in an environment like that of rural El Salvador, where credit
and insurance markets are highly imperfect, income could be taken to represent a good proxy for consumption.

14
intensity) experienced by each household and, thus, determine the experimental groups in our
study. 8
Both the January and February quakes were well recorded by three accelerograph
networks in El Salvador and peak ground acceleration (PGA) data are available for 31 stations
throughout the country (Cepeda, et.al, 2001). PGA indicates the ground strong motions –the
shaking– to which a location is exposed and depends mainly on the characteristics (i.e.
parameters) of the seism (magnitude, depth, duration, spectral distribution of the movements),
distance to the epicenter, the quality of the construction and the response of the local soil (soft
terrains amplify the shaking). PGA values –measured as a percentage of gravity acceleration–
between 0.25 and 0.45 are associated with earthquakes that are “destructive” (i.e. partial collapse
in substantial buildings and great damage in poorly constructed ones); 0.45 – 0.60 with events
that are “ruinous” (i.e. buildings shifted off foundations and considerable damage to even
specially designed structures); 0.60 to 0.80 with “disastrous” quakes (i.e. some well built
wooden structures destroyed; most masonry and frame structures destroyed with
foundation); 0.80 to 0.90 with “very disastrous” events (i.e. few, if any masonry structures
remain standing) and above 0.90 with “total damage” (UCGS, 2007).
To construct the indicator of the shock, we first regress the strong ground motions of the
stations on their distance to the quake’s rupture and the station’s soil type. The resulting
attenuation relationship for each earthquake, together with the geographic coordinates for each
household prior to the shocks, is used to estimate the shaking that each household was subject to
during the 2001 earthquakes. This yields an indicator that is defined to be in the (0, 1) interval
and ranges between __ and __ in our sample. The measures constructed are used in two ways. In
a first specification we exploit the variation in earthquake intensity to identify the marginal effect
of ground shaking on the outcomes of interest. Second, we define two groups based on the
household’s relative position in treatment index distribution. According to this, we define a
household to be part of the “high intensity” group if it is among the upper half of households in
the sample exposed to the hardest shaking as measured by the sum of the earthquakes ground
motions. The “low intensity” experimental group is defined likewise based on the bottom half
8 For a more detailed description of this measure, see Santos, I. (2007), where this methodology was first developed.

15
portion of the distribution. On the basis of this, out research design is not using “clean” and
“immune” counterfactuals that were completely unaffected by the shock as the source of
identification but rather comparison groups derived from variation in exposure to the power of
the events.9 This has important implications for the interpretation of the results and the messages
extracted for policy action.
Of the 653 panel households present in both 2000 and 2002, 328 form the “high intensity”
experimental group, which we call treatment group from hereon. On average, households in the
treatment group experienced a peak ground acceleration of 0.7 g (70% of the acceleration of
gravity), compared to 0.32 g in the control. Table 1 presents the summary statistics of key
variables, broken down by treatment status. There are no significant differences between the
households hardest hit by the quakes and those in the comparison group in terms of most key
socio-economic indicators such as median household income per capita, age, schooling and
gender of the head of household, wealth indicators or access to credit.
This comparison, however, shows that those households exposed to more intense ground
shaking have a lower probability of having savings and a migrant relative. To the extent that
these characteristics influence the effect of the shock in our outcomes of interest, results could be
biased. The observed pre-shock differences, however, disappear once one includes geographical
controls. The earthquakes mostly affected Central and Oriental regions, and therefore western
departments in the Occidental region are not represented in our treatment group. Since
departments in El Salvador are quite heterogeneous, this translates into differences in some
characteristics of the treatment and comparison groups.
In short, controlling for the geographic composition of our sample, there are no observable
pre-shock differences between those households exposed to the shock and those in the
comparison group. This result suggests that the latter can be considered a suitable counterfactual
of the “high-intensity” group based on the balance of most covariates examined. In the
multivariate analysis that follows, as described below, we control for the pre-shock
9 This is more the rule rather than the exception for studies of this type. Since good and credible comparison groups for
households affected by large and aggregated shocks are difficult to find, variation in intensity is in practice the most
common –and often– only source of identification available.

16
characteristics mentioned previously and include municipality fixed effects as well as
department and year interaction effects.
3.3 Empirical Specification
The empirical strategy discussed above is implemented with a double-difference (DID)
analysis and seeks to investigate the impact of the 2001 earthquakes on households’ income and
poverty in rural El Salvador. Since variation in the outcome variables between 2000 and 2002 can
be due to other factors not related to the seismic shocks, we include additional controls related to
household initial socio-demographic and economic characteristics. In addition, these controls
allow us to take into account that some of the pre-shock differences in the sample –mainly
geographic– could give rise to different underlying trends biasing the results. We use linear
probability DID models for the dichotomous outcomes of interest –mainly extreme and relative
poverty- and OLS and fixed effects DID models for estimating the response of household income
to the earthquakes. The main specification takes the following form:
imtitttitmimt ZxTTxtTtXY )()( 0432201 (1)
The unit of observation is household i in municipality m in year t (1 if 2002, 0 otherwise).
T identifies the treatment and comparison groups and, as noted before, is defined as a binary
index (1 if treatment, 0 otherwise) or as continuous intensity measure that varies between 0 and
1. Y represents each of the outcomes of interest. All regressions include municipality fixed
effects, m , and pre-shock socio-demographic controls Xit=0: head of household’s education, age
and gender; household size, dwelling’s wall materials, distance to closest school and paved road,
crops cultivated and type of soil where the dwelling is located. Other controls include dummies
for whether the household owns business, works in agriculture, has animals, owns land, has
electricity, has indoor plumbing or private well, receives public aid, has credit, has savings, has a
migrant relative, receives inter-household transfers. The coefficient of interest is 3 , which
captures the specific average variation in the outcomes of treated households between 2000 and

17
2002 with respect to the controls. Standard errors are robust and clustered at the municipality
level.
Z it=0 is a sub-set of vector X with household characteristics for which we estimate
interaction effects. In particular, we include departmental and year interactions to account for
differential geographic trends in the outcomes of interest and departmental and shock
interactions to control for possible differential impacts of the shock across departments.
Additionally, the most complete specification includes other interaction terms in order to check
for differential effects of the earthquakes depending on household composition, crop-grown,
initial wealth and pre-shock access to other risk coping mechanisms such as credit and
remittances. Lastly, imt is a assumed to be mean-zero error term. The results of these empirical
models are presented in the next section.
3.4 Results
Income and Poverty
We initially focus on quantifying the aggregated effect of the two geological shocks on
household income per capita.10 The economic growth experienced in El Salvador since the 1990s,
(briefly documented in Section 2.2) means that there were rapid reductions in poverty and an
overall improvement in living standards during this period. This situation is no different for the
rural households in our sample. Between 2000 and 2002, average household income per capita
increased from $5,449 to $6,957 colones in real terms, while poverty rates fell from 33.8% to
26.6% in the case of relative poverty and from 16.8% to 16.2% for extreme poverty.
Despite that the treatment and comparison groups start from similar levels, the growth in
average incomes was larger for the households less affected by the shock, making the effects of
10 Our measure of household income is constructed by adding: 1) net agricultural income from agricultural production
(using the market price of all production if consumed or sold), animals (using the market price of animals sold,
derivates), salaries received for agriculture work, and other income (rent from land, tools, etc.) - minus the cost of the
inputs used, salaries and other related costs such as land rent; 2) net non-agricultural income from own business,
salaries in non-agro jobs and other income such as housing or car rent, interest or pensions; 3) inter-household and
public transfers from inside and outside of El Salvador.

18
the earthquakes already apparent in the raw data. Simple DID models (with no covariates)
indicate that the earthquakes are associated with a reduction of $1,760 colones in household
income per capita or one third of the pre-shock average for the whole sample (specification (i) in
Table 2). We also incorporate these exercises into a multivariate analysis. The magnitude and
statistical significance of the effect is maintained, with the most conservative estimate –
specification (iii) that includes multiple interaction terms– associating the earthquakes with a
$1,709 colones fall in annual household income per capita. Interestingly, the negative average
effect of the seismic events rises by 19 percent ($325 colones) when public transfers (likely
endogenous) are excluded from the income calculations.
Our results so far have shown that the geological events resulted, on average, in a
substantial loss of income for treated households relative to comparison households. Yet, these
impacts appear to vary across the income distribution. Building on the seemingly exogenous
variation in treatment intensity presented above, we constructed non-parametric distributions of
household income per capita for treatment and control groups at the pre- and post-shock times
(Figure 2). For our purposes, the main insight from these graphs is that, whereas the
distributions overlap almost completely before the earthquakes hit El Salvador, there is a clear
departure between the two in the period after the events. This shift left the group of treated
households worse-off vis-à-vis their counterparts in the comparison group, which is particularly
evident for those with after-shock incomes (annual per capita) up to $8,000 colones. However, it is
important to note, that the “worsening” of the income distribution is only relative to the
potential level, as the income prospects have improved significantly for both groups during the
period under study.
We next move to investigate the impacts of the earthquakes on poverty. The distributional
analysis discussed above hints at an increase in the prevalence of poverty among the most
affected households. In fact, as shown in Table 2, the direction of the estimates suggests that
more people in this group fell below the poverty lines, especially for the measure of relative
deprivation. However, they are not significant in statistical sense. Part of the reason may be
explained by the limited power of our empirical models to capture a visually apparent but
19
marginal increase in poverty due to a relatively low number of observations (656 after-shock
observations), in particular around the poverty thresholds. Related to this, the other plausible
interpretation is that the earthquakes had a minor impact on poverty but overall affected
considerably the standards of living of a group of low-middle- and middle-income rural
households in El Salvador. Indeed, as the kernel densities show, most of the worsening in
incomes is suffered by household gathered above the poverty lines and around the median
income household. [meter los resultados que usan las otras medidas de pobreza y el indicador
continuo]
Potential Long-Term Effects
Up to now we have documented an instant reduction in rural income associated with the
intensity of the earthquakes. The next natural question is to examine whether such impacts could
persist in the longer horizon and are transmitted across generations. However, since 2002 is the
last year available in the BASIS dataset, one need to focus on the possible impact of the
earthquakes on household assets (physical and human) to get an indication of the medium and
long-term effects. As it will be illustrated below, we argue that the pervasive effects of the
natural disasters are likely to extend beyond the immediate effects presented above. Indeed,
some simple statistics suggest that they could have a permanent effect on people’s budget
through the loss of productive assets, the diversion of investment resources towards current
consumption and a reduction in investments in human capital.
We initially approach this subject by examining the consequences of the shock on
productive resources and other physical assets, both through the direct damaging effects of the
quakes and the responses of households to cope with their impacts (e.g. liquidation of assets).
The BASIS questionnaire collects information on the asset losses suffered by households,
including housing and other buildings, land, home furniture and appliances, agricultural and
non-agricultural machineries and tools, inventories and productive animals (Table 5). Nearly
two thirds of the households in the sample suffered asset losses. Conditional on having
experienced a loss, the median value of the total losses was $1,840 colones or 9% of the pre-shock

20
median household income. As expected, households in the treatment group experienced more
severe damages. The proportion of households declaring asset losses is higher in the treatment
(70%) than in the control group (56%). The median value of the losses suffered is twice as high in
the experimental group ($2,400 versus $1,440 colones among the control households). The
destruction caused by the earthquakes is also reflected in the damages suffered by the existing
infrastructure, in particular housing. With 56% of the dwellings built out of materials with low
resistance to seisms (e.g. adobe and bahereque), it is not surprising that one third of households
in our sample report experiencing severe damage to their dwelling, including the case of its total
destruction or when it was rendered inhabitable.
In the aftermath of the shock, households carried out a series of actions in order to maintain
their level of consumption and finance reconstruction activities. Some of these responses imply
that households liquidated critical means of production. For instance, 9.3% of households had to
sell productive assets –animals or land– and 1.07% report having sold other assets. Similarly, a
large fraction of households had to use their savings (20.5%) or borrow money (14.2%). Even
though the latter is in theory an optimal response to smooth consumption, what the data seem to
indicate is that part of these resources were not aimed at balancing out transitory spending and
saving but increase the accumulation of future assets. For example, 7.5% of households cite
having stopped or cancelled investments in physical capital and 23.7% having saved less as
strategies to deal with the consequences of the quakes.
Finally, and perhaps more importantly, the two geological events had negative impacts on
human capital accumulation in children and, therefore, on future income prospects of the
affected population–and possibly of the rest of the economy. With limited access to credit and
insurance markets, it seems plausible that the income and asset shock illustrated above force
households to withdraw children from schools (Basu, 1999; Jensen, 2000; Baez & Santos, 2007).
Indeed, going to school is not cheap in El Salvador. Data from the BASIS survey for 2000 reveals
that rural households with children in El Salvador spend on average $754 colones per year on
school expenses (including uniforms, books, tuition, transportation and food), equivalent to one

21
third of the median household income.11 After the shock, 4% of rural households with children in
the BASIS dataset report that the earthquakes left them with no money to send children to
school.
For a more rigorous take on this issue, and drawing on results from Santos (2007), we focus
on the impact of the shaking of the earthquakes on children’s school enrollment as a proxy for
the future accumulation of human capital.12 Still using the BASIS dataset, we limit our sample to
children aged between 6 and 15, and follow the same design exploited so far. Results are
summarized in Table 7. At baseline 83.6% of children in the treatment households and 77.3% of
control children were enrolled in school. While the rate seems to have increased for both groups,
the change is much more marked among children in the comparison areas, increasing by about 5
percentage points. When moving from a simple DID to a multivariate model, the estimated
effect of the earthquakes on enrollment not only stays almost intact to the inclusion of
household-level covariates but it is also strengthened when departmental and year interaction
effects are added (significant at the 5 percent level).
3.5 Robustness Analysis
A number of factors associated with the nature of the shocks and our research design can
threaten the internal validity of this study. In what follows we either test or intuitively discuss
the robustness of the causal relationships from the empirical models to these issues. We start by
assessing the exogeneity of the implicit quasi-experiment that defines the treatment and
comparison groups. Essentially, the validity of our instrument emerges from the exogenous
nature implicit in the determinants of the treatment intensity: earthquakes’ magnitude, distance
to the epicenters and geological conditions of local soils. Furthermore, such orthogonality has
been tested indirectly throughout the paper when comparing the sensitivity of the parameters
between the simple DID and the extended models with the inclusion of covariates. Largely
consistent with results from the test of balance in pre-shock covariates, the coefficients of interest
11 The official annual national household survey reveals that, among children in rural areas who should be enrolled in
school but are not, 20% did not go to classes because they needed to work, 16.8% of the cases were attributed to
household economic difficulties while 17.1% responded that schooling was too expensive. 12 Citar trabajo de Vakis sobre la alta probabilidad de que los ninos no vuelvan a la escuela

22
remain mostly unchanged across models. Then, by design, our strategy would be contestable by
time-varying and unobservables –or unmeasured– factors that are correlated with the intensity
of ground shaking. These correlations seem very implausible.
Next, we test the underlying assumption of our models in the sense that any differential
changes in the outcomes between treatment and comparison groups are attributed exclusively to
the intensity of the quakes and not to other pre-existing factors. This source of bias is
investigated directly with two waves of pre-shock longitudinal data from the BASIS project
collected in 1998 and 2000, the latter being the baseline information used in the main empirical
models. Given that the seismic events hit the country in 2001, we run a placebo test for the
period 1998-2000 for which basically all households become part of the control group. We test
the hypothesis of no “treatment effect” during the pre-shock interval, namely that the treatment
indicator (either the binary or continuous definition) is not statistically different from zero.
Indeed, the results of this exercise indicate the findings presented above were not driven by any
underlying group-specific trends (Table xx).
Seeking to assess the sensitivity of the results to the linearity assumed in the main
regressions, the econometric models were re-estimated using non-parametric double-difference
methods (PSMDD). Several kernel techniques are used to match treatment households with
households from less affected areas on the basis of the propensity score. The score itself is
constructed with the parameters obtained from a logistic regression of the treatment status on a
number of pre-shock municipality and household variables. Bootstrapped standard errors from
PSMDD models are obtained from 250 replications. Overall, the quantitative findings of the
paper as well as their statistical significance are largely replicated by these non-parametric
models.
Another potential subject of concern is attrition. Inferences regarding the causal effect of
the earthquakes could be biased in the event that the decisions or the reasons to leave the sample
are attributed to the strength of the geological events. But more importantly, if the underlying
factors explaining these decisions/reasons are systematically correlated with the definition of our

23
experimental groups and, accordingly, affect the composition of these groups between the pre-
and after-shock time. We argue that attrition in this study is largely exogenous to the definition
of the shock. It was pointed out at the beginning of the document that the BASIS project was
very successful at recontacting households in the follow-up surveys. Indeed, for period 2000-
2002 in particular, just 3.4% of the households (24 out of 696) were untracked. In spite of the low
number of leavers, two additional simple statistical exercises were undertaken to further
examine this issue. First, and notwithstanding the low variation in the outcome variable, we run
regressions of the attrition status on treatment intensity, conditional on pre-shock covariates. The
results show that the magnitude of the ground shaking does not predict attrition in our sample
(Table xx). Second, we compare observable key baseline characteristics of households that were
and were not re-interviewed in 2000 and do not find any substantial differences. Furthermore,
the various treatment effect parameters estimated with household fixed-effect models and
regressions that include the 24 untracked households are almost identical. The consistent
message from this series of results is that our design is highly robust to the issue of sample
attrition.
Finally, we discuss two other subjects of concern that, although of different nature, are
expected to produce a similar bias. The first one is measurement error in the indicator of
treatment. It is true that we carefully constructed a measure that incorporates the most important
parameters of the quakes determining the seismic magnitude experienced by each household.
Yet, it is probable that our measure of the shock misses other factors that also shape the severity
of the earthquakes. For example, the propagation of seismic waves is to some extent determined
by the complex combination of local geological and geomorphological characteristics. Although
we attempted to account for these local conditions –as well as for other determinants, the
information used and in particulat the way in which these complex relationships were modeled
means that the treatment indicator is still an approximation of the real intensity of the
earthquakes. This noise implies that the shock indicator is probably measured with error and,
thus, the parameter would suffer from a attenuation bias.
24
The second issue is related to the definition of the comparison group, i.e. “low intensity”.
By construction we assume that, after controlling for pre-shock observables and time-invariant
group-specific characteristics, the only difference between them and those in the “high intensity”
group is the magnitude of the shock. Yet, households in areas with lower treatment intensity can
also confront the country-wide impacts of the earthquakes (as the treatment group does) such as
the effects of disrupted infraestructure on the access to markets or the consequences of an
economic slowdown on employment and prices. If so, the comparison group is also worse off
through these channels and less “immune” as originally though. Again, this would bias the
results downwards. However, although it is is certainly difficult to rule out this matter or the
problem of measurement error, both issues do not eliminate the information behind our causal
history since the parameters can still be interpreted as lower bound estimates of the true impacts
resulting from the two earthquakes.
5. Interpretation
[TO BE COMPLETED]
Recycled for this section:
stress that those households exposed more severely to the shock also saw their income
suffer the largest setbacks.
Over 30% of the households report having being impacted by the quakes in the form of a
decrease in income from agriculture or own business, although the only income source among
the most affected households that appears to have suffer an outright reversal of fortunes is that
related to productive animals as average income actually fell in real terms by 50%. Furthermore,
in terms of job opportunities outside the own farm or business, 2% of households report having
a household member who lost his/her job.
It is important to highlight at this point of the discussion that, even though in terms of
welfare, households ultimately care about the level of consumption more than their level of
income, the latter is still very indicative given the limited functionality of credit markets. Yet,
when households are hit by a natural disaster or affected by a large shock of another nature that
reduces their income and/or affects their assets, they can draw on different resources to limit a

25
fall in consumption. The role of inter-household transfers, labor supply, diversification or
migration, for example, is well documented in the literature.
It is not in the scope of this paper to analyze the causal effect of the earthquakes on the
different coping mechanisms. However, some basic indicators point at the fact that these
alternative sources of income and consumption only played a limited role. Households affected
by the shock did receive more public transfers and made use of their savings, for example, but,
when asked, they still replied that their consumption had to decrease. In fact, 26.8% of
households cite a fall in food consumption as one of the main consequences of the earthquakes
and 17.92% report a fall in consumption of non-food or education items. Other effects are also
likely to reduce future consumption (Table 4). In short, the 2001 earthquakes, through a loss of
income and assets, are likely to have led to a fall in current and future consumption.
6. Conclusions
The devastating consequences of large natural disasters on socioeconomic systems are
evident to all. Yet, little is really known about the magnitude of such negative effects. This paper
estimates the impact of two strong earthquakes in El Salvador on rural household income and
poverty and sheds some light into their persistence in the middle- and long-run.
Methodologically, it addresses various underlying confounding problems by exploiting
plausibly exogenous variation in the intensity of these geological events caused by the
combination of their seismic parameters, types of soils and the geographic coordinates of the
dwellings. Reduced-form results show that the quakes led to a decline of one third in the
average baseline household income per capita among “highly treated” households relative to
their counterfactuals. Associations between the earthquakes and the levels of poverty also
emerge from our empirical exercises but they lack enough statistical power. Furthermore, we
find suggestive evidence that these geological shocks can have negative effects on the potential
earning capacity of current and future generations through reductions in physical and human
capital accumulation.

26
These findings, together, point towards natural disasters having long-lasting negative
consequences on poverty and the overall economic development of affected populations. For
policy makers, this means that mitigation policies should combine a number of instruments to
shield several dimensions of human development at different points in time. First, priority
should be placed on investments in critical infrastructure and information systems that protect
individuals from the direct physical damages caused by large and powerful natural hazards.
Second, present and future incomes, consumption and human capital accumulation processes
are largely at risk in the aftermath of these disasters. On one hand, these impacts are caused by
the direct damaging effects of natural events and, as such, require rapid and effective
humanitarian relief. On the other hand, these negative effects are exacerbated by common
households’ pervasive coping responses such as withdrawing children from schools and
liquidating critical productive assets. Furthermore, if poorer households are in fact more like to
take children out of school in face of a shock, this result has important implications for future
poverty incidence and persistence. This calls for programs with social relief measures such as
scalable, flexible and well-targeted safety nets that respond quickly to the characteristics and
magnitude of each event.
Finally, these challenges also create a critical role for policy action to reduce the use of
inefficient ex-ante risk management strategies at the household level well before the realization
of new destructive disasters. Even though all these instruments together may not provide full
isolation from the harmful effects of natural shocks, they are likely to make any household’s
socioeconomic well-being less determined by its closeness to random destructive events. So far,
such proximity still plays a big detrimental role as evidence from this paper seems to suggest.

27
References
Alfaro, C., A. Kiremidjian, and R. White, (1990), “Seismic Zoning and Ground Motion Parameters for
El Salvador, Report No. 93, The John A. Blume Earthquake Engineering Center, Stanford University.
Anderson, M., (2000), “The Impact of Natural Disasters on the Poor: A Background Note”.
Azarian, A. and V. Skriptchenko, (1998), “Children in Natural Disasters: An Experience of the 1998
Earthquake in Armenia”.
Baez, J. and I. Santos, (2007), “Children’s Vulnerability to Weather Shocks: Natural Disasters as a
Natural Experiment”.
Basu, K. and P. Van, (1998), “The Economics of Child Labor”, American Economic Review, 88, pp. 412-
427.
Basu, K., (1999), “Child Labor: Cause, Consequence, and Cure, with Remarks on International Labor
Standards”, Journal of Economic Literature, 37,3, pp. 1083-1119.
Becker, G., (1974), “A Theory of Social Interactions”, Journal of Political Economy 82, pp. 1063 – 1094.
Behrman, J, (1988), “Intra-household Allocation of Nutrients in Rural India: Are Boys Favored? Do
Parents Exhibit Inequality Aversion?”, Oxford Economic Papers, 1988, vol. 40 (1), pp. 32-54.
Beneke, M. and M. Shi, (2004), “Din{mica del Ingreso Rural en El Salvador”, Serie de Investigación,
Fundación Salvadoreña para el Desarrollo Económico y Social (FUSADES).
Bommer, J., G. Benavides and M. Lopez, (2003), “World Housing Encyclopedia Report. El Salvador”.
Bommer, J., W. Rose, and C. Sandoval, (2004), “Natural Hazards and Risk Mitigation in El Salvador:
An Introduction”, Geological Society in America, Special Paper 375.
Bommer, J., D. Hernandez, J.Navarrete and W. Salazar, (1996), “Seismic Hazard Assessments for El
Salvador”, Geofísica Internacional, v. 35, pp. 227-244.
Bommer, J., Benito, B., Ciudad-Real, M., Lemoine, A., López, M., Madariaga R.,, Mankelow, J.,
Méndez, P., Murphy, W., Nieto, M., Rodríguez, C. and Rosa, H., (2001), “The El Salvador Earthquakes
of January and February 2001: Context, characteristics and implications for seismic risk”.
Carter, M.; P. Little; T. Mogues and W. Negat, (2004), “Shocks, Sensitivity and Resilience: Tracking
the Economic Impacts of Environmental Disaster on Assets in Ethiopia and Honduras”, University of
Wisconsin.
Cepeda, J., M. Benito and E. Burgos, (2001), “Strong-motion Characteristics of January and February
2001 Earthquakes in El Salvador”.
Charveriat, C., (2000), “Natural Disasters in Latin America and the Caribbean: An Overview of Risk”,
Inter-American Development Bank, Washington, DC.

28
Coburn, A. and R. Spence, (1992), “Earthquake Protection”, Wiley, Chichester, England.
Comision Economica para America Latina (CEPAL), (2001a), “El Terremoto del 13 de Enero de 2001
en El Salvador. Impacto Socio-Economico y Ambiental”.
Comision Economica para America Latina (CEPAL), (2001b), “El Salvador: Evaluacion del Terremoto
del Martes 13 de Febrero de 2001”.
Cox, A. and M. Ureta, (2003), “International Migration, Remittances, and Schooling: Evidence from El
Salvador”, NBER WP 9766.
Deaton, A., (1992), “Saving and Income Smoothing in Cote d’Ivoire”, Journal of African Economies, l (1),
pp. 1-23.
Deaton, A., (1997), The Analysis of Household Surveys. A Microeconomic Approach to Development
Policy, The Johns Hopkins University Press, Baltimore, Maryland.
Donald, S. and K. Lang, (2001), “Inferences with Difference in Differences and other Panel Data”,
Boston University Working Paper.
Engineering Research Institute (EERI), (2001), “Preliminary Observations on the El Salvador
Earthquakes of January 13 and February 13, 2001”, EERI Special Earthquake Report.
Fafchamps, M. and S. Lund, (2001), “Risk-Sharing Networks in Rural Philippines”.
Flores, M., A. Bratescu, J. Martinez, J. Oviedo, A. Acosta, (2002), “Centroamérica: El Impacto de la
Caída de los Precios del Café”, CEPAL.
Freeman, P., (2000), “Estimating chronic risk from natural disasters in developing countries: A case
study on Honduras”, Paper for the Annual Bank Conference on Development Thinking at the
Millennium, June 26-28, World Bank, Washington, DC.
Gitter, S. and B. Barham, (2006), “Credit, Natural Disasters, Coffee, and Educational Attainment in
Rural Honduras”, Department of Agricultural and Applied Economics, University of Wisconsin-
Madison.
Guarcello, L.; F. Mealli and F. Rosati, (2004), “Household Vulnerability and Child Labor: the effects of
shocks, credit rationing, and insurance”, UNICEF.
Halliday, T., (2004), “Migration and Self-Insurance in Rural El Salvador”.
Huezo, C., (2004). “Sismos en El Salvador: 1900-2001: Context”, SNET. San Salvador, El Salvador.
Human Rights Watch, (2004), “El Salvador: Abuses Against Child Domestic Workers in El Salvador”.
Inter-American Development Bank (IADB), (2000), “Development Beyond Economics”, IPES 2000.
Jacoby, H. and E. Skoufias, (1997), “Risk, Financial Markets, and Human Capital in a Developing
Country”, Review of Economic Studies.

29
Jacoby, H. and E. Skoufias, (1998), “Testing Theories of Consumption Behavior Using Information on
Aggregate Shocks: Income Seasonality and Rainfall in Rural India”, American Journal of Agricultural
Economics, 80, pp. 1-14.
Janvry, A., F. Finan, E. Sadoulet and R. Vakis, (2004), “Can Conditional Cash Transfers Serve as Safety
Nets to Keep Children at School and Out of the Labor Market?”.
Jensen, R., (2000), “Agricultural Volatility and Investments in Children”. The American Economic
Review 90, 2, pp. 399 -404.
Kolaitis, G., J. Kotsopoulos, J. Tsiantis, S. Haritaki, F. Rigizou, L. Zacharaki, E. Riga, A. Augoustatou,
A. Bimbou, N. Kanari, M. Liakopoulou and P. Katerelos, (2003), “Posttraumatic stress reactions
among children following the Athens earthquake of September 1999”, Journal of European Child &
Adolescent Psychiatry, Vol. 12, Number 6.
Lucas, R. and O. Stark, (1985), “Motivations to Remit: Evidence from Botswana”. Journal of Political
Economy 93, pp. 901-918.
McPeak, J., (2004), “Contrasting Income Shocks with Asset Shocks: Livestock Sales in Northern
Kenya”, Oxford Economic Papers, 56,2, pp. 263-284.
Morduch, J., (1995), “Income Smoothing and Consumption Smoothing”, Journal of Economic
Perspectives 9, pp. 103-114.
National Service of Territorial Studies (SNET), (2007), http://www.snet.gob.sv/ver/geo-
logia/geologia+de+el+salvador/.
Pan-American Health Organization (PAHO), (2002), “Cronicas de Desastres. Terremotos El Salvador,
2001”.
Paulson, A., (1994), “Insurance Motives for Migration: Evidence from Thailand”, dissertation,
University of Chicago.
Paxson, C., (1992), “Using Weather Variability to Estimate the Response of Savings to Transitory
Income in Thailand”, The American Economic Review, 82, pp. 15-33.
Pleitez, R., (2004), “Remittances as a Strategy to Cope with Systematic Risk: Panel Results from Rural
Households in El Salvador”, PhD Dissertation, Ohio State University.
Psacharopoulos, G., (1997), “Child labor versus Educational Attainment. Some Evidence from Latin
America”, Journal of Population Economics, Vol. 10, 4, pp. 377-386.
Ravallion, M. and Q. Wodon, (2000). “Does Child Labor Displace Schooling? Evidence on Behavioral
Responses to An Enrollment Subsidy”, The Economic Journal, CX, pp. 158-175.
Rosati, F. and M. Rossi, (2003), “Children’s Working Hours and School Enrollment: Evidence from
Pakistan and Nicaragua”, The World Bank Economic Review, 17, 2, pp. 283-295.
Rosenzweig, M. and O. Stark, (1989), “Consumption Smoothing, Migration and Marriage: Evidence
from Rural India”. Journal of Political Economy, pp. 905-927.

30
Rosenzweig, M. and K. Wolpin, (1993), “Credit Market Constraints, Consumption Smoothing, and
the Accumulation of Durable Production Assets in Low-Income Countries: Investments in Bullocks in
India”, Journal of Political Economy, 101, pp. 223-244.
Santos Indhira. (2007). “Disentangling the Effects of Natural Disasters on Children: 2001 Earthquakes
in El Salvador”, dissertation, Kennedy School of Government, Harvard University.
Townsend, R., (1994), “Risk and Insurance in Village India”, Econometrica 62, pp. 539-92.
Udry, C., (1990), “Credit Markets in Rural Nigeria: Credit as Insurance in a Rural Economy”, World
Bank Economic Review, Vol. 4, No. 3, pp. 251-269.
Udry, C., (1994), “Risk and Insurance in a Rural Credit Market: An Empirical Investigation in
Northern Nigeria”, Review of Economic Studies 61, pp. 495-526.
United Nations Development Program (UNDP), (2005), Human Development Index, El Salvador.
United Nations Development Program (UNDP), (2001), Human Development Report, El Salvador.
United States Geological Survey (USGS), (2007), www.earthquake.ucgs.gov.
Youngs, R., S. Chiou, W. Silva and J. Humphrey, (1997), “Strong Ground Motion Attenuation
Relationships for Subduction Zone Earthquakes”, Seismological Research Letters 68 (1), pp. 58-73.

31
Figure 1. Departmental Map of El Salvador and
Epicenters of the 2001 Earthquakes
Source: PAHO, (2002), “Cronicas de Desastres. Terremotos en El Salvador, 2001”.

32
Table 1. Pre-shock Rural Households’ Characteristics by Treatment Status
Treatment Control
(Quakes=1) (Quakes=0)
Household size 5.98 6.09 5.87 0.22
[0.102] [0.144] [0.145] [0.205]
Age of household head (in years) 52.55 52.57 52.52 -0.05
[0.553] [0.790] [0.775] [1.107]
Schooling head of household (in years) 4.93 4.92 4.94 -0.018
[0.221] [0.313] [0.311] [0.442]
Household headed by woman 0.14 0.12 0.15 -0.03
[0.014] [0.018] [0.020] [0.027]
Single-headed household 0.19 0.17 0.2 -0.03
[0.015] [0.021] [0.022] [0.030]
Annual income per capita (colones) 5,449.21 5,300.77 5,599.02 -298.25
[241.833] [349.414] [334.616] [483.795]
Household in extreme poverty 0.34 0.36 0.32 0.04
[0.019] [0.026] [0.026] [0.037]
Household in relative poverty 0.17 0.15 0.18 -0.03
[0.0147] [0.020] [0.022] [0.029]
Households has electricity 0.68 0.66 0.70 -0.04
[0.018] [0.026] [0.025] [0.036]
Household has indoor plumbing or 0.44 0.44 0.44 0.00
private well [0.019] [0.027] [0.027] [0.038]
Type of walls
Concrete 0.36 0.39 0.34 0.05
[0.018] [0.027] [0.026] [0.038]
Adobe/Bahareque 0.56 0.55 0.57 -0.02
[0.019] [0.027] [0.027] [0.039]
Households has own business 0.29 0.31 0.27 0.04
[0.017] [0.026] [0.024] [0.036]
Household works on agricultural activities 0.66 0.69 0.63 0.06
[0.019] [0.026] [0.027] [0.037]
Household has savings 0.24 0.21 0.27 -0.06 *
[0.017] [0.023] [0.025] [0.033]
Amount of savings (colones) 988.07 887.59 1,089.47 -201.88
[161.967] [220.039] [238.093] [324.200]
Household has credit 0.16 0.18 0.14 0.04
[0.014] [0.021] [0.019] [0.029]
Household has migrant relative 0.41 0.37 0.44 -0.11 **
[0.019] [0.027] [0.027] [0.038]
Annual net inter-household transfers 3,222.22 2,963.00 3,483.83 -520.83
received (colones) [361.941] [511.244] [512.862] [724.153]
Geographic location
Occidental region 0.26 0.00 0.52 -0.52 ***
[0.017] [0.000] [0.027] [0.028]
Central region 0.44 0.64 0.23 0.48 ***
[0.019] [0.026] [0.024] [0.035]
Oriental region 0.30 0.36 0.24 0.12 ***
[0.018] [0.027] [0.024] [0.036]
Minutes to closest highway 33.67 33.37 33.97 -0.60
[1.405] [1.853] [2.112] [3.814]
Minutes to closest primary school 12.01 12.21 11.79 0.42
[0.442] [0.644] [0.604] [0.884]
Number of households 653 328 325
Rural Households
Variable Total Difference
Notes. Robust standard errors presented in square brackets. ***, (**) and [*] stand for significance at the
1%, (5%) and [10%] level, respectively. See text for definitions of treatment and control households. All
monetary values are in 1996 colones.

Table 2. Short-Run Impact of the 2001 Earthquakes on Household Income and Poverty
Outcome Treatment Control (i) (ii) (iii) (i) (ii) (iii) N
Income
Annual household income per capita (colones) 5,300.77 5,599.02 -1,759.67 ** -1,763.18 ** -1,708.58 ** -8,346.09 ** -8,367.09 ** -8,112.30 * 1,306
[349.414] [334.616] [773.745] [828.645] [854.625] [ 3,951.53] [ 4,260.82] [ 4,342.85]
Annual household income per capita, X
xxxexcluding public transfers (colones) 4,874.12 5,504.65 -2,052.45 ** -2,074.94 ** -2,033.139** -9,683.82 ** -9,868.08 ** -9,673.79 ** 1,306
[387.460] [333.911] [837.900] [895.060] [912.479] [4,740.98] [5,069.86] [5,087.63]
Poverty
Probability of being in extreme poverty 0.357 0.320 0.004 0.003 0.008 0.278 0.275 0.306 1,306
[0.0265] [0.0259] [0.041] [0.044] [0.045] [0.255] [0.272] [0.278]
Probability of being in relative poverty 0.152 0.185 0.0246 0.027 0.016 -0.106 -0.092 -0.141 1,306
[0.020] [0.022] [0.036] [0.039] [0.039] [0.262] [0.282] [0.285]
Poverty Gap 1,306
Household and individual characteristics? no yes yes no yes yes
Municipality fixed effects? no yes yes no yes yes
Interaction effects? no no yes no no yes
Pre-shock mean
Sample: Rural Households in El Salvador
D-D: Treatment=1, Control=0
Reduced Form Estimates
D-D: Continuous treatment indicator
Notes. Robust standard errors, clustered at the municipality level, presented in square brackets. ***, (**) and [*] stand for significance at the 1%, (5%) and [10%] level, respectively. Household
characteristics include head of household’s education, age and gender; number of members in the household, dwelling’s wall materials, distance to closest school, crops cultivated and type of
soil where the dwelling is located. Other controls include dummies for whether the household owns business, works in agriculture, has animals, owns land, has electricity, has indoor plumbing
or private well, receives public aid, has credit, has savings, has a migrant relative, receives inter-household transfers. Interaction effects refer to interactions between the shock indicator and the
explanatory variables as well as department and year interactions. See text for definitions of treatment and control households and before and after years.

Table 3. Consequences of 2001 earthquakes
BASIS Dataset, Rural Households
Consequence % of households
Reduction in food consumption 26.80%
Had to stop sending children to school 3.37%
Reduction in consumption other items (no food or education) 17.92%
Stopped or cancelled investments in physical capital 7.50%
Saved less 23.74%
Other 7.66%
Source: BASIS Dataset, 2002 and own calculations

35
Figure 2. Distributional Changes in Household Income per Capita
Treatment and Control households in 2000 (Kernel densities)
0
.000
05
.000
1
de
nsity
0 10000 20000 30000 40000household income per capita
treatment control
Treatment and Control households in 2002 (Kernel densities)
0
.000
02
.000
04
.000
06
.000
08
.000
1
de
nsity
0 10000 20000 30000 40000household income per capita
treatment control
Source: BASIS Dataset, 2002 and own calculations
- - - - povety line

36
Table 4. Asset Losses due to 2001 earthquakes
BASIS Dataset, Rural Households
Asset Category % of households
Median value of losses, colones
*
Housing
Small housing damages 28.94% 480.00
Severe housing damages 15.01% 2400.00
Dwelling destroyed 17.15% 4800.00
Other assets
Other buildings and land 6.58% 1600.00
Furniture and appliances 13.94% 800.00
Farm machinery and tools 0.46% 360.00
Non-farm machinery and tools 1.07% 800.00
Inventory and storaged grains 3.72% 400.00
Productive animals 0.92% 1040.00
Other 1.38% 440.00
Any asset 63.25% 1840.000
Notes: * Average value of losses, conditional on having suffered a loss on the corresponding asset class
Table 5. Actions taken by households to deal with the effects of the 2001 earthquakes
BASIS Dataset, Rural Households
Action % of households
Used savings 20.52%
Sold animals or land 9.34%
Sold other assets 1.07%
Borrowed from bank or other institution 3.37%
Borrowed from friends or family 10.87%
Received aid from non-family24.66%
Increased labor supply 0.61%
A member of the houshold migrated 0.46%
Other2.91%
Source: BASIS Dataset, 2002 and own calculations
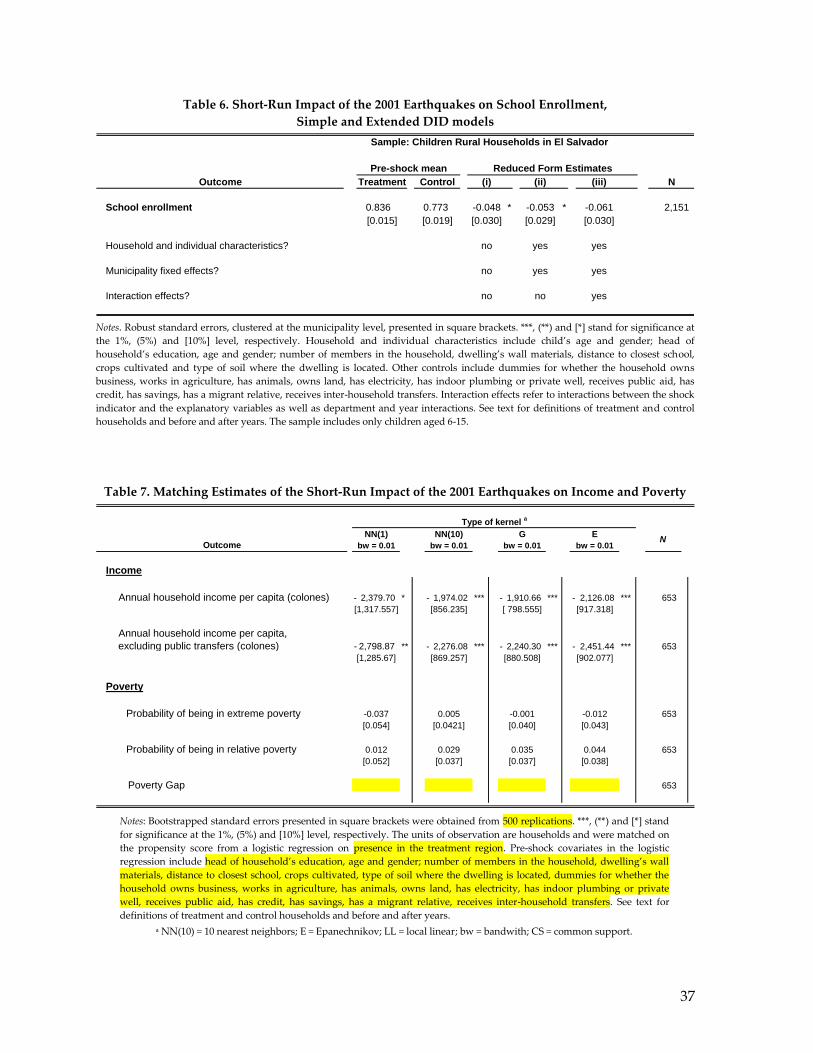
37
Table 6. Short-Run Impact of the 2001 Earthquakes on School Enrollment,
Simple and Extended DID models
Outcome Treatment Control (i) (ii) (iii) N
School enrollment 0.836 0.773 -0.048 * -0.053 * -0.061 2,151
[0.015] [0.019] [0.030] [0.029] [0.030]
Household and individual characteristics? no yes yes
Municipality fixed effects? no yes yes
Interaction effects? no no yes
Sample: Children Rural Households in El Salvador
Pre-shock mean Reduced Form Estimates
Notes. Robust standard errors, clustered at the municipality level, presented in square brackets. ***, (**) and [*] stand for significance at
the 1%, (5%) and [10%] level, respectively. Household and individual characteristics include child’s age and gender; head of
household’s education, age and gender; number of members in the household, dwelling’s wall materials, distance to closest school,
crops cultivated and type of soil where the dwelling is located. Other controls include dummies for whether the household owns
business, works in agriculture, has animals, owns land, has electricity, has indoor plumbing or private well, receives public aid, has
credit, has savings, has a migrant relative, receives inter-household transfers. Interaction effects refer to interactions between the shock
indicator and the explanatory variables as well as department and year interactions. See text for definitions of treatment and control
households and before and after years. The sample includes only children aged 6-15.
Table 7. Matching Estimates of the Short-Run Impact of the 2001 Earthquakes on Income and Poverty
NN(1) NN(10) G E
bw = 0.01 bw = 0.01 bw = 0.01 bw = 0.01
Income
Annual household income per capita (colones) 2,379.70- * 1,974.02- *** 1,910.66- *** 2,126.08- *** 653
[1,317.557] [856.235] [ 798.555] [917.318]
Annual household income per capita, X
xxxxexcluding public transfers (colones) 2,798.87- ** 2,276.08- *** 2,240.30- *** 2,451.44- *** 653
[1,285.67] [869.257] [880.508] [902.077]
Poverty
Probability of being in extreme poverty -0.037 0.005 -0.001 -0.012 653
[0.054] [0.0421] [0.040] [0.043]
Probability of being in relative poverty 0.012 0.029 0.035 0.044 653
[0.052] [0.037] [0.037] [0.038]
Poverty Gap 653
Type of kernel a
OutcomeN
Notes: Bootstrapped standard errors presented in square brackets were obtained from 500 replications. ***, (**) and [*] stand
for significance at the 1%, (5%) and [10%] level, respectively. The units of observation are households and were matched on
the propensity score from a logistic regression on presence in the treatment region. Pre-shock covariates in the logistic
regression include head of household’s education, age and gender; number of members in the household, dwelling’s wall
materials, distance to closest school, crops cultivated, type of soil where the dwelling is located, dummies for whether the
household owns business, works in agriculture, has animals, owns land, has electricity, has indoor plumbing or private
well, receives public aid, has credit, has savings, has a migrant relative, receives inter-household transfers. See text for
definitions of treatment and control households and before and after years.
a NN(10) = 10 nearest neighbors; E = Epanechnikov; LL = local linear; bw = bandwith; CS = common support.

38
Table 8. Pre-shock difference-in-difference models of Income and Poverty, 1998-2000
Outcome Treatment Control (i) (ii) (iii) N
Income
Annual household income per capita (colones) 3,127.22 3,904.14 365.69 370.36 445.56 1,116
[517.859] [267.685] [800.675] [898.510] [953.824]
Annual household income per capita, X
xxxexcluding public transfers (colones) 3,077.84 3,844.53 247.90 252.67 324.23 1,116
[267.893] [518.523] [791.056] [887.433] [942.370]
Household and individual characteristics? no yes yes
Municipality fixed effects? no yes yes
Interaction effects? no no yes
Pre-shock mean
Sample: Rural Households in El Salvador
Reduced Form Estimates
Notes. Robust standard errors, clustered at the municipality level, presented in square brackets. ***, (**) and [*] stand for significance at
the 1%, (5%) and [10%] level, respectively. Household characteristics include head of household’s education, age and gender; number
of members in the household, dwelling’s wall materials, distance to closest school, crops cultivated and type of soil where the
dwelling is located. Other controls include dummies for whether the household owns business, works in agriculture, has animals,
owns land, has electricity, has indoor plumbing or private well, receives public aid, has credit, has savings, has a migrant relative,
receives inter-household transfers. Interaction effects refer to interactions between the shock indicator and the explanatory variables as
well as department and year interactions. See text for definitions of treatment and control households and before and after years used
for the placebo test.