assessing the potential of home automation in...
TRANSCRIPT

RE
PO
RT
Assessing the Potential of HomeAutomation in Norway
A report commissioned by NVE
VaasaETT 342017

2
Published by:
Editor:
Authors:
Printing: Circulation:Cover: ISBN
Summary:
Keywords:
Norwegian water resources and energy directorate (NVE)
Middelthunsgate 29 Postboks 5091 Majorstua 0301 OSLO
Telephone: 22 95 95 95 Web: www.nve.no
Assessing the Potential of Home Automation in Norway
Norwegian Water Resources and Energy Directorate
Cathrine Åsegg Hagen
VaasaETT
NVE
30
VaasaETT
978-82-410-1587-8ISSN 1501-2832
This report explores the potential of home automation technology toreduce electricity consumption and manage peak demand in Norway,both at household level and aggregated at national level. In order toreap the full benefits of home automation, VaasaETTs findings indicatethat home automation offerings should go hand in hand with dynamictariffs, consumption feedback and consumer education.
Consumption feedback, demand response, dynamic pricing, energyefficiency, home automation, smart meters.
April 2017

Preface This report is commissioned by NVE as part of the R&D-project “Smart meters, smarter consumers”. The project aims to generate knowledge about measures in the retail electricity market that can help consumers utilize the opportunities following the roll-out of smart meters in Norway. Every Norwegian household will have a smart meter installed by January 1 2019.
The report explores the potential of home automation technology to reduce electricity consumption and manage peak consumption in Norway, both at household level and aggregated at national level. In order to reap the full benefits of home automation, VaasaETTs findings indicate that home automation offerings should go hand in hand with dynamic tariffs, consumption feedback and consumer education.
In order to know the actual effects of home automation in Norway, different home automation solutions needs to be tested in a large scale amongst Norwegian household costumers. This report can hopefully help in preparations for future large-scale pilot projects.
The content and recommendations contained within this report are those of the consultant, and have neither been accepted nor rejected by NVE.
Oslo, April 2017
Ove Flataker Director
Guro Grøtterud Head of Section


AreportcommissionedbytheNorwegianWaterResourcesandEnergyDirectorate(NVE)
LeadWriters:ChristopheDromacqueThomasN.Mikkelsen
RafailaGrigoriou
AdditionalContributors:HannaLaunonenPhilipE.Lewis
Delivery:21February2017
Assessing the Potential of Home Automation in Norway

i
Table of Contents
ListofAcronyms...........................................................................................................................................iii
ExecutiveSummary.......................................................................................................................................1
Introduction..................................................................................................................................................11
Adefinitionofhomeautomation...........................................................................................................13
1 Successfactorsinhomeautomationprojects..........................................................................14
1.1 Communicationtechnologies............................................................................................................................14
1.2 Choiceoftechnology..............................................................................................................................................15
1.3 Tariffsasbarrierandenabler...........................................................................................................................18
1.4 Educationandengagement...............................................................................................................................20
1.5 MarketpotentialforhomeautomationtechnologyinNorway.........................................................25
2 PotentialofhomeautomationforEEandDR...........................................................................27
2.1 Methodology..............................................................................................................................................................27
2.2 Overallpilotresults................................................................................................................................................28
2.3 Effectivenessofdynamictariffschemes.......................................................................................................29
2.4 Automatingtheusageofhomeappliances.................................................................................................34
2.5 Educationandfeedbackinhomeautomationpilots..............................................................................38
3 ImpactofhomeautomationonelectricityconsumptioninNorway................................41
3.1 CharacteristicsofhouseholdelectricityconsumptioninNorway....................................................41
3.2 Methodologyandassumptions.........................................................................................................................43
3.3 Impactsonannualelectricityconsumption................................................................................................45
3.4 Impactsonthehighestelectricityconsumptionmonth........................................................................47
3.5 Impactsonthehighestconsumptionday....................................................................................................50
4 State‐of‐the‐arthomeautomationprojects..............................................................................52
4.1 NewEquipment.......................................................................................................................................................52
4.2 Nikola–EVsforFlexibilityandGreenEnergy...........................................................................................54
4.3 Elsa–EnergyLocalStorageAdvancedsystem..........................................................................................56
4.4 'CaronToon'–IntegratingHomeandCar.................................................................................................56
4.5 WEREL–BringingitTogether.........................................................................................................................57
5 References...........................................................................................................................................58

ii
Table of Figures
FIGURE1:THECONNECTEDHOMEIN2025.....................................................................................................................16FIGURE2:AMAZONECHO–AMAINCONTENDERTOBECOMETHEHEARTOFTHECONNECTEDHOME...................17FIGURE3ANYWAREANDGREENENERGYOPTIONS–HOMEAUTOMATIONSOLUTIONS..........................................17FIGURE4:DYNAMICPRICINGPILOTSANDEDUCATION...................................................................................................20FIGURE5:BE‐AWAREPROJECTDISCOVERY(2011).......................................................................................................21FIGURE6:BENEFITSOFDRPROGRAMSFORDIFFERENTSTAKEHOLDERS....................................................................22FIGURE7:THREEPILLARSOFTHECUSTOMERENGAGEMENTPROCESS.........................................................................24FIGURE8:SMARTHOMESHADITSOWNPAVILIONINEUROPEANUTILITYWEEK2010INVIENNA......................25FIGURE9:MARKETPENETRATIONOFHOMEAUTOMATIONTECHNOLOGYINNORWAY2015–2021...................26FIGURE10:IMPACTOFHOMEAUTOMATIONONELECTRICITYCONSUMPTION.............................................................28FIGURE11:CONSUMPTIONREDUCTIONATPEAKTIMES..................................................................................................30FIGURE12:IMPACTOFHOMEAUTOMATIONINCPPPILOTS...........................................................................................31FIGURE13:IMPACTOFHOMEAUTOMATIONINCPRPILOTS...........................................................................................32FIGURE14:IMPACTOFHOMEAUTOMATIONINTOUPILOTS..........................................................................................33FIGURE15:IMPACTOFHOMEAUTOMATIONINRTPPILOTS..........................................................................................34FIGURE16:APPLIANCECONSUMPTIONINNORWAY,KWHPERYEAR...........................................................................35FIGURE17:IMPACTOFAUTOMATEDELECTRICHEATING.................................................................................................36FIGURE18:IMPACTOFAUTOMATEDWATERBOILERS......................................................................................................37FIGURE19:IMPACTOFAUTOMATEDWHITEGOODS.........................................................................................................38FIGURE20:IMPACTOFFEEDBACKONHOMEAUTOMATIONPILOTS...............................................................................39FIGURE21:ELECTRICITYCONSUMPTIONBYTYPEOFHOUSING,2012.........................................................................41FIGURE22:HOUSEHOLD’SENERGYUSEINNORWAY.......................................................................................................42FIGURE23:SEASONALVARIATIONSINELECTRICITYCONSUMPTION,WEEKDAYSANDWEEKENDS..........................42FIGURE24:ESTIMATEDYEARLYAVERAGEDEMANDDURINGWORKDAYSSEGMENTEDINTOMAINEND‐USEGROUPS
.........................................................................................................................................................................................43FIGURE25:IMPACTASSUMPTIONSOFTARIFFSCHEME,HOMEAUTOMATIONANDCONSUMPTIONFEEDBACK.......44FIGURE26:IMPACTOFFEEDBACKANDAUTOMATEDDRONANNUALELECTRICITYCONSUMPTION.......................45FIGURE27:IMPACTOFFEEDBACKANDAUTOMATEDDRONANNUALPEAKELECTRICITYCONSUMPTION.............46FIGURE28:IMPACTONNORWAY’SOVERALLANDPEAKELECTRICITYCONSUMPTION...............................................47FIGURE29:IMPACTOFFEEDBACKANDAUTOMATEDDRONHIGHESTCONSUMPTIONMONTHELECTRICITY
CONSUMPTION...............................................................................................................................................................48FIGURE30:IMPACTOFFEEDBACKANDAUTOMATEDDRONHIGHESTCONSUMPTIONMONTHPEAKELECTRICITY
CONSUMPTION...............................................................................................................................................................48FIGURE31:IMPACTONNORWAY’SHIGHESTCONSUMPTIONMONTHOF2015...........................................................49FIGURE32:IMPACTOFFEEDBACKANDAUTOMATEDDRONHIGHESTCONSUMPTIONDAYPEAKELECTRICITY
CONSUMPTION...............................................................................................................................................................50FIGURE33:IMPACTONHIGHESTCONSUMPTIONDAYOF2015......................................................................................51FIGURE34:IMPACTOFAUTOMATEDHEATING‐HIGHESTCONSUMPTIONDAY2015.................................................51FIGURE35:THEVERAGEO‐FENCINGHOMEAUTOMATIONAPP....................................................................................52FIGURE36:TESLASOLARROOFTOPDESIGNS..................................................................................................................53FIGURE37:ENECO’SCARONTOONINTEGRATEDSOLUTION..........................................................................................56

iii
List of Acronyms
CAPEX:CapitalExpenditure
CPP:CriticalPeakPricing
CPR:CriticalPeakRebate
DR:DemandResponse
DSM:DemandSideManagement
DSO:DistributionSystemOperator
EE:EnergyEfficiency
EU:EuropeanUnion
EV:ElectricVehicle
HAN:HomeAreaNetwork
IHD:In‐HouseDisplay
OPEX:OperatingExpense
PV:Photovoltaic
RTP:RealTimePricing
TOU:TimeofUsetariff
TSO:TransmissionSystemOperator

1
Executive Summary
Thisreportexploresthepotentialofhomeautomationtechnologytoreduceelectricity
consumption andmanage peak consumption inNorway under different scenarios for
market adoption both at household level and aggregated at national level. It also
highlights critical success factors of home automation projects that, when combined,
ensurebetterconsumerengagementandultimatelygreater impactsof the technology
and, finally, presents several examples ofwhat the future of home automationmight
looklike.
Theabilitytobothincreaseandreduceenergydemandisoftenseenasanimportantand
relatively inexpensiveelement inprovidinggrid flexibilitywhilst integratinga greater
proportionofintermittentenergyandpreparingthegridfortheincreasingpenetration
of new electricity intensive appliances such as electric cars and heat pumps (both
expanding rapidly in Norway). There are however limits to the speed with which
consumerscanmanuallyreact–whentheycanreactatall‐topriceorvolumesignals.
By automating the usage of certain appliances, household electricity consumption can
instantlydropwheneverpricesarehighornetworkscongestedbenefitingconsumers,
networkoperatorsandthebroadercommunity.
However, the size of loads being switched is usually limited and the cost of the
technology required is often seen as a deterrent. Consequently, the scale of rewards
comparedtotheeffortandcostofinstallingahomeautomationsystemmaybeseenas
inadequate.
This is to ignorethatresidentialdemand isoftenasignificantportionof totalnational
consumption and an even higher portion of national peak consumption. In addition,
residential peak profile is different to that of industry and therefore the two provide
complementary flexibility resources. Multiple trials have demonstrated that home
automation delivers not only substantial consumption reductions and cost‐savings to
energy consumers, they can also bring high levels of satisfaction and loyalty, an
improved perception of the industry and allow for other services that provide added
valueandconveniencetotheconsumeraswellasnewbusinessmodelsfortheenergy
industry.
Intuitively,Norwayrepresentsoneofthemostsuitablemarketsintheworldforhome
automationandtheservicesthatfollowonfromthem:highresidentialconsumptionand

2
2015 2016 2017 2018 2019 2020 2021
Home Automation Technology Market Penetration Rate
MarketpenetrationofhomeautomationtechnologyinNorway2015–
2021(Figure9)
energybills(despitesomeofthelowestelectricitypricesinEurope),ahighproportion
ofelectricheating(controllableload),anincreasingpenetrationofelectriccarsandheat
pumps (also controllable loads), technologically savvypopulation, significant levels of
retail market competition, ongoing smart meter deployment and high income levels
(consumers with higher incomes are better able to invest in Energy Efficiency (EE)
solutions).
Though slow to develop until recently, home energy management systems are being
increasingly commercialised.Revenues in thehomeautomationsegment areexpected
togrowatanannualrate
of 20.6% between now
and 2021; resulting in a
market volume of
US$78m or US$161 per
active Norwegian
household.By2021,21%
ofNorwegian households
are expected to have
home energymanagement systemsup from5% today.By extrapolating these figures,
marketpenetrationratesof48%and78%areexpectedin2030and2040.
Added value of home automation
Appliance automation
proves very effective
at shifting
consumption away
from peak hours 1 .
Pilots with home
automation managed
to reduce peak
consumption by 23%
Vs. 9% for pilots
1Peakconsumptionreferstohighconsumptionhoursatnationallevel.Reductioninpeakhour
consumptionreferstothereductioninconsumptionoverthedurationofthepeak.
‐0,07%
23,42%
1,77%2,48%
8,92%
‐1,65%‐5%
0%
5%
10%
15%
20%
25%
OVERALLREDUCTION
PEAKREDUCTION FOLLOWINGPEAKHOURS
Reduction(%)
ImpactofHomeAutomation
Automation No Automation
Impactofhomeautomationonelectricityconsumption(Figure10)

3
2,68%
23,42%
‐1,48%
0,41%
21,73%
‐3,77%
OVERALLREDUCTION
PEAKREDUCTION FOLLOWINGPEAKHOURS
Reduction(%)
ImpactofFeedbackinAutomationPilots
Feedback No feedback
Impactoffeedbackonautomationpilots(Figure20)
without automation (manual response to dynamic pricing and/or consumption
feedback). There are several reasons for it. Even though consumers should always be
allowed to overrun the program, automation enables fast reactions as well as
controllable levels of reduction and has the advantage of being available during
unplanned system emergencies for instance. In addition, critical situations do not
alwaysoccurwhenresidentialconsumersareabletotakeaction(whentheyareaway
or asleep for instance). Another important consideration for grid operators is that
without automation they risk seeing millions of appliances come back on line at the
same time right afterhigh‐price‐hours end.Automation canhelpmitigate this risk by
switchingappliancesbackonincycles.
However, home automation alone often leads to increased levels of electricity
consumption. Pilots with home automation led to a slight increase in overall
consumption(‐0.07%)whilstpilotswithouthomeautomationtechnologyledtosizeable
reductions inoverall energyconsumption (2.48%).While someargue that there isno
point trying to engage and educate customers who have automated appliances, pilot
results(andbehaviouralscience)showthatwhenefficiencyimprovementscomesolely
from the technological side, people remain passive actors, leading to low levels of
awareness, continued inefficienthabitsandbehavioursandwelldocumentedrebound
effects. In summary, while pilot results indicate that automation drives peak
consumption reductions, it is essential to introduce other mechanism to develop
sustainableenergysavinghabits.
Automation, consumption feedback and consumer education
This point is supported by our findings. Pilots combining home automation with
consumption feedbackandconsumereducation (inotherwordsmakeuseof thedata
generated by the home
automation system to help
consumers reduce overall
energy consumption) are
more effective at reducing
bothpeak(23%vs22%)and
overall consumption (2.7%
vs. 0.41%). In real‐life
however, home automation

4
hasoftenbeenintroducedfollowinganinvertedevolutionwherebytechnologyhasbeen
atthefore‐front,withconsumereducationandfeedbackbeingintroducedasanext‐step
or a reaction to negative publicity. Consumer education and consumption feedback is
not about giving access to graphs, it is about establishing a continuous and dynamic
dialogue with the customer, based on collecting data and adapted to behaviour or
consumptionpatternsona regularbasisand throughmultipleplatforms.Lastbutnot
least, a positive business case and an appealing payback time are other fundamental
reasonswhyeducationandfeedbackshouldbepartofanyhomeautomationpackage.A
2017reportbyVaasaETTand JouleAssets lookingat thebusinesscase forresidential
demand side flexibility in 4 EU countries found that between 77% and 87% of end‐
consumers’financialbenefitscomefromoverallconsumptionreductions(therestfrom
peak consumption reduction). This can be easily understood if one considers the fact
that critical peaks take place for only about 30 hours a year whilst benefits from
loweringoverallelectricityconsumptiontakeplacecontinuously.
Automation and dynamic tariffs
Dynamicpricinginvolvessubstantiallyincreasedretailelectricitypricesduringtimesof
either heightened consumption (for example on abnormally cold winter days in
Norway)orwhenthestabilityofthesystemisthreatenedandblack‐outsmayoccur.In
this respect, the different tariffs in the report are not specifiedas eithera regulated
networktarifforacompetitiveretailprice. Thetariffscould in theory bemanagedby a
thirdentity“theDemandSideManagement(DSM)authority”bridgingtheeconomicsof
thewholesalemarketand thebalancingactivitiesof thegridcompanies.Thedynamic
tariffsarethusmakingupforthefactthatconsumers’decisionsdonotaccountforthe
costofproducingandtransportingelectricityinthedifferenttimeperiods–whichfrom
an economist’s point of view has been one of electricitymarket’smajor failures. The
durationandfrequencyofthehighpricedhoursdifferdependingonthepricingscheme
as explained in Chapter 2.3 and detailed in Figure 25. It is important to note that
whether thedynamicpartof the tariff is linked to the regulatednetwork tariff or the
competitive retail price ‐ or both ‐ does not influence the consumer’s (or the
technology’s) response. As far as the consumer (or the technology) is concerned,
he/she/itisreceivingpricesignalstoshiftconsumptiontocheaperhours.

5
14%
34%
21%
11%
5%
17%
12%10%
TOU CPP CPR RTP
PeakRedution(%)
PeakConsumptionReductioninDynamicPricingPilots
Automation No automation
+172%
+93%
+75%
+10%
Consumptionreductionatpeaktimes(Figure11)
Pilotresultsshowthathomeautomationenhancestheimpactofdynamictariffsby75‐
172%(ignoringRTP).Thoughallthetestedtariffsschemeshaveprosandcons,dynamic
pricingcoupledwithhomeautomationhaveprovenoneof themosteffectiveways to
securedemandflexibilityin
the residential sector. It is
important to keep in mind
that though TOU and RTP
peak consumption
reductions are the lowest,
theyoccurdaily,whilstCPP
and CPR produce the
highestreductionsbutonly
for critical peak periods,
typically about 30 hours a
year. Pilot results would
indicate that rewards for peak clipping (CPR) are much less effective than penalties
(CPP).ItisimportanttokeepinmindthatCPRmightconstituteamoreacceptableform
ofdynamicpricing,thusachievinggreatermarketpenetrationandagreateraggregated
impact on national consumption. CPP alone may also be perceived negatively by
consumersand thushinder the introductionofotherproductsandservices related to
homeautomationwhichrequiresatisfactionandtrustinenergysupplier.
In order to reap the full benefits of home automation (i.e. peak clipping, managing
surroundingpeak time consumption and energy efficiency), our findings indicate that
homeautomationofferingsshouldgohand inhandwithdynamic tariffs, consumption
feedbackandconsumereducation.Variousmodellingexerciseswereconductedbased
onthisfinding.

6
ImpactoffeedbackandautomatedDRonannualelectricityconsumption(Figure26)
How would home automation impact Norwegian households’ power consumption?
‐ Impactonannualconsumption
Norwegianhouseholdscoulddecreaseelectricityconsumptionbyanamountequivalent
to about 7% of their annual usage thanks to home automation, dynamic pricing,
consumptionfeedbackandconsumereducation.Thisamountsto1,065–1,104kWhper
yearforanaveragehouseholddependingonthedynamictariffscheme.Asimilarimpact
onannualconsumptionisobservedacrosspricingschemes.Thiscanbeexplainedbythe
factthatoverallconsumptionismostlyinfluencedbyfeedbackandconsumereducation
ratherthanbydynamicpricing(whichtargetspeakconsumption).
‐ Impactonannualpeakconsumption
When investigating the effects of home automation, dynamic pricing, consumption
feedback and consumer education on annual peak consumption, the effectiveness of
TOU stands out. An averageNorwegian householdwith automatedTOU could reduce
consumptionby an amount equivalent to about 14%of its annual peak consumption.
ThisisduetothefactthatTOUimpactsconsumptiondailywhereasCPPandCPRimpact
consumptiononcriticalpeakdaysonly(typically12–15timesayear).Itisimportantto
keep in mind that TOU, due to its rigid structure, lacks the flexibility to deal with
extremeprices on thewholesalemarket outside of “usual” peak hours or unexpected
network constraints. TOU and CPP (or CPR) can however be combined to retain the
1415
1048
627
1073
1406
1042
623
1066
1405
1041
622
1065
1456
1079
645
1104
kWh
AnnualElectricitySavingsperhousetype
Automated TOU+Feedback
Automated CPP/CPR+Feedback
AutomatedTOU+CPP/CPR+Feedback
Automated RTP+Feedback
Average household

7
possibility to dealwith unexpected events (CPP / CPRprices are triggered on critical
days)whilsthavingadailyimpactonpeakusage(asTOUareinforceeveryotherday).
In fact, our results indicate that a combination of TOU and CPP/CPR works best at
reducingannualpeakconsumption(512kWhperyearforanaveragehousehold).
ImpactoffeedbackandautomatedDRonannualpeakelectricityconsumption(Figure27)
‐ Impacts on the peak consumption of the year’s highest consumption day
Although, the impact of CPP/CPR on annual consumption is limited, they prove very
powerfulatloweringcriticalpeakconsumptionwhencombinedwithhomeautomation.
AnaverageNorwegianhouseholdonCPP/CPRpricingcouldlowerpeakconsumptionby
2.37kWh(28%)onthehighestconsumptiondayoftheyearwhenCPPpeakpricesare
inforce.

8
ImpactoffeedbackandautomatedDRonhighestconsumptiondaypeakelectricityconsumption
(Figure32)
How would home automation impact Norway’s power consumption?
TheresultsshowthatNorwaycouldbenefitenormouslyfromagreaterpenetrationof
home automation technology, dynamic pricing, consumption feedback and consumer
education.
‐ ImpactonNorway’sannualconsumption
Norway’sannualoverallandpeakelectricityconsumptioncoulddecreaseby414GWh
(1.17%) and 85 GWh (2.31%) respectively by 2020 when 17% of households have
adopted a combination of home automation, dynamic pricing, consumption feedback
and consumer education. By 2030, with a market penetration of 48%, these figures
couldreach1,142GWh(3.22%)and234GWh(6.37%).

9
0,46
1,27
2,09
2,66
0,0
0,5
1,0
1,5
2,0
2,5
3,0
PENETRATIONRATE2020(17%)
PENETRATIONRATE2030(48%)
PENETRATIONRATE2040(78%)
PENETRATIONRATE100%
GWh
PeakConsumptionReduction‐ Year'shighestconsumptionday
Peak Savings
Impactonhighestconsumptiondayof2015(Figure33)
ImpactonNorway’soverallandpeakelectricityconsumption(Figure28)
‐ ImpactonNorway’speakconsumption
UsingJanuary2nd2015(year’shighestconsumptionday)asabaseline–whenCPP/CPR
pricesareinforceandconsumerswithRTPhavebeennotifiedofhighwholesaleprices
–ourmodellingshowsthathomeautomationtechnology,dynamictariffsandfeedback
could lowerNorway’selectricitypeakconsumptionby0.46GWh(2.81%)by2020.By
2030,thisfigurecouldreach1.27GWh(7.75%).
Norway is one of the
few countries where
electricity is
household’s main
heating source. Our
findingsrevealthaton
Norway’s highest
consumption day,
electric heating alone
couldprovide43%of
85 234384 491414
1142
1875
2396
0
500
1000
1500
2000
2500
3000
PENETRATIONRATE2020(17%)
PENETRATIONRATE2030(48%)
PENETRATIONRATE2040(78%)
PENETRATIONRATE100%
GWh
AnnualOverallandPeakConsumptionReduction
Peak Savings Overall

10
the country’s potential for residential peak consumption reduction. Our analysis also
shows that electric water boilers and white goods represent a significant portion of
electricity consumption in Norwegian homes and could provide sizeable demand
flexibilityandenergyefficiencygains.
Technologies – for now…
Even though there is no clear winner around home automation technologies, it does
seemtobecomingtogether.Thereportdiscussesfourscenarioswhichallareprobable
outcomesof thepolitical decisions andbusiness investments in thenext two to three
years.Thedependenciesarestillrelatedto findingcommoncommunicationstandards
ofHomeAreaNetwork(HAN),andtheinvestmentsbeingmadeinthisarealatelyshows,
that the industry is nowmaking their final decisions onwhom they thinkwill be the
winners.
…and the future
Finally,thereportintroducessomeofthemostinnovativeautomation‐focusedservices
and technologies currently being tested or commercialised around the world.
Interestingly, home automation technology is not only rapidly becoming far more
developed,butitisincreasinglyfocusedonmorethanjustoneorjustafewappliances.
Thetrendistocreatecomprehensiveandinclusivesolutionsthroughtheintegrationof
multipleservices,technologiesandconsumers.Thisevolutionisbuiltontheinternetof
things, communities and facilitating platforms, creating synergies of ever increasing
benefitsfortheconsumer.Putsimply,themoreelementsthatareintegrated,thegreater
thereturns forcustomers, themoreattractive thebusinesscase, themoresustainable
thebusinessmodel.
Smartmeters,homeenergymanagementsystems,smarthomes,distributedgeneration,
storage,electricvehiclesandmoreareallbeingbroughttogetherintoharmonisedeco‐
systems. Automation ensures that the integration takes place discretely in the
background in the way that we would want it to happen, with minimal need for
customereffort.What’smore,thegreaterthenumberandvarietyofelementsthatare
integrated,themoreimportanttheroleofautomationbecomes.

11
Introduction
Theabilitytobothincreaseandreduceenergydemandisoftenseenasanimportantand
relatively inexpensiveelement inprovidinggrid flexibilitywhilst integratinga greater
proportionofintermittentenergyandpreparingthegridfortheincreasingpenetration
of new electricity intensive appliances such as electric cars and heat pumps (both
expanding rapidly in Norway). There are however limits to the speed with which
consumerscanmanuallyreact–whentheycanreactatall‐topriceorvolumesignals.
Thismeansthatwithoutautomationautilitycanonlyaskresidentialconsumerstoshift
load if they know thiswill be necessarywell in advance (typically a day). This is not
alwaysthecaseasunforeseenemergencysituationscanoccurwhichdecreasesthevalue
oftheDemandResponse(DR)program.Byautomatingtheusageofcertainappliances,
householdelectricityconsumptioncaninstantlydropwhenpricesarehigh,networkare
congested or increasewhen green energy is available benefiting consumers, network
operatorsandthebroadercommunity.
However,intheresidentialsector,thesizeofloadsbeingswitchedisusuallylimitedand
thecostofthetechnologyrequiredisoftenseenasadeterrent.Consequently,thescale
ofrewardscomparedtotheeffortandcostofinstallingahomeautomationsystemmay
beseenasinadequate.
This is to ignorethatresidentialdemand isoftenasignificantportionof totalnational
demand and an even higher portion of national peak demand. In 2015 in the UK the
residential sector made up 30% of the total electricity power demanded (35% in
Norway)and60%ofpeakconsumption.Inaddition,residentialpeakprofileisdifferent
to thatof industryand therefore the twoprovidecomplementary flexibility resources.
Thechallengeisthustofindwaysofenablingittobeaccessed.Multipletrialshavebeen
conductedtoexplorethepotentialofhomeautomation.Whilethesetrialsgenerallyhave
demonstratedthatwhenusedeffectively,homeautomationdeliversnotonlysubstantial
consumptionreductionsandcost‐savingstoenergyconsumers,theycanalsobringhigh
levelsofsatisfactionandloyalty,animprovedperceptionoftheindustryandallowfor
otherservicesthatprovideaddedvalueandconveniencetotheconsumeraswellasnew
businessmodelsfortheenergyindustry.Thoughslowtodevelopuntilrecently,business
applicationsofthesetrialsarenowbeingincreasinglycommercialised.

12
ItisexpectedthatNorwayrepresentsoneofthemostsuitablemarketsintheworldfor
home automation and the services that follow on from them: high residential
consumptionandenergybills(despitesomeofthelowestelectricitypricesinEurope),a
high proportion of electric heating (controllable load), an increasing penetration of
electriccarsandheatpumps(alsocontrollableload),technologicallysavvypopulation,
significant levels of retail market competition, ongoing smart meter deployment and
high income levels (consumers with higher incomes are better able to invest in EE
solutions).Thisresearchthusexploresthepotentialofhomeautomationtechnologiesin
Norwayandidentifies:
1. Thecriticalsuccessfactorsofhomeautomationprojects:Mainlearnings
fromprojectsonhowtofacilitatetheadoptionbycustomersofsmarthome
technologiesandmaximisetheirimpacts;
2. The potential of home automation for EE and flexibility in Norway:
Assess the impact of home automation technology and services in the
Norwegiancontextbasedonresultsofseveralhundredpilots;
3. ThepotentialimpactofhomeautomationonNorway’sresidentialand
national power consumption: Output from the previous research
questions will constitute the building block of further analyses for
NorwegianhouseholdsandforNorway;
4. State‐of‐the‐arthomeautomationtechnologiesandprojects:Reviewof
the latest trends and most promising home automation technologies and
projects.

13
A definition of home automation
Inassessing thepotentialofhomeautomationonemay rapidly run into thequestion;
“Whatishomeautomation?”AsimplesearchofthetermonGooglereturnsnolessthan
21millionhitsandtherelated“SmartHome”morethantwicethisnumber.Accordingto
Collins English Dictionary home automation is: “thecontrolofdomesticappliancesby
electronically controlled systems”. However, this definition is not taking into
consideration the possible feedback and educative aspects also enabled by the
technology. Hence for this report we will broaden the term and describe home
automation as: “Buildingautomation inhouseholds,which involveselementsof control,
monitoring, feedbackandautomationofenergy consumingappliances suchas: lighting,
heating, ventilation, air conditioning, as well as white goods such as washing
machines/dryers,ovensor refrigerators/freezerswith theaimofdecreasingoveralland
peakenergyconsumption.”Homeautomation isoftenextended toalso includecomfort
and security related measures such as air quality and surveillance/alarms. These
features are not included in this report even though theymight be of importance for
developing a comprehensive value proposition to consumers and related business
models.

14
1 Success factors in home automation projects
Goingintodetailaboutallthebarrierstohomeautomationandhowtoovercomethem
wouldrequireaseparatestudyandshouldalsoincludeathoroughinvestigationofthe
specificNorwegianconditionstobeaddressed.Thischapterseeks insteadtohighlight
critical success factors from a high‐level perspective to be considered before
undertakinghomeautomationprojects.
1.1 Communication technologies
Oneofthemainbarrierswhichhaspreventedmany
people from buying existing home automation
systems is the lack of communication standards –
and in this respect the lack of confidence that the
productwill be able to upholdmaintenance supply
andcompatibilitywithnewproducts.Thisisoneofthemaincriticalfactorsinrelation
tohomeautomationbecomingasuccess.
The two leading technologies have so far been ZigBee and Z‐wave – two radio
technologies with different pros and cons – and different supporter groups in many
countries. Neither of these technologies however, has gained a significant advantage
overtheother–especiallybecausethetwotechnologiesaregoodfordifferentpurposes.
ZigBeeischeaperandeasierto incorporateintonewsolutions,as it isopensource.Z‐
wave tries to avoid interference problems by operating in a different frequency than
mostotherradiotransmitters.Italsotriestobecomethecustomer’schoicebykeepinga
strictpolicyfordevelopmentanduseoftheprotocol.
Many experts seem to believe that the end for Z‐
wave and ZigBee is soon to come partly because
none of the big market players has adopted them,
and more importantly because the Bluetooth
technology, which is already present in many
household devices, has recently announced a low
energy, MESH capable protocol called Bluetooth‐Low‐Energy or BLE; technology
recentlyacquiredbyQualcomm,oneof theverybigplayers in the field.Thisreport is
focusedonthecommunicationtechnologiestoenableasmarthometofunction,i.e.:the
communicationtechnologiesbetweensmartappliances,whichshouldbewirelesstoget
“ManyexpertsseemtobelievethattheendforZ‐waveandZigBeeissoontocome.”

15
customeracceptance.InaNorwegiancontext,itishowevergoodtoobservethatsome
thoughtonstandardshasalreadybeenenvisioned.AreportbyNEK(2015)concludes
that smart meters in a Norwegian context cannot function as a hub and that smart
appliances would need another central device to function, which could act as a
middlewarebetweenthesmartmeterandthesmarthome.
ThereporttouchesupontheconnectionbetweenthesmartmeterinitselfandtheHAN.
It is concluded that the connection needs to be wired and be based on the M‐Bus
standard.ThisisthesamestandardwhichispromotedbytheEUtoreadsmartmeters
remotely ‐ hence it doesmake sense to adopt these prescriptions also for residential
userstohaveaccesstorealtimedata.Therearehoweveralotofconsiderationstotake
inordertomakethetechnologyaccessibletotheend‐customer.Firstandforemost,the
wiringprocessmightcomplicatethecustomeracceptanceof In‐HouseDisplays(IHDs)
asmostofthesefunctionsareonlypossible if themeter isreadopticallyorfromwire
clamps.Itisnot100%clearwhetherthisisacceptedinaNorwegiancontext,asthereis
no real connection involved ‐ only an automated reading. Second, M‐Bus is not a
common standard inmost home automation equipment, since it requireswiring and
simply uses toomuch electricity to be performingwell (home automation equipment
often requires batteries to function). From this it should thus be noted, that home
automationunderthecurrentNorwegianlegislationwillneedapieceofmiddlewareto
ensuretheconnectionbetweenthesmartmeterandthehomeautomationsystem,asit
isunlikelythatthewholesystemwillworkfromtheM‐Busstandardalone.
1.2 Choice of technology
When it comes to home automation
systems,strategieshavebeenmanifold.
Thefirstsystemswereproprietary,not
connectedandfocusedononlyoneora
very few appliances in the household,
likeaheatpumporthelights.Thereis
still no satisfactory choice for a mass
marketdeploymentofanyhomeautomationsystemandthiscanbeseenasoneofthe
maincriticalsuccessfactorsinordertoreachscaleintheresidentialmarket.
“ThereisstillnosatisfactorychoiceforamassmarketdeploymentofanyHomeAutomationsystemandthiscanbeseenasoneofthemaincriticalsuccessfactorsinordertoreachscaleintheresidentialmarket.”

16
Therearedifferentanticipationstothefutureoftheconnectedhome.InMay2016PA
consultinghadasessionwithexpertsfromallovertheworldtoextractthemainviews
intooneconsolidatedmodel.
Basically,themodelpredictsfourdifferentscenarios,whichcouldallbearealityin2025
dependingondecisionsnowandinthecomingyears.Inthescenariosontheleft‐hand
side, there is a risk, that solutions are only fragmentarily adopted, if either no
communication standard emerges or if data securitymeasures are so strict that data
cannotbeexchangedrelativelyeasilybetweenserviceprovidersand thecustomer.As
discussed in Chapter 1.1 it seems that communications standardswill finally emerge.
For security, however it is still verymuch up to the national legislators to determine
howdatamustbehandled.
Figure1:TheConnectedHomein2025(Source:PAConsulting2016)

17
Figure2:AmazonEcho–Amaincontendertobecometheheartoftheconnectedhome
Forahomeautomationscenario to function, the twoscenarioson theright‐handside
are however the most suitable, since they are the only ones with mass adoption of
technology.Thedifferencebetweenthetwoscenariosarealsoaclearindicationofthe
battlewhich isbeing foughtrightnowasApple,Microsoft,GoogleandAmazonareall
tryingtosecuretheirroleasthemainenablersofconnectedhomesofthefuture.
Figure 3: Anyware (right picture) and Green Energy Options (left picture) – Home Automation
Solutions
Itisbynomeanssurehowever,thattheleadingtechnologyprovidersoftodaywillalso
lead the future. One critical success factor has always been the ability to incorporate
new ideas, somethingwhichproprietary solutions have alwaysmissed out on. In this
respect the announcement of IBM to join theEnOceanAlliancewas a clear indication
that supporters of open standards had to stand up against the proprietary brands.
EnOceanalreadycounts suchprominentmembersasYamaha, SiemensandSchneider
Electric but is based on a protocol developed by one of the leading providers of
technology for theconnectedhomewhichhasbeenprovidingsolutions formore than
15years.Itisalsoworthmentioning,thatnew2ndgenerationtechnologyisnowbeing
developed and brought to market by smaller companies. One such solution is the

18
integrated storage battery by thewell acclaimedBritishmanufacturer of IHDs; Green
EnergyOptions.AnotheristheKickstarterfoundedgeo‐fencesolutionAnyware,which
integrateswithexistinglampsocketstoprovideadditionalservicesincombinationwith
otherwirelesstechnology.
1.3 Tariffs as barrier and enabler
Thefactthatconsumers’consumptiondecisionsdonotaccountforthecostofproducing
and transporting electricity in thedifferent timeperiods is one of electricitymarket’s
majorfailuresfromaneconomist’spointofview.Indeed,althoughthecostofsupplying
powertoconsumerscanvarybyanorderofmagnitudewithinthesameday,theprice
paid by most end‐users remains flat all year round in many countries leading to a
numberofinefficienciesandavoidableexternalities2.Mitigatingtheeffectofthismarket
failurebypassingonsomeormostof thepricevolatilityon toconsumers isarguably
dynamic pricing’s major objective. Dynamic pricing involves substantially increased
retail electricity prices during times of heightened wholesale prices caused by
heightenedconsumption(forexampleonabnormallycoldwinterdaysinNorway)and
or when the stability of the system is threatened and black‐outs may occur3. In this
respect, thedifferenttariffs inthereportarenotspecifiedaseitheraregulatednetwork
tariff ora competitive retailprice. Thetariffscould in theory be managed by a third
entity “the DSM authority” bridging the economics of the wholesale market and the
balancing activities of the grid companies. It is important to note that whether the
dynamic part of the tariff is linked to the regulated network tariff or the competitive
retailprice‐orboth‐doesnotinfluencetheconsumer’s(orthetechnology’s)response.
As far as the consumer (or the technology) is concerned, he/she/it is receiving price
signalstoshiftconsumptiontocheaperhours.HighpricesmayoccurdailyaswithTOU,
oratcriticaltimesforthesecurityoftheelectricitynetworkaswithCPPandCPR.There
is no doubt that dynamic pricing has proven its value in securing consumption
reductionsatpeaktimes.Therearehoweverimportantandcriticalfactorswhichshould
always be taken into account when assessing whether or not to introduce dynamic
tariffs.
2Needforbuildingseldomusedpeakcapacity,dirtieron‐peakgeneration,andcurtailmentofgreen
generationtociteonlyafew.3DynamicpricingschemesaredescribedinChapter2.3.

19
First and foremost, it is very
clear that dynamic tariffs work
because people try to avoid
paying high prices during peak
hours. However, the impact of
peak pricing is not similar
across all segments of
consumers.TheCaliforniaState‐widePricingPilot,alargepilotassessingtheimpactsof
dynamicpricingonpeak consumption and energybillswhich tookplace in 2003and
2004, showed that high‐use customers respond significantly more than do low‐use
customers,whilelow‐usecustomerssavesignificantlymoreontheirannualbillthando
high‐use customers. This illustrates just one of many elements in the complexity of
introducing a tariff like CPP.Whereas flexibility is secured by targeting only high‐use
customers, thebenefitandeconomicvalueofparticipating isworthmore for the low‐
usegroups.Followingthepilotresults,CPPtariffshavebeen introducedasopt‐outby
manyCalifornianutilities toavoidblack‐outsduring the summer. In a contextof very
high needs – andwhere people can see the immediate benefit (for example as in the
Californian case) introducing this kind of tariffs should be considered. However, the
other sideof the coin is thatCPP tariffs alonecanbe regardedas just anotherwayof
increasing the energy bill and thus ruining a utility’s opportunity to introduce other
productsandservices(e.g.homeautomation)whichrequirecustomersatisfactionand
engagement.
Itisimportanttoconsidercarefullywhatthemaingoalofintroducingdynamictariffsis
and what they can achieve. Dynamic tariffs work very well for peak clipping and to
address exceptional stress on the grid. However, if the target is also to secure
sustainablereductionsinoverallconsumption,dynamicpricingaloneisnottheanswer.
Education and customer engagementmust be part of the equation. The figure below
illustratesthispoint.Dynamicpricingpilots inwhichparticipantswereeducatedasto
howtotakeadvantageofthetariffsachievedmuchbetterresultsineveryaspect.
“Dynamictariffsareeffectiveatmanagingpeakdemandbutcanberegardedasjustanotherwayofincreasingincomeandthusruiningautility’sopportunitytointroduceotherproductsandserviceswhichrequirecustomersatisfactionandengagement.”

20
Nº of participants (Nº of samples) Education No Education
Overall reduction 82 330 (122) 380 758 (109)
Peak reduction 133 676 (241) 404 351 (149)
Following peak hours 46 628 (71) 114 363 (111)
Figure4:DynamicPricingPilotsandEducation(Source:VaasaETTDatabase2016)
1.4 Education and engagement
Whilesomearguethatthereisnopointtryingtoengageandeducateconsumerssince
homeautomationtechnologyisready,behaviouralscienceandpilotresultspointtothe
contrary. Behavioural experts state
that when efficiency improvements
come solely from the technological
side, people remain passive actors,
leading to low levels of awareness,
continued inefficient habits and
behaviours and well documented
reboundeffects.Ineffecthomeautomationonitsownwillalmostcertainlyleadtopeak
clipping but it will not lead to any significant long lasting reductions in overall
consumption.WewilldiscussthisinmoredetailsinChapter2.5.
Theremaybetwoadditionalreasonsrelatedtoeducationandengagementthatexplain,
whymarketadoptionofhomeautomationhasbeenslow.First,homeautomationhas
oftenbeenintroducedfollowinganinvertedevolutionwherebytechnologyhasbeenat
thefore‐front,withconsumereducationandfeedbackbeingintroducedasanext‐stepor
2,85%
14,11%
‐0,77%
1,39%
7,40%
‐2,12%‐4%‐2%0%2%4%6%8%10%12%14%16%
OVERALLREDUCTION PEAKREDUCTION FOLLOWINGPEAKHOURS
Reduction(%)
ImpactofEducationinDynamicPricingpilots
Education No Education
“Step‐by‐stepdiscoveryandconsumereducationarecriticaltocreateamassmarketforhomeautomation.”

21
reactiontonegativepublicity.Pilotsandconsumerresearchhaveshownthat itcanbe
usefulandimportant formanyconsumerstounderstand, for instancethroughmanual
involvement at first, the relationship between their consumption behaviour and their
billsandhowtheycouldbenefitfromhomeautomationtechnology.
AnotherreasonmaybethatDRseemsto
conflictwithtraditionalbusinessmodels
in the industry whereby retailers sell
kWhandDistributionSystemOperators
(DSO)/Transmission System Operators
“itisacriticalsuccessfactorforautomationprogrammesthatallstakeholdersseethebenefits.Educationandengagementarenotlimitedtoend‐customers.”
Launched in 2010 in Italy, Finland and Sweden, the project introduced
applications that enabled consumers to monitor their energy use and
compete with other participants through quizzes and serious games.
Consumers were able to check on the consumption of individual
appliancespresentedascardsinacarouselbytappingonthecardoftheir
choicetorevealfurtherdetails.Participantswereonlypresentedwiththe
amountofinformationtheyrequired,whentheyrequestedit.
Figure5:Be‐AwareProjectDiscovery(2011)
Users reported increased awareness and knowledge about energy
consumptionandahighsatisfactionwiththetestedsolution.
STEP‐BY‐STEPDISCOVERY:BE‐AWAREPROJECT

22
(TSO) are paid to build networks that meet peak demand. It is thus important to
understandthedriversandbarriersofthedifferentpartiesinthevaluechain.Education
and engagement are in this respect not limited to end‐consumers. Benefits from DR
programs are summarised in the following graph and analysed afterwards focusing
separately on the perspectives of the different stakeholders: DSOs, TSOs and
intermediaries(i.e.suppliers,aggregators).
Figure6:BenefitsofDRprogramsfordifferentstakeholders(Source:FP7projectAdvanced2013)
1.4.1 DSOs and TSOs
Increasing load on distribution substations has been noticed in periods with cold
temperaturesduringwintertimeinNorway.WithanincreasingnumberofEVsandthe
endofoilandkeroseneassourcesforheatingthistendencyisboundtocontinue.Both
TSOsandDSOsmustdesign theirnetworks in aneconomicandefficientway tomeet
peakdemand.TheflexibilityprovidedbyDRprogramscanhelpmanagepeaks,working
asacost‐effectivealternativetogridinvestments.
A well‐designed demand
flexibility program can help
balance the electricity
system,increasetheloading
capabilities of the
transformers and relieve
voltage‐constrained power
“InordertoensuretheeffectivenessofDRprogramsforDSOsandTSOs,itisimportanttotakeunderconsiderationthelengthoftheregulatoryperiodandthelocationoftheparticipant‐installations;DSOscanhighlybenefitfromDRprogramsthattargetcustomersatspecificlocations.”

23
transfer problems. Some countries are already investigating such benefits, bymoving
towardsTOU4distributionnetworktariffsasafirststepofgettingpeopletoadoptRTP
ata later stage.ByusingDRasapossible substitute fornetwork investments in their
networkplanningstrategies,DSOswouldbeexpected to reduce investmentsand thus
reducetheirCAPEX(i.e.depreciationandinterest)intheshort‐term.Atthesametime,it
could involve an increasedOPEX depending on how the DR program is implemented
andremunerated. If theCAPEXis includedinthecapalready,andthe increasedOPEX
doesnotsurpassthisreduction,theDSOcouldmakeadditionalbenefits.Thiswouldlast
untiltheendoftheregulatoryperiod,whenthefinancialeffectsofinvestinglessshould
bepassedthroughtoconsumersbymeansoftheupdateoftheallowedrevenueandthe
networktariffs.Therefore,boththeincentivetocarryoutDRinvestmentsbyDSOsand
the transfer of these benefits to DSOs would be dependent on the length of the
regulatory period and on the exact costs that were recognised as efficient costs to
determine the allowed revenue for that regulatory period. Thus, to ensure the
effectiveness of DR programs for DSOs and TSOs, it is important to take under
consideration the length of the regulatory period and the location of the participant‐
installations; DSOs can highly benefit from DR programs that target customers at
specificlocations.ThevalueofcontrollingtransmissionnetworkthroughDRprograms
also depends on the level of existing transmission capacity and generation fuel cost
differentials.
1.4.2 Intermediaries: Retailers / Aggregators
Inmost cases, DR service providers are retailers or third party aggregators as those
companies can use the flexibility as a tool to manage their customers' energy
consumptionmore effectively and be financially rewarded by other actors (e.g. DSOs,
TSOs)forit.Atthesametime,theycan
optimisesourcingcostsastheywillbe
able to purchase energy more
effectively on the wholesale market.
Theycanalsosave transmissioncosts
bybeingable touse locallygenerated
4DynamicpricingschemesaredescribedinChapter2.3.
“Peakclippingasthemainachievementofhomeautomationlowerstheneedtoinvestinpeakcapacitywhichatthesametimelowerstheneedtoconstructnewpowerplants.”

24
energytomatchlocalsupplyanddemand.Theflexibilityprovidedbyhomeautomation
canbalancetheunpredictabilityofrenewableenergypowerplants,helpingtointegrate
them into the grid. Additionally, peak clipping as the main achievement of home
automation lowers theneed to invest inpeakcapacitywhichat thesame time lowers
theneed toconstructnewpowerplants.Although thesizeof thebenefitsdependson
many uncertain factors, it is reasonable to expect that, as long as the number of
consumers they represent is large enough, the commercial role of the
retailer/aggregatorwouldmakeforapositivebusinesscase.
1.4.3 Pillars of customer engagement
Researchintocustomerengagementhasrevealedasetofclearstepsthatarerequired
aspartoftheengagementprocess.Thesethreepillarsofengagementaresummarisedin
Figure7.
Inall engagementprocesses the first step is tomakeclearwhatneeds tobeachieved
(goalsandsegments).Itisamongthemostcommonerrorsandmisconceptionstoskip
thisstepormakesomeveryhighlevelgoalswhichareimpossibletomeetormeasure.
“Growincomplexity”,thesecondcriticalsuccessfactorofconsumerengagementisalso
the hardest. To keep people engaged the communication needs to grow with the
consumer’sincreasedunderstandingandassuchdeliverakindofdialogue.
Thethirdcriticalsuccessfactorisrelatedtotheabilitytosustaintheresultsandcollect
bothconsumptiondataand feedback fromend‐consumers toensuretheyaresatisfied
and have the ability to improve the product based on first‐hand experience. One
Figure7:Threepillarsofthecustomerengagementprocess

25
importantaspectinrelationtothispointistheoftenoverlookedfactthatparticipating
consumersshouldbegivenregularfeedbackontheprogrammetheyareparticipatingin
–evenifnoeventhasoccurred.Regularcommunicationiskeytoestablishingtrust.
1.5 Market potential for home automation technology in Norway
Thereisnodoubtthatthepast10yearshaveseenarapiddevelopmentaroundhome
automationtechnology.Six‐sevenyearsago,homeautomationwasthetalkofthetown–
and everybody in the utility industry
believed the systems would pop up,
plugandplayready,verysoon–butit
still hasn’t happened. Even the largest
energy event of the year; European
Utility Week had its own pavilion for
SmartHomeswheresmallstart‐ups–aswellasthelargestcorporations–bloomedwith
promising technologyand innovative ideas.By2012/13thismovementexperienceda
suddenstop–and in theaftermath, itbecameclear, that therearea lotofbarriers to
overcomebeforehomeautomationbecomesarealityfortheB2Cmassmarket.
Figure8:SmartHomeshaditsownpavilioninEuropeanUtilityWeek2010inVienna
Itshouldbementionedhowever,thatthebusinessisstillseenashavingabrightfuture.
As an illustration, market research company Statista expects revenues in the energy
management segment of home automation technologies to grow at an annual rate of
20.6%betweennowand2021; resulting inamarket volumeofUS$78m(US$161per
activehousehold) forNorwayalone.Thegraphbelowshowsprojectionsmadeby the
same company regarding the market penetration of home automation technology in
Norwayuntil2021.21%ofNorwegianhouseholds (about0.5millionhouseholds)are
“Six‐sevenyearsago,homeautomationwasthetalkofthetown–andeverybodyintheutilityindustrybelievedthesystemswouldpopup,plugandplayready,verysoon–butitstillhasn’thappened.”

26
expected to have energymanagement home automation technology by 2021 up from
5%today.
Figure9:MarketpenetrationofhomeautomationtechnologyinNorway2015–2021(Source:Statista
2016)
2015 2016 2017 2018 2019 2020 2021
Home Automation Technology Market Penetration Rate

27
2 Potential of home automation for EE and DR
This chapter investigates the potential of home automation to manage and reduce
electricityconsumptionintheNorwegiancontext.
2.1 Methodology
VaasaETTkeepsanup‐to‐datedatabaseconsistingof,atthetimeofwriting,closeto140
EE and DR programs around the world, including 569 samples, and involving over
930,000residentialcustomers.Thedatabasecompilesthefindingsofbothfeedbackand
dynamic pricing programs with and without appliance automation. The VaasaETT
database is the largest of its kind. It is able to provide statistically robust quantified
answers toquestionsrelatedto thepotentialofhomeautomationprogramstoreduce
consumptionlevelsand/ortomanageconsumptionintime.
Variousscenariosbasedonthedataextractedfromthedatabasehavebeeninvestigated.
The relevance of the results was ensured by focusing a) on pilots that took place in
conditions comparable and relevant to Norway i.e. high residential consumption and
long heating season and b) on pilots that focused on the most electricity consuming
appliancesfoundinNorwegianhomes.Thescenarioscomprisedthreebroadfeatures–
allofwhichareimportantaspectsofhomeautomationprojects:
Dynamictariffs5 Hometechnology Behaviouralchange
TOU Electricheating/Heatpump Consumptionfeedback
CPP/CPR Electricwaterboiler Engagementandeducation
RTP Whitegoods
To answer the research question, the following information was extracted from the
database:
• Changeinoverallconsumption(%kWh);
• Changeinconsumptionduringpeakhours(%kWh)6;
• Changeinconsumptionfollowingpeakhours(%kWh).
5DynamicpricingschemesaredescribedinChapter2.3.6Wereportaverageconsumptionreductionoverthewholepeakperiodwhenpeakpricesareinforce.The
durationofthepeaksdiffersdependingonthepricingscheme.Peakpriceperiodstypicallylastbetween1
and3hoursforCPP,CPRandRTPpilotsandbetween3and12hoursforTOUpilots.

28
As can be imagined, not all pilots researched all scenarios and all parameters. This
meansthatthesamplesizesonwhichourresultsarebasedvary.Tohelpthereader,the
numberofhouseholdparticipantsandthenumberofsamplesareindicatedundereach
correspondinggraph.
2.2 Overall pilot results
Thegraphbelowshowstheimpactofhomeautomationtechnologyonthreekeyaspects
of EE and DR: overall consumption reduction, peak consumption reduction and
consumptionimmediatelyfollowingpeakhours.
Nº of participants (Nº of samples) Automation No Automation
Overall reduction 15 585 (29) 530 080 (206)
Peak reduction 34 305 (73) 577 046 (324)
Following peak hours 9 567 (22) 266 419 (160)
Figure10:Impactofhomeautomationonelectricityconsumption(Source:VaasaETTDatabase2016)
Interestingly, this graph shows that home automation alone often leads to increased
levelsofelectricityconsumption.Pilotswithhomeautomationledtoaslightincreasein
overall consumption (‐0.07%) whilst
pilots without home automation
technology(manualresponsetodynamic
pricing and or consumption feedback)
‐0,07%
23,42%
1,77%2,48%
8,92%
‐1,65%‐5%
0%
5%
10%
15%
20%
25%
OVERALLREDUCTION PEAKREDUCTION FOLLOWINGPEAKHOURS
Reduction(%)
ImpactofHomeAutomation
Automation No Automation
“Ifautomationstandsalone,thereisariskofdisengagingpeopleandactuallyincreasetheiroverallconsumption.”

29
ledtosizeablereductionsinoverallenergyconsumption(2.48%)7.
Pilotswithautomationareneverthelessclearlymoreeffectiveatshiftingconsumption
awayfrompeakhours.Thereareseveralreasonsforit.Eventhoughconsumersshould
alwaysbeallowedtooverruntheprogram,automationenablesfastreactionsaswellas
controllable levels of reduction and has the advantage of being available during
unplanned system emergencies for
instance.Inaddition,criticalsituations
donot alwaysoccurwhenresidential
consumers are able to take action
(when they are away or asleep for
instance). Another important
consideration for grid operators is
that without automation they risk
seeingmillionsofappliancescomebackonlineatthesametimerightafterhigh‐price‐
hours end.Automation canhelpmitigate this riskby switching appliancesbackon in
cycles. This is also supported by the graph as consumption surrounding peak hours
slightly decreases in pilots with automation whilst it increases in pilots without
automation.
2.3 Effectiveness of dynamic tariff schemes
Dynamicpricing isoneof themostprovenwaysof enablingdemand flexibility.When
lookingatdifferentdynamicpricingschemesandtheaddedvalueofhomeautomation,
the results are straightforward. As shown by Figure 11 above, ignoring RTP, home
automationimprovestheresultsofpilotsby75‐172%.
7Chapter2.5shedslightonwhythismightbe
“Homeautomationismoreeffectiveatshiftingpeakconsumptionandmanagingthepaceatwhichappliancesarebroughtbackonline.”

30
Nº of participants (Nº of samples) Automation No Automation
TOU 20 124 (28) 509 508 (210)
CPP 13 201 (33) 59 272 (86)
CPR 699 (8) 3 217 (21)
RTP 281 (4) 5 049 (7)
Figure11:Consumptionreductionatpeaktimes(Source:VaasaETTdatabase2016)
ItisimportanttokeepinmindthatTOUandRTPpeakconsumptionreductionsarethe
lowestbuttheyoccurdaily,whilstCPPandCPRproducethehighestreductionsbutonly
forcriticalpeakperiods,typically12‐15timesayear.Itishoweverpossibletocombine
TOUwithCPPorCPR.
2.3.1 CPP – Most effective for peak shifting
CPP involves substantially increased retail electricity prices typically triggered by
heightenedconsumptionorwhenthestabilityofthesystemisthreatened.Thenumber
and the length of critical peak periodswhich the utility is allowed to call are agreed
upon in advance, when they are to occur is not. Residential customers are usually
notified a day in advance if the next day will be a critical day, but if automation
technology isprovided, theseratescanalsobeactivatedon thesameday.CPP isvery
effectiveatcuttingpeaks–anditisclearthatautomatedsolutionsworkbetter.
14%
34%
21%
11%
5%
17%
12%10%
0%
5%
10%
15%
20%
25%
30%
35%
40%
TOU CPP CPR RTP
PeakRedution(%)
PeakConsumptionReductioninDynamicPricingPilots
Automation No automation
+172%
+93%
+75%
+10%

31
Nº of participants (Nº of samples) Automation No Automation
Overall reduction 1 162 (3) 26 209 (35)
Peak reduction 13 201 (33) 59 272 (86)
Following peak hours 2 961 (8) 29 060 (36)
2.3.2 CPR – More rewarding for consumers but less effective than CPP
CPRareinverseformsofCPPtariffs.Participantsarepaidinaccordancetotheamounts
that they reduce consumptionbelow theirpredicted levelsduring criticalpeakhours.
ParticipantstoCPRpilotsusuallyreceiveapaymentaftereachcriticalpeakperiodora
deductionontheirnextbill.Thisdirectpaymentordiscountisbelievedtopresentthe
advantageofmakingtherewardofparticipants’effortsmoreconcretethantheconcept
ofsavingswhichmightbelesseasilyperceived.AsforCPP,thenumberandthelengthof
critical peak periods which the utility is allowed to call is agreed upon in advance
althoughwhentheyaretooccurisnot.ThegraphbelowshowsthatCPRislesseffective
than CPP at shifting consumption away frompeak periods bothwith automation and
withoutautomation.However,asconsumersarerewardedfordecreasingconsumption,
rather than punished for consuming at certain time, CPR might constitute a more
acceptable formofdynamicpricing, thusachieveinggreatermarketpenetrationanda
greaterglobalimpact.
1,88%
33,66%
‐1,68%
3,09%
17,47%
‐1,44%‐5%0%5%10%15%20%25%30%35%40%
OVERALLREDUCTION PEAKREDUCTION FOLLOWINGPEAKHOURS
Reuction(%)
ImpactofAutomationinCPPpilots
Automation NoAutomation
Figure12:ImpactofhomeautomationinCPPpilots(Source:VaasaETTDatabase2016)

32
Nº of participants (Nº of samples) Automation No Automation
Overall reduction 333 (4) 1 201 (8)
Peak reduction 699 (8) 3 217 (21)
Following peak hours 300 (4) 1 109 (8)
Figure13:ImpactofhomeautomationinCPRpilots(Source:VaasaETTDatabase2016)
2.3.3 TOU – Effective but lacks flexibility
TOU tariffs induce people into using electricity at timeswhen consumption is lower.
Pricesare thereforesethigherduring thehigherconsumptionperiodsof theday,and
lowerduringtherestofthedayandonweekends.Theycanhavetwo(peakandoff‐peak
prices)orthree(peak,partialpeakandoff‐peakprices) levelsofpricesperdaywhich
are always the same. This lack of
flexibility makes them rather unfit
going forward with an ever higher
penetration of intermittent
generation unless they are coupled
with CPP or CPR prices. As is seen from the results below, the impact on peak
consumptionisthelowestofthetariffschemesanalysed;however,unlikeCPPandCPR
theseeffectstakeplacedaily.
‐0,93%
21,23%
‐3,78%
1,85%
12,15%
‐1,03%
‐10%
‐5%
0%
5%
10%
15%
20%
25%
OVERALLREDUCTION PEAKREDUCTION FOLLOWINGPEAKHOURS
Reduction(%)
ImpactofAutomationinCPRpilots
Automation No Automation
“TOUcanbecoupledwithCPPorCPRtoachievedailypeakclippingwhilemaintainingtheabilitytodealwithunforeseenstressonthegrid”

33
Nº of participants (Nº of samples) Automation No Automation
Overall reduction 14 065 (21) 493 400 (157)
Peak reduction 20 124 (28) 509 508 (210)
Following peak hours 6 306 (10) 236 250 (116)
Figure14:ImpactofhomeautomationinTOUpilots(Source:VaasaETTDatabase2016)
2.3.4 RTP – a tariff scheme for the future?
Withtheintroductionofsmartmeters,moreadvancedtariffschemeshavebeentested.
One such tariff is RTP. Price development on thewholesalemarket are passed on to
consumers–normallybythehour.Inordertofurtherencouragereductionsduringhigh
price periods and reduce risk of high bills, participants are warned when wholesale
pricesreachacertainthresholddecideduponinadvance.Unfortunately,onlyfewRTP
pilotshavebeenconducted,hencethe
results below should be taken with
caution. They are nonetheless very
important as a vast majority (70%8)
ofhouseholdcustomers inNorwayarealreadyonspot‐tiedcontracts (abasic formof
RTP) and itwould thusmake sense to assume these householdswill adoptRTPonce
smartmetersaredeployed.
6StatisticsNorway(2016).
‐0,19%
13,72%
6,74%
2,41%
5,05%
‐1,75%‐4%‐2%0%2%4%6%8%10%12%14%16%
OVERALLREDUCTION
PEAKREDUCTION FOLLOWINGPEAKHOURS
Reduction(%)
ImpactofAutomationinTOUpilots
Automation No Automation
“Astariffsbecomemoredynamic,customerinvolvementbecomesmorenecessarytosecuresuccess.”

34
Nº of participants (Nº of samples) Automation No Automation
Overall consumption reduction 25 (1) 9 270 (6)
Peak reduction 281 (4) 5 049 (7)
Figure15:ImpactofhomeautomationinRTPpilots(Source:VaasaETTDatabase2016)
2.4 Automating the usage of home appliances
ThetablebelowshowsthebreakdownofelectricityconsumptioninNorwegianhomes
by appliance. Based on this information, we investigated the potential of automated
electricheaters/heatpumps,electricwaterboilersandwhitegoods(e.g.freezer,fridge,
etc.)forDR(peakconsumptionreduction)andEE(overallconsumptionreduction).
0,50%
11,25%
1,80%
10,19%
0%
2%
4%
6%
8%
10%
12%
OVERALLREDUCTION PEAKREDUCTION
Reduction(%)
ImpactofAutomationinRTPpilots
Automation NoAutomation

35
Appliances Electricityconsumption
(kWh/year)
Electricheaters 2,387
Electricfloorheating 1,268
Individualcentralelectricheater(possiblyalsooil,wood) 3,304
Electricwaterheater 2,955
Lighting,numberofspots>20 1,289
Refrigerator 1,076
Fridge‐freezer 1,093
Freezer 1,509
Tumbledryer 890
Washingmachine 1,575
PC 1,626
Swimmingpooletc. 5,967
Variouselectricalequipment 3,028
Figure16:ApplianceConsumptioninNorway,kWhperyear(Source:DalenandLarsen2013)
2.4.1 Electric heating and heat pumps
Norway is one of the few countries where electricity is the main heating source for
households. According to Statistics Norway, electricity accounts for about 73% of
household heating – and air heat pumps alone about 21%. Norway has seen a huge
growthinthenumberofheatpumpswhichmightbeduetothefactthatconventional
electrical heating panels are the most used source for heating. In 2012 conventional
heatingpanelsweretheprimaryheatingsourceinalmosthalfofNorwegianhouseholds.
Atthesametime27%ofallhouseholdshadaheatpump(+9%since2009).Especially
detachedhousesandfarmhousesinvestinheatpumps.
As heat pumps are driven by electricity, there is rarely a decrease in electricity
consumptionifahouseholdchangesheatingsourcetoaheatpumpfromoilorgas,but
householdswithaheatpumpuseproportionallylessenergythansimilarhomeswithout
aheatpump.AccordingtoStatisticsNorwayhouseholdslivingin150m2consume3,900
kWhlesselectricitywhenheatedbyaheatpumpthanwithotherheatingsources.For

36
villasbetween100and150m2thedifferenceisaround1,900kWh.Withelectricityas
theprimaryheatingsource,peakconsumptioniscloselyrelatedtotheweather,itthus
makessensetoconsiderelectricalheatingandheatpumpsasasourceofflexibility.
The figure below shows the impact of automated heating on electricity consumption.
Pilot results indicate that overall electricity consumptionwas reduced by 1.9%, peak
consumptionby23%andsurroundingpeakconsumptionincreasedbyabout0.8%.
Nº of participants (Nº of samples) Automated heating
Consumption reduction 13 481 (14)
Peak reduction 35 193 (30)
Following peak reduction 11 712 (8)
Figure17:Impactofautomatedelectricheating.(Source:VaasaETTDatabase2016)
2.4.2 Electric water boilers
Electric water boilers are among the most electricity consuming appliances in
Norwegianhomes.Theyarealsointuitivelyverysuitableforflexibilityaswatercanbe
heatedduringoff‐peakhoursandremainwarmastheboilerisswitchedoffduringpeak
hoursthusmakingthelossofcomfortalmostimperceptibletoconsumers.Thisisnota
newtechnologybutonethathasseldombeenputtouse.AnexceptionisFrancewhere
the load of 10 million water heaters (representing 3 GW) is currently automatically
shiftedaway frompeakhours tonight time (off‐peakhours).The figurebelowshows
the impact of automatedwater boilers on electricity consumption. Pilot results show
that overall electricity consumptionwas reducedby3.2%,peak consumptionby24%
andsurroundingpeakconsumptionincreasedonlyabout0.6%.
1,92%
23,24%
‐0,82%
‐5%
0%
5%
10%
15%
20%
25%
OVERALLREDUCTION
PEAKREDUCTION FOLLOWINGPEAKHOURS
Reduction(%)
ImpactofAutomatedHeating

37
Nº of participants (Nº of samples) Automated water boilers
Consumption reduction 4 060 (9)
Peak reduction 10 191 (22)
Following peak reduction 2 528 (5)
Figure18:Impactofautomatedwaterboilers(Source:VaasaETTDatabase2016)
2.4.3 White goods
As shown in Figure 16, a number of smaller appliances that can be grouped in the
categoryofwhitegoods(i.e.refrigerator,freezer,tumbledryer,washingmachine,dish
washer) represent a significant proportion of electricity consumption in Norwegian
homes‐especiallyinruralareaswherepeopledon’thaveaccesstosharedfacilities.The
figure below shows the impact of automatedwhite goods on electricity consumption;
overallelectricityconsumptionincreasedby1.7%,peakconsumptiondecreasedby26%
andsurroundingpeakhourconsumptionincreasedbyabout0.6%.
3,18%
24,43%
‐0,61%
‐5%
0%
5%
10%
15%
20%
25%
30%
OVERALLREDUCTION
PEAKREDUCTION FOLLOWINGPEAKHOURS
Reduction(%)
ImpactofAutomatedWaterBoilers

38
Nº of participants (Nº of samples) Automated white goods
Consumption reduction 12 518 (15)
Peak reduction 29 585 (30)
Following peak reduction 2 807 (5)
Figure19:Impactofautomatedwhitegoods(Source:VaasaETTDatabase2016)
Theresultsexhibitoneofthefundamental
differences between for instance an
automated electric heater and an
automated washing machine. While the
former’s consumption canbeboth shifted
(turn on or off) and optimised (turn up or down), the latter’s can only be shifted
(laundry needs done at some other time)whichmay bewhy automatedwhite goods
seemwellsuitedfordemandflexibilitybutnotforEE.
2.5 Education and feedback in home automation pilots
Figure10pointstoacrucialfinding:homeautomationalonetendstohaveanadverse
effectonhouseholds’overallenergyconsumption.Pilotswithhomeautomationsawa
slight increase in overall energy consumption (+0.07%) whilst pilots without home
automation(manualresponsetodynamicpricingand/orfeedbackprogrammes)ledto
significantreductions(‐2.48%).Althoughitmightappearcounter‐intuitive,thisfinding
isinfactconsistentwithbehaviouralscience.Indeed,whilesomewouldarguethatthere
is no point trying to engage and educate customerswho have automated appliances,
pilot results show that when efficiency improvements come solely from the
technological side, people remain passive actors, leading to low levels of awareness,
‐1,75%
25,85%
‐0,61%‐5%
0%
5%
10%
15%
20%
25%
30%
OVERALLREDUCTION
PEAKREDUCTION FOLLOWINGPEAKHOURS
Reduction(%)
ImpactofAutomatedWhiteGoods
“Automatingwhitegoodsiswellsuitedforpeakclipping,notforenergyefficiency.”

39
continued inefficient habits and behaviours andwell documented rebound effects. In
other words, home automation is well suited to shift consumption away from peak
hours but not to create reductions in overall consumption. Similar findings were
reportedfordynamicpricingpilots.(c.f.Figure4.)
Thegraphbelowquantifiestheeffectofeducationandfeedback(inotherwordsmake
use of the data generated by the home automation system to reduce overall energy
consumption) on pilot results. Pilots
combining home automation and
education/feedback are more effective at
reducing both peak (23% vs 22%) and
overallconsumption(2.7%vs.0.41%).Feedbackandeducationarethereforecrucialto
reduce the quantity of energy consumed in the home and reaping the full benefit of
homeautomationtechnology.
Nº of participants (Nº of samples) Feedback No feedback
Overall reduction 25 495 (30) 228 (3)
Peak reduction 22 906 (49) 7 278 (17)
Following peak hours 4 901 (11) 1 670 (6)
Figure20:Impactoffeedbackonhomeautomationpilots(Source:VaasaETTDatabase2016)
Apositivebusinesscaseandanappealingpaybacktimeareotherfundamentalreasons
whyeducationandfeedbackshouldbepartofanyhomeautomationpackage.VaasaETT
and Joule Assets, in an upcoming public report, looked at the business case for
residential demand side flexibility in 4 EU countries (France, UK, Italy and Germany)
andfoundthatbetween77%and87%ofend‐consumers’financialbenefitscomefrom
overall consumption reductions (the rest from peak clipping). This can be easily
2,68%
23,42%
‐1,48%
0,41%
21,73%
‐3,77%‐10%
‐5%
0%
5%
10%
15%
20%
25%
OVERALLREDUCTION PEAKREDUCTION FOLLOWINGPEAKHOURS
Reduction(%)
ImpactofFeedbackinAutomationPilots
Feedback No feedback
“Educationandfeedbackhelpreapthefullbenefitsofhomeautomationtechnology.”

40
understood if one considers the fact that critical peaks take place for only about 30
hoursayearwhilstbenefitsfromlowering
overall electricity consumption take place
daily. Offerings with both DR and
education/feedback are the best way to
secure financial returns for both grid
operatorsandconsumers.
MostNorwegianretailersalreadyofferconsumersaccesstogranularconsumptiondata
intheformsofenhancedbills,IHDs,mobileappsanddedicatedwebportalsasawayto
differentiate theirofferings,movecompetitionaway frompricesandestablisha trust‐
basedrelationshipwithcustomers9.
9SmartmetersareseenasnecessarytoprovidefeedbackandenableDR.Massrolloutiscurrentlyongoing
inNorwayandwillbecompletedbyJanuary1st2019.
“Couplinghomeautomationwithfeedbackisthebestwaytosecuresizeablefinancialbenefitsforthegridandconsumersboth.”

41
3 Impact of home automation on electricity
consumption in Norway
This chapter investigates the effects of home automation technology combined with
dynamic pricing and feedback onNorwegian household’s electricity consumption and
theiraggregatedimpactatnationallevel.Impactsweremodelledfordifferenthousehold
types,timeperiodsandunderdifferentscenariosformarketadoption.
3.1 Characteristics of household electricity consumption in Norway
According to Statistics Norway, the residential segment of themarket consists of 2.3
million households, consuming an average of 16,044 kWh per year (the highest in
Europe).Figure21showstheelectricityconsumptionbyhousetype.Detachedhouses
arethemostenergy‐intensivehousetype,withanaverageenergyconsumptionthatis
morethantwicethatforapartmentbuildings.Thisisduetoalargerdwellingarea,more
exteriorwallsand,often,morehouseholdmembersthaninanapartment.
Typeofhousing Annualconsumption2012
Detachedhouse 20211kWh
Rowhouse 14975kWh
Flat8953kWh
Averagehousehold 16044kWh
Figure21:Electricityconsumptionbytypeofhousing,2012(Source:StatisticsNorway)
Total net electricity consumption amounted to 120 TWh in 2015, a 2.6% increase
comparedto2014withhouseholdandagricultureroughlyaccounting forathirdof it.
ElectricityistheprimaryenergysourceforNorwegianhouseholdsasshownbyFigure
22.Italsoshowsthatwhilsthouseholdenergyconsumptionhasdecreasedsince2006
(mostly due to lower usage of oil and kerosene) electricity consumption has slightly
increased.

42
Figure23:SeasonalVariationsinelectricityconsumption,weekdaysand
weekends(Source:StatisticsNorway2008)
The high penetration of electric heating (c.f. Chapter 2.4.1)makes national electricity
consumption very temperature dependant and high peak consumption can occur on
abnormallycoldwinterdays.Thegraphsbelowshowthehourlyloadcurve(weekdays
upper graph andweekends lower graph)month bymonth. Logically, consumption is
highestduringwintermonths.
Figure22:Household’sEnergyUseinNorway(Source:StatisticsNorway2014)

43
Figure 24 shows the distribution of the annual electricity consumption of end‐use
appliances.As canbeexpected,heating is consistently the largest contributor todaily
consumption;45%ofelectricityconsumptionisduetospaceheating.Therestisdivided
intohotwater12%,lighting5%,otherappliances19%andresidual19%10,
Figure24:Estimatedyearlyaveragedemandduringworkdayssegmentedintomainend‐usegroups
(Source:ECEEESUMMERSTUDYproceedings2013)
3.2 Methodology and assumptions
The impact of home automation combined with dynamic pricing and feedback on
Norway’s households and national consumption were based on the following
assumptions:
Consumer feedbackandeducationarecrucial toreap the fullbenefitsofhome
automation.GiventhatsmartmeterswillbedeployedinNorwaywithin2years,
we assumed feedback and education to be part of home automation offerings
andthustookintoaccounttheirimpactsinouranalysis;
VaasaETT’sdatabaseoffeedbackpilots(132samples)showsanaverageoverall
electricity consumption reduction of 7%. This number is used tomeasure the
impactoffeedbackonoverallelectricityconsumption;
Market penetration rates of 17%, 48% and 78% were assumed for home
automation technology corresponding to the years 2020, 2030 and 2040
respectively. These figures were based on projections for the year 2020 (c.f.
10Non‐identifiedloadthatcouldnotbelinkedtoanyappliancebytheresearchers.

44
Figure9).Alinearregressionwasperformedtoextrapolatethesepredictionsto
lateryears;
Currentlyabout70%ofNorwegianhouseholdsareonspot‐pricetiedcontracts
(abasicformofRTPtariffs).Itthereforeseemssafetoassume70%ofhousehold
consumers will have RTP once smart meters are deployed. Thus, in our
modelling, the impactofautomatedRTPwereassumedfor70%ofhouseholds
with home automation. The combined impacts of TOU (daily) and CPP/CPR
(critical peak days only) were in turn assumed for the remaining 30% of
householdswithhomeautomation;
Peakconsumptionisdefinedashighconsumptionhoursatnationallevelduring
whichpeakpriceswouldbeinforce.Reductioninpeakhourconsumptionrefers
tothereductioninconsumptionoverthedurationofthepeak;
To remain conservative in our estimates, we assumed feedback does not
influence energy savings during critical peak days for RTP and CPP/CPR
schemes;
Impacts in % were applied to 2015 national consumption levels and 2012
consumptionlevelsforthedifferenthousetypes.
The table below summarises the impact assumptions for each combination of tariff
scheme,homeautomationandconsumptionfeedbackbasedonfindingsfromChapter2:
Peakconsumptionreduction
Overallconsumptionreduction
Occurrence
RTP 11.25% 0.50% Top100hours/year
TOU 13.72% ‐0.19% Daily
CPP/CPR 27.93% 0.20% Top30hours/year
TOU+CPP/CPR 13.72%/
27.93%
‐0.19%/
0.20%
Daily/Top30hours/year
Feedback 7% 7% EachdayforTOUandexceptcritical
peakdaysforRTP,CPP/CPR
Figure25:Impactassumptionsoftariffscheme,homeautomationandconsumptionfeedback.

45
3.3 Impacts on annual electricity consumption
Thissubsectionpresentstheresultsofthemodellingonhouseholdandnationalannual
electricityconsumption.
3.3.1 Householdannualconsumption
Norwegianhouseholdscoulddecreaseelectricityconsumptionbyanamountequivalent
to about 7% of their annual usage thanks to home automation, dynamic pricing,
consumptionfeedbackandconsumereducation.Thisamountsto1,065–1,104kWhper
year for an average household depending on the dynamic tariff scheme. As can be
anticipated, detached houses can save themost in absolute terms (kWh/year) due to
higherconsumptionlevels.
Figure26:ImpactoffeedbackandautomatedDRonannualelectricityconsumption
Asimilarimpactonannualconsumptioncanbeobservedacrosspricingschemes.This
canbeexplainedbythefactthatoverallconsumptionismostlyinfluencedbyfeedback
and consumer education rather than by dynamic pricing (which targets peak
consumption by passing on high wholesale prices or network constraints on to
consumers).
When investigating the effects of home automation, dynamic pricing, consumption
feedback and consumer education on annual peak consumption, the effectiveness of
TOU stands out. An averageNorwegian householdwith automatedTOU could reduce
consumptionby an amount equivalent to about 14%of its annual peak consumption.

46
ThisisduetothefactthatTOUimpactsconsumptiondailywhereasCPPandCPRimpact
consumptiononcriticalpeakdaysonly(12–15timesayear).Itisimportanttokeepin
mindthatTOU,duetoitsrigidstructure,lackstheflexibilitytodealwithextremeprices
on thewholesalemarket or unexpectednetwork constraints. (c.f. Chapter 2.3.3.) TOU
and CPP (or CPR) can however be combined to retain the possibility to deal with
unexpectedevents(CPP/CPRpricesaretriggeredoncriticaldays)whilsthavingadaily
impactonpeakusage(asTOUareinforceeveryotherday).Infact,ourresultsindicate
thatapricingschemecombiningTOUandCPP/CPRworksbestatreducingannualpeak
consumption(512kWhperyearforanaveragehousehold).
Figure27:ImpactoffeedbackandautomatedDRonannualpeakelectricityconsumption
3.3.2 National annual consumption
Basedon2015 consumption levels andassuming70%ofNorwegianhouseholdswith
home automation are on RTP and the remaining 30% on a combination of TOU and
CPP/CPR, our modelling shows that Norway’s annual electricity consumption could
decrease by 414GWh (1.17%) and annual peak consumptionby 85GWh (2.31%)by
2020 when 17% of households have adopted a combination of home automation
technology, dynamic tariffs and feedback. As market adoption of home automation
technology increases, these figures could reach 1,142 GWh (3.22%) and 234 GWh
(6.37%)by2030.

47
Figure28:ImpactonNorway’soverallandpeakelectricityconsumption
3.4 Impacts on the highest electricity consumption month
This subsection presents the results of the modelling on household and national
electricityconsumptionduringthehighestconsumption(alsocoldest)monthoftheyear
2015;January.Basedonnationalconsumptionlevels,thismonthalonewouldhaveseen
4 critical peak days (triggering CPP/CPR prices) and 33 out of the 100 peak hours
assumedforRTP.
3.4.1 Household highest consumption month
An average Norwegian households could decrease electricity consumption by an
amountequivalentto6.57–7.75%ofitsusageonthehighestconsumptionmonthofthe
year thanks to home automation, dynamic pricing and consumption feedback. This
amountsto134‐158kWhdependingonthedynamictariffscheme.Findingsarevery
similar to the findings detailed in the previous section.Detachedhouses can save the
most in absolute terms (kWh/year) due to higher consumption levels. Impacts are
similaracrosspricingschemes.
85 234384 491414
1142
1875
2396
0
500
1000
1500
2000
2500
3000
PENETRATIONRATE2020(17%)
PENETRATIONRATE2030(48%)
PENETRATIONRATE2040(78%)
PENETRATIONRATE100%
GWh
AnnualOverallandPeakConsumptionReduction
Peak Savings Overall

48
Again,theeffectivenessofTOUstandsout.NorwegianhouseholdswithautomatedTOU
could reduce consumption by an amount equivalent to about 13.7% of peak
consumption during that month. TOU and CPP/CPR combined provides the most
flexibility(10–67kWhor14%foranaveragecustomer).
Figure29:ImpactoffeedbackandautomatedDRonhighestconsumptionmonthelectricity
consumption
Figure30:ImpactoffeedbackandautomatedDRonhighestconsumptionmonthpeakelectricity
consumption

49
An interesting finding relates to CPP and RTP. Whilst CPP led to peak consumption
reductionofonly0.59%onanannualbasis,itledto2.03%peakconsumptionreduction
duringthehighestconsumptionmonthoftheyear.Theeffectisevenmorepronounced
forRTP.Whilstitledtopeakconsumptionreductionof2.27%onanannualbasis,itled
to 8.39% peak consumption reduction during the highest consumptionmonth of the
year.Thisagainpointstowardsthefactthatmoreflexibledynamicpricingschemesare
moreeffectiveatdealingwithhouseholdpeakconsumption.Chapter3.5willmakethis
evenmoreexplicit.
3.4.2 National highest consumption month
OurmodellingshowsthatNorway’selectricityconsumptioncoulddecreaseby50GWh
(1.05%)andpeakconsumptionby20GWh(4.09%)by2020when17%ofhouseholds
have adopted a combination of home automation technology, dynamic tariffs and
feedback during the country’s highest consumption month of the year. As market
adoptionofhomeautomationtechnologyincreases,thesefigurescouldreach137GWh
(2.90%)and54GWh(11.27%)by2030.Savingsfromthehighestconsumptionmonth
alone represent 12% of the annual overall saving potential and 23% of annual peak
clipping potential. It would thus be worth considering a special focus and special
incentivesduringthistimeofyear,especiallyasNorwegiansarealreadyawarethrough
their spot‐price tied contracts that prices and consumption are higher duringwinter
months.
Figure31:ImpactonNorway’shighestconsumptionmonthof2015
20 5489
113
50
137
225
287
0
50
100
150
200
250
300
350
PENETRATIONRATE2020(17%)
PENETRATIONRATE2030(48%)
PENETRATIONRATE2040(78%)
PENETRATIONRATE100%
GWh
OverallandPeakConsumptionReduction‐ Year'shighestconsumptionmonth
Peak Savings Overall

50
3.5 Impacts on the highest consumption day
This subsection presents the results of the modelling on household and national
electricityconsumptionduringthehighestconsumptiondayoftheyear2015‐January
2nd2015.Onthisday,CPPpeakpricesandCPRrewardswouldhavebeeninforceand
RTPcustomerswouldhavebeeninformedofhighpricesonthewholesalemarket.
3.5.1 Household highest consumption day
CPP involves substantially increased electricity prices during times of heightened
consumptionorwhenthestabilityofthesystemisthreatened.CPRareinverseformsof
CPP tariffs in which consumers are paid for the electricity they did not use during
critical peak times.By contract, such events can typically occur10‐15 timesper year.
Although,theimpactonannualconsumptionarelimited,CPPandCPRareveryeffective
atloweringcriticalpeakconsumption.Thisisillustratedbythegraphbelow;anaverage
NorwegianhouseholdonCPP/CPRpricingcouldlowerpeakconsumptionby2.37kWh
(28%)onthehighestconsumptiondayoftheyear.
3.5.2 National highest consumption day
Ourmodelling shows that home automation technology, dynamic tariffs and feedback
could lower Norway’s electricity peak consumption by 0.46 GWh (10.65%) by 2020
Figure32:ImpactoffeedbackandautomatedDRonhighestconsumptiondaypeakelectricity
consumption

51
when17%ofhouseholdsareequippedduringthecountry’shighestconsumptiondayof
theyear.By2030,withamarketpenetrationof48%,peakconsumptioncoulddecrease
by1.27GWh(29.36%)onthatday.
Figure33:Impactonhighestconsumptiondayof2015
3.5.3 Impact of automated electric heating
The graph below stresses the importance of automated electric heating formanaging
Norwegianpeakconsumption.OnNorway’shighest consumptionday, electricheating
wouldaccountforover43%ofthecountry’spotentialforresidentialpeakconsumption
reduction.
Figure34:Impactofautomatedheating‐highestconsumptionday2015
0,46
1,27
2,09
2,66
0,0
0,5
1,0
1,5
2,0
2,5
3,0
PENETRATIONRATE2020(17%)
PENETRATIONRATE2030(48%)
PENETRATIONRATE2040(78%)
PENETRATIONRATE100%
GWh
PeakConsumptionReduction‐ Year'shighestconsumptionday
Peak Savings
0,20
0,55
0,90
1,15
0,0
0,2
0,4
0,6
0,8
1,0
1,2
1,4
PENETRATION2020 PENETRATION2030 PENETRATION2040 PENETRATION100%
GWh
PeakConsumptionReductionduetoAutomatedHeating
‐ Year'shighestconsumptionday
Peak reduction
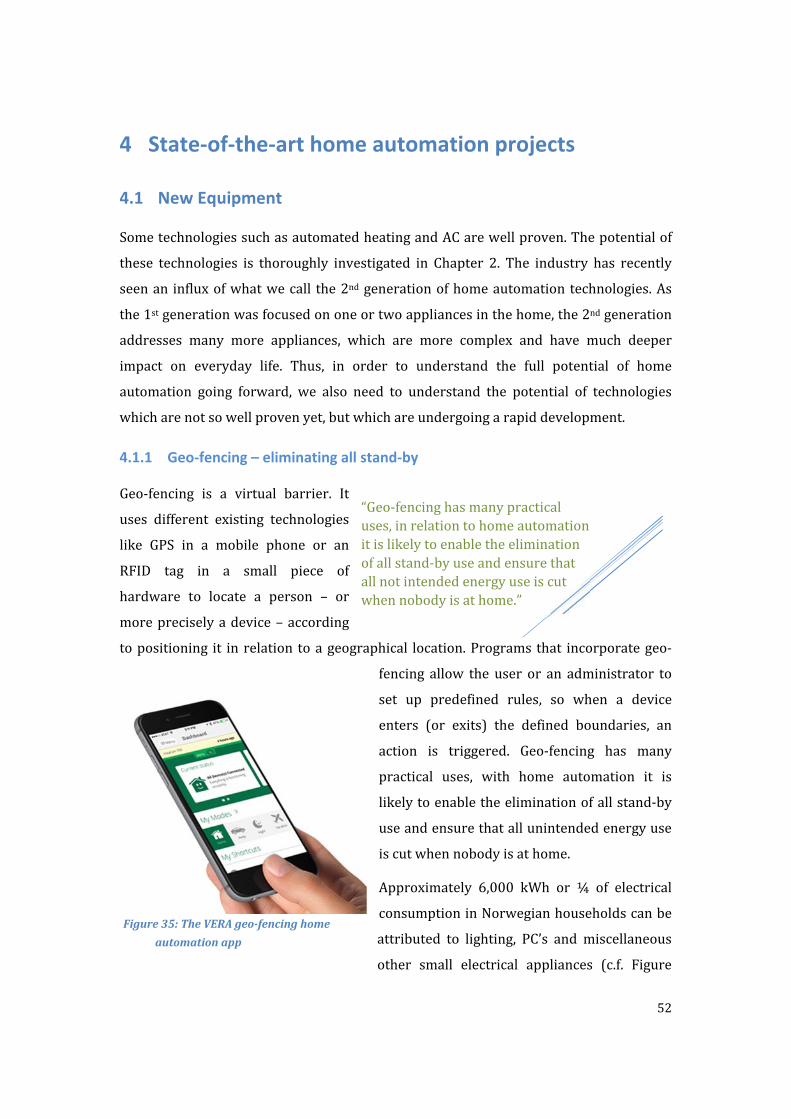
52
4 State‐of‐the‐art home automation projects
4.1 New Equipment
SometechnologiessuchasautomatedheatingandACarewellproven.Thepotentialof
these technologies is thoroughly investigated in Chapter 2. The industry has recently
seenan influxofwhatwecall the2ndgenerationofhomeautomationtechnologies.As
the1stgenerationwasfocusedononeortwoappliancesinthehome,the2ndgeneration
addresses many more appliances, which are more complex and have much deeper
impact on everyday life. Thus, in order to understand the full potential of home
automation going forward, we also need to understand the potential of technologies
whicharenotsowellprovenyet,butwhichareundergoingarapiddevelopment.
4.1.1 Geo‐fencing – eliminating all stand‐by
Geo‐fencing is a virtual barrier. It
uses different existing technologies
like GPS in a mobile phone or an
RFID tag in a small piece of
hardware to locate a person – or
morepreciselyadevice–according
topositioning it inrelation toageographical location.Programs that incorporategeo‐
fencing allow the user or an administrator to
set up predefined rules, so when a device
enters (or exits) the defined boundaries, an
action is triggered. Geo‐fencing has many
practical uses, with home automation it is
likelytoenabletheeliminationofallstand‐by
useandensurethatallunintendedenergyuse
iscutwhennobodyisathome.
Approximately 6,000 kWh or ¼ of electrical
consumptioninNorwegianhouseholdscanbe
attributed to lighting, PC’s and miscellaneous
other small electrical appliances (c.f. Figure
Figure35:TheVERAgeo‐fencinghome
automationapp
“Geo‐fencinghasmanypracticaluses,inrelationtohomeautomationitislikelytoenabletheeliminationofallstand‐byuseandensurethatallnotintendedenergyuseiscutwhennobodyisathome.”

53
19),which geo‐fencingwouldbe able to address. In this respect the technology could
provetohavethelargestimpactofallthetechnologies,sinceitcomprisesalotof“small”
usesintoonecomprehensibleload.
4.1.2 EVs, roof top solar and storage – the future is decentralised
With Tesla’s acquisition of SolarCity it became clear that solar, storage and Electric
Vehicles (EVs) are a very powerful combination. This is even more true in Norway
where hybrid and EVs have become very popular. Elon Musk’s “master plan”, which
aims to provide customers with full‐stack solutions for owning their own energy
production, storage and consumption has also recently been hyped with the
introductionofasolarrooftilewhich,forthefirsttime,bringsaestheticsanddesigninto
solarpower.
With regards to EVs; the latest sales figures for July 2016 show a 17% year‐on‐year
growthrate.EVsmadeup28%ofnewcarregistrationsinNorwayfortheyearthrough
July.(EVObsession.com)
4.1.3 Customer‐Led Network Revolution – multiple technologies
Figure36:TeslaSolarRoofTopdesigns

54
TheCustomer‐LedNetworkRevolutionprojectwasasmartgridprojectledbyNorthern
Powergrid in partnership with British Gas, Durham University, Newcastle University
and EA Technology. The project involvedmonitoring the electricity consumption and
generation profiles of around 13,000 domestic and SME customers, both with and
without certain technologies (heat pumps, solar Photovoltaics (PVs),micro‐combined
heatandpower,EVs).Thisisthelargestsampleofelectricitycustomers’usagetohave
beenundertakenintheUKandIrelandtodate.
The project introduced and tested smart
meters and different forms of dynamic
tariffs. TOU tariffs proved popular; the
majority of the customers taking part in
the trial saved money and used
approximately10%lesselectricityinpeak
periods than customers on a regular tariff. Household chores such as laundry and
dishwashing were the most commonly used to flex the times of electricity usage.
CustomerswithPVweresuccessfulatadjustingtheirelectricityusagetotakeadvantage
of their own generation and were arguably the most engaged customers of all. The
projectalsoconcluded,thatEVsorheatpumpscaneffectivelydoublethedomesticload,
sothereisastrongcaseforencouragingoff‐
peak EV charging behaviour at an early
stage. Last but not least the project also
concluded,thatiftheofferedsolutionistoo
simpleandlacksflexibilityfortheend‐user
itcanmissthetarget.
4.2 Nikola – EVs for Flexibility and Green Energy
ConsideringthegrowingnumberofEVsinNorway
Danish project Nikola launched in 2013 may
provideusefulfindings.Vehicle‐to‐Gridtechnology
– inwhichEVs communicatewith thegrid to sell
DRservicesbyeitherreturningelectricitytothegridorbythrottlingtheirchargingrate
‐wastestedtoinvestigateEVs’potentialinsupportingacost‐efficientandsecurepower
system with a high degree of renewable energy. EVs offer a very good flexibility
“EVsorheatpumpscaneffectivelydoublethedomesticload,sothereisastrongcaseforencouragingoff‐peakEVchargingbehaviouratanearlystage.”
“Ifthesolutionlacksflexibilityfortheend‐useritcanmissthetarget.”

55
potential as they are basically batteries offering high‐power, fast‐response and bi‐
directional capabilities. These properties can be used for flexibilitywhile at the same
timeloweringthecostsofowninganEV.Thepilotshowsthatatypicalnightlyplugin
lastsforaround13hoursofwhichonly4hoursareneededforcharging.Thisindicatesa
highdegreeofchargingflexibility.However,withouthavingtheownerconnectingitto
the power system for sufficiently long durations of times which are predictable and
recurringitishardtomakesubstantialuseofthecapacity.
The project concluded that EVs will only
realise their full value as an instrument for
flexibilityifownersareinvolvedandwilling
toaccepttheautomatedre‐andde‐charging.
Inotherwords, the communication and the
userinterfacesplayanimportantroleforthe
successofsuchservices.
WhatisalsointerestingisthatNikolaledto
some of the highest financial savings for
participants we have seen in a flexibility
pilot indicating thatDR servicesbasedona
highconsumption/highflexibilityasset(e.g.
EV)canbeveryrewardingforhouseholds.
• Theownerofthevehicleneedstobeabletooverrideanyautomatedsettings
• Theserviceshouldsuggestbestchargingtimesbasedonananalysisofuserbehaviour–butanysettingshouldalwaysbeacceptedbytheuser.
• Engagementcomesonlywitheducation.Allserviceofferingsneedthoroughexplanationsofprosandcons
THENIKOLAPROJECTCONCLUDEDTHAT:
“EVswillonlyrealisetheirfullvalueasanassetforflexibilityifownersareinvolvedandwillingtoaccepttheautomatedre‐andde‐charging.”
“DRservicesusinghighload/highconsumptionassets(e.g.EV)canbeveryrewardingfinanciallyforhouseholdconsumers.”

56
Figure37:Eneco’sCaronToonintegratedsolution
4.3 Elsa – Energy Local Storage Advanced system
ELSA(EnergyLocalStorageAdvancedsystem)isanenergystorageprojectaddressing
local/small scale storage. From 2015 to 2019, ELSA will develop distributed storage
solutionstomaturitybycombining2ndlifebatterieswithaninnovativelocalICT‐based
energymanagementsystem.
ELSAstoragesystemswillbeappliedinsixdemonstrationsites.Inthisrespectthepilot
doesn’thaveanyresultyet,butitismentionedhere,asitrepresentsacleartrendinthe
mostrecentprojectstofocusonstoragetechnologyaspartofhomeautomation.Hence,
theELSAprojectfocusesondevelopingtechnologythatisalreadyclosetomaturityand
will be applied with different application contexts, covering services such as: grid
congestionrelief,localgridbalancing,peakshaving,voltagesupportandregulation.
4.4 'Car on Toon' – Integrating Home and Car
Over a million smart thermostats have already been installed around Europe. These
thermostatsprovideanaturalhubfortheintegrationofhomeandEVs.Enecohasbeen
one of the most successful utilities in Europe in terms of the uptake of smart
thermostatsbyitscustomers.

57
Its service, Toon not only provides excellent consumption feedback own‐solar
generation and smoke alarm information to customers, but also controls smart plugs
and lamps and learns customers' preferences and habits to intelligently control the
heating of the home. Now it is evolving to incorporate EV, providing insight into
consumptionandcostandprovidingthefirststeptowardsahomeenergymanagement
system that extendsbeyond thehome. Integrationof carandhome into the feedback,
controlandautomationeco‐systemisimminent.
4.5 WEREL – Bringing it Together
Ultimatelythemoreelementsofthefuturearebroughttogether,thegreaterthebenefits
for the consumer. Home energy management, smart home, solar, storage, EV and
communitieswill ultimately all work together through the Internet of Things,mostly
discretely in the background through automation and ‐ increasingly ‐ artificial
intelligence. One of the first steps towards this integration can be seen in the newly
releasedWERELofferinginSweden.WERELprovideshomeswithafinancedsolarand
storage solution that
intelligently works
together with other
homes to buy energy
from and sell energy to
those other homes,
through the wholesale
market. The result is a
communityofdistributed
energy homes that can either use their energy for independence or sharing. The
supplier,WERELalsoactsasatraditionalretailer,providingthehomeswithenergythat
theycannoteitherproducethemselvesorbuyfromtheothersinthecommunity.Thisis
justthefirststepinabiggervisionofWEREL,butovertime,asthecommunitygrows,
solutionefficiencyevolves,thehomesbecomeevermoreautomated,andEVsandother
communityresourcesbecomeintegrated,theautomationofthecomponentswithinthis
excitingarchitecture could leada situationwhere communitiesno longerneed tobuy
theirenergyfromretailersatall.

58
5 References
ADVANCED(www.advancedfp7.eu).LastvisitedNovember262016.
Balksjo,T.,Corradi,N.,Gamberioni,L.,Ketzeff,C.,Spagnoli,A.,Tusa,G.,Zamboni,L.(2011).BeAware‐BoostingEnergyAwarenesswithAdaptiveReal‐timeEnvironments:ResultsofBeAwareSecondTrial.
CharlesRiverAssociates(2005).ImpactEvaluationoftheCaliforniaStatewidePricingPilot‐FinalReport.
EVObsession.com.LastaccessedDecember232016
Dalen,H.andLarsen,B.(2013).Residentialend‐useelectricitydemand.StatisticsNorway,Researchdepartment.Availableonline:https://www.ssb.no/forskning/discussion‐papers/_attachment/106094?_ts=13dceeaa508
Lewis,P.,Dromacque,C.&Brennan,S.(2012).EnergyefficiencythroughICT‐Bestpracticeexamplesandguidance.PreparedforESMIG.VaasaETTGlobalEnergyThinkTank.Availableonline:http://www.esmig.eu/filestor/Final_Empower%202_Demand_Report_FINAL_Distr2.pdf/view
Morch,A.,Saele,H.,Feilberg,N.,Lindberg,K.S.,(2013).Methodfordevelopmentandsegmentationofloadprofilesfordifferentfinalcustomersandappliances.
NEK(2015).AMS+HAN–omågjøresanntidsdatatilgjengeligforforbruker.
StatisticsNorway.LastaccessedJanuary52017
Statista.com.LastaccessedJanuary302017
Stromback,J.,Dromacque,C.&Yassin,M.H.(2011).Thepotentialofsmartmeterenabledprogramstoincreaseenergyandsystemsefficiency:amasspilotcomparison.PreparedforESMIG.VaasaETTGlobalEnergyThinkTank.Availableonline:<http://www.esmig.eu/press/filestor/empower‐demand‐report.pdf>.
VaasaETT,JouleAssets(upcomingreport).Cost/BenefitanalysisstudyforResidentialDemandSideFlexibility.

Norwegian Water Resources and Energy Directorate
Middelthunsgate 29Postboks 5091 Majorstuen0301 Oslo
Telephone: 09575 Internet: www.nve.no