assessing the quality of antenatal care in … · care in thiruvananth apuram district ... so a...
TRANSCRIPT

Quality of Antenatal Care
1
ASSESSING THE QUALITY OF ANTENATAL
CARE IN THIRUVANANTHAPURAM DISTRICT
January 2002
PROJECT REPORT
KRPLLD - 6/99
Dr.S.Srilatha, Smt. Remadevi S, Dr. Leela Itty Amma,
Dr. Vijayakumar.K

Quality of Antenatal Care
2
ACKNOWLEDGEMENT
We hereby express our sincere gratitude and appreciation
towards Kerala Rural Project for Local Level Development, Centre for
Development Studies, Thiruvananthapuram for giving us on opportunity to
carry out this work.
Similarly the readiness and cooperation extended to our work
by 5—and odd antenatal women of Thiruvananthapuram district needs special
mention. Without their support the project could not have materialized.
Superintendents of SAT Hospital, W&C Hospital Thycaud,
Government Hospital Peroorkada had helped us in carrying out this work in the
respective institutions. So are the Nursing staff and others who have helped us to
track down the subjects over months in out patients departments and wards.
Ms. Sreelatha, Ms Sylaja, Ms Sheena has helped us in
collecting data at various stages of the project. Sree Computer Centre has
helped us in Computing and reporting works.
Dr. Nirmala C, Gynaecologist of SAT Hospital
Thiruvananthapuram and Dr.Mridula of W & C Thycaud had helped us in
supervision of data collection.

Quality of Antenatal Care
3
We express our appreciation for HAP team for giving us the
office support and guidance.
Quality of Antenatal Care
4
CONTENTS
Page
1. Abstract
2. Introduction
3. Objectives
4. Methodology
5. Results and Discussion
Age of subjects
Education of couples
Income (percapita)
Type of family
Number of members in the family
Smoking habits of husbands
Pregnancy history
Parity
Abortion
Still birth
Infant death
Antenatal visit
Socioeconomic status and number of antenatal visits
Personnel attended
Investigations
Perceived satisfaction with services from the centre
Reasons for inconveniences
Suggestions for improvement
Follow up visits
Type of delivery
SES and type of delivery Indication for caesarian section
Birth weight

Quality of Antenatal Care
5
Duration of gestation and birth weight
Dissatisfaction of the subjects after delivery
Postanatal care
Expenditure 6. Summary and Conclusion 7. Bibliography 8. Appendix.
Quality of Antenatal Care
6
ABSTRACT
Antenatal care and registration receive ferocity among all
health care services. NFHS-2 reports that 93% deliveries are institutional and
98% of mothers receive at least 3 antenatal check ups. The maternal and
child health services in Kerala is far better than in other states. Inspite of the
high coverage of antenatal care and medial attention for delivery, the
proportion of low birth weight babies born in Kerala is 20% even through it is
40% in all India level. Quality of health care delivered is one of the factors
which determines the outcome of the pregnancy. The estimation of quality of
service help as to have an understanding of the mother and child health issues,
and possible avenues of intervention.
So a study with the objective of assessing the quality of
antenatal care in various health care settings in Thiruvananthapuram district
was carried out. The second objective was to estimate the private expenditure
of delivery.
A prospective study was carried out in SAT Hospital, W&C
Hospital, Thycaud Trivandrum & Govt. Hospital, Peroorkada was carried
out. A total of 550 antenatal women were recruited, with 355 from SAT
Hospital Peroorkada. These women were recruited at their first visit to the

Quality of Antenatal Care
7
hospital and followed up till delivery. A total of 430 women were followed up
(78%).
Using a pre tested Questionnaire, assessed the quality of a)
antenatal care by the following variables, (i) Antenatal visit, - The time of the
1st visit, frequency & source of antenatal care (ii) Investigations- Routine
including HbS AgE, VDRL, USS. (iii) Physical examination –
(iv) Health education – Advice on diet, breast feeding, us eof drugs family
planning, sleep & rest.
(v) Immunsiation – frequency & timing of TT
(vi) Anaemia Prophylaxis , ) Complication during frequency.
b) Intranatal care- Place of delivery, type of delivery, personnel attended,
complication & birth weight
3. The expenditure of antenatal care and child birth.
4. Socio economic & demographic characteristics of antenatal women
including information on education, occupation and percapita income were
collected.
The major findings are as follows:-
Quality of Antenatal Care
8
v Over all quality of care is good with 42.2% of antenatal women being
registered in the first trimester. But 7.2% are registered only after the fifth
month of gestation.
v The blood pressure & weight recording in W&C Hospital, Thycaud and
Govt. Hospital Peroorkada has to improve a lot.
v Even though advice of Iron Folic Acid & TT injection is 100%, the dietary
advice in recently only 51.3% of antenatal women. Advice regarding rest,
exercise and sleep is given only to a negligible percentage 2.3% receiving
advice regarding family planning.
v 23.1% deliveries are caesarian section which is equivalent to that of USA.
16.2% of infants have low birth weight. Average expenditure for delivery is
Rs 1949 which includes both normal and caesarian. For usual the average is
Rs. 1887.3 and for caesarian it is Rs. 2154.7. Average hospital stay is 6.4 days
for normal delivery and 10.2 for caesarian section. More than 75% of the
subjects fact that the quality of service should be improved.

Quality of Antenatal Care
9
INTRODUCTION
Antenatal care refers to pregnancy related health care provided
by a doctor or a health worker in a medical facility or at home. Ideally antenatal
care should monitor a pregnancy for signs of complications detect and treat pre-
existing and concurrent problems of pregnancy. It should also provide advice and
counselling on preventive care, diet during pregnancy, delivery care, postnatal
care and related issues. Antenatal care is necessary for ensuring a healthy mother
and baby at the end of gestation. Antenatal care and registration receive priority
among all health care services. It is usually incorporated in to the . of maternal
and child health care services.
The maternal and child health status is better in developed
nations. In India efforts were made to develop this service sector. Especially
during late 1960’s MCH components got a high thrust in planning and
implementation of developmental schemes. As part of the strengthening of MCH
services various new service components were identified. Similarly during this
period, infrastructure was built through out the length and breadth of the country.
There are about 26,228 PHCs in India and more than 132,000 paramedics
operating in remote and rural areas at the end of 1996.1,2 In Kerala also there are
944 PHC and 104 CHC’s working now. They are spread out uniformly through
out the entire state.3 Unlike the genera l Indian scenario the institutions in Kerala
are better manned and vacancy position is comparatively low. About 5547 Junior
Public Health Nurses mainly focus on the maternal and child health area of
Quality of Antenatal Care
10
service delivery. In Kerala in tune with the spread of institutions, the service
provision and utilization is almost complete when compared to other Indian
States. NFHS SURVEY(1) 1992-93 cites that 97% of mothers receive antenatal
care and 88% deliveries are institutional.4 NFHS –2 reports that 93% deliveries are
institutional, and 98% of mothers receive at least 3 antenatal checkups.5
As regard to health indicators Kerala is in fore front. The crude
death rate is 6.4/1000 population, infant mortality rate is 16/1000 livebirths, and
life expectancy is 70 & 74 years for males and females respectively. 6 This is due
to the well developed health care delivery system both in the public and private
sector and the high literacy status of the state especially, female literacy. But in
general the morbidity in our state is very high, when compared to the developed
countries. When considering the Maternal and child health services in Kerala, it is
far better than in other states. The prevailing socio-cultural practices and the high
female literacy have helped in improving the health status of the women and
children in the state. This has helped in bringing down the maternal and infant
mortality in the state. The current infant mortality is 16/1000 live births when
compared to 74/1000 live births in India. This has resulted in increased acceptance of
family planning services by couples and thereby the maternal health also has
improved. The maternal mortality is 0.8/1000 live births in Kerala when it is
around 4/1000 livebirths in India. But the maternal mortality rate of Kerala is still
high when compared to the developed countries of the world. In spite of the high
coverage of antenatal care and medical attention for delivery, the proportion of

Quality of Antenatal Care
11
low birth weight babies born in Kerala is 20%, which is 40% in all India level.
Maternal mortality, morbidity and health status of children can be considered as
indicators of the quality of service provided.
Once the provision of services is ensured, the quality of the
provision has to be taken care of. The quality of the health care delivered is one
of the factors, which determines the outcome of the pregnancy. The estimation of
quality of service and its constraints in the present scenario helps us to have a
better understanding of the maternal and child health issues and it can also act as
the base line information. This will also help in identifying new areas of
intervention.
Objectives
1. To assess the quality of antenatal care provided in various health care settings
in Thiruvananthapuram district as defined by its component services.
2. To estimate the private expenditure of delivery.
Methodology Design: prospective study Setting:
Government Hospitals in Thiruvananthapuram city. The study
was carried out in a tertiary care setting viz SAT Hospital. The two hospitals
selected were W&C hospital Thycaud Thiruvananthapuram and Government
hospital Peroorkada. Though planned earlier our efforts to enlist private hospitals
and private consultation were not successful.
Quality of Antenatal Care
12
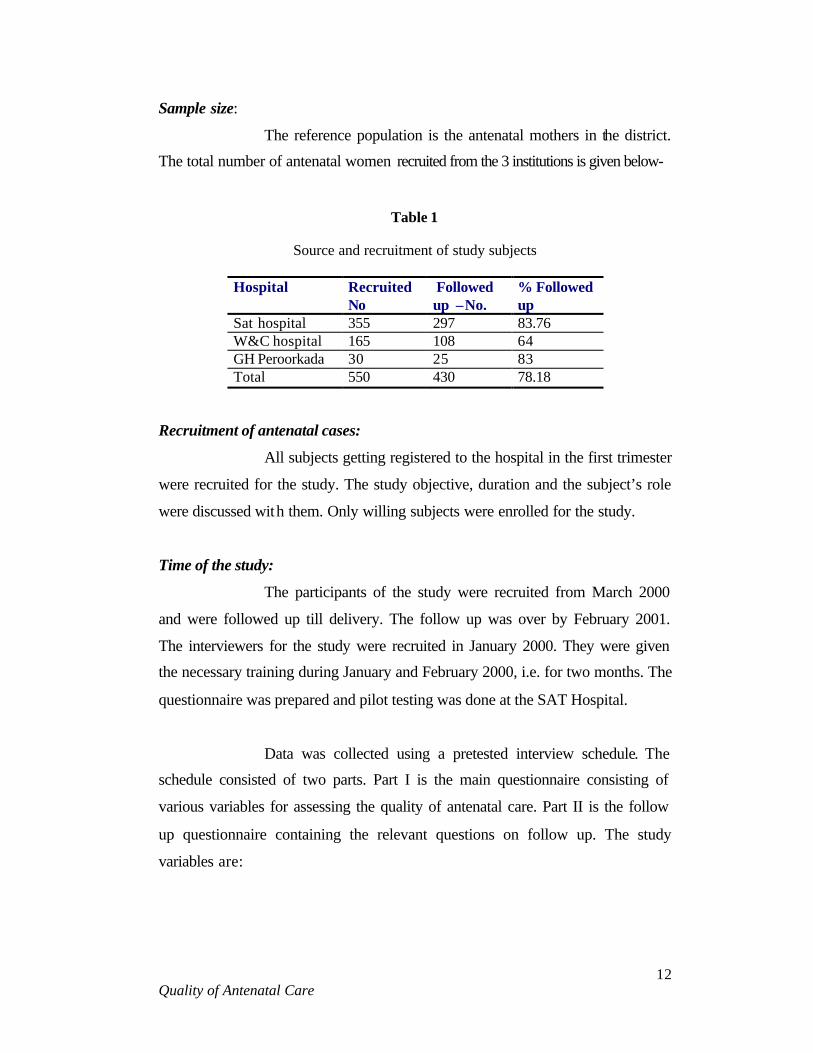
Sample size:
The reference population is the antenatal mothers in the district.
The total number of antenatal women recruited from the 3 institutions is given below-
Table 1
Source and recruitment of study subjects
Hospital Recruited No
Followed up –No.
% Followed up
Sat hospital 355 297 83.76 W&C hospital 165 108 64 GH Peroorkada 30 25 83 Total 550 430 78.18
Recruitment of antenatal cases:
All subjects getting registered to the hospital in the first trimester
were recruited for the study. The study objective, duration and the subject’s role
were discussed with them. Only willing subjects were enrolled for the study.
Time of the study:
The participants of the study were recruited from March 2000
and were followed up till delivery. The follow up was over by February 2001.
The interviewers for the study were recruited in January 2000. They were given
the necessary training during January and February 2000, i.e. for two months. The
questionnaire was prepared and pilot testing was done at the SAT Hospital.
Data was collected using a pretested interview schedule. The
schedule consisted of two parts. Part I is the main questionnaire consisting of
various variables for assessing the quality of antenatal care. Part II is the follow
up questionnaire containing the relevant questions on follow up. The study
variables are:

Quality of Antenatal Care
13
1 Quality of antenatal care
a) Antenatal visit. The time of first visit, frequency and the source of
antenatal care
b) Investigations- The type of investigations, and frequency with regard to
blood, urine, Ultra sound and X-rays were looked into. The blood
investigations included grouping, hemoglobin, VDRL, HBSAg
c) Physical examination- General and systemic examination. Frequency of
obstetric examination with blood pressure and weight recordings.
d) Health education : This is an important aspect of antenatal care. The study
has looked into whether mothers received advice on diet, breast-feeding,
use of drugs, family planning, sleep and rest.
e) Immunization: frequency and timing of TT
f) Anemia prophylaxis: Did they receive Iron Folic Acid during antenatal period.
g) Complications during pregnancy and delivery
2. INTRA NATAL CARE
Place of delivery, type of delivery, personnel attended,
complications if any and birth weight of baby.
3 Expenditure of antenatal care and childbirth
4 Socio economic and demographic characteristics of the antenatal woman
including information on education, occupation and per capita income were
collected. Socioeconomic categorization was done using the following variables.
1. Education of husband
2. Occupation of husband
3. Percapita income per month
Quality of Antenatal Care
14
4. Type of housing
5. Fuel used
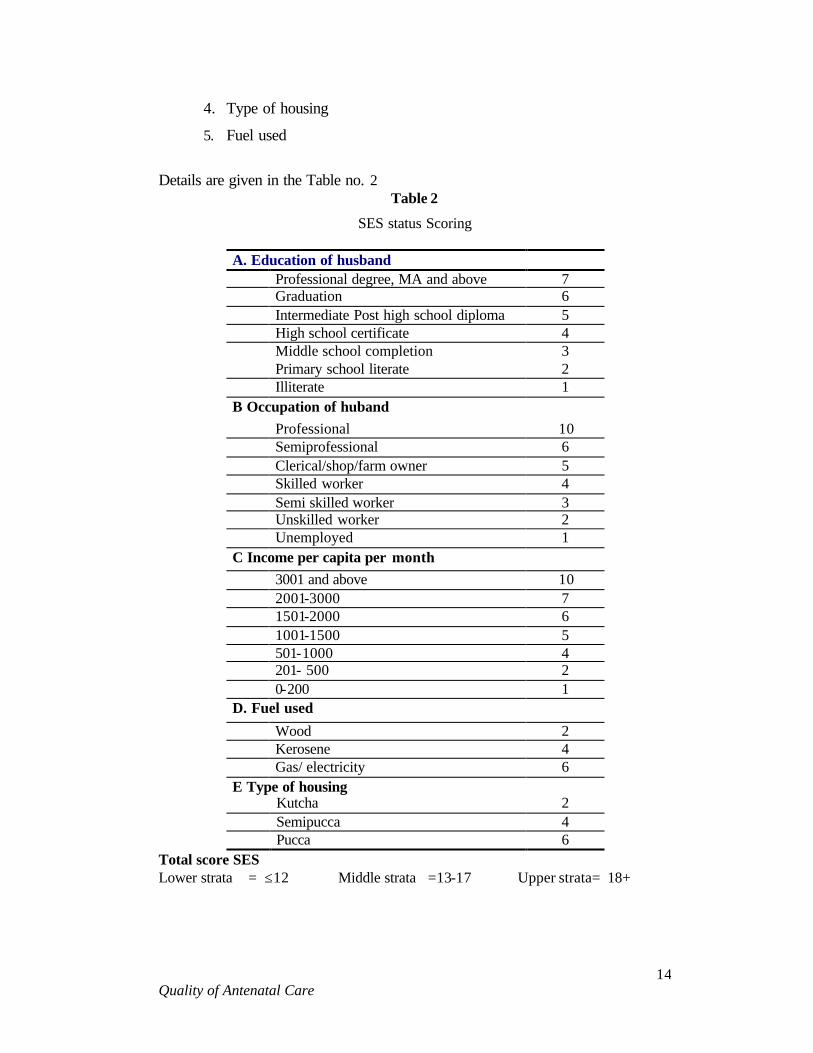
Details are given in the Table no. 2
Table 2
SES status Scoring
A. Education of husband Professional degree, MA and above 7 Graduation 6 Intermediate Post high school diploma 5 High school certificate 4 Middle school completion 3 Primary school literate 2 Illiterate 1 B Occupation of huband Professional 10 Semiprofessional 6 Clerical/shop/farm owner 5 Skilled worker 4 Semi skilled worker 3 Unskilled worker 2 Unemployed 1 C Income per capita per month 3001 and above 10 2001-3000 7 1501-2000 6 1001-1500 5 501-1000 4 201- 500 2 0-200 1 D. Fuel used Wood 2 Kerosene 4 Gas/ electricity 6 E Type of housing Kutcha 2 Semipucca 4 Pucca 6
Total score SES Lower strata = ≤12 Middle strata =13-17 Upper strata= 18+

Quality of Antenatal Care
15
Table 3
Distribution of subjects across different socio-economic strata
SES Freq Percent 1.0 79 18.5 2.0 293 68.5 3.0 56 13.1
6. Obstetric history and Perceived satisfaction with antenatal care and
delivery.
Data collection was carried out using trained interviewers. The
actual study started from March 2000 with recruitment of antenatal mothers in
their first trimester of pregnancy. They were registered on their first visit to
hospital and were followed up in subsequent visits up to delivery. In the case of
normal deliveries, the information till the 3rd day of delivery was collected. This
is because routinely they are discharged on 3rd day. For caesarian sections, the
information was collected till the date of discharge. The data collection was
completed by February 2001.
RESULTS AND DISCUSSION
Out of the 428 subjects, 68.9% is from the SAT, Hospital,
TVPM. This is in accordance with the delivery pattern in the above 3 hospitals. In
the SAT Hospital around 17000 deliveries occur in one year out of about 45,000
deliveries taking place in the district.
Table 4
Distribution of subjects according to the source of service
Hospital Frequency Proportion SATH 295 68.9 W&C 108 25.2 GH Peroorkada 25 5.8 Total 428 100
2 records of SAT hospital was not analysed since they were incomplete.

Quality of Antenatal Care
16
I. Age of Subjects
The mean age of pregnancy is 23.5 years. This corresponds to
previous observation of 24.5 years for mean age at birth. 7 This shows that in last
16 years there is not much change in the age of fertility. 80.4 % of the subjects
experience the pregnancy during 20-30 years.8 12.4% fall below 20 years. 7.2 %
are above 30 years. The observed mean age of pregnancy is within the ideal age
range suggested. The NFHS-2 gives the median age at first birth as 23.3 for
urban and 21.4 for rural women. ‘The health and development in rural Kerala' a
study by KSSP – reports 76.6% of the rural women deliver at the age of 21 to 30
years of age.9
Table 5 Age distributions of the subjects
Age Frequency Proportion <20 53 12.4 20-29 344 80.4 ≥30 31 7.2 Mean 23.5 Sd 4.2
2. Education of couples
Just 3% of the couples have only less than 4 years of schooling.
66% of women have education up to 10 years. Corresponding figures for men is
82%. 50% of the women are completing 10 years of schooling. The proportion
having over 10 years of schooling is more among women (28.2%) compared to
that of men (17.8%). This is in corroboration with the findings of State Planning
Board’s Economic Review 2000.10 Girls outnumber boys at the high school stage.
And that at higher education 61% are girls.

Quality of Antenatal Care
17
Table 6 Education of the couples
Education of the wife Education Husband N % N % ≤ 4 yrs 13 3 23 5.4 5-10 271 63.3 329 76.7 11+ 121 28.2 76 17.8 10 alone 215 50.2 224 53.3
3. Income per month Per capita.
Mean income per capita is RS. 937.7 with SD 675.9. The median
and mode of income is 750, which shows a negative skewing. This demonstrates
that the relatively poor are attending the hospitals, or it was they got enrolled in
our study, which is quite understandable considering nature of ownership of the
institution.
Table 7
Income percapita per month
Mean SD Minimum 25%ile Median 75%ile Maximum Mode 937.60 675.784 91.00 553.0 750.0 1150.0 6667.0 750.0
4. Type of Family
Table 8 Type of family
Nuclear 326 76.2 Non-nuclear 102 23.8 Total 428 100
76.2% of the families are nuclear. Only 23.8 are non-
nuclear.

Quality of Antenatal Care
18
5. Number of members in the family
Mean number of members in a family is 4.75, which is in
agreement with the census 1991 population figures.
Table 9 No of members in the family
Mean SD Minimum 25%ile Median 75%ile Maximum
4.75 2.11 2.0 3.0 4.0 6.0 22
6. Smoking habits of husbands
Table 10
Smoking habits of husbands
Smoking Frequency % Non smokers 220 51.4 Smoking inside the house 205 47.9 Smoking outside the house 3 0.7 Total 428 100
48.6% of husbands smoke. The corresponding figures for rural
Kerala 1987 figures were 53%.9 The apparent decline in smoking could be due to
sampling variations ( KSSP). Many of them smoke inside the house. This leads to
increased risk of passive smoking for antenatal women, which may have a
bearing on the outcome of pregnancy.

Quality of Antenatal Care
19
7. Pregnancy history
Table 11 Pregnancy history
Gravida Frequency %
1 223 52.2 2 149 34.9 3 47 11 4 8 1.9
Total 427 100
87% of women are in gravida 1&2. Only 12.9% are having a
history of third and above. This is a reflection of prevailing fertility pattern.
8. Parity
Table 12 Distribution of Parity
Parity Frequency %
0 233 54.4 1 167 39.0 2 28 6.7
Total 428 100
93.4% of the subjects are in Para 1 or less. This corresponds to the
93 % in 1986. 7
9. Abortion
Table 13 History of Abortion
History Frequency %
Yes 51 11.92 No 377 88.08
Total 428 100
11.92% of the antenatal women give a history of abortion. This
Quality of Antenatal Care
20
cannot be taken as a reflection of the general population. This is because SAT
Hospital being a referral institution, most high-risk cases report here.
Spontaneous aortion occur for 6.67 of pregnancies.11 The proportion over thi
figure(6.67) could be because of the tertiary … of institution
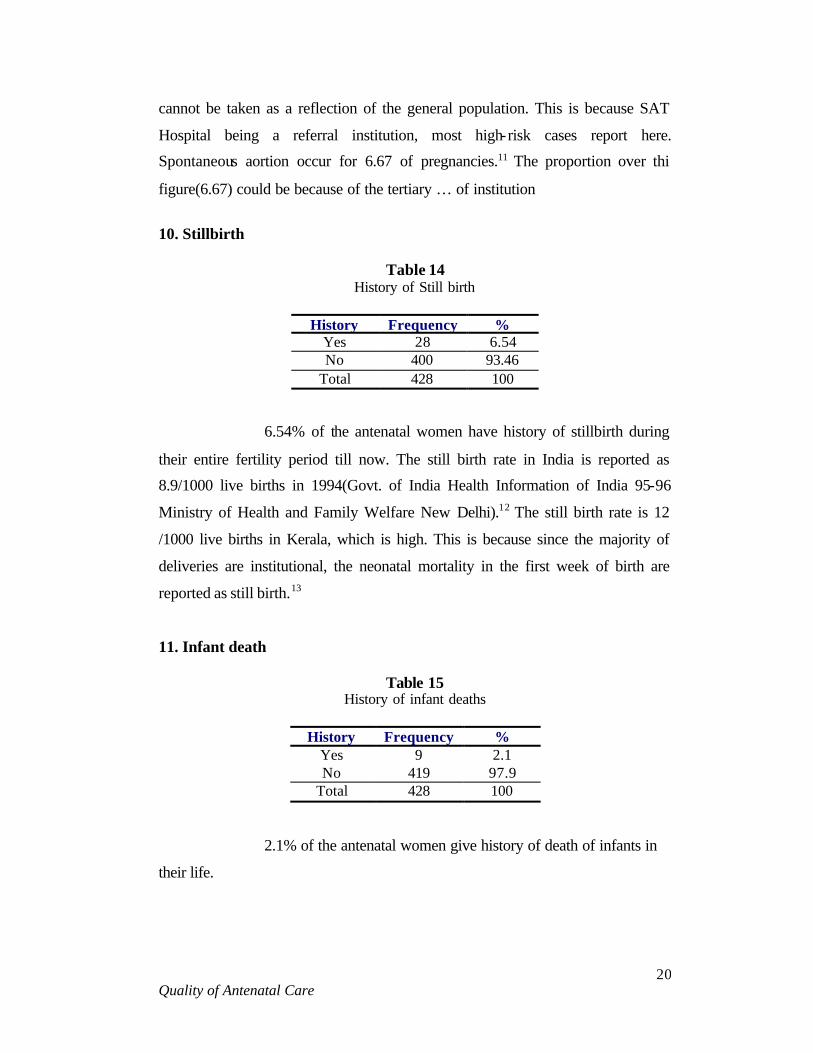
10. Stillbirth
Table 14
History of Still birth
History Frequency % Yes 28 6.54 No 400 93.46
Total 428 100
6.54% of the antenatal women have history of stillbirth during
their entire fertility period till now. The still birth rate in India is reported as
8.9/1000 live births in 1994(Govt. of India Health Information of India 95-96
Ministry of Health and Family Welfare New Delhi).12 The still birth rate is 12
/1000 live births in Kerala, which is high. This is because since the majority of
deliveries are institutional, the neonatal mortality in the first week of birth are
reported as still birth.13
11. Infant death
Table 15 History of infant deaths
History Frequency %
Yes 9 2.1 No 419 97.9
Total 428 100
2.1% of the antenatal women give history of death of infants in
their life.

Quality of Antenatal Care
21
Table 16 History of Still birth, Abortion and Infant death
across different SES
SES Still birth Abortion Infant death
1 7.6 17.7 3.8 2 5.4 9.2 1.7 3 10.7 17.8 1.7
The high proportion of SES 1 & 3 in reporting stillbirths and
abortion is intriguing. This could be due to affordable subjects from SES 3
seeking the services of tertiary care hospital from far off places. The experience
of infant deaths is less than half among SES 2&3 compared to that of 1.
12. Antenatal Visit
Table 17 First Antenatal visit in relation to gestational age
Gestational age
(months) Frequency %
1 9 2.1 2 40 9.3 3 132 30.8 4 133 31.1 5 83 19.4 6 22 5.1 7 5 1.2 8 4 0.9
Total 428 100 Mean 3.81 sd=1.22 Median 4
42.2 % of the antenatal women are registered within three
months of gestation. This is a very positive sign. But on the otherside, 7.2% are
registered only after the fifth month of gestation. Those who turn up for
registration after consulting private clinics were not included in the study.
Quality of Antenatal Care
22
Therefore the observation that 7.2% are registered late is important. In order to
avoid certain complications of pregnancy and delivery at least one visit should be
made before the end of 12 week of pregnancy.
81.1% of antenatal checkups are done in the first trimester itself
according to the NFHS-2.This was 70% in NFHS-1.But in India only 33% of
livebirths pregnancies received their first antenatal checkup in the first trimester.
Here in this study 2.1 % received their first check up only in the third trimester.
This is comparable to the NFHS-2 finding i.e. 2%.
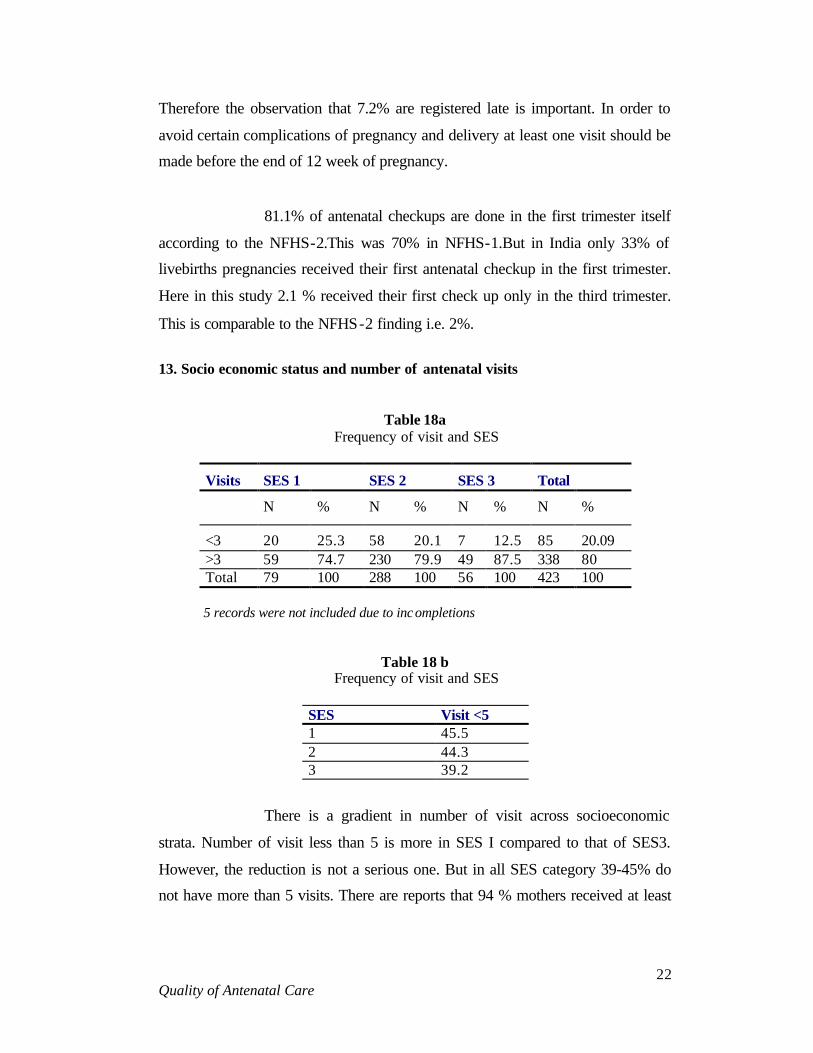
13. Socio economic status and number of antenatal visits
Table 18a Frequency of visit and SES
Visits SES 1 SES 2 SES 3 Total
N % N % N % N %
<3 20 25.3 58 20.1 7 12.5 85 20.09 >3 59 74.7 230 79.9 49 87.5 338 80 Total 79 100 288 100 56 100 423 100
5 records were not included due to inc ompletions
Table 18 b Frequency of visit and SES
SES Visit <5 1 45.5 2 44.3 3 39.2
There is a gradient in number of visit across socioeconomic
strata. Number of visit less than 5 is more in SES I compared to that of SES3.
However, the reduction is not a serious one. But in all SES category 39-45% do
not have more than 5 visits. There are reports that 94 % mothers received at least

Quality of Antenatal Care
23
4 antenatal checkups and 4% had 3 check ups.5 This is in comparison with Indian
figure of 44%.5,15 The apparent reduction in reported number of ante natal visit
could be due to the lack of recording of private consultation, the subjects carry
out.
14. Personnel attended
Specialists in O& G examined all of them. This is because they
were getting treatment from the leading public sector hospitals in the city.98.8%
of antenatal check up is by health professional according to NFHS-2
15. INVESTIGATIONS
Table 19 Hemoglobin levels of antenatal women registered
in the hospitals selected
HB level Freq % <7 gm% 7 1.7
<10 29 7.1 <11 120 29.5
=/>12 252 61.7 Mean 10.99 -
Sd 1.61 - Median 11 -
29.5% of subjects have haemoglobin less than 11. 22.4% are
mild anaemic with haemoglobin levels between 10-10.99. This is in comparison
with NFHS-2 report of 20.3% having Hb less than 11 gm%. Presence of 1.7%
severely anaemias with haemoglobin less than 7 gm /100 ml can be explained by
the fact that majority of subjects are from a tertiary level institution. NFHS-2 do
not report any case of severe anaemia.
408 women out of 428 women (95.3%) had checked the
hemoglobin at the first visit itself. 4.7% people have not checked the hemoglobin
at all. This is a serious situation. There is no reason why 4.7% of women should

Quality of Antenatal Care
24
remain untested for hemoglobin. 1.7% of subjects had hemoglobin value less than
7gm%. This is also a problem, which has a bearing on the reproductive health of
hundreds of women in the district when addressing maternal mortality and
morbidity this proportion of mother with severe anemia should have priority.
More over, only by addressing this segment of population can we improve the
maternal health in any community.
Table 20
Routine investigations in first visit
Done % Grouping& typing 413 96.5 HB 408 95.33 VDRL 417 97.43 HbsAg 419 97.9 Urine albumin 423 98.83 Urine sugar 423 98.83 Urine microscopy 160 37.38 Ultra sound Scan 206 48.13 X-Ray 2 0.04
3.5% of subjects were not screened for blood group. The
proportion is similar for HBV, urine albumin, and sugar. Urine microscopy is
carried out only in 37.38 % and Ultra sound in 48.13%. Even though majority of
subjects were screened for Hb, VDRL, HBSAg, urine albumin and sugar one
cannot understand why about 2.5% were left out without any routine
investigations. One cannot expect it from the leading caregivers in the city. It may
even be said to be an unpardonable omission. NFHS-2 for Kerala gives the figure
of 43.7% for USS and 3.9% for X-ray examinations. The X-ray examinations are
less in the sample and USS is slightly more. However, the NFHS figures in this
case denotes the experience during the entire pregnancy while the table above
shows only the first antenatal visit.
Quality of Antenatal Care
25
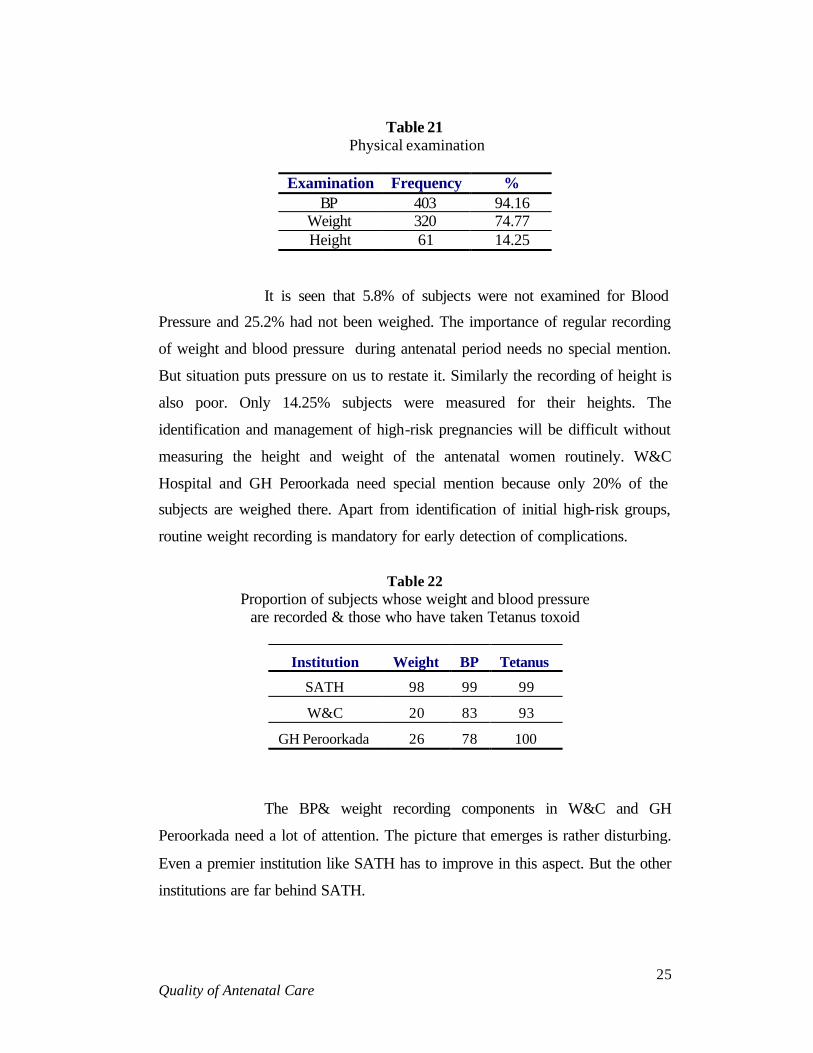
Table 21
Physical examination
Examination Frequency % BP 403 94.16
Weight 320 74.77 Height 61 14.25
It is seen that 5.8% of subjects were not examined for Blood
Pressure and 25.2% had not been weighed. The importance of regular recording
of weight and blood pressure during antenatal period needs no special mention.
But situation puts pressure on us to restate it. Similarly the recording of height is
also poor. Only 14.25% subjects were measured for their heights. The
identification and management of high-risk pregnancies will be difficult without
measuring the height and weight of the antenatal women routinely. W&C
Hospital and GH Peroorkada need special mention because only 20% of the
subjects are weighed there. Apart from identification of initial high-risk groups,
routine weight recording is mandatory for early detection of complications.
Table 22
Proportion of subjects whose weight and blood pressure are recorded & those who have taken Tetanus toxoid
Institution Weight BP Tetanus
SATH 98 99 99
W&C 20 83 93
GH Peroorkada 26 78 100
The BP& weight recording components in W&C and GH
Peroorkada need a lot of attention. The picture that emerges is rather disturbing.
Even a premier institution like SATH has to improve in this aspect. But the other
institutions are far behind SATH.

Quality of Antenatal Care
26
Table 23 Advice to the antenatal women.
Advice Frequency %
Iron Folic acid 428 100 TT 418 97.77 Diet 219 51.3 Rest 65 15.3 Exercise 22 5.2 Sleep 31 7.3 Breast feeding 39 9.2 Care of Nipples 33 7.7 FP 10 2.3
Advice for consumption of Iron Folic Acid & TT injection is
near 100% and this is reflected in the mean hemoglobin value of 11gm%. The
advice, about diet is received by only51.3 % of the antenatal women. But
according to the NFHS-2,72.5 % of the mothers receive advice regarding diet.
Advice regarding rest, exercise, and sleep is given only to a negligible %. This is
very important since 20% of the babies delivered are low birth weight babies.
Even advice about breast-feeding and care of nipples, which are very essential for
proper antenatal, and neonatal care are not being given to the majority of subjects.
Only 2.3% of the antenatal women received advice regarding family planning in
this study whereas it is 30% in the NFHS-2. The advice regarding family
limitation or spacing techniques is important in the sense that there is an increase
incidence in medical termination of pregnancies mainly in the gravida-2category.
This is due to the lack of awareness regarding the spacing methods among the
women even though they may be aware of the permanent methods of sterilization.
And this is the best time for educating mothers about it.

Quality of Antenatal Care
27
Table 24 Presence of relatives during antenatal advice.
Relative proportion Husband allowed or not during examination
100 % not allowed
Husband allowed for advice 12(2.28%) Mother/Mother in Law during examination
8/428(1.9%)
Mother/Mother in law during advice 24/428(5.6%)
It should be an accepted practice to have the husband/ mother /
mother in law during the examination of the antenatal women. But even in a state
like Kerala advice is given to the husband in only 2.8%, and to the mother/
mother in law in 5.6% of the cases. This has to be improved a lot in order to
improve the quality of antenatal care. If only the husband & other family
members are made aware of the condition of the antenatal women, her problems
and solutions, remedial measures can be adopted.
16. Perceived satisfaction with services from the center
Table 25 Perceived satisfaction with services from the center
Fully satisfied Satisfied No Opinion Dissatisfied Personnel N % N % N % N %
1. Doctor 107 25.1 293 68.6 26 6.1 1 0.2 2. Staff Nurse 103 24.1 291 68.1 32 7.5 1 0.2 3. Other staff 69 16.2 279 65.3 76 17.8 3 0.7 4. Material Supplies
68 15.9 282 66 74 17.3 3 0.7
We find that 68% of the subjects are satisfied with the services
of the doctor& staff nurse. 65.3% are satisfied with the services of the other staff.
Around 25% are fully satisfied with the services of the doctor and the staff
nurse.16.2% are fully satisfied with the services of the other staff. For all practical

Quality of Antenatal Care
28
considerations it will be better that we focus on these proportion who are fully
satisfied as the positive opinion. The rest should be considered as not so happy
with the services available. We find the other staff and the material supplies are
the ones with which the subjects are dissatisfied.
17. Reasons for inconveniences
Table 26 Reasons for inconveniences
Reason number % Long waiting time 108 91.5 Lack of facilities 6 5.08 Poor laboratory facilities 1 0.08 Crude behavior of staff 3 2.5
Majority find the long waiting time during antenatal visits
unacceptable. Only 118 persons responded to our question on this aspect. They
are not citing the lack of other facilities as a reason for inconvenience. At the
same time when we enquired about their suggestion for improvement the
following were put across.
18. Suggestions for improvement
Table 27 Suggestions for improvement
Suggestions Number %
Extending laboratory facilities 19 21.8 Extending OP time 41 47.1 Improving hygiene 6 6.9 Improving general facilities 21 24.1
By combining both we come to a conclusion that many feel the
long waiting time is due to shorter OP time. In addition, they are concerned about
the laboratory services and hygiene of the place.

Quality of Antenatal Care
29
19. Follow up visits Table 28
Follow up visits
Visit 2 Visit 3 Visit 4 Visit 5 Examinations N % N % N % N %
Haemoglobin 101 23.6 36 8.4 36 8.4 55 12.9 Urine -Albumin 186 43.5 184 43 169 39.5 232 54.2
Urine -Sugar 186 43.5 184 43 169 39.5 232 54.2 Blood Pressure 377 88.08 365 85.3 334 78.03 238 55.6
Weight 314 73.4 310 72.4 291 68 194 45.33 Foetal Heart 335 78.3 336 78.5 311 72.7 215 50.23
Height of fundus 379 88.6 353 82.5 335 78.3 233 54.44 Advice given 138 32.24 116 27.1 86 20.1 57 13.32 Use of IFA 391 91.4 375 87.6 342 80 251 58.64
Expenditure-Median
250 210 200 170
Visit 6 Visit 7 Visit 8 Examinations
N % N % N %
Haemoglobin 10 2.34 1 0.2
Urine -Albumin 11 2.57 3 0.7
Urine -sugar 11 2.57 3 0.7
Blood Pressure 28 6.54 15 3.5
Weight 21 4.9 12 2.8 5 1.16
Foetal Heart 24 5.61 13 3
Height of Fundus 25 5.84 13 3 4 .0.9
Advice Given 2 0.5 1 0.2 1 0.2
Use of IFA 26 6.07 11 2.6
Expenditure median 250 150 200
Urine albumin, BP recording, weight, Fetal heart recording,
height of fundus, and advice regarding various healthy practices during and after
pregnancy is an important aspect of any good quality ante natal care. What we
find is that priority given to these dimensions are decreasing as the number of
visits increase? This may be because those who are normal during first visit may
Quality of Antenatal Care
30
be neglected in the subsequent visits or it may not be recorded during subsequent
visits. Recording of BP, weight, height of fundus, foetal heart are essentially the
most important practices one will have to undertake even during repeat visits. The
neglect of these should be considered as an indicator of poor quality care.
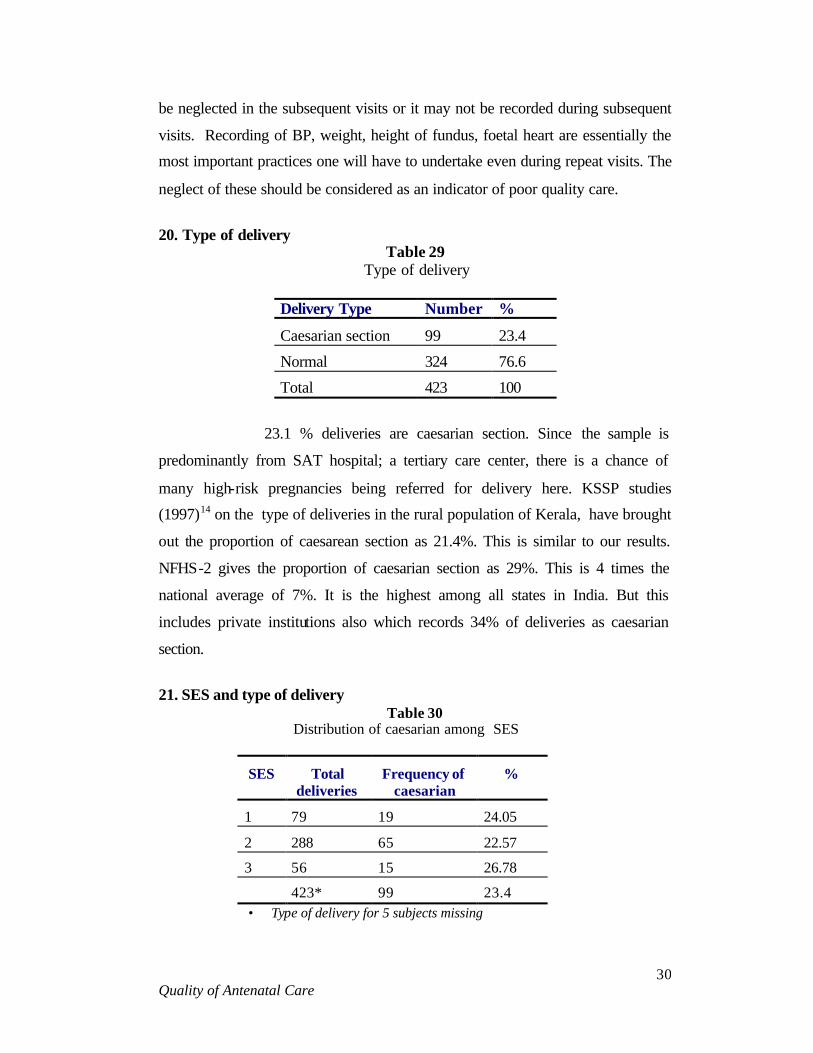
20. Type of delivery
Table 29 Type of delivery
Delivery Type Number %
Caesarian section 99 23.4
Normal 324 76.6
Total 423 100
23.1 % deliveries are caesarian section. Since the sample is
predominantly from SAT hospital; a tertiary care center, there is a chance of
many high-risk pregnancies being referred for delivery here. KSSP studies
(1997)14 on the type of deliveries in the rural population of Kerala, have brought
out the proportion of caesarean section as 21.4%. This is similar to our results.
NFHS-2 gives the proportion of caesarian section as 29%. This is 4 times the
national average of 7%. It is the highest among all states in India. But this
includes private institutions also which records 34% of deliveries as caesarian
section.
21. SES and type of delivery
Table 30 Distribution of caesarian among SES
SES Total deliveries
Frequency of caesarian
%
1 79 19 24.05
2 288 65 22.57
3 56 15 26.78
423* 99 23.4 • Type of delivery for 5 subjects missing

Quality of Antenatal Care
31
The proportion of caesarian sections is not that much different
across various SES strata. There is only a 2.7% increase from SES1 to SES3. This
is a healthy sign. But overall proportion of caesarian is unacceptable. To some
extend it can be explained because of the referral nature of the institutions.
22. Indication for caesarian section
Table 31 Indication for caesarian section
Indication CAESARIAN
Freq %
First degree CPD 23 23.23
Previous caesarian 19 19.19
FETAL DISTRESS 10 10.01
Abnormal presentation 12 12.12
PROM 7 7.07
BOH, PIH 5 5.05
No pain, 2 2.02
HIGH B.P 2 2.02
IUGR 1 1
MVP-colloid goitre 1 1
Abruption &CPD -2 o 1 1
Obstructed labour 1 1
Elderly multipara 1 1 Total 99 100
1st degree Cephalopelvic disproportion and previous caesarian
section constitutes 43 % of the total caesarian sections. 53% has other indications.
Other reports from SAT hospital cites the common indications for caesarian
section for 1997 as
1. CPD 38%
2. Foetal distress 11%

Quality of Antenatal Care
32
3. Previous Caesarian 5%
4. Malpresentation 5%
5. PROM 4%
23. Birth weight
Table 32 Distribution of Birth weight
Birth weight Mean 2863.7 sd 430.8 Median 2890 <2500 16.2 <3000 58.4
Mean birth weight is 2.863 Kg. 16.2% of infants have low birth
weight(less than 2.5 Kg)
Table 33 Distribution of LBWs across different socioeconomic strata
SES HB1 Wt1 Wt4 Mean Bwt LBW% 1 11.33 48.5 51.5 2875.8 19.0 2 10.9 49.0 53.2 2857.7 16.8 3 10.9 52.4 56.6 2877.0 8.9
It is interesting to note that the birth weight as well as
haemoglobin levels is similar in all social classes and the observed differences
are not significant. But the proportion of LBW is half in the higher socio
economic strata.NFHS-2 cites 15.1% as of LBWs. The present data shows16.2%
as LBWs. This could be due to the referral nature of the subjects.
24. Duration of gestation and birth weight
The mean duration of gestation is 271.5 days. With SD of 14.5.
Minimum is 209, 25th percentile 265, median 274 mode 278 and 75 percentile is
Quality of Antenatal Care
33
279. Only 30 out of 428 ie 7% of deliveries were before 252 days or 36 weeks of
gestation. The overall distribution of gestational period is as follows.
38.3% of subjects deliver before 38 weeks of gestation which
records 100 gms less than that of babies after 38 weeks gestation. This is
contributing to the high LBW proportion.
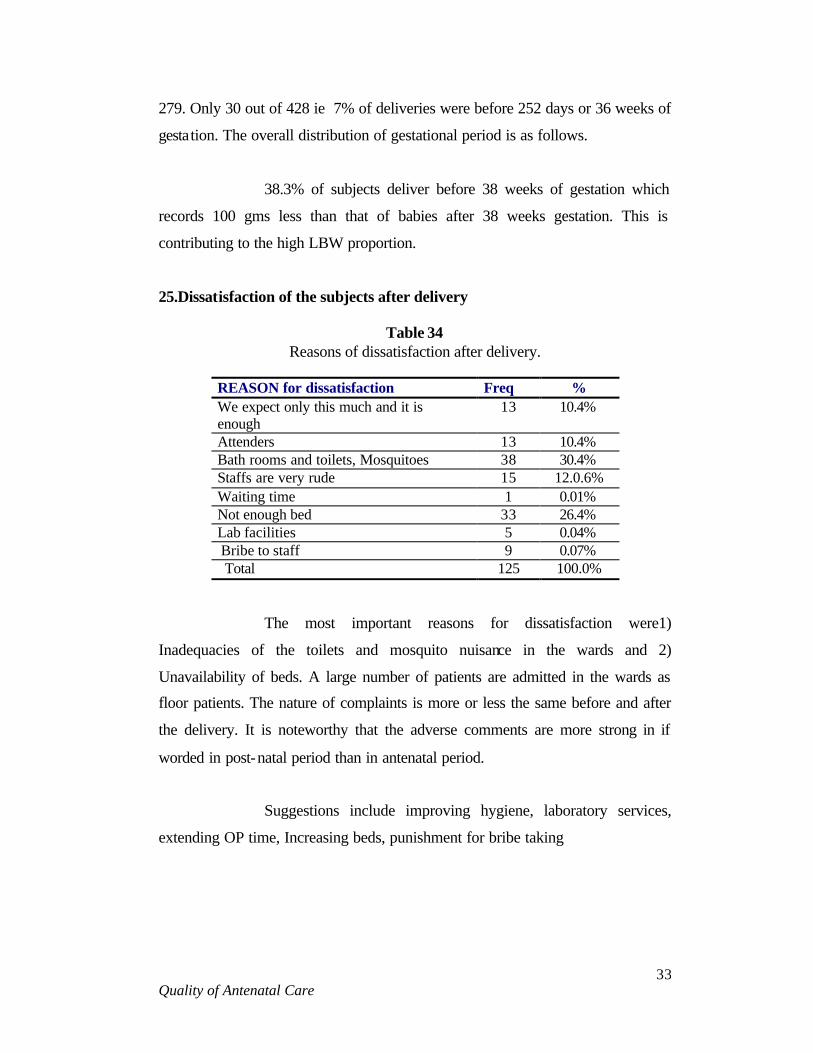
25.Dissatisfaction of the subjects after delivery
Table 34 Reasons of dissatisfaction after delivery.
REASON for dissatisfaction Freq % We expect only this much and it is enough
13 10.4%
Attenders 13 10.4% Bath rooms and toilets, Mosquitoes 38 30.4% Staffs are very rude 15 12.0.6% Waiting time 1 0.01% Not enough bed 33 26.4% Lab facilities 5 0.04% Bribe to staff 9 0.07% Total 125 100.0%
The most important reasons for dissatisfaction were1)
Inadequacies of the toilets and mosquito nuisance in the wards and 2)
Unavailability of beds. A large number of patients are admitted in the wards as
floor patients. The nature of complaints is more or less the same before and after
the delivery. It is noteworthy that the adverse comments are more strong in if
worded in post-natal period than in antenatal period.
Suggestions include improving hygiene, laboratory services,
extending OP time, Increasing beds, punishment for bribe taking

Quality of Antenatal Care
34
26. Postnatal care
Table 35 Satisfaction post natal visit
Number % Full 115 27.4 Partial 169 40.2 No Opinion 136 32.4
Here again in comparison with immediate post partum period
27.4% of subjects were satisfied fully. The rest were partial or had no opinion at
all. There were no cases of any complications, as the sample size is not enough to
capture it.
27. Expenditure a. Antenatal visit
Expenditure of the antenatal visit was collected. Each person
spends about Rs 232 /- per visit. The pattern of expenditure across different socio
economic strata is given in Table 36. It is clear that unlike our expectation people
will have to spend more or less the same amount whether they are from poor
socio economic strata or that of higher one. This private expenditure is incurred
because of travel, incidental expenses, and purchase of some medicines. We were
not in a position to capture private expenditure incurred towards private
consultation.
Table 36
Expenditure for antenatal visit(RS)
SES 1 SES2 SES3 222.5 225.4 234.5

Quality of Antenatal Care
35
b. Expenditure for delivery
Average expenditure for delivery is Rs1949. This includes
caesarian also. The break up of the expenditure is given in table 37. As some of
the subjects did not incur the expenditure for all the items listed the total of all is
higher than that of the average cited above. The total if worked out will be Rs
2285/ for all types of deliveries pooled across various SES. All the 3 centers
selected for this study are government hospitals, which is supposed to render free
services. When we break this expenditure into normal delivery and caesarian the
findings are given in table 37
Table 37
Average Expenditure for delivery
Medicine 271 Bed 495 Doctors fee 486 Laboratory fee 196 Other services 135 Food 501 Transport 133 Incidental 68
Table 38 SES and expenditure for normal delivery
SES1 SES2 SES3 General Mean 1751.6 1896.5 2035.4 1887.3 Sd 423 507 637 516
In general every subject spends Rs 1887.3. This varies from
1751 of SES1 to 1896.5 of SES2 and 2035.4 of SES3. There is a gradient from
SES 1 to 3. But the extend of hike is minimal ie only Rs 283.8. There may be
some error in estimation. Some in the SES 3 may not have revealed all the
expenditure especially that have gone to the doctor. Even the poorest will have to

Quality of Antenatal Care
36
spend nearly RS.1751/- from their pocket to avail delivery related services.
When we compare the expenditure for caesarian deliveries it
varies from 2051,2057 and 2708 for SES1, 2 and 3 respectively. In general Rs
2154.7is being spend by every subjects. The difference between normal and
caesarian is just 267 for total and 300 for poorest sections. This could be due to
prolonged hospital stay.
Table 39 Expenditure pattern for Caesarian and SES
SES1 SES2 SES3 General Mean 2051.1 2057.3 2708.2 2154.7 Sd 535.2 541.9 1234.5 719.28
28. Bystanders
In order to avail the services 99.5% of subjects need one(21.5%)
or two(78%) bystanders to meet the requirements in the hospital. The cost of that
was not worked out. Similarly at least one person (97.4%) has to wait outside the
hospital to provide the services or to facilitate the services.
Table 40
Bystanders within and outside the hospital
One 21.5% Two 78% Within the hospital Three O.5% One 97.4% Two 2.4% Outside Three O.2%
29. Hospital stay
On an average each subject spends 7.2 days in the hospital. So
one will have to spend three person’s services in the hospital to see through the

Quality of Antenatal Care
37
delivery.
Table 41
Duration of hospital stay
Mean duration SD Duration of hospital stay 7.2 days 2.7
Table 42 Hospital stay for normal and caesarian among different SES
SES Normal Caesarian 1 5.9 10.05 2 6.42 10.27 3 6.49 11.13
There is a minor increase in duration of hospital stay across SES1 to SES3. Summary and conclusions
We have studied the quality of the antenatal care in public health
care institutions of Thiruvananthapuram district. SATH, W&C Thycaud, and GH
Peroorkada were studied. 550 persons were recruited for the study in the first
trimester. 430 were followed upon. This gives a follow up rate of 78%. The major
observations are as follows.
• Overall quality of care is good. But there is small group of
subjects who are not receiving essential care.
• The quality of care has to improve more in W&C and GH Peroorkada
• The record keeping is poor and is more so in the W&C hospital and GH peroorkada.
• In the following visits records as well as carrying out monitoring of FH weight and BP comes down.
• Proportion of caesarian sections is 23% which is somewhat equivalent to that of USA
• The expenditure pattern of the subjects across various SES

Quality of Antenatal Care
38
shows close similarity in previously reported expenditure
• Even in these government hospitals as each subject had to pay for bed and doctor to the tune of 500.
• There is a total disregard for antenatal advice.
• Majority of the subjects (>75%) feel that the quality of the services should be improved
• Average hospital stay is 7.2 for all types of delivery including the last antenatal days. This will be 6.4 for normal delivery and 10.2 days for caesarian sections.

Quality of Antenatal Care
39
Bibliography 1. Govt of India(2000), Annual Report 1999-2000, Ministry of Health & Family
Welfare, New Delhi
2. Govt of India(2000), Bulletin on Rural Health Statistics in India, Dec 1999, Rural Health Division, Ministry of Health & Family Welfare,New Delhi
3. Directorate of Health Services,Kerala Report as on 30-12-1999
4. National Family Health Survey-1, Kerala 1992-93
5. National Family Health Survey-2, Kerala 1998-99
6. Registrar General of India-SRS 1995
7. Vijayakumar.K, V.Ramankutty&C.R. Soman, ‘Trends in Birth Weight in Kerala A Hospital Based Study’,Health and population –Perspectives and Issues 13(1&2):52-60, 1990
8. Vijayakumar.K, ‘Birth Spacing and its bearing on birthweight’,Indian Journal of Community Medicine, VolXVII, No.1,1992
9. K.P.Kannan &K.R.Thankappan, ‘Health and Development in Rural Kerala’ published in 1991,Kerala Sastra Sahitya Parishad
10. Economic Review 2000 -State Planning Board
11. Veng,T et al(1973), Pregnancy Termination, The George Washington University (Population Report SeriesF:3)
12. Govt of India(1998), Health Information of India 1995 and 1996, Ministry of Health and Family Welfare, New.Delhi
13. S. Irudaya Rajan & K.C. Zachariah, ‘Long term implications of low fertility in Kerala, India, Asia Pacific Population Journal, Vol 13, No3 (1998pp41-66)
14. K.P.Aravindan, T.P. Kunjikannan, ‘ Health Transition in Rural Kerala 1987-1996’,Kerala Sastra Sahitya Parishad published in 2000 .
15. Padam Singh, R.J Yadav, ‘Antenatal care of Pregnant Women in India’ Indian Journal of Community Medicine. Vol. 25(3) July –Sept 2000.
16. Anoop Mohan Nair, Reena J. Sathyan, Sindhuja N.S. Caesarian sections, the real picture(unpublished).