assessing the risk of persistent drought using climate model
TRANSCRIPT

Assessing the Risk of Persistent Drought Using Climate Model Simulationsand Paleoclimate Data
TOBY R. AULT
Department of Earth and Atmospheric Sciences, Cornell University, Ithaca, New York
JULIA E. COLE AND JONATHAN T. OVERPECK
Department of Geosciences and Department of Atmospheric Sciences, The University of Arizona, Tucson, Arizona
GREGORY T. PEDERSON
U.S. Geological Survey, Bozeman, Montana
DAVID M. MEKO
Laboratory of Tree-Ring Research, The University of Arizona, Tucson, Arizona
(Manuscript received 10 May 2012, in final form 4 November 2013)
ABSTRACT
Projected changes in global rainfall patterns will likely alter water supplies and ecosystems in semiarid
regions during the coming century. Instrumental and paleoclimate data indicate that natural hydroclimate
fluctuations tend to be more energetic at low (multidecadal to multicentury) than at high (interannual) fre-
quencies. State-of-the-art global climate models do not capture this characteristic of hydroclimate variability,
suggesting that the models underestimate the risk of future persistent droughts. Methods are developed here
for assessing the risk of such events in the coming century using climate model projections as well as ob-
servational (paleoclimate) information. Where instrumental and paleoclimate data are reliable, these
methods may provide a more complete view of prolonged drought risk. In the U.S. Southwest, for instance,
state-of-the-art climate model projections suggest the risk of a decade-scale megadrought in the coming
century is less than 50%; the analysis herein suggests that the risk is at least 80%, andmay be higher than 90%
in certain areas. The likelihood of longer-lived events (.35 yr) is between 20% and 50%, and the risk of an
unprecedented 50-yr megadrought is nonnegligible under the most severe warming scenario (5%–10%).
These findings are important to consider as adaptation and mitigation strategies are developed to cope with
regional impacts of climate change, where population growth is high and multidecadal megadrought—worse
than anything seen during the last 2000 years—would pose unprecedented challenges to water resources in the
region.
1. Introduction
Information recorded in paleoclimate archives reveals
that the twentieth century does not represent the full
range of drought variability experienced inwesternNorth
America (WNA) during the last millennium (e.g.,
Woodhouse and Overpeck 1998; Stahle et al. 2007; Cook
et al. 2004; Meko et al. 2007). Prolonged droughts com-
prise a source of climate risk in this region and elsewhere
(Woodhouse and Overpeck 1998; Shanahan et al. 2009;
Buckley et al. 2010; Haug et al. 2003; deMenocal 2001).
Decade-scale droughts like the 1930s Dust Bowl occur,
on average, once or twice per century (Woodhouse and
Overpeck 1998), and considerably longer periods of
aridity (megadroughts) are also apparent in paleoclimate
records (Woodhouse and Overpeck 1998). Were such
megadroughts to occur today, they would exact re-
gionally unprecedented socioeconomic tolls and
Denotes Open Access content.
Corresponding author address: Toby R. Ault, Dept. of Earth and
Atmospheric Sciences, Bradfield Hall, Cornell University, Ithaca,
NY 14853.
E-mail: [email protected]
VOLUME 27 J OURNAL OF CL IMATE 15 OCTOBER 2014
DOI: 10.1175/JCLI-D-12-00282.1
� 2014 American Meteorological Society 7529
ecological consequences. For example, during the 1150s,
the 25-yr average of reconstructed Colorado River flow
dropped to 85% of the twentieth-century mean for 10
consecutive years (Meko et al. 2007). In modern terms,
this would be comparable to losing almost the entire
allocation for the state of Arizona from the long-term
mean for a decade. What is perhaps even more prob-
lematic for water resource management is that the 1150s
were centered in a 23-yr interval of below-average
moisture across WNA, and a similar interval in the
twelfth century spanned 22 yr (1276–99; Cook et al.
2007). Older tree-ring records suggest that regional
droughts can persist, and have persisted, for longer still
(;50 yr; Routson et al. 2011).
Prolonged droughts have happened during the instru-
mental era and include the 1930s Dust Bowl (Fye et al.
2003), drought in sub-Saharan Africa (e.g., Charney
1975; Folland et al. 1986), and the recent ‘‘Big Dry’’ in
Australia (Leblanc et al. 2012). Since these events occur
infrequently, it is difficult to understand their statistics
using data from the instrumental era alone. Tree-ring re-
constructions partially address this limitation, and in the
U.S. Southwest they suggest that events similar to the
1150s ColoradoRiver megadrought would be expected to
occur every 400–600 yr (Meko et al. 2012). This view of
risk is incomplete, however, because it is specific to the
1150s event and ‘‘megadrought risk’’ could be applied
more generally to a wide range of time scales. More crit-
ically, the statistics of twenty-first-century climate will be
influenced by anthropogenic greenhouse gases (GHG)
(Solomon et al. 2007). The risk of future prolonged
drought risk will therefore depend on the internal rate at
which these events occur as well as any GHG-forced
changes in their underlying statistics. In the U.S. South-
west, for instance, precipitation is projected to decrease as
a consequence of GHG-forced changes (e.g., Seager et al.
2007; Solomon et al. 2007; Diffenbaugh and Giorgi 2012).
Any assessment of future megadrought risk, therefore,
should account for both the natural variability inferred
frommulticentennial paleoclimate records and the changes
in rainfall patterns projected to occur in the coming century.
This paper estimates future prolonged drought risk
using information from instrumental records, paleo-
climate archives, and climate model simulations in
simple Monte Carlo realizations of hydroclimate. The
motivation for doing so comes from our notion of risk as
a fractional quantity referring to the likelihood of pro-
longed drought occurrence. We rely on global climate
model simulations of change during the twenty-first
century as estimates of mean conditions in the future,
and we use simple statistical models to build up large
ensembles for calculating risk. This technique assumes
the following:
1) Coupled global climate model simulations of the
twenty-first century present a realistic view of the
direction, magnitude, and uncertainty in forced pre-
cipitation changes, relative to today.
2) Paleoclimate records and observational data can
empirically describe the distribution of variance
across the frequency spectrum from interannual to
multidecadal time scales in regional hydroclimate.
3) Simple models of time series are adequate for
simulating the local statistical characteristics of hy-
droclimate across interannual to multidecadal time
scales, regardless of whether these characteristics are
externally forced or internally generated.
Justifications for statements 1 and 2 are straightfor-
ward: state-of-the-art models agree that semiarid sub-
tropical regions throughout the world will tend to dry
under climate change (e.g., Diffenbaugh and Giorgi
2012), and paleoclimate records, especially tree rings,
are reasonably well validated and widely used to char-
acterize variations of the past for a wide range of water
resource management applications (Meko et al. 2012).
Assumption 3 in the list above deserves further elab-
oration. We begin by noting that in western North
America over the last millennium, stochastic variability
and autocorrelation alone may account for the magni-
tude of hydroclimatic variations on time scales from
years to decades (Hunt 2011; Ault et al. 2013; Coats et al.
2013b). Second, one can easily imagine a situation where
in a single realization of a given model, climatic forcing
enhances overall aridity, but megadroughts do not occur
because a few intermittent wet years disrupt their du-
ration. Given the statistics of this model, megadroughts
might still be likely, but would not be found in this
particular realization.
The scenario delineated above is shown schematically
in Fig. 1. Here, an idealized time series of some hydro-
logical variable (sayP2E) has been generatedwith unit
variance and a mean of zero for the first 100 ‘‘years’’
(Fig. 1a). At year 101 the mean is shifted by20.25s and
an additional 50 years of data are generated while the
variance stays the same. Figures 1b and 1c show re-
alizations of 50 yr of data with the same mean and var-
iance as the final 50 yr of the series in Fig. 1a. Although
both the time series in Figs. 1b and 1c have the same
mean and variance, a prolonged period of time with low
values (a ‘‘megadrought’’) is found in the first re-
alization (Fig. 1b), whereas in the second realization
(Fig. 1c) it is not.
Implied by Fig. 1 is the possibility that deterministic
simulations of climate change using state-of-the-art
numerical models may be insufficient for estimating
megadrought risk because the ensemble sizes of such
7530 JOURNAL OF CL IMATE VOLUME 27

experiments are relatively small (tens of realizations per
model at most), and the statistics of infrequent events
such as megadroughts might not be robust. Using a
multimodel ensemble does not completely guard against
this limitation because model simulations disagree on
the expression of forced changes in hydroclimate at re-
gional scales (e.g., Diffenbaugh and Giorgi 2012). In-
stead, we use large ensembles of stochastic variables to
emulate the statistics of interannual to decadal vari-
ability, and output from global climate models to esti-
mate how precipitation is expected to change this
century. The limitations and possible implications of this
assumption are discussed in section 4.
2. Data and methods
To establish benchmarks for decadal drought and
multidecadal megadrought, we use instrumental pre-
cipitation data (Fig. 2; Mitchell and Jones 2005), and
several recent reconstructions of hydroclimate including
the Palmer drought severity index (PDSI) for the
southwestern United States (Cook et al. 2004), Colo-
rado River streamflow reconstructions (Meko et al.
2007), and drought from northern Mexico (Stahle et al.
2011) (Fig. 3). Although the reconstructions are pre-
cisely dated, they target different regions and aspects of
hydroclimate and hence are not expected to agree with
each other through time (and indeed they do not; Fig. 3).
In addition to these observational datasets, we use out-
put from 27 coupled general circulation models (GCMs)
that are members of the Climate Model Intercom-
parison Project phase 5 (CMIP5) archive. Models were
included if at least one unforced preindustrial control
(piControl) and forced ‘‘historical’’ (late nineteenth
and/or twentieth century) experiment were available, as
well as forced climate change simulations for each of
the following representative concentration pathways
(RCPs; Moss et al. 2010): RCP2.6, RCP4.5, and RCP8.5.
For illustrative purposes, the projected changes in mean
precipitation are shown for the RCP8.5 scenario in Fig. 4
(cf. Fig. 2 of Diffenbaugh and Giorgi 2012). The number
of available runs from each simulation considered here is
reported in the legend of the figure. All model and in-
strumental data were annualized (January–December)
prior to analysis, although our results are not sensitive to
the months used for annualization.
a. Standardizing hydroclimate indicators
Here we develop a systematic approach to normali-
zing hydroclimate fluctuations so that they retain their
essential meaning whether they originate from cli-
mate model simulations, observational datasets, or
FIG. 1. Schematic illustration of why large ensembles are needed to calculate megadrought risk. (a) The black line
shows the original and shifted mean, while (b),(c) the black lines show the original mean for reference. Importantly,
the means and variances are the same for the final 50 yr in (a)–(c) but only the realization in (b) experiences
a megadrought.
15 OCTOBER 2014 AULT ET AL . 7531

paleoclimate reconstructions. We further seek to dis-
tinguish between decadal droughts, which have been
experienced during the instrumental era (e.g., the 1930s
Dust Bowl), and multidecadal megadrought events that
are outside the range of variability experienced during
the twentieth century. To begin, we consider two of the
worst decade-scale droughts during the twentieth cen-
tury: the 1930s Dust Bowl and the 1950s Southwest
drought. Both of these intervals can be identified as
20.5s departures in the decadal (11-yr) runningmean of
precipitation (Fig. 2).
Identifying 20.5s events in the 11-yr means of paleo-
climate records requires us to normalize these time
series to exhibit unit variance over the twentieth cen-
tury, so that fluctuations in the past are scaled relative to
this baseline period. To that end we represent the entire
Colorado streamflow record as normalized departures
[Z(t)] from the late twentieth-century mean:
Z(t)5F(t)2 m
s, (1)
where F(t) is reconstructed flow and m and s are the
mean and standard deviation, respectively, of the annual
data over the reference period of 1950–2000 CE. The
time series of Z(t) is a modified z score of F(t), and its
values through time are shown in Fig. 3a. Identifying
intervals of20.5s departures in the running 11-yr mean
highlights the 1150s, as well as several other low-flow
decades, which occur about once per century (gray
vertical bars). Time series from other recent drought
studies (Cook et al. 2004; Stahle et al. 2011), normalized
in the same way, are also shown in Figs. 3b and 3c. They
suggest that the preindustrial rate of comparable
decade-long droughts is ;1.5%century21, which is
quite consistent with the literature-based estimate of
1%–2%century21 of Woodhouse and Overpeck (1998).
Our definition of decadal drought captures major in-
tervals of aridity during the twentieth century as well as
others during the last millennium (Figs. 3 and 2). We
employ a second andmore stringent criterion to identify
multidecadal megadrought. In this case, 20.5s de-
partures in the 35-yr mean are identified. Although this
definition is somewhat arbitrary, it is useful because the
thresholds employed are both longer in time and greater
in magnitude than the descriptions of Meko et al. (2007)
and Cook et al. (2007) used to characterize the worst
droughts of the past millennium in Colorado streamflow
and continental-scale hydroclimate, respectively. By
setting the criterion for multidecadal megadrought
FIG. 2. The 11-yr running means of normalized paleoclimate reconstructions for twentieth-
century precipitation data from (a) the U.S. Southwest and (b) the Great Plains. Precipitation
data are from the University of East Anglia’s Climate Research Unit’s time series version 3.1
(TS3.1) dataset (Mitchell and Jones 2005). We identify decadal droughts as 20.5 standard
deviations of raw data in the 11-yr mean (vertical gray bars).
7532 JOURNAL OF CL IMATE VOLUME 27

beyond anything experienced during the last millen-
nium, we suggest that our results will be insightful for
developing adaptation and mitigation strategies for ad-
dressing worst-case scenarios. We also note that a 35-yr,
20.5s event would be on par with the consequential late
twentieth-century Sahel drought (e.g., Hoerling et al.
2006). Other similar thresholds (e.g., 25 or 45 yr) would
produce qualitatively similar spatial patterns, but the
rates of megadrought occurrence and levels of mega-
drought risk would of course differ from the ones we
report here. In particular, for a given magnitude (say
20.5s) the risk of shorter events would be higher and
the risk of longer events would be lower than that for
a 35-yr event.
b. Monte Carlo simulations of drought
With the definitions of ‘‘decadal drought’’ (an 11-yr,
20.5s event) and ‘‘multidecadal megadrought’’ (a 35-yr,
20.5s event) that we have outlined above, we now de-
velop ‘‘null’’ expectations for the rate at which these
events would occur from random chance under a station-
ary climate, but with three different assumptions about
the underlying frequency characteristics of hydroclimate
variability on interannual to centennial time scales.
We begin by examining the statistics of prolonged
drought when interannual hydroclimate fluctuations are
simulated as normally distributed white noise with unit
variance and standard deviation. An example of one
such time series, Xw(t) is shown in Fig. 5. The decadal
drought statistics of this type of noise, obtained from
1000 white noise realizations (each of length 100 years),
are summarized in Fig. 6. If the distribution of variance
across the hydroclimatic continuum were indeed white,
then decadal droughts would be expected to occur at
a rate of slightly ,1 (100 yr)21 (Fig. 6a), and the risk of
such an event occurring during any given 50-yr period
would be around 45% (Fig. 6b). The likelihood of
a multidecadal megadrought during any given 50-yr
period would be only about 0.45% (Fig. 6b). This pre-
liminaryMonte Carlo result establishes a benchmark for
the minimum rate at which decadal droughts and meg-
adroughts would occur in a climate with only stochastic
interannual variability and no sources of long-term
persistence.
Although raw precipitation tends to have a white
spectrum on interannual time scales (e.g., Vasseur and
Yodzis 2004; Ault and St George 2010), the underlying
continuum of hydroclimate may be somewhat ‘‘redder’’
in WNA (Cayan et al. 1998; Ault and St George 2010;
Ault et al. 2012, 2013). Moreover, drought indices typi-
cally have a source of built-in autocorrelation to ac-
commodate the reality that surface moisture stores
FIG. 3. The 11-yr running means of normalized paleoclimate reconstructions for (a) the
Colorado streamflow (Meko et al. 2007), (b) reconstructed PDSI from the southwesternUnited
States (Cook et al. 2004), and (c) reconstructed PDSI fromMexico (Stahle et al. 2011). Vertical
gray bars indicate decadal-scale drought (a20.5s deviation in the 11-yr mean). All time series
are standardized to exhibit one unit of standard deviation and a mean of zero over the 1950–
2000 reference period.
15 OCTOBER 2014 AULT ET AL . 7533

depend on their prior states (i.e., they have ‘‘memory’’).
For example, PDSI models the surface water balance
using a simplified approximation of soil moisture, and
has a built-in autocorrelation function (e.g., Alley 1984;
Wells et al. 2004). Similarly, the standardized pre-
cipitation index (SPI) integrates anomalies over a num-
ber of predefined lags tomeasure how aggregated rainfall
anomalies deviate from their long-term averages.
FIG. 4. Map of projected precipitation over the twenty-first-century (2005–2100) change in the RCP8.5 scenario shown as a percentage
of twentieth-century precipitation change [as in the global maps of Diffenbaugh and Giorgi (2012)]. For each model, the number of
available runs from each experiment is shown in parentheses in the following order: historical, piControl, RCP2.6, RCP4.5, and RCP8.5.
The red box shows the greater southwestern United States to emphasize the focus of this study (308–408N, 1208–1038W).
7534 JOURNAL OF CL IMATE VOLUME 27

In a simplistic sense, year-to-year persistence can be
described as a first-order autoregressive [AR(1)] process
[XAR(1)(t)]:
XAR(1)(t)5aXAR(1)(t2 1)1Xw(t) , (2)
where a is the lag-1 (i.e., 1 yr) autocorrelation coefficient
and is derived empirically from data, XAR(1)(t) is au-
toregressive red noise, andXw(t) is thewhite noise input.
In WNA, the value of a is about 0.3 on interannual time
scales for the three (tree ring based) paleoclimate re-
constructions shown in Fig. 3, as well as for many other
hydroclimate indicators (Ault et al. 2013). A single re-
alization of this type of noise (normalized to exhibit unit
variance overall) is shown in Fig. 5, and the statistical
characteristics of megadroughts in this type of noise are
shown in Fig. 6.
Despite the intuitive and simple representation of
hydroclimate as an AR(1) process—moisture deficits
tend to persist through time—there is some evidence
that such an approximation misses key characteris-
tics of variability on longer time scales (Pelletier and
Turcotte 1997; Kantelhardt et al. 2006; Koscielny-
Bunde et al. 2006; Ault et al. 2013). As a complemen-
tary approach, we also simulate hydroclimate as
a process with underlying frequency characteristics
that are described by a weak power-law relationship
between frequency f and variance S( f ), such that
S( f ) } f2b. Power spectra with higher values of b cor-
respond to time series that exhibit more variance at
lower frequencies. To generate time series with this
type of frequency behavior, we employ a method
similar to the one described by Pelletier and Turcotte
(1997) and explained thoroughly in Pelletier (2008).
First, we calculate the discrete Fourier transform of
FIG. 5. Examples of Monte Carlo (MC) time series used to simulate decadal drought with
three different underlying frequency characteristics [white noise, AR(1), and power law]:
(a) 50 yr of a single MC realization of each type of noise, (b) the 1000-yr full realization of each
noise type, and (c) the 11-yr running mean of each type of noise, shown with the dashed line
denoting a decadal drought (e.g., a 20.5s in the 11-yr running mean). Importantly, each MC
time series has a mean of zero and unit standard deviation, and differ only in the distribution of
their variances across the power spectrum.Moreover, the AR(1) and power-law time series are
generated by rescaling the white noise data, which is why the different realizations of noise
appear so strongly correlated with each other.
15 OCTOBER 2014 AULT ET AL . 7535

a white noise time series Xw(t), and filter it to conform
to a predefined value of b:
~Xp(k)5ck �N
t51
Xw(t)e2i2pk[(t21)/N], k5 0, . . . ,N2 1,
(3)
where k are the standard Fourier frequencies and N is
the length of the time series. The term ck rescales the
Fourier coefficients so that they are approximately
power-law distributed:
ck5
8>>>>><>>>>>:
�1
N
�2b/ffiffi2
p
if k5 0
�k
N
�2b/ffiffi2
p
otherwise.
(4)
Here the value of b is divided byffiffiffi2
pbecause it is being
applied to the raw Fourier coefficients, which have am-
plitudes proportional to the square root of the power
spectrum.
The rescaled Fourier series ~Xp(k) is then used to
generate power-law time series Xp(t) by taking the real
part of the inverse Fourier transform of ~Xp(k):
Xp(t)5Re
(1
N�N21
k50
~Xp(k)e2i2pk[(t21)/N]
), t51, . . . ,N .
(5)
Finally, the mean and variance are restored to the values
of the original white noise data (zero and unity, in this
case).
We used a value of 0.5 for b to rescale each realization
ofXw(t), which was suggested as an appropriate estimate
by Ault et al. (2013) from synthesis of tree-ring re-
constructions of precipitation, PDSI, and streamflow as
well as non-tree-ring estimates of hydroclimate. As
a check, we calculated the power laws of the noises after
they had been rescaled. We found that the actual values
of b varied from one realization to the next, but were
generally between 0.4 and 0.6. This range agrees well
with instrumental and paleoclimate estimates of this
parameter for the region, and is certainly within the
observational uncertainty (Ault et al. 2013). Impor-
tantly, time series with spectra scaled by power laws of
;0.5 will also appear to exhibit autocorrelation of about
0.3, which in turn implies that the AR(1) and power-law
realizations will behave very similarly on short time
scales, but not necessarily on longer ones (e.g., Pelletier
and Turcotte 1997; Ault et al. 2013). Finally, our use of
power-law noises does not make any assumptions about
the underlying climate dynamics governing the shape of
the power spectrum of hydroclimate: linear and non-
linear processes alike may produce such spectral distri-
butions (Milotti 1995; Penland and Sardeshmukh 2012).
Table 1 highlights a few key features of the two
models employed here. In particular, the noise models
used to estimate drought risk use parameters that do not
vary across space, and all are scaled to the twentieth-
centurymean and variance. The autocorrelation parameter
of 0.3 is a middle-of-the-road value from the time series
FIG. 6. Statistics summarizing Monte Carlo simulations: (a) dis-
tributions of years spent in decadal ($11 yr) drought conditions for
each type of noise (as a percentage of all realizations), (b) risk of at
least one decadal ($11 yr) drought during any given 50-yr window
in any realizations, and (c) risk of a multidecadal ($35 yr) drought
during any 50-yr window. Risk in (b) and (c) is expressed as
a percentage of the total number of simulations.
7536 JOURNAL OF CL IMATE VOLUME 27
shown in Fig. 3, and is well within the range of estimates
for autocorrelation in the region from other paleo-
climate and observational datasets (Ault et al. 2013).
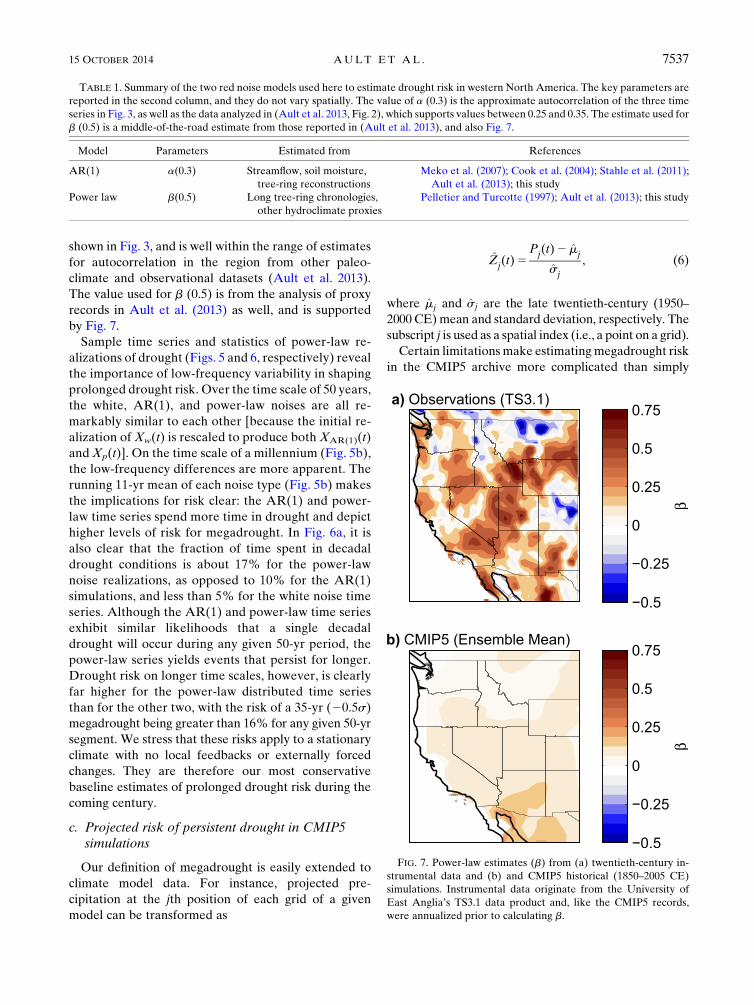
The value used for b (0.5) is from the analysis of proxy
records in Ault et al. (2013) as well, and is supported
by Fig. 7.
Sample time series and statistics of power-law re-
alizations of drought (Figs. 5 and 6, respectively) reveal
the importance of low-frequency variability in shaping
prolonged drought risk. Over the time scale of 50 years,
the white, AR(1), and power-law noises are all re-
markably similar to each other [because the initial re-
alization of Xw(t) is rescaled to produce both XAR(1)(t)
andXp(t)]. On the time scale of a millennium (Fig. 5b),
the low-frequency differences are more apparent. The
running 11-yr mean of each noise type (Fig. 5b) makes
the implications for risk clear: the AR(1) and power-
law time series spend more time in drought and depict
higher levels of risk for megadrought. In Fig. 6a, it is
also clear that the fraction of time spent in decadal
drought conditions is about 17% for the power-law
noise realizations, as opposed to 10% for the AR(1)
simulations, and less than 5% for the white noise time
series. Although the AR(1) and power-law time series
exhibit similar likelihoods that a single decadal
drought will occur during any given 50-yr period, the
power-law series yields events that persist for longer.
Drought risk on longer time scales, however, is clearly
far higher for the power-law distributed time series
than for the other two, with the risk of a 35-yr (20.5s)
megadrought being greater than 16% for any given 50-yr
segment. We stress that these risks apply to a stationary
climate with no local feedbacks or externally forced
changes. They are therefore our most conservative
baseline estimates of prolonged drought risk during the
coming century.
c. Projected risk of persistent drought in CMIP5simulations
Our definition of megadrought is easily extended to
climate model data. For instance, projected pre-
cipitation at the jth position of each grid of a given
model can be transformed as
Zj(t)5Pj(t)2 mj
sj
, (6)
where mj and sj are the late twentieth-century (1950–
2000 CE)mean and standard deviation, respectively. The
subscript j is used as a spatial index (i.e., a point on a grid).
Certain limitationsmake estimatingmegadrought risk
in the CMIP5 archive more complicated than simply
TABLE 1. Summary of the two red noise models used here to estimate drought risk in western North America. The key parameters are
reported in the second column, and they do not vary spatially. The value of a (0.3) is the approximate autocorrelation of the three time
series in Fig. 3, as well as the data analyzed in (Ault et al. 2013, Fig. 2), which supports values between 0.25 and 0.35. The estimate used for
b (0.5) is a middle-of-the-road estimate from those reported in (Ault et al. 2013), and also Fig. 7.
Model Parameters Estimated from References
AR(1) a(0.3) Streamflow, soil moisture,
tree-ring reconstructions
Meko et al. (2007); Cook et al. (2004); Stahle et al. (2011);
Ault et al. (2013); this study
Power law b(0.5) Long tree-ring chronologies,
other hydroclimate proxies
Pelletier and Turcotte (1997); Ault et al. (2013); this study
FIG. 7. Power-law estimates (b) from (a) twentieth-century in-
strumental data and (b) and CMIP5 historical (1850–2005 CE)
simulations. Instrumental data originate from the University of
East Anglia’s TS3.1 data product and, like the CMIP5 records,
were annualized prior to calculating b.
15 OCTOBER 2014 AULT ET AL . 7537

calculating how often these events occur in climate
projections. First, the number of ensemble members
available from each model is small (Fig. 4), and the role
for internal variability may be substantial on decadal to
multidecadal time scales (Hawkins and Sutton 2009;
Deser et al. 2012). This makes it difficult to reliably es-
timate risks stemming from the combined influences of
forced changes and internal variability. Second, the
distribution of variance across time scales is different in
observational data than in models. In particular, models
tend to exhibit power spectra resembling white noise in
WNA, even when run for many centuries or forced with
the time-evolving boundary conditions of the last mil-
lennium (Ault et al. 2012, 2013). To illustrate this point
further here, we show power-law estimates from ob-
servations and CMIP5 data in Fig. 7. In this case, the
power-law coefficients are calculated from each model
individually and then averaged together to produce this
map. Importantly, the results of individual models ap-
pear similar to this ensemble average, supporting recent
findings that the continuum of hydroclimate in WNA
appears to be considerably redder in observations than
in models (Ault et al. 2013, 2012).
We address the aforementioned challenges by de-
veloping a Monte Carlo model of hydroclimate vari-
ability to emulate the statistics of both natural variability
and climate change in WNA. This approach enables us
to evaluate projected risk of prolonged drought in the
twenty-first century for a given climate change scenario.
We use the underlying frequency characteristics of ob-
servational data (including paleodata), as well as pro-
jected changes in precipitation simulated by models
archived as part of CMIP5. The Monte Carlo model is
described by
Zij(t)5Xw(t)
1A1 j(Dmij,s
2mij) , (7)
where Zij(t) is normalized precipitation of the ith model
at the jth point on a grid, and Xw(t) is a normally dis-
tributed time series of white noise with unit variance.
The quantity .ij/sij scales the white noise by normalizing
the twenty-first-century standard deviations (.ij) from
a given model grid point by the corresponding
twentieth-century reference standard deviation (sij).
Twentieth- to twenty-first-century differences in mean
precipitation at each point in each model are repre-
sented by the random, normally distributed variable jij,
with expected mean ofDmij (the change in precipitation)
and variance (s2mij), estimated from ensembles of runs
when possible, and otherwise set to zero. Finally, to
generate Monte Carlo twenty-first-century realizations
of hydroclimate with AR(1) and power-law distribu-
tions in frequency space, we rescale Zij(t) following the
same methods described above.
We estimate decadal drought and multidecadal meg-
adrought risk in three climate change scenarios (RCP2.6,
RCP4.5, and RCP8.5) for each of the 27 CMIP5 models
considered here by generating 1000 stochastic (white
noise) realizations, each 1000 years long, of WNA
hydroclimate using Eq. (7), as well as the AR(1) and
power-law rescaling procedures. In each model, and for
each RCP, estimates of s are made using the 1950–2000
portion of the model’s historical simulation, and . is es-
timated over the 50-yr interval spanning 2050–2100.
Likewise, Dm and s2m, are estimated from the differences
between historical (1950–2000) and late twenty-first-
century (2050–2100) precipitation means. We then
identify the percentage of all 1000 realizations that ex-
perience decadal drought or multidecadal megadrought
conditions in each RCP, model, and type of noise.
3. Results
In the CMIP5 control runs, rates of decadal drought
occurrence (the average number of events per century)
are spatially uniform and close to one (Fig. 8a). Similarly,
white noise realizations also tend to produce about one
event per century.Under climate change, rates of decadal
drought occurrence show more regional diversity than in
the controls (Figs. 8b–d). In the northern part of WNA,
rates are close to zero, whereas throughout much of the
U.S. Southwest they are between 1.5 and 1.75. Multi-
decadalmegadrought rates are close to zero in the control
runs of the CMIP5 archive (Fig. 8e). Under climate
change, these rates are closer to 0.5 (or 1 event per
200 yr), but they are still quite rare (Figs. 8f–h).
The risk of a single decade-long drought over any
given 50-yr period in the control runs is about 50%
(Fig. 9a), which is intuitive because the corresponding
rate is about one per century. Decadal drought risk in
the climate change scenarios, estimated over the period
2050–2100, depicts a decrease in the northern regions,
and an increase to between 60%and 80% (Figs. 9b–d) in
the U.S. Southwest. Moreover, risk increases in the U.S.
Southwest with the intensity of the warming; the highest
levels are found under the RCP8.5 scenario.
In the unforced control runs, the risk of amultidecadal
megadrought is less than 1% throughout the region
(Fig. 9e). Under climate change, however, risks in the
U.S. Southwest increase to 10%–20% inRCP2.6 (Fig. 9f),
20%–40% inRCP4.5 (Fig. 9g), and 30%–50% inRCP8.5
(Fig. 9h).
A qualitatively similar picture of risk to that in Fig. 9 is
seen in Figs. 10 and 11, which summarize our Monte
7538 JOURNAL OF CL IMATE VOLUME 27

Carlo experiments using Eq. (7) to generate stochastic
hydroclimate realizations, and the procedures described
in section 2b to rescale them to exhibit AR(1) and
power-law frequency distributions. In the U.S. South-
west, for example, risk of droughts at both decadal and
multidecadal time scales increases with the intensity of
the greenhouse gas forcing (columns) and type of noise
(rows). Uncertainty in our risk estimates is depicted by
the standard deviations of the individualmodel estimates
of risk in Fig. 12. Results for the multidecadal mega-
drought risk standard deviations are shown in Fig. 13.
Thus far, we have only considered the risk of a pro-
longed period of aridity using two somewhat narrow
definitions of decadal drought and megadrought. To
develop a more complete representation of drought
risk across a wide range of time scales and magnitudes,
we examine the two-dimensional probability density
function of drought risk using the same time scale-
independent definition employed by Ault et al. (2013).
Specifically, a drought is defined as a period of time
during which 3/5 of the antecedent years are below
a particular threshold. These thresholds are the values of
the x axes on the individual panels of Fig. 14, and the
time scales are shown on the y axes of that figure. As in
the earlier figures, risk is estimated from allMonte Carlo
simulations of each model for each RCP, then averaged
across the individual CMIP5 members to produce the
‘‘magnitude versus duration’’ diagrams in Fig. 14.
The results in Fig. 14 show that risk increases with
GHG forcing intensity across all time scales in the raw
CMIP5 archive (Figs. 14a–c), as well as for each type of
noise. It also illustrates that the AR(1) and power-law
distributions depict higher levels of risk on decadal and
longer time scales than the white noise and CMIP5 en-
sembles. To emphasize this point further, we show the
differences in drought risk across time scales between
each type of noise and the rawCMIP5 estimates in Fig. 15.
From this figure, it is clear that the low-probability (but
FIG. 8. Estimated rate of prolonged drought occurrence in (a),(e) control and (b)–(d),(f)–(h) forced CMIP5 simulations. The rate is
calculated as the number of events per century averaged across all models, and across all centuries in the control cases in (a) and (e). (top)
Indicates the rate of decadal ($11 yr) drought, and (bottom) the rate ofmultidecadal ($35 yr) megadrought occurrence. Forcing scenarios
are indicated to the left of each map.
15 OCTOBER 2014 AULT ET AL . 7539

presumably consequential) ‘‘tails’’ of the distributions are
far more likely in the AR(1) and power-law noises than in
the raw CMIP5 archive. For instance, under the RCP8.5
scenario, the risk of a 0.5s event on 40-yr time scales is
below 5% as estimated from CMIP5 runs (Fig. 14c), but
closer to 10% in the power-lawnoise realizations (Fig. 14i).
We extend our analysis of megadrought risk in the
western United States to the rest of the world by exam-
ining raw CMIP5 estimates of decadal drought and mul-
tidecadal megadrought from the three RCP scenarios
(Fig. 16). Risks throughout the subtropics appear as high
as or higher than our estimates for the U.S. Southwest
(e.g., in the Mediterranean region, western and southern
Africa, Australia, and much of South America). We do
not attempt to develop regionally appropriate stochastic
realizations of precipitation at this time, although such an
endeavor could be straightforward in areas where in-
strumental and paleoclimate data are adequate to char-
acterize the underlying continuum of hydroclimate. In
areas where low-frequency variability in precipitation is
substantial andnotwell simulated by climatemodels (e.g.,
West Africa; Ault et al. 2012), the results shown here
likely underestimate future risk of persistent drought.
We stress that our results have only used precipitation,
yet temperature may play a substantial role in driving or
exacerbating drought. Also, we used the low end of b
estimates from Ault et al. (2013) to generate the power-
law noises, but higher values might be realistic on long
time scales, according to the preponderance of paleo-
climate evidence considered in that study, and would
raise the levels of risk. Hence, to the extent that the global
climate models simulate future change realistically and
FIG. 9. Estimated risk of at least one prolonged drought in (a),(e) control and (b)–(d),(f)–(h) simulations. (top) Indicates the risk
of decadal (.11 yr) drought, and (bottom) indicates the risk of multidecadal (.35 yr) megadrought. The risk is calculated as the percent
of the total number of models (27) that simulate decadal or multidecadal megadrought. Forcing scenarios are indicated to the left of
each map.
7540 JOURNAL OF CL IMATE VOLUME 27

FIG. 10. Decadal (.11 yr) drought risk estimates obtained from Monte Carlo simulations of projected precipitation changes across all
models in three different climate change scenarios (columns) and for three different types of noises (rows). These maps express the
average risk estimates obtained from Monte Carlo simulations of precipitation in each model under three climate change scenarios. For
each of the 27 individual CMIP5 models, risk is calculated as the percentage of the total number of Monte Carlo simulations (1000) that
show a decadal drought. Here, those estimates of risk are averaged across the multimodel archive.
15 OCTOBER 2014 AULT ET AL . 7541
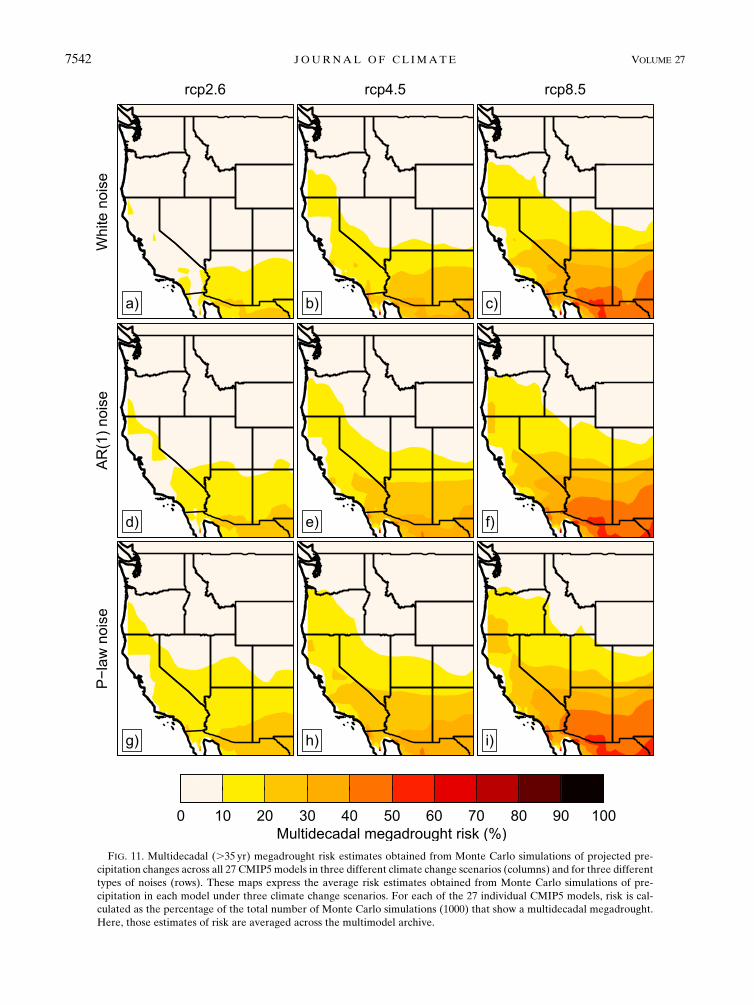
FIG. 11. Multidecadal (.35 yr) megadrought risk estimates obtained from Monte Carlo simulations of projected pre-
cipitation changes across all 27 CMIP5 models in three different climate change scenarios (columns) and for three different
types of noises (rows). These maps express the average risk estimates obtained from Monte Carlo simulations of pre-
cipitation in each model under three climate change scenarios. For each of the 27 individual CMIP5 models, risk is cal-
culated as the percentage of the total number of Monte Carlo simulations (1000) that show a multidecadal megadrought.
Here, those estimates of risk are averaged across the multimodel archive.
7542 JOURNAL OF CL IMATE VOLUME 27

FIG. 12. Standard deviations of decadal (.11 yr) drought risk estimates in Fig. 10. Standard deviations are calculated from the individual
risk estimates of each model at each point for three different climate change scenarios (columns) and for three different types of noises
(rows). These maps express the spatial variability of uncertainty in the risk estimates of Fig. 10.
15 OCTOBER 2014 AULT ET AL . 7543

FIG. 13. Standard deviations of drought risk estimates as in Fig. 12, but for multidecadal (.35 yr) megadrought risk.
7544 JOURNAL OF CL IMATE VOLUME 27

our simpleMonte Carlo models are adequate, the view of
risk presented here is quite conservative.
4. Discussion and conclusions
In the current generation of global climatemodels, the
risk of a decade-scale drought occurring this century is at
least 50% for most of the greater southwestern United
States and may indeed be closer to 80% (Figs. 9 and 10).
The probability of multidecadal megadrought is also
high: the likelihood of a 35-yr event is between 10% and
50% depending on how much climate change is realized
during the coming century. The probability of even
longer events (.50-yr, or ‘‘permanent,’’ megadrought)
is nonnegligible (5%–10%) for the most intense warm-
ing scenario (Fig. 14). Risk levels correspond to the in-
tensity of forcing and the underlying distribution of
hydroclimatic variance across the frequency continuum.
The RCP8.5 scenario, for instance, depicts the highest
levels of risk regardless of the underlying noise type.
Likewise, the power-law noises produce higher mega-
drought likelihoods for each RCP than the other noises.
An obvious limitation of our work is that it is ‘‘blind’’ to
certain aspects of dynamically driven changes in prolonged
drought risk. For instance, changes in the magnitude, fre-
quency, or teleconnection patterns of El Niño and LaNiña(e.g., Coats et al. 2013a) may alter the statistics of in-
terannual variability in ways that are not captured by our
simple models. Further, megadrought statistics over the
last millenniummay be forcing dependent, as suggested by
Cook et al. (2004), for instance, which shows that mega-
droughts were more common during the medieval climate
era of 850–1200 CE. Another very serious limitation is
imposed by the reliability of the models themselves to
make realistic predictions of changes in climatological
precipitation for the end of the twenty-first century.
FIG. 14. Drought magnitude vs duration for realizations of southwestern U.S. precipitation time series in each climate change scenario,
obtained from the following sources: (a)–(c) raw CMIP5 projections, (d)–(f) white noise, (g)–(i) AR(1) realizations, and (j)–(l) power-law
realizations.
15 OCTOBER 2014 AULT ET AL . 7545

The projected increases in risk for the U.S. Southwest
reflect forced changes in the global hydrological cycle
(e.g., Held and Soden 2006; Solomon et al. 2007; Vecchi
and Soden 2007; Seager et al. 2010). As such, the global
picture of persistent drought risk in the CMIP5 archive
(Fig. 16) bears a striking resemblance to the projected
decreases in precipitation throughout many semiarid
regions of the world (Diffenbaugh and Giorgi 2012;
Knutti and Sedlacek 2013). It follows that prolonged
drought risk is a function not only of forced changes in
the global hydrological cycle and the severity of future
warming, but also of the accuracy with which GCMs
project large-scale changes in hydroclimate (e.g., Held
and Soden 2006; Seager et al. 2007; Vecchi and Soden
2007; Seager et al. 2010). Moreover, we have based our
analysis on precipitation projections, yet this variable
has been notoriously challenging for GCMs to simulate
accurately and large biases may remain in some models
(e.g., Knutti and Sedlacek 2013; Jiang et al. 2012). Our
estimates of risk are consequently only as accurate as
climate model projections of changes in precipitation.
An alternative approach, employed for instance by
Seager et al. (2007, 2010), examines the role of large-
scale dynamic and thermodynamic controls on pre-
cipitation minus evapotranspiration (P 2 E). Such
studies have found that drought conditions like the Dust
Bowl will become normal in the Southwest and in other
subtropical dry zones. If such transitions are indeed
‘‘imminent,’’ as stated in those studies, then the risk of
decadal drought is 100%, and the risk of longer-lived
events is probably also extremely high. By orienting our
analysis around precipitation, the risks of prolonged
drought we show here are in fact the lowest levels con-
sistent with model simulations of future climates.
From Fig. 16 it is also clear that several other areas
may be facing similar (or worse) levels of prolonged risk
in the coming century. Synthesis of paleoclimatic, in-
strumental, andmodel data for these regionsmay lead to
improvements in projecting risks in these areas and
preparing appropriate adaptation and mitigation strat-
egies. For example, high-resolution tree-ring and cave
records are available from Southeast Asia (e.g., Cook
et al. 2010a; Buckley et al. 2010; Sinha et al. 2007, 2011;
Zhang et al. 2008) and could be used in conducting such
an analysis for that region.
Despite the simplicity of our Monte Carlo model of
hydroclimate inWNA, our results illustrate a crucial point
for water resourcemanagers in the region: CMIP5models
alone underestimate megadrought risk. This argument
was implied in several recent studies (Cook et al. 2010b;
Ault et al. 2012, 2013), but its details and implications are
laid out more explicitly here (Fig. 15 specifically). Future
work could refine estimates of future risks by adding ad-
ditional layers of complexity to the framework we have
outlined. For example, we have only used annual pre-
cipitation, which we found to be approximately normally
distributed in most of WNA in most models. A more so-
phisticated approach could simulate the joint PDF of
FIG. 15. Differences in duration vs magnitude risk estimates between raw CMIP5 and the two types of noises with low-frequency
variability. These results are for the southwestern U.S. region, and they illustrate the difference in drought risk at a given magnitude and
duration if low-frequency noise is prominent. Under the strongest forcing, the low-frequency noise models increase the risk of a multi-
decadal megadrought by about 8%–10%.
7546 JOURNAL OF CL IMATE VOLUME 27

temperature and precipitation at monthly resolution, and
use a more fine-tuned type of distribution and various
drought indices to do so. Moreover, our noise simulations
are one-dimensional in the sense that we did not build
spatial autocorrelation into the noises. Developing and
applying a model with realistic spatial covariance struc-
tures could help in addressing risks associated with per-
sistent drought across large geographic scales. Likewise, it
is possible that improvements in climate models, along
with increasing computer power to run larger and larger
ensembles, will allow for dynamically constrained assess-
ments of megadrought risk using future generations of
fully coupled climatemodels. In themeantime, our results
provide quantitative benchmarks for water management
and climate modeling communities.
5. Implications
Droughts in the past have had particularly notable
human and financial costs. In the United States alone,
for instance, the Federal Crop Insurance Corporation
spent an average of $1.7 billion annually to compensate
losses from 1980 to 2005, and this number has been in-
creasing (Stephenson 2007). In the future, such losses
might be curtailed if the full range of natural and forced
hydroclimatic variability can be included in mega-
drought risk mitigation strategies. Here, we have
described a method for combining insights from obser-
vational data and projections from climate models to
estimate the risk of persistent intervals of aridity in the
coming century in the U.S. Southwest. In this region
where high-quality proxy records of hydroclimate have
been used to constrain the underlying features of hy-
droclimate on decadal and longer time scales, the risk of
decadal drought is at least 70% and may be higher than
90%. The risk of a multidecadal megadrought may be as
high as 20%–50%, and the likelihood of an un-
precedented 50-yr drought is nonnegligible (5%–10%).
A number of other regions face similarly high levels of
risk including southern Africa, Australia, and the Am-
azon basin. Moreover, future drought severity will be
exacerbated by increases in temperature, implying that
FIG. 16. Global estimates of (left) decadal and (right) multidecadal megadrought in the raw CMIP5 archive. As in
Fig. 9, risk is calculated as the percent of the total number of models (27) that simulate a decadal or multidecadal
megadrought. Forcing scenarios are indicated to the left of each map.
15 OCTOBER 2014 AULT ET AL . 7547
our results should be viewed as conservative provided
that themodels depict accurate forced trends in regional
hydroclimate. These findings emphasize the need to
develop drought mitigation strategies that can cope with
decadal and multidecadal droughts in changing climates
with substantial sources of low-frequency variability.
Acknowledgments. We thank Steve Gray, Jeff Lukas,
Connie Woodhouse, and the U.S. Bureau of Reclama-
tion for assistance, and we appreciate the helpful re-
views we received from Joellen Russell and Scott St.
George. We are also grateful for the extensive insight
and feedback we received from an anonymous reviewer.
This project was supported in part by NSF graduate and
NCAR-ASP postdoctoral fellowships to T. Ault, NOAA
CCDD (NA07OAR4310054), NSF P2C2 (0903093)
support for J. Cole, and NOAA Climate Program Office
support for CLIMAS (J. Overpeck), as well as NSF
EaSM2Grant (1243125) to Cole andOverpeck. Any use
of trade, product, or firm names is for descriptive pur-
poses only and does not imply endorsement by the U.S.
Government.
REFERENCES
Alley, W. M., 1984: The Palmer drought severity index—
Limitations and assumptions. J. Climate Appl. Meteor.,
23, 1100–1109, doi:10.1175/1520-0450(1984)023,1100:
TPDSIL.2.0.CO;2.
Ault, T. R., and S. St. George, 2010: The magnitude of decadal and
multidecadal variability in North American precipitation.
J. Climate, 23, 842–850, doi:10.1175/2009JCLI3013.1.
——, J. E. Cole, and S. St. George, 2012: The amplitude of decadal
to multidecadal variability in precipitation simulated by state-
of-the-art climate models. Geophys. Res. Lett., 39, L21705,
doi:10.1029/2012GL053424.
——, ——, J. T. Overpeck, G. T. Pederson, S. St. George, B. Otto-
Bliesner, C. A. Woodhouse, and C. Deser, 2013: The contin-
uum of hydroclimate variability in western North America
during the last millennium. J. Climate, 26, 5863–5878,
doi:10.1175/JCLI-D-11-00732.1.
Buckley, B. M., and Coauthors, 2010: Climate as a contributing
factor in the demise of Angkor, Cambodia. Proc. Natl. Acad.
Sci. USA, 107, 6748–6752, doi:10.1073/pnas.0910827107.Cayan, D. R., M. D. Dettinger, H. F. Diaz, and N. E. Graham, 1998:
Decadal variability of precipitation over western NorthAmerica.
J. Climate, 11, 3148–3166, doi:10.1175/1520-0442(1998)011,3148:
DVOPOW.2.0.CO;2.
Charney, J., 1975: Dynamics of deserts and drought in Sahel.
Quart. J. Roy. Meteor. Soc., 101, 193–202, doi:10.1002/
qj.49710142802.
Coats, S., J. E. Smerdon, B. I. Cook, and R. Seager, 2013a: Sta-
tionarity of the tropical pacific teleconnection to North
America in CMIP5/PMIP3 model simulations. Geophys. Res.
Lett., 40, 4927–4932, doi:10.1002/grl.50938.——, ——, R. Seager, B. I. Cook, and J. F. González-Rouco,
2013b: Megadroughts in southwestern North America in
ECHO-G millennial simulations and their comparison to
proxy drought reconstructions. J. Climate, 26, 7635–7649,
doi:10.1175/JCLI-D-12-00603.1.
Cook, E. R., C. A. Woodhouse, C. M. Eakin, D. M. Meko, and
D. W. Stahle, 2004: Long-term aridity changes in the western
United States. Science, 306, 1015–1018, doi:10.1126/
science.1102586.
——, R. Seager, M. A. Cane, and D. W. Stahle, 2007: North
American drought: Reconstructions, causes, and consequences.
Earth Sci. Rev., 81, 93–134, doi:10.1016/j.earscirev.2006.12.002.
——, K. J. Anchukaitis, B. M. Buckley, R. D. D’Arrigo, G. C.
Jacoby, and W. E. Wright, 2010a: Asian monsoon failure and
megadrought during the last millennium. Science, 328, 486–
489, doi:10.1126/science.1185188.
——, R. Seager, R. R. Heim, R. S. Vose, C. Herweijer, and
C.Woodhouse, 2010b:Megadroughts in NorthAmerica: Placing
IPCC projections of hydroclimatic change in a long-term pa-
laeoclimate context. J. Quat. Sci., 25, 48–61, doi:10.1002/jqs.1303.
deMenocal, P., 2001: Cultural responses to climate change during
the Late Holocene. Science, 292, 667–673, doi:10.1126/
science.1059827.
Deser, C., A. Phillips, V. Bourdette, and H. Teng, 2012: Uncertainty
in climate change projections: The role of internal variability.
Climate Dyn., 38, 527–546, doi:10.1007/s00382-010-0977-x.Diffenbaugh, N., and F. Giorgi, 2012: Climate change hotspots in
the CMIP5 global climate model ensemble. Climatic Change,
114, 813–822, doi:10.1007/s10584-012-0570-x.Folland, C. K., T. N. Palmer, and D. E. Parker, 1986: Sahel rainfall
and worldwide sea temperatures, 1901–85. Nature, 320, 602–
607, doi:10.1038/320602a0.
Fye, F. K., D. W. Stahle, and E. R. Cook, 2003: Paleoclimatic an-
alogs to twentieth-century moisture regimes across the United
States. Bull. Amer. Meteor. Soc., 84, 901–909, doi:10.1175/
BAMS-84-7-901.
Haug, G. H., D. Gunther, L. C. Peterson, D. M. Sigman, K. A.
Hughen, and B. Aeschlimann, 2003: Climate and the collapse
of Maya civilization. Science, 299, 1731–1735, doi:10.1126/
science.1080444.
Hawkins, E., and R. Sutton, 2009: The potential to narrow un-
certainty in regional climate predictions. Bull. Amer. Meteor.
Soc., 90, 1095–1107, doi:10.1175/2009BAMS2607.1.
Held, I. M., and B. J. Soden, 2006: Robust responses of the hy-
drological cycle to global warming. J. Climate, 19, 5686–5699,
doi:10.1175/JCLI3990.1.
Hoerling, M., J. Hurrell, J. Eischeid, and A. Phillips, 2006: De-
tection and attribution of twentieth-century northern and
southern African rainfall change. J. Climate, 19, 3989–4008,
doi:10.1175/JCLI3842.1.
Hunt, B. G., 2011: Global characteristics of pluvial and dry multi-
year episodes, with emphasis on megadroughts. Int. J. Cli-
matol., 31, 1425–1439, doi:10.1002/joc.2166.
Jiang, J. H., and Coauthors, 2012: Evaluation of cloud and water
vapor simulations in CMIP5 climate models using NASA
‘‘A-Train’’ satellite observations. J. Geophys. Res., 117,D14105,
doi:10.1029/2011JD017237.
Kantelhardt, J., E. Koscielny-Bunde, D. Rybski, P. Braun,
A. Bunde, and S. Havlin, 2006: Long-term persistence and mul-
tifractality of precipitation and river runoff records. J. Geophys.
Res., 111, D01106, doi:10.1029/2005JD005881.
Knutti, R., and J. Sedlacek, 2013: Robustness and uncertainties in
the new CMIP5 climate model projections. Nat. Climate
Change, 3, 369–373, doi:10.1038/nclimate1716.
Koscielny-Bunde, E., J. W. Kantelhardt, P. Braun, A. Bunde, and
S. Havlin, 2006: Long-term persistence and multifractality of
7548 JOURNAL OF CL IMATE VOLUME 27

river runoff records: Detrended fluctuation studies. J. Hydrol.,
322, 120–137, doi:10.1016/j.jhydrol.2005.03.004.
Leblanc, M., S. Tweed, A. VanDijk, and B. Timbal, 2012: A review
of historic and future hydrological changes in the Murray-
Darling Basin. Global Planet. Change, 80–81, 226–246,
doi:10.1016/j.gloplacha.2011.10.012.
Meko, D. M., C. A. Woodhouse, C. A. Baisan, T. Knight, J. J.
Lukas, M. K. Hughes, and M. W. Salzer, 2007: Medieval
drought in the upper Colorado River Basin. Geophys. Res.
Lett., 34, L10705, doi:10.1029/2007GL029988.
——, ——, and K. Morino, 2012: Dendrochronology and links
to streamflow. J. Hydrol., 412, 200–209, doi:10.1016/
j.jhydrol.2010.11.041.
Milotti, E., 1995: Linear processes that produce 1/f or flicker noise.
Phys. Rev. E, 51, 3087–3103, doi:10.1103/PhysRevE.51.3087.
Mitchell, T. D., and P. D. Jones, 2005: An improved method of
constructing a database of monthly climate observations and
associated high-resolution grids. Int. J. Climatol., 25, 693–712,
doi:10.1002/joc.1181.
Moss, R. H., and Coauthors, 2010: The next generation of scenarios
for climate change research and assessment.Nature, 463, 747–
756, doi:10.1038/nature08823.
Pelletier, J. D., 2008: Quantitative Modeling of Earth System Pro-
cesses. 1st ed. Cambridge University Press, 294 pp.
——, and D. Turcotte, 1997: Long-range persistence in climato-
logical and hydrological time series: Analysis, modeling and
application to drought hazard assessment. J. Hydrol., 203,
198–208, doi:10.1016/S0022-1694(97)00102-9.
Penland, C., and P. D. Sardeshmukh, 2012: Alternative in-
terpretations of power-law distributions found in nature.
Chaos, 22, 023119, doi:10.1063/1.4706504.
Routson, C. C., C. A. Woodhouse, and J. T. Overpeck, 2011: Sec-
ond century megadrought in the Rio Grande headwaters,
Colorado: How unusual was medieval drought?Geophys. Res.
Lett., 38, L22703, doi:10.1029/2011GL050015.
Seager, R., and Coauthors, 2007: Model projections of an im-
minent transition to a more arid climate in southwestern
North America. Science, 316, 1181–1184, doi:10.1126/
science.1139601.
——, N. Naik, and G. A. Vecchi, 2010: Thermodynamic and dy-
namic mechanisms for large-scale changes in the hydrological
cycle in response to global warming. J. Climate, 23, 4651–4668,
doi:10.1175/2010JCLI3655.1.
Shanahan, T. M., and Coauthors, 2009: Atlantic forcing of persis-
tent drought in West Africa. Science, 324, 377–380,
doi:10.1126/science.1166352.
Sinha, A., K. G. Cannariato, L. D. Stott, H. Cheng, R. L. Edwards,
M. G. Yadava, R. Ramesh, and I. B. Singh, 2007: A 900-year
(600 to 1500 A.D.) record of the Indian summer monsoon
precipitation from the core monsoon zone of India. Geophys.
Res. Lett., 34, L16707, doi:10.1029/2007GL030431.
——, L. Stott, M. Berkelhammer, H. Cheng, R. L. Edwards,
B. Buckley, M. Aldenderfer, and M. Mudelsee, 2011: A
global context for megadroughts in monsoon Asia during the
past millennium. Quat. Sci. Rev., 30, 47–62, doi:10.1016/j.quascirev.2010.10.005.
Solomon, S., D. Qin,M.Manning, Z. Chen,M.Marquis, K. Averyt,
M. Tignor, and H. L. Miller, Eds., 2007: Climate Change 2007:
The Physical Science Basis. Cambridge University Press,
996 pp.
Stahle,D.W., F.K. Fye, E.R.Cook, andR.D.Griffin, 2007: Tree-ring
reconstructedmegadroughts overNorthAmerica sinceAD1300.
Climatic Change, 83, 133–149, doi:10.1007/s10584-006-9171-x.
——, and Coauthors, 2011: Major Mesoamerican droughts of the
past millennium.Geophys. Res. Lett., 38, L05703, doi:10.1029/
2010GL046472.
Stephenson, J. B., 2007: Climate change: Financial risks to federal
and private insurers in coming decades are potentially signif-
icant. Committee on Homeland Security and Governmental
Affairs, U.S. Govt. Accountability Office, 22 pp. [Available
online at http://www.gao.gov/products/GAO-07-760T.]
Vasseur, D., and P. Yodzis, 2004: The color of environmental noise.
Ecology, 85, 1146–1152, doi:10.1890/02-3122.Vecchi, G. A., and B. J. Soden, 2007: Global warming and the
weakening of the tropical circulation. J. Climate, 20, 4316–
4340, doi:10.1175/JCLI4258.1.
Wells, N., S. Goddard, and M. J. Hayes, 2004: A self-calibrating
Palmer drought severity index. J. Climate, 17, 2335–2351,
doi:10.1175/1520-0442(2004)017,2335:ASPDSI.2.0.CO;2.
Woodhouse, C. A., and J. T. Overpeck, 1998: 2000 years of drought
variability in the central United States. Bull. Amer. Meteor.
Soc., 79, 2693–2714, doi:10.1175/1520-0477(1998)079,2693:
YODVIT.2.0.CO;2.
Zhang, P., and Coauthors, 2008: A test of climate, sun, and culture
relationships from an 1810-year Chinese cave record. Science,
322, 940–942, doi:10.1126/science.1163965.
15 OCTOBER 2014 AULT ET AL . 7549