assessing the seismic performance of rammed earth walls by using
TRANSCRIPT

Bui et al., Cogent Engineering (2016), 3: 1200835http://dx.doi.org/10.1080/23311916.2016.1200835
CIVIL & ENVIRONMENTAL ENGINEERING | RESEARCH ARTICLE
Assessing the seismic performance of rammed earth walls by using discrete elementsQuoc-Bao Bui1*, Tan-Trung Bui2 and Ali Limam2
Abstract: Rammed earth (RE) is attracting renewed interest throughout the world because of its low embodied energy and its interesting hygric-thermal behavior. Several studies have recently been carried out to investigate this material. However, the seismic behavior of RE walls is still an important subject that needs to be more thoroughly investigated. The present study assesses the seismic performance of RE walls by using the discrete element modeling (DEM) and the nonlinear pushover method. Firstly, nonlinear “force–displacement” curves of the studied wall were obtained by DEM. Secondly, the standard “acceleration–displacement” curves were carried out following Eurocode 8. Thirdly, the above curves were superimposed to determine the intersection point (target point) which enabled to assess the seismic performance of the studied wall in the corresponding conditions (vertical load, seis-mic zone). The results show that the studied walls can have satisfactory resistance in seismicity zones ranging from “very low” to “moderate” (according to Eurocode 8). For “medium” seismicity zones, the studied structures should only be construct-ed on A-type soils (very good soil). For B-type soils, wall reinforcement techniques would be necessary. Without special reinforcements, studied RE structures seem unsuitable for “strong” seismicity zones, for all soil types.
Subjects: Geomechanics; Soil Mechanics; Structural Engineering; Waste & Recycling
Keywords: rammed earth; seismic performance; discrete element method; pushover; sustainable development
1. IntroductionRammed earth (RE) is attracting interest in the context of sustainable development because of its low embodied energy and its interesting hygric-thermal behavior. Several studies have recently been conducted to investigate this material. However, the seismic behavior of RE walls requires more thorough investigation. The first exploratory study on the dynamic characteristics of RE
*Corresponding author: Quoc-Bao Bui, University of Savoie, Chambery 73000, France E-mail: [email protected]
Reviewing editor:Sanjay Kumar Shukla, Edith Cowan University, Australia
Additional information is available at the end of the article
ABOUT THE AUTHORDr Quoc-Bao Bui obtained his PhD degree in 2008 at School of Civil Engineering Lyon (ENTPE-INSA Lyon), France. From 2011, he has been associate professor at University Savoie Mont Blanc, Chambery, France. His research activities concentrate on the dynamic of structures (earthquake behavior, vibrational measurements, in situ non-destructive tests, beam-column joints) and non-conventional materials (rammed-earth, non-conventional concrete).
PUBLIC INTEREST STATEMENTRammed earth (RE) is attracting renewed interest throughout the world because of its “green” characteristics in the context of sustainable development. The present study assesses the seismic performance of RE walls. The results show that the studied walls can have satisfactory resistance in seismicity zones ranging from “very low” to “moderate” (according to Eurocode 8). For “medium” seismicity zones, the RE structures should only be constructed on A-type soils (very good soil). For B-type soils, wall reinforcement techniques would be necessary.
Received: 23 October 2015Accepted: 09 June 2016First Published: 14 June 2016
© 2016 The Author(s). This open access article is distributed under a Creative Commons Attribution (CC-BY) 4.0 license.
Page 1 of 12
Dr Quoc-Bao Bui

Page 2 of 12
Bui et al., Cogent Engineering (2016), 3: 1200835http://dx.doi.org/10.1080/23311916.2016.1200835
buildings was carried out by Bui, Hans, Morel, and Do (2011). The dynamic characteristics (natural frequencies, mode shapes and the damping) of the studied buildings were identified. These studies also showed that the analytical shear-beam model could reproduce the dynamic behavior of the buildings studied. Then Gomes, Lopes, and de Brito (2011) conducted a numerical study on the seis-mic resistance of RE constructions in Portugal, but there were still several limitations. Firstly, their model did not analyze the behavior of RE material in detail and there was not a validation step in their numerical model. Secondly, the seismic assessment was conducted using the classical elastic linear equivalent approach, which is less advantageous than the nonlinear approaches. Cheah, Walker, Heath, and Morgan (2012), Hamilton, McBride, and Grill (2006), Miccoli, Müller, and Fontana (2014), Miccoli, Oliveira, Silva, Muller, and Schueremans (2015), and Silva et al. (2013) present various experiments on the shear behavior of several RE walls (stabilized or unstabilized, unreinforced or reinforced). Ciancio and Augarde (2013) studied the out-out-plane of stabilized RE subject to lateral wind force. However, there has not yet been any quantitative study on the seismic performance of RE buildings on the structure scale.
From the view point of earthquake engineering, RE material does not seem favorable. Indeed, the material works essentially in compression and has a very low tensile strength; the walls’ mass is high, which can cause considerable inertial forces during earthquakes. However, according to a number of post-seismic investigations, RE walls present acceptable behaviors. For example, in the Morris and Walker investigation (Morris & Walker, 2011) after the Darfield earthquake (2010, New Zealand, 7.1 on the Richter magnitude scale), only minor cracks were observed in RE walls. This means that when RE buildings are well designed and executed, they can have a satisfactory seismic performance. The present study assesses this performance quantitatively.
It is important to note that the seismic behavior of a RE building depends on several parameters: Earthquake action (seismicity zone, soil type, site factors), the structure’s dynamic characteristics (natural frequencies, modal shapes, damping), and the material’s characteristics (compressive, ten-sile strengths, Young’s modulus, density). This is why for the same material (RE in this case), the seismic performance of each building may differ depending on its structural characteristics and the quality of its execution. This paper investigates three virtual RE buildings with current designs for RE houses in France and Europe: One story in RE walls, two stories in RE walls, the first story in RE walls and the second story a wooden structure. The RE walls are 50-cm-thick unstabilized RE, built by a pneumatic rammer and their seismic performance is investigated for an almost dry state, several months after their construction (about 2–3% of moisture content, Bui, Morel, Hans, & Meunier, 2009; Bui, Morel, Reddy, & Ghayad, 2009).
The assessment used the nonlinear pushover method, in a numerical model with the discrete ele-ment method. One of the main advantages of the numerical approach is the possibility to simulate several pushover tests on a full-scale wall. The wall modeled is in an actual RE house where in situ dynamic measurements were taken during the construction (Bui et al., 2011; Bui, Morel, Hans, et al., 2009). The dynamic characteristics of the wall were measured so that the relevancy of the numerical results could be checked.
2. Pushover methodTraditionally, earthquake-resistant design has been strength-based, using linear elastic analysis. Since inelastic behavior is usually allowed for strong earthquakes, this is not entirely rational. Strength-based design considers inelastic behavior only implicitly. Displacement-based (or deforma-tion-based) design considers inelastic behavior explicitly, using nonlinear analysis (Chopra & Goel, 2002). Displacement-based design recognizes that in an earthquake, inelastic deformation can be greater than that in strength-based. The present paper uses the displacement-based design with the pushover method. It is important to note that the pushover method has not been included in previous French earthquake regulations. It is presented in Eurocode 8 (EN 1998-1:2004, 2004), which has been applied in France and Europe for several years.

Page 3 of 12
Bui et al., Cogent Engineering (2016), 3: 1200835http://dx.doi.org/10.1080/23311916.2016.1200835
The pushover method is a static nonlinear analysis. Firstly, a capacity curve is established (by ex-periments or numerical models, which enable nonlinear analysis). The seismic force (represented by the shear force at the wall base Vb) is transformed to spectral acceleration Sa (Figure 1(a)):
where m is the mass supported by the wall, and the displacement of the wall top ut is replaced by the spectral displacement SD (SD = ut).
Secondly, the seismic elastic spectrum Sa, which is given in the seismic design code and a function of the structure natural period T, is also transformed in the spectrum Sa − Sd (Figure 1(b)) by the fol-lowing relationship:
When the two above curves (Sa − Sd) are superposed (Figure 1(c)), the intersection point (D1 for elastic spectrum or D2 for inelastic spectrum) indicates the performance point (or “target point”) that can give information on the damage state of the studied structure. More information on the pushover method can be found in Chopra and Goel (2002) and EN 1998-1:2004 (2004).
As explained above, the pushover method is a nonlinear analysis, so this approach recognizes that inelastic deformation should be taken into account. In general, the design (inelastic) spectrum is obtained by dividing the elastic spectrum by a “behavior factor” q. This is an important parameter in the pushover method; it accounts implicitly for inelastic response, the presence of damping and other force reduce effects, such as period elongation and soil–structure interaction. The behavior factor is defined as the ratio of the elastic acceleration response spectrum expected at a site to that of an inelastic spectrum used for design of a structure (Salvitti & Elnashai, 1996):
The procedure to determine the “rational” q is quite complex because it depends not only on the material, but also on the structural configuration. This procedure will not be presented in detail here; only typical values proposed in Eurocode 8 will be discussed. q can be:
• 1 for structures with essentially elastic behavior.
• 1.5 for structures with limited ductility.
• 3 for structures with ductile behavior. Some ductile structures can have q = 5.
(1)Sa = Vb∕m
(2)Sd = Sa∕(2�∕T)2
(3)q = Selastica ∕Sinelastica
Figure 1. Synthesis of the pushover method, according to Eurocode 8.
Vb
ut
Sa
SD
Capacity curve
Sa
T
Acceleration spectrum
Sa
SD
Sa
SD
Elastic spectrum
(a)
(b)
(c)
Inelastic spectrum
D1D2
Elastic spectrum

Page 4 of 12
Bui et al., Cogent Engineering (2016), 3: 1200835http://dx.doi.org/10.1080/23311916.2016.1200835
There is not yet a specific value of q for RE structures, but for unreinforced masonry structures, Eurocode 8 authorizes that q is taken to be at least 1.5. If the inelastic spectrum is used, the perfor-mance point will be D2 (Figure 1(c)).
3. Discrete element method and parametric studies
3.1. Discrete element methodThe explicit discrete element modeling (DEM) based on finite difference principles originated in the early 1970s as the result of landmark work on the progressive movements of rock masses such as 2D rigid block assemblages (Cundall, 1971). This technique was then extended to the modeling of masonry and concrete (Bui, Limam, & Bui, 2014; Lourenço, Oliveira, Roca, & Orduña, 2005). However, to our knowledge, DEM has not yet been used to study RE structures.
The 3DEC code (Itasca, 2011) was used in the present study. The RE wall was modeled as an as-semblage of discrete blocks (earthen layers), and the interfaces between earthen layers were mod-eled by introducing an interface law.
Earthen layers were assumed to be homogeneous and isotropic and were modeled by blocks that were further divided into a finite number of internal elements for stress, strain, and displacement calculations. The failure envelope used in this study was the Mohr–Coulomb criterion with a tension cut-off (Bui, Bui, Limam, & Morel, 2015).
Interfaces between earthen layers were modeled by an interface law between the blocks accord-ing to the Mohr–Coulomb interface model with a tension cut-off. This interface constitutive model considers both shear and tensile failure, and interface dilation is included. Further details of the constitutive behaviors of blocks and interfaces can be found in Itasca (2011).
3.2. Parametric studiesIn a previous study by the authors (Bui et al., 2015), parametric studies identified 13 parame-ters necessary for the DEM; the summary of recommendations is presented in Table 1. In that table, fc is the compressive strength and Young’s modulus was calculated in the elastic part which was from 0 to 20% of the ultimate compressive stress (Bui, Morel, Hans, & Walker, 2014). These recommendations are strengthened with the results presented in other studies that used the finite element method (El Nabouche, Bui, Perrotin, Plé, & Plassiard, 2015; Miccoli, Oliveira, et al., 2015).
Table 1. Recommended parameters for earthen blocks and interfaces in DEMEarthen blocks
Density d (kg/m3) Young’s modulus (Eb)
Poisson’s ratio (ν)
Tensile strength (ft)
Cohesion (c) Friction angle (φ) Dilatancy angle (Ψ)
~2,000 (450–500) × fc 0.22 (0.07–0.1) × fc (0.07–0.1) × fc 45–51° ~12°
Bui, Morel, Hans, et al. (2009)
Bui, Morel, Hans, et al. (2009)
Bui, Morel, et al. (2014)
Bui, Bui, Limam, and Maximilien
(2014)
Bui, Bui, et al. (2014), Cheah et al. (2012)
Bui et al. (2015), Bui, Bui, et al. (2014), Cheah et al. (2012), El
Nabouche et al. (2015), Miccoli, Oliveira, et al. (2015)
Bui et al. (2015), Cundall (1971)
Interfaces
Normal stiffness (kn)
Shear stiffness (ks)
Tensile strength (ft,interface)
Cohesion (cinterface)
Friction angle (φinterface) Dilatancy angle (Ψ)
Ewall
.Eblock
(Eblock−Ewall).hblockkn/[2(1 + ν)] 110–150 kPa 110–150 kPa 25–45° ~12°
Lourenço et al. (2005)
Lourenço et al. (2005)
Bui et al. (2015) Bui et al. (2015) Bui et al. (2015) Bui et al. (2015)

Page 5 of 12
Bui et al., Cogent Engineering (2016), 3: 1200835http://dx.doi.org/10.1080/23311916.2016.1200835
According to the proposed values, Bui et al. (2015) obtained useful numerical results by comparing with experiments in two cases: Loading perpendicular to earthen layers and loading in the diagonal direction. The DEM application for the lateral loads will be presented in this paper.
4. Seismic capacity of RE walls
4.1. Wall descriptionThe studied wall was constructed in a new RE house in the Rhone-Alpine region, France. It is 50 cm thick and is an unstabilized RE wall. In situ dynamic measurements were taken on this wall (during the construction phase, Bui, Morel, Hans, et al., 2009) and on the complete house (after the construc-tion Bui et al., 2011), so the wall’s dynamic characteristics were determined. A numerical model was constructed using DEM (Figure 2). The compressive strength determined from the compression tests on cylindrical samples was used (fc = 1.9 MPa). Young’s modulus, density and Poisson’s ratio were also measured: 470 MPa (Bui, Morel, Hans, et al., 2009), 20 kN/m3 (Bui & Morel, 2009; Bui, Morel, Hans, et al., 2009) and 0.22 (Bui, Morel, et al., 2014), respectively.
A parametric study was conducted to identify other characteristics of the earthen blocks and the interfaces (Bui et al., 2015). The parameters identified are presented in Table 2, which reproduce the natural frequencies measured on site (Table 3).
4.2. Pushover curveThe wall was simplified but on the safety side: Although the wall has some resistances in the direc-tion perpendicular to its plane, this resistance is generally ignored for a structural design against
Table 2. Parameters of earthen blocks and interfaces used in the DEM modelEarthen blocks
Tensile strength ft Cohesion c Friction angle ϕ
133 kPa 133 kPa 45°
Bui, Bui, et al. (2014) Bui, Bui, et al. (2014) Bui, Bui, et al. (2014)
Interfaces
Normal stiffness kn Tensile strength ft, interface Cohesion cinterface Friction angle ϕinterface
60 GPa/m 113 kPa 113 kPa 38°
Bui et al. (2015) 0 Bui et al. (2015) Identified
Figure 2. Wall studied and its mesh in DEM.

Page 6 of 12
Bui et al., Cogent Engineering (2016), 3: 1200835http://dx.doi.org/10.1080/23311916.2016.1200835
lateral loadings, which is why the L-form wall can be simplified to a line form (Figure 3, left). To ob-tain the pushover curve, a horizontal force was applied to the wall top and incremented until the wall failed (post-peak).
In building construction, RE walls bear vertical stresses that come from the horizontal elements: The floors or roof (dead loads + live loads). The values of these loads in case of an earthquake will be presented in detail in the next section. Here, to assess the influence of the vertical stresses on the wall’s behavior, three cases of uniform vertical stress on the wall top were simulated: 0, 0.04, and 0.1 MPa. The results are presented in Figure 3, right. It is logical that as the vertical stress increases, the shear performance of the wall increases. However, in a building, when a wall has greater vertical stress due to the horizontal elements (floors, roof), it must also bear a greater mass due to these ele-ments. Therefore, from the earthquake engineering point of view, a wall bearing high vertical loads may be an unfavorable wall.
Figure 4. Plan of vertical studied houses.
6 m 6 m
6 m
2.5
m
Ext
erna
l RE
wal
l
Inte
rnal
RE
wal
l
Light infill panels
Figure 3. Discrete element model (left); load–displacement curves of the wall with different vertical stresses (right).
Table 3. Comparison of frequencies obtained by DEM and by measurementsModes fmodel (Hz) fmeasured (Hz) fmodel/fmeasured
1 10.8 10.8 1.00
2 17.3 18.2 0.95
3 23.1 24.0 0.96
4 36.8 36.5 1.01

Page 7 of 12
Bui et al., Cogent Engineering (2016), 3: 1200835http://dx.doi.org/10.1080/23311916.2016.1200835
4.3. Seismic capacityBecause the seismic performance of a RE wall depends on both the vertical stress (favorable role) and the corresponding mass (unfavorable role), several cases should be investigated: Interior or exterior walls; one story, two stories or more; and the value of the loads from the horizontal ele-ments (floor, roof), which depend on the dimensions of these elements between the bearing walls (influenced zones). For a general assessment of the seismic performance of the RE buildings in France (and Europe), three virtual RE buildings are considered:
• Only one story and all bearing walls are in RE (this is the case of the measured house).
• Two stories in RE walls and all bearing walls are in RE.
• First story with all bearing walls in RE and second story in a wooden structure.
The floor (or roof) space between bearing walls measures 6 m × 6 m, but the wall length is always 2.5 m, like the real house studied. The vertical elements between the walls and on the facades are light elements (wooden and glass infill). In general, the bearing RE walls have lengths greater than or equal to 2.5 m, so the length chosen also tends toward a greater safety. The wall height is 2.7 m, the same as the house studied.
In a seismic design, in addition to the earthquake load, other loads should also be taken into ac-count; they are given according to Eurocode 8:
where Ψ2i = 0.3; φ = 1 for the roof and 0.5 for the floors (for residential, office, and commercial buildings).
In this paper, only residential buildings are studied; therefore, according to Eurocode 1, the live loads composed of an exploitation load of 1.5 kN/m2 and the light partitions of 0.5 kN/m2. The usual self weight of the wooden floor was g = 1.1 kN/m2. The synthesis of the mass and vertical stress due to the loads on the floors and roofs is given in Table 4.
Pushover simulations were performed in the DEM model for each wall to obtain the capacity curves. Then the demand spectrum was constructed for important class II (current buildings) and the soil type A under the building (Figure 5). Soil type A corresponds to rock or a very good soil (mean velocity of the shear waves vs,30 > 800 m/s). Indeed, RE buildings in France are usually constructed on soil A or B. Soil type B will be discussed below.
From the capacity curves and the demand spectra, the intersection target points can be deter-mined for each case (wall type and seismicity zone). Then the inter-story drift can also be determined:
(4)∑
Dead load + � ⋅ Ψ2i ⋅
∑
Live load
(5)Inter-storey drift = target displacement∕storey height
Table 4. Added vertical stresses and masses due to the loads on the floors and roofsBuilding type Wall Added vertical stress (MPa) Added mass (ton)One story in RE Exterior wall 0.025 9.8
Interior wall 0.05 12.9
Two stories in RE Exterior wall 0.04 18.5
Interior wall 0.08 23.6
First RE + second wood Exterior wall 0.04 12.0
Interior wall 0.08 17.0

Page 8 of 12
Bui et al., Cogent Engineering (2016), 3: 1200835http://dx.doi.org/10.1080/23311916.2016.1200835
The inter-story drift values determined are presented in Table 5.
To assess the seismic performance of the walls studied, a criterion must be chosen. For inter-story drift, Calvi (1999) proposed three damage limit states (LS) for masonry structures (Figure 6):
• LS2-Minor structural damage and/or moderate nonstructural damage; the building can be uti-lized after the earthquake, without any need for significant strengthening and repair to struc-tural elements. The suggested drift limit is 0.1%.
• LS3-Significant structural damage and extensive nonstructural damage. The building cannot be used after the earthquake without significant repair. Still, repair and strengthening are feasible. The suggested drift limit is 0.3%.
• LS4-Collapse; repairing the building is neither possible nor economically reasonable. The struc-ture will have to be demolished after the earthquake. Beyond this, LS global collapse with dan-ger for human life has to be expected. The suggested drift limit is 0.5%.
Table 5. Damage assessment (with Inter-story drift, %) for soil ASeismicity zone
Wall alone
One story RE First RE + Second wood
Two stories RE
Ext. wall Int. wall Ext. wall Int. wall Ext. wall Int. wallVery low Slight
(0.009)Slight (0.013)
Slight (0.012)
Slight (0.013)
Slight (0.037)
Slight (0.023)
Slight (0.031)
Low Slight (0.011)
Slight (0.016)
Slight (0.022)
Slight (0.023)
Slight (0.074)
Slight (0.033)
Slight (0.065)
Moderate Slight (0.018)
Slight (0.027)
Slight (0.044)
Slight (0.038)
Slight (0.088)
Moderate (0.111)
Moderate (0.125)
Medium Slight (0.062)
Moderate (0.101)
Moderate (0.147)
Moderate (0.108)
Moderate (0.185)
Moderate (0.202)
Moderate (0.227)
Strong Complete (∞)
Complete (∞)
Complete (∞)
Complete (∞)
Complete (∞)
Complete (∞)
Complete (∞)
Figure 5. Capacity curves and demand spectra of different seismicity zones, for soil A.

Page 9 of 12
Bui et al., Cogent Engineering (2016), 3: 1200835http://dx.doi.org/10.1080/23311916.2016.1200835
Following the above description, it is suggested that depending on the seismic demand, if a build-ing has a behavior that does not exceed LS3, it can be considered satisfactory. Using the above cri-teria, the damage states of the wall studied for each corresponding seismicity zone can be determined and are presented in Table 5. It can be observed that except for the strong seismicity zones, RE buildings on an A-type soil can present satisfactory seismic performance.
Following the well-known equation (2) in the dynamic of structures (Sa = ω2 Sd), the initial slope of the capacity curve corresponds to ω2 (with ω = 2πf). That is why from this curve, the frequency f can be determined; the result is presented in Figure 7, noted “fnumerical”. On this figure, h is the height of the structure. From this figure, it is interesting to note that the obtained inelastic frequencies have the same order of magnitude as the frequency obtained using other approaches: Empirical formula (Eurocode 8), noted “f1_EC8”; analytical with shear beam theory (Bui et al., 2011), noted “f1_shear beam”; and in situ measurement (Bui et al., 2011), noted “fexperimental”. This confirms the relevancy of the mod-els used. It is logical that the inelastic frequencies have values slightly lower than the elastic fre-quency values, except the case of first story in RE and the second story in wooden structure. The reason may be that this mixed structure does not follow the relationships established for the current structures (one material for all walls).
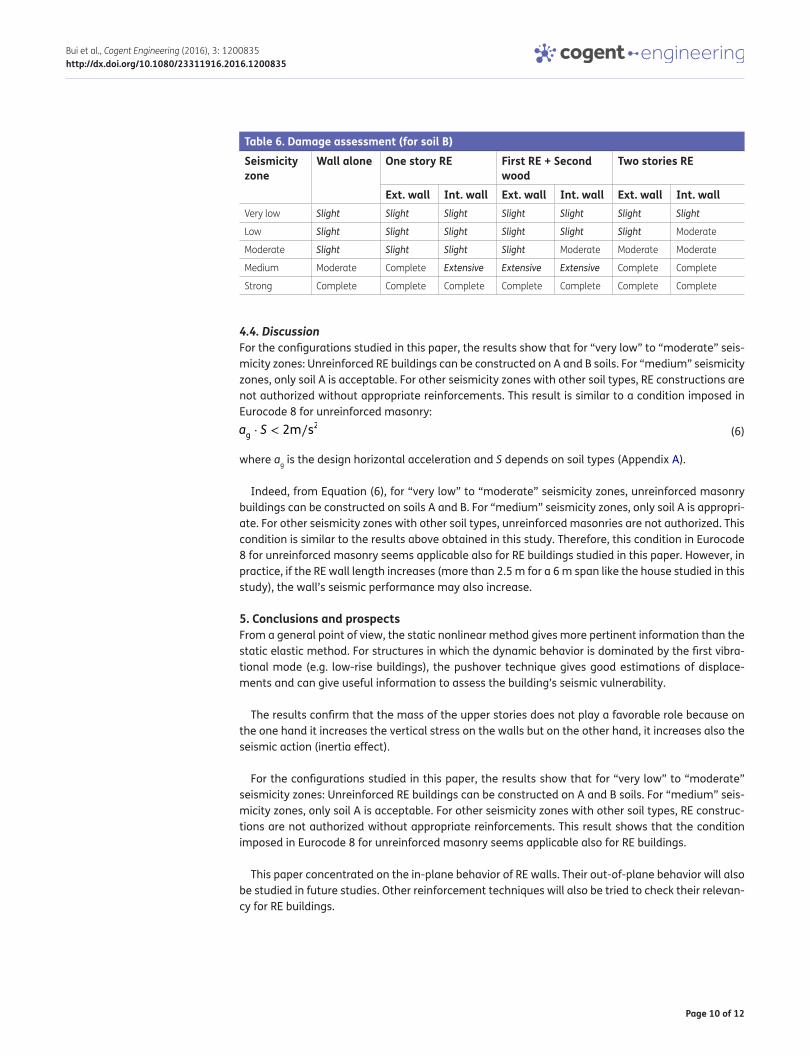
In the same procedure, RE buildings on a B-type soil were also assessed. The B-type soil following Eurocode 8 corresponds to good soil (shear wave velocity vs,30 = 360–800 m/s). The results are pre-sented in Table 6.
It can be observed that for soil B, without special reinforcement, RE buildings in the investigated configuration do not seem adapted for medium and strong seismicity zones.
Figure 7. First frequencies obtained from different approaches: empirical (EC8), analytical (shear beam), experimental and numerical.
0
2
4
6
8
10
12
14
16
0 5 10 15
f1 (H
z)
h (m)
f1_EC8
f1_shear beam
f_experimental
f_numerical
Figure 6. Performance levels on the pushover curve, according to Calvi (1999).
Page 10 of 12
Bui et al., Cogent Engineering (2016), 3: 1200835http://dx.doi.org/10.1080/23311916.2016.1200835
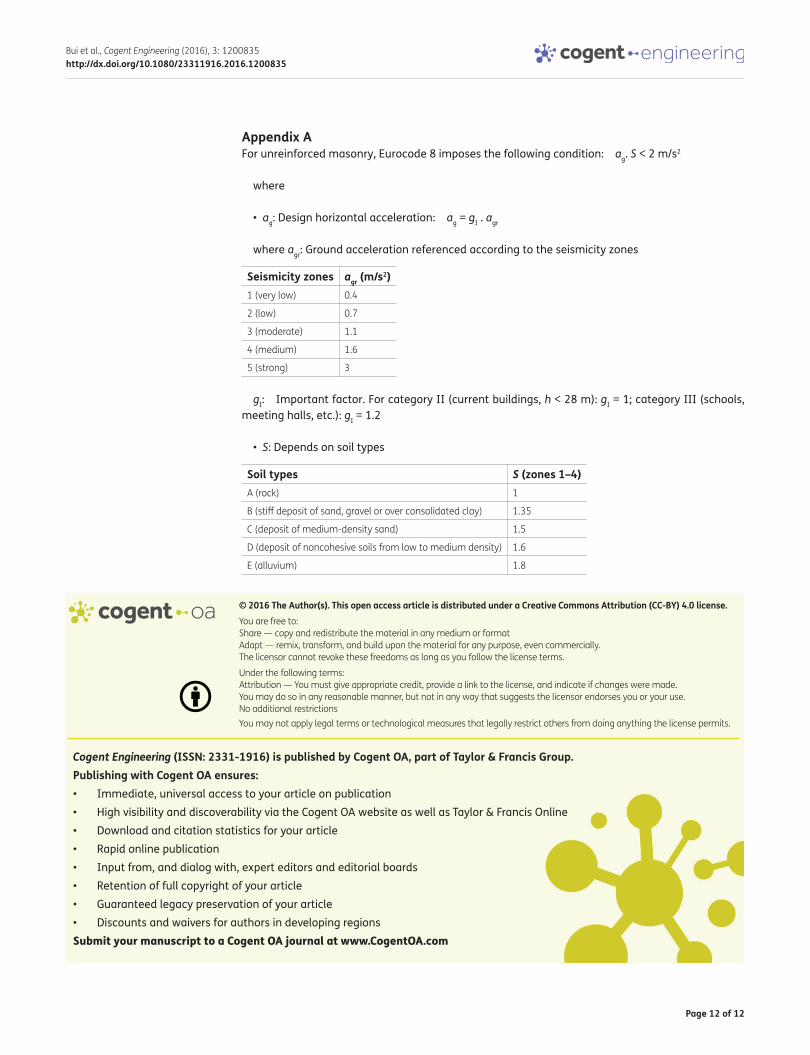
4.4. DiscussionFor the configurations studied in this paper, the results show that for “very low” to “moderate” seis-micity zones: Unreinforced RE buildings can be constructed on A and B soils. For “medium” seismicity zones, only soil A is acceptable. For other seismicity zones with other soil types, RE constructions are not authorized without appropriate reinforcements. This result is similar to a condition imposed in Eurocode 8 for unreinforced masonry:
where ag is the design horizontal acceleration and S depends on soil types (Appendix A).
Indeed, from Equation (6), for “very low” to “moderate” seismicity zones, unreinforced masonry buildings can be constructed on soils A and B. For “medium” seismicity zones, only soil A is appropri-ate. For other seismicity zones with other soil types, unreinforced masonries are not authorized. This condition is similar to the results above obtained in this study. Therefore, this condition in Eurocode 8 for unreinforced masonry seems applicable also for RE buildings studied in this paper. However, in practice, if the RE wall length increases (more than 2.5 m for a 6 m span like the house studied in this study), the wall’s seismic performance may also increase.
5. Conclusions and prospectsFrom a general point of view, the static nonlinear method gives more pertinent information than the static elastic method. For structures in which the dynamic behavior is dominated by the first vibra-tional mode (e.g. low-rise buildings), the pushover technique gives good estimations of displace-ments and can give useful information to assess the building’s seismic vulnerability.
The results confirm that the mass of the upper stories does not play a favorable role because on the one hand it increases the vertical stress on the walls but on the other hand, it increases also the seismic action (inertia effect).
For the configurations studied in this paper, the results show that for “very low” to “moderate” seismicity zones: Unreinforced RE buildings can be constructed on A and B soils. For “medium” seis-micity zones, only soil A is acceptable. For other seismicity zones with other soil types, RE construc-tions are not authorized without appropriate reinforcements. This result shows that the condition imposed in Eurocode 8 for unreinforced masonry seems applicable also for RE buildings.
This paper concentrated on the in-plane behavior of RE walls. Their out-of-plane behavior will also be studied in future studies. Other reinforcement techniques will also be tried to check their relevan-cy for RE buildings.
(6)ag ⋅ S < 2m∕s2
Table 6. Damage assessment (for soil B)Seismicity zone
Wall alone One story RE First RE + Second wood
Two stories RE
Ext. wall Int. wall Ext. wall Int. wall Ext. wall Int. wallVery low Slight Slight Slight Slight Slight Slight Slight
Low Slight Slight Slight Slight Slight Slight Moderate
Moderate Slight Slight Slight Slight Moderate Moderate Moderate
Medium Moderate Complete Extensive Extensive Extensive Complete Complete
Strong Complete Complete Complete Complete Complete Complete Complete

Page 11 of 12
Bui et al., Cogent Engineering (2016), 3: 1200835http://dx.doi.org/10.1080/23311916.2016.1200835
FundingThe authors wish to thank the French National Research Agency (ANR) for the funding of the PRIMATERRE project [project number ANR-12-Villes et Bâtiments Durables]. The Indo French Centre for the Promotion of Advanced Research (CEFIPRA) is also warmly thanked for its support.
Author detailsQuoc-Bao Bui1
E-mail: [email protected] Bui2
E-mail: [email protected] Liman2
E-mail: [email protected] University Savoie Mont Blanc, LOCIE, CNRS, POLYTECH
Annecy-Chambéry, Chambery 73000, France.2 University of Lyon, LGCIE, INSA Lyon, 69621 Villeurbanne
Cedex, France.
Citation informationCite this article as: Assessing the seismic performance of rammed earth walls by using discrete elements, Quoc-Bao Bui, Tan-Trung Bui & Ali Liman, Cogent Engineering (2016), 3: 1200835.
ReferencesBui, Q. B., & Morel, J. C. (2009). Assessing the anisotropy of
rammed earth. Construction and Building Materials, 23, 3005–3011. http://dx.doi.org/10.1016/j.conbuildmat.2009.04.011
Bui, Q. B., Morel, J. C., Hans, S., & Meunier, N. (2009). Compression behaviour of non-industrial materials in civil engineering by three scale experiments: The case of rammed earth. Materials and Structures, 42, 1101–1116. http://dx.doi.org/10.1617/s11527-008-9446-y
Bui, Q. B., Morel, J. C., Reddy, B. V. V., & Ghayad, W. (2009). Durability of rammed earth walls exposed for 20 years to natural weathering. Building and Environment, 44, 912–919. http://dx.doi.org/10.1016/j.buildenv.2008.07.001
Bui, Q. B., Hans, S., Morel, J.-C., & Do, A.-P. (2011). First exploratory study on dynamic characteristics of rammed earth buildings, Engineering Structures, 33, 3690–3695. http://dx.doi.org/10.1016/j.engstruct.2011.08.004
Bui, T. T., Bui, Q. B., Limam, A., & Maximilien, S. (2014). Failure of rammed earth walls: From observations to quantifications. Construction and Building Materials, 51, 295–302. http://dx.doi.org/10.1016/j.conbuildmat.2013.10.053
Bui, T. T., Limam, A., & Bui, Q. B. (2014). Characterization of vibration and damage in masonry structures: Experimental and numerical analysis. European Journal of Environmental and Civil Engineering, 18, 1118–1129.
Bui, Q. B., Morel, J. C., Hans, S., & Walker, P. (2014). Effect of moisture content on the mechanical characteristics of rammed earth. Construction and Building Materials, 54, 163–169. http://dx.doi.org/10.1016/j.conbuildmat.2013.12.067
Bui, T. T., Bui, Q. B., Limam, A., & Morel, J. C. (2015). Modeling rammed earth wall using discrete element method. Continuum Mechanics and Thermodynamics, 28, 523–538.
Calvi, G. M. (1999). A displacement-based approach for vulnerability evaluation of classes of buildings. Journal on Earthquake Engineering, 3, 411–438.
Cheah, J. S. J., Walker, P., Heath, A., & Morgan, T. K. K. B. (2012). Evaluating shear test methods for stabilised rammed earth. Proceedings of the ICE – Construction Materials, 165, 325–334. http://dx.doi.org/10.1680/coma.10.00061
Chopra, A. K., & Goel, R. K. (2002). A modal pushover analysis procedure for estimating seismic demands for buildings. Earthquake Engineering & Structural Dynamics, 31, 561–582.
Ciancio, D., & Augarde, C. (2013). Capacity of unreinforced rammed earth walls subject to lateral wind force: Elastic analysis versus ultimate strength analysis. Materials and Structures, 46, 1569–1585. http://dx.doi.org/10.1617/s11527-012-9998-8
Cundall, P. A. (1971). A computer model for simulating progressive, large scale movements in blocky rock systems. Proceeding of International Symposium Rock Fracture, ISRM, Nancy, 1, 2–8.
El Nabouche, R., Bui, Q. B., Perrotin, P., Plé, O., Plassiard, J.-P. (2015, June 21–24). Numerical modeling of rammed earth constructions: Analysis and recommendations. In 1st International Conference on Bio-based Building Materials, Clermont Ferrand.
EN 1998-1:2004. (2004). Design of structures for earthquake resistance–part 1 (157 p.). European Committee for Standardization, Brussels.
Gomes, M. I., Lopes, M., & de Brito, J. (2011). Seismic resistance of earth construction in Portugal. Engineering Structures, 33, 932–941. http://dx.doi.org/10.1016/j.engstruct.2010.12.014
Hamilton, III, H. R., McBride, J., & Grill, J. (2006). Cyclic testing of rammed-earth walls containing post-tensioned reinforcement. Earthquake Spectra, 22, 937–959. http://dx.doi.org/10.1193/1.2358382
Itasca. (2011). 3DEC–three dimensional distinct element code, version 4.1. Minneapolis, MN: Author.
Lourenço, P. B., Oliveira, D. V., Roca, P., & Orduña, A. (2005). Dry joint stone masonry walls subjected to in-plane combined loading. Journal of Structural Engineering, 131, 1665–1673. http://dx.doi.org/10.1061/(ASCE)0733-9445(2005)131:11(1665)
Miccoli, L., Müller, U., & Fontana, P. (2014). Mechanical behaviour of earthen materials: A comparison between earth block masonry, rammed earth and cob. Construction and Building Materials, 61, 327–339. http://dx.doi.org/10.1016/j.conbuildmat.2014.03.009
Miccoli, L., Oliveira, D. V., Silva, R. A., Muller, U., & Schueremans, L. (October, 2015, September). Static behaviour of rammed earth: Experimental testing and finite element modeling. Materials and Structures, 48, 3443–3456.
Morris, H., & Walker, R. (2011). Observations of the performance of earth buildings following the February 2011 Christchurch earthquake. Bulletin of the New Zealand Society for Earthquake Engineering, 44, 358–367.
Salvitti, L. M., & Elnashai, A. S. (1996). Evaluation of bahaviour factors for RC buildings by nonlinear dynamic analysis (Paper No. 1820). 11th World Conference on Earthquake Engineering. Elsevier, Acapulco, Mexico. ISBN: 0 08 042822 3.
Silva, R. A., Oliveira, D. V., Miranda, T., Cristelo, N., Escobar, M. C., & Soares, E. (2013). Rammed earth construction with granitic residual soils: The case study of northern Portugal. Construction and Building Materials, 47, 181–191.
Page 12 of 12
Bui et al., Cogent Engineering (2016), 3: 1200835http://dx.doi.org/10.1080/23311916.2016.1200835
© 2016 The Author(s). This open access article is distributed under a Creative Commons Attribution (CC-BY) 4.0 license.You are free to: Share — copy and redistribute the material in any medium or format Adapt — remix, transform, and build upon the material for any purpose, even commercially.The licensor cannot revoke these freedoms as long as you follow the license terms.
Under the following terms:Attribution — You must give appropriate credit, provide a link to the license, and indicate if changes were made. You may do so in any reasonable manner, but not in any way that suggests the licensor endorses you or your use. No additional restrictions You may not apply legal terms or technological measures that legally restrict others from doing anything the license permits.
Cogent Engineering (ISSN: 2331-1916) is published by Cogent OA, part of Taylor & Francis Group. Publishing with Cogent OA ensures:• Immediate, universal access to your article on publication• High visibility and discoverability via the Cogent OA website as well as Taylor & Francis Online• Download and citation statistics for your article• Rapid online publication• Input from, and dialog with, expert editors and editorial boards• Retention of full copyright of your article• Guaranteed legacy preservation of your article• Discounts and waivers for authors in developing regionsSubmit your manuscript to a Cogent OA journal at www.CogentOA.com
Appendix AFor unreinforced masonry, Eurocode 8 imposes the following condition: ag. S < 2 m/s2
where
• ag: Design horizontal acceleration: ag = gI . agr
where agr: Ground acceleration referenced according to the seismicity zones
Seismicity zones agr (m/s2)1 (very low) 0.4
2 (low) 0.7
3 (moderate) 1.1
4 (medium) 1.6
5 (strong) 3
gI: Important factor. For category II (current buildings, h < 28 m): gI = 1; category III (schools, meeting halls, etc.): gI = 1.2
• S: Depends on soil types
Soil types S (zones 1–4)A (rock) 1
B (stiff deposit of sand, gravel or over consolidated clay) 1.35
C (deposit of medium-density sand) 1.5
D (deposit of noncohesive soils from low to medium density) 1.6
E (alluvium) 1.8