assessing tsunami hazard along the new … hazard reports/assessing tsun… · assessing tsunami...
TRANSCRIPT

ASSESSING TSUNAMI HAZARD ALONG THE NEW ZEALAND COAST
Roy A. Walters
National Institute of Water & Atmospheric Research Ltd. PO Box 8602
Christchurch, New Zealand [email protected]
James Goff
GeoEnvironmental Consultants 11 The Terrace Governors Bay
Lyttleton RD1, New Zealand [email protected]
ABSTRACT
An assessment is made for tsunami hazards along the New Zealand coast by searching for long-wave resonances for the range of periods spanned by tsunami and short-period storm surges. To accomplish this, a high-resolution model of the southwest Pacific is used to simulate the effects of these waves in an oceanic domain extending over 40° in latitude and 50° in longitude. This paper describes the results of such a simulation for waves with a period in the range of 15 to 300 minutes. The locations where wave resonances occur are compared with historical and geological evidence in order to evaluate the concurrence of the locations. A search of geological data was undertaken, and the results of palaeotsunami studies were compared with model predictions to determine the general utility of using resonance patterns to assess tsunami hazards.
Science of Tsunami Hazards, Volume 21, Number 3, Page 137 (2003)
Introduction
Tsunami and storm-surge events have occurred relatively frequently along the coast of New Zealand in historic times (de Lange & Fraser 1999; de Lange in press). Both are temporary oscillations of sea level with periods longer than wind waves and shorter than tides for tsunami, and shorter than a few days for storm surge. They can cause coastal flooding, erosion, and loss of life in extreme events, and therefore can be significant coastal hazards. In the prehistoric record the resolution of events is not as detailed, although large coastal inundations, or Catastrophic Saltwater Inundations (CSI), have been identified (e.g. Goff et al., 2000). In the case of tsunami and possibly storm-surge events, it is estimated that wave runup in excess of about 5m are needed to leave a “recognisable” deposit (Lowe and de Lange, 2000). Relating these events to inundation by either tsunami or storm surge often requires detailed examination, but this type of data can prove to be extremely useful for comparing with and complementing hydrodynamic models (Goff et al., 2001a).
Tsunami can be classified by the distance from their source to the area of impact; i.e., local and remote tsunami. Locally generated tsunami have short warning times and relatively short wave periods; remote tsunami have longer warning times and relatively long periods. Typical periods for tsunami range from 15 minutes for locally generated tsunami to several hours for remote tsunami. Typical runup height for tsunami range up to 15 m at the coast, although most are much smaller. Storm surges on the other hand are caused by variations in barometric pressure and wind stress over the ocean. Decreasing barometric pressure causes an inverse barometer effect where sea level rises. This is usually a slow and large-scale effect and thus does not usually generate waves in the frequency range typical of tsunami. However, there can be short-period meteorological events (such as meteorological tsunami – rissaga) with time-scales of a few hours that may be important (de Lange, in press). Wind stress on the other hand has a wide range of time-scales and causes coastal sea-level setup as well as wind waves, where the setup depends on the wind direction, strength, and wave height. Storm surge periods range from several hours to several days. Typical heights for storm surge alone range up to 1.0 m along the coast of New Zealand, although most are usually less than 0.5 m (Bell et al., 2000). Wind waves, on the other hand, can be quite large, producing wave setup and wave runup of several meters in height.
In the end, the runup of tsunami and storm-generated waves depends on the initial or incident amplitude and direction, the wave period, and how the wave interacts with the ocean and shoreline topography. Where a harbour or coastal bay resonates with a similar period to the incident wave, large amplification of incident waves can be expected. The ability to differentiate between tsunami and storm deposits is becoming increasingly significant as researchers are now able to identify CSIs that do not have a “recognisable” or visible deposit. This is being achieved through the use of techniques such as micropalaeontological and geochemical analyses (Goff et al., 2001b). The increasing ability to identify smaller events means that it is more likely that it will be necessary to effectively differentiate between tsunami and storms. This becomes important when resonance modelling identifies areas of coastline susceptible to both tsunami and storm inundation.
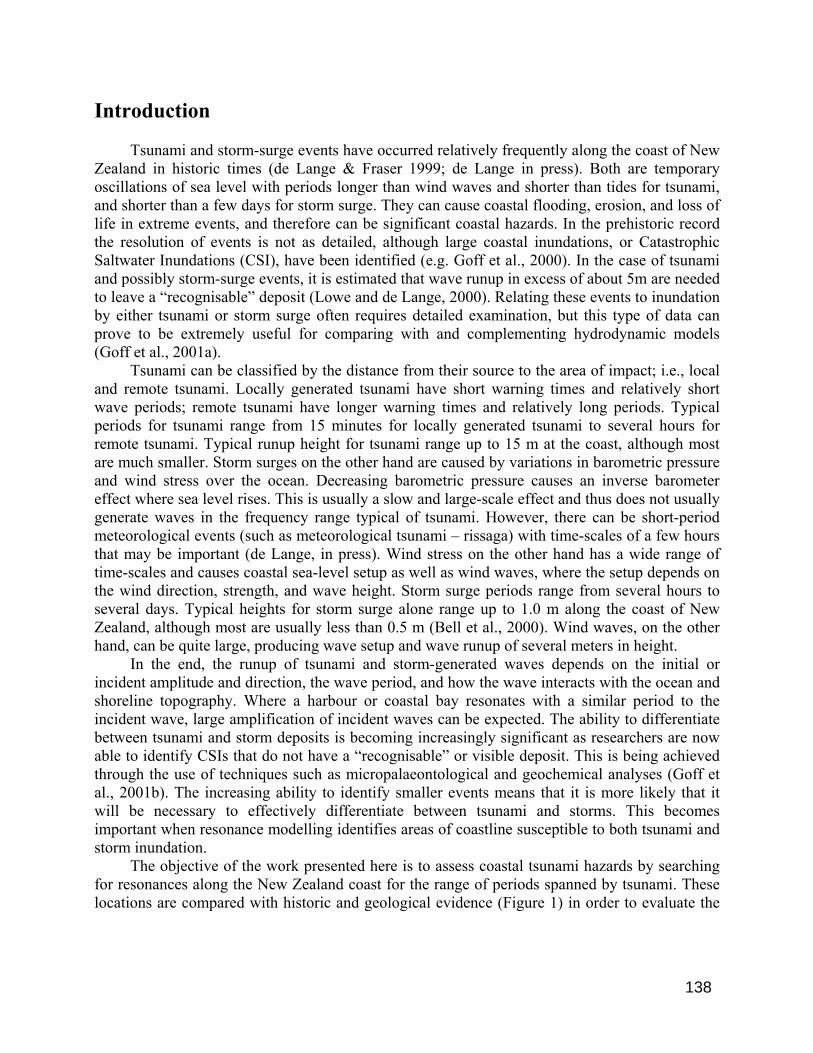
The objective of the work presented here is to assess coastal tsunami hazards by searching for resonances along the New Zealand coast for the range of periods spanned by tsunami. These locations are compared with historic and geological evidence (Figure 1) in order to evaluate the
138
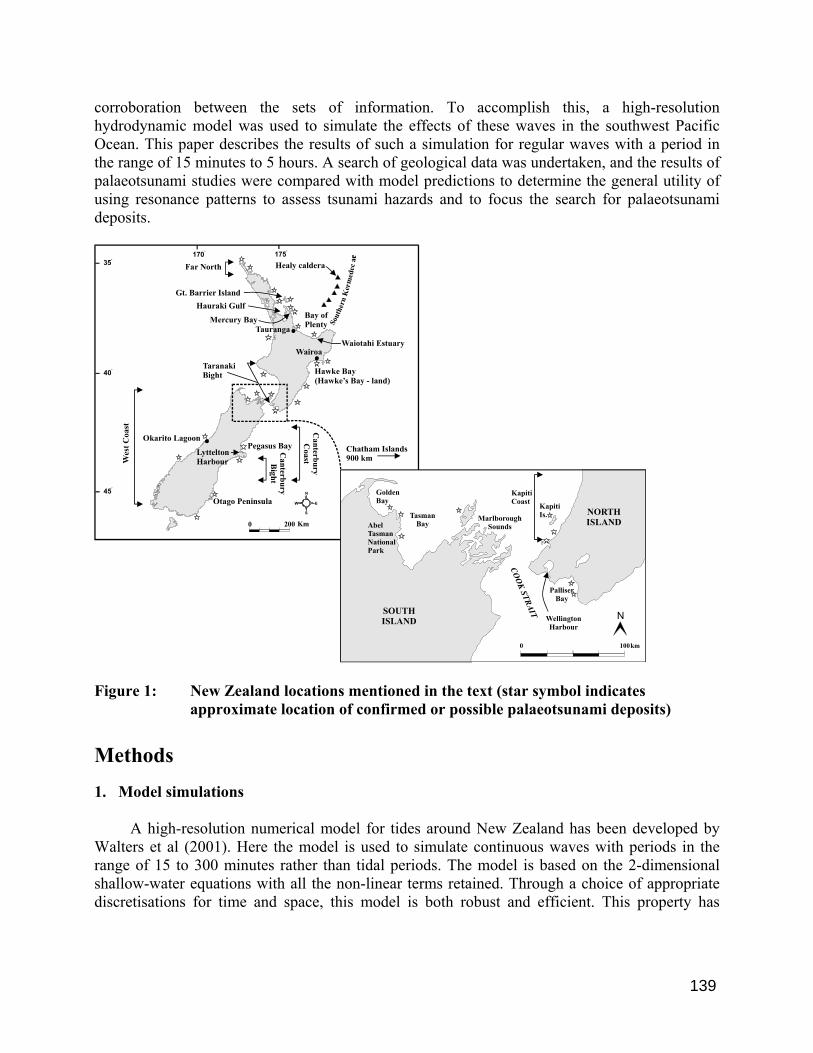
corroboration between the sets of information. To accomplish this, a high-resolution hydrodynamic model was used to simulate the effects of these waves in the southwest Pacific Ocean. This paper describes the results of such a simulation for regular waves with a period in the range of 15 minutes to 5 hours. A search of geological data was undertaken, and the results of palaeotsunami studies were compared with model predictions to determine the general utility of using resonance patterns to assess tsunami hazards and to focus the search for palaeotsunami deposits.
TaranakiBight
Canterbury
Bight
Canterbury
CoastW
est C
oast
Okarito Lagoon
LytteltonHarbour
Otago Peninsula
Pegasus Bay
Wairoa
Tauranga
Chatham Islands900 km
Bay ofPlenty
Gt. Barrier IslandHauraki Gulf
Mercury Bay
Waiotahi Estuary
Hawke Bay(Hawke’s Bay - land)
Far North Healy caldera
Sout
hern
Ker
med
ec a
rc
W
N
E
S
0 200 Km
175o
170o
35o
45o
40o
PalliserBay
WellingtonHarbour
0 100km
NORTHISLAND
SOUTHISLAND
COO
K STRAIT
KapitiIs.
KapitiCoast
MarlboroughSoundsAbel
TasmanNationalPark
GoldenBay
TasmanBay
N
Figure 1: New Zealand locations mentioned in the text (star symbol indicates
approximate location of confirmed or possible palaeotsunami deposits) Methods 1. Model simulations
A high-resolution numerical model for tides around New Zealand has been developed by Walters et al (2001). Here the model is used to simulate continuous waves with periods in the range of 15 to 300 minutes rather than tidal periods. The model is based on the 2-dimensional shallow-water equations with all the non-linear terms retained. Through a choice of appropriate discretisations for time and space, this model is both robust and efficient. This property has
139

allowed calculations using a high-resolution grid and allowed considerable sensitivity testing. Details about the development of the numerical model were given by Walters (1987, 1992) and will not be repeated here. A summary of the model formulation is as follows. The numerical model is based on the 2-dimensional shallow water equations, where the
Boussinesq and hydrostatic approximations are used. The resulting equations have sea level and depth-averaged velocity as the dependent variables.
The dependent variables are expressed in terms of a harmonic expansion of constituents of
various frequencies. Non-linear terms are expressed as simple frequency sums and differences for the advection and wave drift-terms, and by a series expansion for the bottom friction term. The expansion of the quadratic bottom friction term is a generalised expansion that does not depend on a dominant frequency. In this paper, a single wave frequency is used and the higher harmonics generated are ignored.
After harmonic decomposition, the governing equations are expressed in the form of a
continuity equation and a horizontal momentum equation. For a number of reasons relating to accuracy, stability, and efficiency, the continuity equation is written as an equation of the Helmholz type. This equation formulation has the advantage that the solution for sea level and the solution for velocity are not coupled, which increases computational efficiency. In practice, a matrix equation for sea level is solved first, followed by a point-wise solution for velocity that uses these sea level values.
The spatial part of the governing equations is discretised using finite element methods. The
boundary conditions are zero normal flow at land boundaries (a natural boundary condition of the finite element formulation), incident wave amplitude and phase specified along one side of the open ocean boundary, and radiation conditions along all sides of the open ocean boundary. This choice allows passing a regular wave inwards through either the north, south, east, or west boundary, and allowing it to radiate out through all the boundaries. Thus the solution is not contaminated by waves artificially reflecting off the open boundaries. The results presented here are for a wave incident from the east of the New Zealand region, such as a tsunami generated on the west coast of South America.
The numerical simulations include waves with 14 different periods, ranging from 15 minutes
to 5 hours (15, 18, 24, 30, 45, 60, 75, 90, 120, 150, 180, 210, 240, and 300 minutes). The amplitude of the incident waves is specified as 0.01 m, with 0 degrees phase, along the eastern boundary. The wave periods do not interact in this study. The interactions would create harmonics at frequencies that are the sums and differences in the frequencies used here. The mechanisms generating the harmonics are the nonlinear advection, wave drift, and friction terms in the governing equations. In general, the nonlinear harmonics that are generated tend to have small amplitudes and thus are ignored in this study.
The region around New Zealand has been discretised into a finite element grid with
triangular elements using the grid generation software of Henry & Walters (1993). The grid
140

contains 32065 nodes and 59700 elements (Figure 2). The horizontal spacing between computational nodes varies from 98 km near the ocean boundaries to 300 m near the coast. The grid encompasses the area between 156.75 and 210° E, and 23.75 and 65° S. The bathymetric data were acquired from three sources: Royal New Zealand Navy Hydrographic Office, National Institute of Water and Atmospheric Research (NIWA) bathymetry archive, and Smith & Sandwell (1997).
longitude
latitude
160 170 180 190 200 210
-60
-50
-40
-30
-20
DEPTH80006000500040003000200015001000750500250100500
Figure 2: Finite element model grid, colour coded for water depth.
All the concepts above were developed based on the idea of a continuous wave train such as
that produced by the numerical model. Then how is this related to a finite wave train produced during a storm or tsunami event? Typically, these events produce from a few to ten or so waves that interact when they approach the shoreline. Thus the wave patterns that are noted in the continuous simulations and are far from the coast would probably not be observed for finite length events because the wave train would not interact with itself over such large distance.
141

However, near the coast these patterns would appear as a transient feature as the wave train passed. Therefore the analysis with a continuous wave field provides an efficient way to explore for resonances. This approach is consistent with our experiences in using both the time-stepping and harmonic models. Areas of special interest can be examined in more detailed work with transient models. 2. Geological Record
A definitive identification of a palaeotsunami deposit hinges on the recognition of as many diagnostic characteristics as possible (Table 1). However, it is still important to understand the context or palaeoenvironmental conditions at the time of deposition (e.g. Witter et al., 2001) and to be able to identify a probable tsunami source if possible. Even a standard conception that a palaeotsunami deposit represents ‘a deposit out of place’ (e.g. a sand layer sandwiched between peat) must be treated with caution since this visible identification is dependent upon the nature of both the material available for entrainment and the depositional environment. Therefore, perhaps counter-intuitively, a mud layer in sand can represent a palaeotsunami (or palaeostorm) deposit (Goff and Chagué-Goff, 1999). The absence of some diagnostic characteristics does not negate a palaeotsunami interpretation, but rather it can be indicative of the particular context. For example, the absence of buried soil or vascular plants might mean that either the underlying material was devoid of vegetation, or that the nature of inundation removed the material prior to deposition of ‘clean’ sediment. Hence it is useful to understand palaeoenvironmental conditions at the time of deposition. In general terms, if the study site was relatively exposed to the sea it is possible that the last inundation removed evidence of earlier events and also has a limited number of potential diagnostic characteristics. A more sheltered, low energy coastal wetland would be more likely to preserve evidence of multiple inundations and have more diagnostic characteristics (Goff et al., 2001b).
The New Zealand palaeotsunami record currently consists of “recognisable” deposits laid down by waves running up probably 5.0 m or higher above mean sea level (Lowe and de Lange, 2000). However, in most cases it is possible to differentiate between relative event magnitudes based upon the palaeogeomorphology of the setting, at least in the broad categories of ‘>5.0-10.0 m (large)’ and ‘>10.0 m (extreme)’ (Goff et al., 2001a). The latter category should be considered a catch-all for events greater than 10.0 m. In New Zealand the record of these extreme events ranges in height up to at least 32.0 metres above mean sea level (Nichol et al., 2002), although this should not be considered a maximum. The New Zealand record is far from complete and will continue to grow as more sites are studied and more and better analytical techniques are developed. However, there is sufficient information available now to undertake a national comparison between model results and geological data. Results and Discussion
It is important to recall that the coastal effect of a tsunami depends on both the source characteristics and the coastal response characteristics. For remote tsunami, maximum amplitudes
142

and spectral content of the waves are more or less known from historic data. This information combined with admittance information derived from the response patterns leads to reasonable estimation of effects. For local tsunami, the situation is very different. In particular, the source characteristics are not well defined along the New Zealand coast. Hence, resonance patterns may be indicative of a tsunami hazard but the lack of a source makes the issue moot. On the other hand, a large local source can make the resonance analysis of little predictive value and a localisd transient model would be more appropriate.
In presenting the results, we will start with a general overview of the resonance characteristics of the east coast of New Zealand. We then place these patterns in the context of historic data, and show generally good correspondence between resonance patterns and observations. Then we subdivide the coastline further and consider the relation between the resonance patterns and palaeotsunami data.
As expected, resonance patterns show an increase in wavelength with increasing period of the incident waves. Then as the wavelength changes, the coastal response changes in predictable ways (Walters, 2002). For the simulations presented here, the wave propagates in from the eastern boundary and is allowed to radiate out through all the boundaries. An examination of the results for the entire grid shows that the radiation conditions are effective in that little outgoing wave energy is reflected back into the modelled area, as expected in reality. The wave refracts around the north and south ends of New Zealand and propagates through Cook Strait. Thus this one scenario yields resonance characteristics for everywhere except the west coast of both North and South Island.
In these results, the pattern of amplitudes is of primary importance, not the exact magnitudes. In essence, the spatial pattern shows the areas of large amplification of the incident wave. These areas are then potential critical locations for tsunami resonance and are therefore hazardous parts of the coast. The actual amplitude that would be observed depends upon the amplitude of the incident wave, which is in turn dependent on the details of the generation of the wave. Here, we look at the broader pattern of resonance (and by implication inundation hazard) rather than the details of individual events.
These results are displayed in an area just large enough to include all the coastline of New Zealand and Chatham Island (approximately 164 to 185° E and 31 to 51° S, Figure 3, 4, and 5). The entire model grid and underlying bathymetry for this area is shown in Figure 2. Note the extensive shelf in some areas such as the Chatham Rise to the east of South Island, as well as the narrow continental shelf in other areas such as east of North Island. When the waves incident from the ocean pass over the continental shelf, the wavelength decreases and amplitude increases.
Typical results for decreasing wave periods are shown in Figures 3, 4, and 5 (150, 60, and 24 minute periods). For areas with resonances, the sequence of figures shown in Walters (2002) gives a distinct sequence of patterns. For periods larger than the largest resonance period (fundamental frequency), there is little amplification. As the decreasing period approaches the resonance period of a particular embayment or bight, the amplitude increases to a maximum with a spatial pattern that contains a single maximum in that area. As the period decreases below the resonance, the amplitude decreases until it approaches the next resonance (first harmonic) where it again increases and shows a pattern with two maxima in the embayment. This behaviour is repeated for all the remaining harmonics in the range of wave periods used here.
143

longitude
latitude
165 170 175 180-50
-48
-46
-44
-42
-40
-38
-36
-34
-32
20181614121086420
150 minA
Figure 3: Resonance pattern for a wave with a period of 150 minutes, incident from the
eastern boundary. The amplification factor, A, is the wave amplitude at a point divided by the amplitude of the incident wave at the eastern boundary.
The spatial patterns replicate the observed patterns in historic tsunami. For instance,
consider the 1960 Chilean tsunami, one of the most extensive tsunami recorded in New Zealand (de Lange and Healy, 1986; Heath, 1976). The resonance pattern predicted by the model in Pegasus Bay and Lyttleton Harbour indicates a strong peak at around 150 minutes and the Chatham Rise tends to act as a waveguide directed at the Canterbury coast (Walters, 2002). The time-series data also show a similar amplification of the low frequency part of the spectrum in the 1960 tsunami (Heath, 1976) and in the 2001 Peru tsunami (Goring, 2002). On the other hand there is little response around the Otago Peninsula either in the model results or sea-level data. Wellington Harbour responded in terms of its dominant oscillation modes, one with a period of about 160 minutes and several with periods around 30 minutes as shown for example in Figure 5 (Heath, 1976; Abraham, 1997; Walters, 2002). The response at Tauranga (Heath, 1976) and Hawke Bay (de Lange and Healy, 1986) also follow the predicted response patterns with wave periods near the resonance peaks of 60 minutes and 150 minutes and shorter, respectively. Finally, records from Mercury Bay (unpublished data) show there was a 40 minute resonance as
144

the patterns from the model would predict. To a large degree, these resonance patterns reflect the actual response to remote tsunami. There is currently no comparable palaeotsunami dataset to that of the historic record thus making it more difficult to analyse and interpret in detail. Therefore, a brief summary of palaeotsunami work to date is given in Table 2, and this should serve as a guide to the discussions below.
longitude
latitude
165 170 175 180-50
-48
-46
-44
-42
-40
-38
-36
-34
-32
20181614121086420
60 minA
Figure 4: Resonance pattern for a wave with a period of 60 minutes, incident from the
eastern boundary. The amplification factor, A, is the wave amplitude at a point divided by the amplitude of the incident wave at the eastern boundary.
Analysis of geological research carried out to date indicates that there have been several large palaeotsunami (probable wave heights of 5-15 m) dating back to about 6300 years BP (Goff et al., 2001b; Goff and McFadgen, 2002). The full areal extent of these is still unclear, but of particular interest are the more recent ones of approximately 200AD, 1220AD and 1450AD. The first coincides with the Taupo eruption (Lowe and de Lange, 2000) and the last two with several large, local fault ruptures (Goff et al., 2000). Furthermore, in 1450AD, many prehistoric Maori
145

coastal settlements around the country were inundated and subsequently abandoned (Goff and McFadgen, 2002). These prehistoric coastal settlements serve as a guide for local inundation heights and potential resonances. The return period for these large, locally-generated palaeotsunami is believed to be about once every 500 years (Goff and Chagué-Goff, 2001; Goff et al, 2001b). It is believed that all of these earlier palaeotsunami deposits are from local tsunami sources so that it is best to compare the geological data with resonance patterns with relatively short wave period. With this in mind we have chosen the 60-minute nationwide pattern and 24- minute Cook Strait region pattern as a focus (Figures 4 and 5).
longitude
latitude
173 174 175-42
-41.5
-41
-40.5
-40
-39.5 20181614121086420
24 minA
Figure 5: Resonance pattern in the Cook Strait region for a wave with a period of 24
minutes, incident from the eastern boundary. Looking along the length of the east coast there appears to be considerable agreement between the location of palaeotsunami deposits and resonance patterns (Figures 1, 4, and 5). Of particular note are deposits reported from the Far North, the east coast of Great Barrier Island, Wairoa, Palliser Bay (two sites on the northern and eastern sides), Kapiti Island, Abel Tasman National Park, Pegasus Bay, and the Canterbury Bight. These have all been studied in some degree of detail. Other locations along the east coast where possible palaeotsunami deposits have
146

been recorded, but not fully investigated, include sites on the mainland coast just north of Great Barrier Island, in the Bay of Plenty (Tauranga and Waiotahi Estuary), western Marlborough Sounds, and south of the Canterbury Bight. Several other confirmed or possible palaeotsunami deposits have been reported from other parts of the country, such as Okarito Lagoon and the Taranaki Bight on the west coast. While these are not the focus of this paper it is worth noting that all the locations shown in Figure 1 correspond to areas with short-period resonances (Walters, 2002).
The correspondence between short-period resonances and palaeotsunami deposits seems to point towards the possibility that all the deposits found so far in New Zealand are probably from events with a local source. However, as mentioned above, the 1960 Chilean tsunami had strong resonance patterns in Pegasus Bay, Tauranga, Hawke Bay and the western Bay of Plenty (Mercury Bay). Therefore, distant sources cannot be completely discounted, and indeed, at 150 minutes there are general resonances in many of the areas where palaeotsunami deposits have been found such as Hawke Bay, Taranaki Bight, Marlborough Sounds, Pegasus Bay, and the Canterbury Bight.
Distantly-generated tsunami show no resonance at 150 minutes in the northern part of the North Island except in the Hauraki Gulf (Figure 3). There are numerous resonances at shorter wave periods that might also be correlated with distantly-generated tsunami, although the nature and extent of the palaeotsunami deposits found in this region (from the Far North to the eastern Bay of Plenty, informally named the “tsunami crescent”) suggest that they are most likely to relate to events from a local source. Several near-contemporaneous (15th Century) palaeotsunami deposits have also been reported from other parts of the country, and have been linked with a series of tsunamigenic events including several large fault ruptures and submarine volcanic eruptions (Figure 1, Table 2, refer to Goff and McFadgen, 2002 for full details of the 15th century events).
The contemporaneous deposits of the tsunami crescent must have been laid down by a tsunami with a local source sufficiently distant and large to affect the whole area. A logical source is submarine volcanism and/or associated earthquake activity in the vicinity of the Hikurangi trough, east of the southern Kermadec arc and 360 km east–southeast of Great Barrier Island (Figure 1). This is a seismically active area that has experienced a minimum of 21 large (Mag. 7.3 or greater) paleoseismic events during the past 2.5 ka (Berryman et al., 1989). An equally logical source is the southern Kermadec arc that is comprised of at least 13 modern submarine volcanoes between 34o50’S and 36o50’S (Figure 1) (Wright and Gamble, 1999). Of these volcanoes, the Healy caldera is a strong candidate for tsunami generation. A probable 15th Century eruption (contemporaneous with the palaeotsunami deposits) was pyroclastic and the associated caldera collapse in 550-1000 m water depth was catastrophic and possibly tsunamigenic (Wright et al., in press).
Confirmed or possible palaeotsunami deposits that are probably related to the Healy caldera collapse have been found in the Far North, on Great Barrier Island, on the mainland coast just north of Great Barrier Island, and in the Bay of Plenty (north-west, and south-west) (Figure 1). A comparison with the resonance patterns shows that in every palaeotsunami deposit location there is a corresponding short-period resonance. The resonance diagram also indicates other areas where resonance occurs, but where no geological studies have been undertaken, such as two areas
147

in eastern Bay of Plenty, and one in eastern Hauraki Gulf (Figure 4). In this instance the resonance diagrams appear to serve as a guide for further palaeotsunami field studies.
If this comparison between palaeotsunami deposits and short period resonances is taken further, a superimposition of the nationwide palaeotsunami data indicates that there is considerable match-up between the model results and geological data, but there are other areas where the two do not coincide, such as parts of the west coast (Figures 1 and 4). It should be noted that the resonance diagrams produced here are primarily related to remote events from the east. Some use can be made of these data for some locally-generated events from the east, but there is no consideration of either local or remote events from the west. Although a distant western or southern source is highly unlikely, there are numerous potential local sources including submarine faults and a steep continental shelf off the southwestern part of the country. While parts of a coastline may not resonate, this does not mean that a large, locally-generated tsunami will not catastrophically inundate the shoreline. Indeed, this appears to be the case for the West Coast, where co-seismic coastal subsidence also occurs in some places (Goff et al., 2001c).
Other problems are also found when attempting to match-up model and geological data. For example, in southern Hawke’s Bay geological fieldwork has so far been unable to identify any palaeotsunami deposits (they have been found at Wairoa in the north of Hawke’s Bay) and yet resonance is strong at both 60 and 150 minutes. This absence of data does not necessarily mean the absence of tsunami. It was not until after the mid 1990’s and the first identification of palaeotsunami deposits in New Zealand that coastal research started to consider tsunami. Moreover, if a sufficiently large tsunami inundated the coastline, the appropriate type of depositional environment is required to preserve evidence of the event. For example, unless it is overtopped, a cliffed coastline such as southern Hawke’s Bay is unlikely to preserve a palaeotsunami deposit. New Zealand’s coast is about 18200 km long (Rouse et al., in press) and there are many areas where resonances occur and no geological work has been carried out. The absence of correspondence between the model and geological evidence may therefore simply be a function of a lack of data. Conclusions
This paper summarises the methods and data used to obtain an accurate model for long wave propagation in a continental-shelf area of inherently complex interference patterns. Using this procedure, the spatial response pattern for waves with periods in the range of 15 to 300 minutes was explored. This has proven to be an efficient method to search for critical locations with large resonances and hence areas with potential tsunami risk.
The resonance patterns have been compared with existing historic and geological data. In general, there is good agreement between the resonance patterns and historical data for remote tsunami. Using the 1960 Chilean tsunami as an example, the amplitudes and wave periods at many locations along the east coast of New Zealand are in agreement with the strength and frequency of the resonance peaks. This indicates that the model results should provide a reliable index of risks associated with remote tsunami.
A comparison between the shorter-period resonance patterns and palaeotsunami data also shows a good match-up between the datasets, particularly in areas where there is some considerable geological detail such as within the Cook Strait area. This geological ground truth
148

indicates the general utility of the model results, but also serves notice that additional information is needed for local sources.
There are also areas where the model does not match the geological data. There are several explanations for this, although it is most likely that geological records refer to locally generated events that are not within the scope of the resonance analysis. However because of the generally excellent match-up around the coast, it is suggested that these areas must be considered in evaluating tsunami hazards. Acknowledgments Part of this project was funded by NSOF augmenting FRST-funded programme C01X0015 (Natural Physical Hazards affecting Coastal Margins and the Continental Shelf). GeoEnvironmental Consultants funded part of the geological research discussed in this paper. We are indebted to Rob Bell for his careful review of the manuscript. References Abraham, E.R.C. (1997): Seiche modes of Wellington Harbour, New Zealand. New Zealand Journal of Marine and Freshwater Research 31: 191–200. Bell, R.G.; Goring, D.G. and de Lange, W.P. (2000). Sea level change and storm surges in the context of climate change. IPENZ Transactions 27(1) – General: 1–10. (Also on Web site: http://www.ipenz.org.nz/ipenz/publications/transactions/ ). Berryman, K.R., Ota, Y., and Hull, A.G., (1989). Holocene paleoseismicity in the fold and thrust belt of the Hikurangi subduction zone, eastern North Island, New Zealand. Tectonophysics 163, 185– 195. Chagué-Goff, C., Dawson, S., Goff, J.R., Zachariasen, J., Berryman, K.R., Garnett, D.L., Waldron, H.M. and Mildenhall, D.C. (2002). A tsunami (c. 6300 years BP) and other environmental changes, northern Hawke’s Bay, New Zealand. Sedimentary Geology 150, 89-102. Chagué-Goff, C. and Goff, J.R. (1999). Geochemical and sedimentological signature of catastrophic saltwater inundations (tsunami). New Zealand. Quat. Aust. 17, 38-48. de Lange, W.P. (in press). Chapter 4: Tsunami and storm surge hazard in New Zealand. In: Rouse, H.L.; Goff, J.R. and Nichol, S. (eds.) The New Zealand Coast: Te Tai O Aotearoa. Daphne Brasnell Associates Ltd, Auckland. de Lange, W.; Fraser, R.J. (1999). Overview of tsunami hazard in New Zealand. Tephra 17: 3–9. de Lange, W.P.; Healy, T.R. (1986). New Zealand tsunamis 1840-1982. New Zealand Journal of Geology and Geophysics 29: 115-134.
149

Goff, J.R., Chagué-Goff, C. (1999). A Late Holocene record of environmental changes from coastal wetlands. Abel Tasman National Park. New Zealand. Quat. Int. 56, 39-51. Goff, J.R. and Chagué-Goff, C. (2001). Catastrophic events in New Zealand coastal environments. Conservation Advisory Sciences Notes No. 333, Department of Conservation, Wellington, 16pp. Goff, J.R. and McFadgen, B.G. (2002). Seismic driving of nationwide changes in geomorphology and prehistoric settlement – a 15th Century New Zealand example. Quaternary Science Reviews 21/22, 2313-2320. Goff, J.R., Crozier, M., Sutherland, V., Cochran, U., and Shane, P. (1998). Possible tsunami deposits of the 1855 earthquake, North island, New Zealand. In: Stewart, I.S., Vita-Finzi, C. (Eds.). Coastal Tectonics. Geol. Soc. Spec. Pub. No. 133, pp. 353-374. Goff, J.R., Rouse, H.L., Jones, S., Hayward, B., Cochran, U., McLea, W., Dickinson, W.W., Morley, M.S. (2000). Evidence for an earthquake and tsunami about 3100-3400 years ago, and other catastrophic saltwater inundations recorded in a coastal lagoon. New Zealand. Mar. Geo. 171, 233-251. Goff, J.R., McFadgen, B.G., Chagué-Goff, C., Downes, G., Kozuch, M. and Bell, R. (2001a). Wellington Regional Tsunami Hazard Scoping Project. GeoEnvironmental Consultants Client Report GEO2001/20008/12. Wellington Regional Council Publication No. WRC/RP-T-01/23, 117pp. (http://www.wrc.govt.nz/pub/view_doc.cfm?id=468). ISBN 363.34909936. Goff, J., Chagué-Goff, C. and Nichol, S. (2001b). Palaeotsunami deposits: A New Zealand perspective. Sedimentary Geology, 143, 1-6. Goff, J., Nichol, S. and Chagué-Goff, C. (2001c). Environmental changes in Okarito Lagoon, Westland. GeoEnvironmental Consultants Client Report 20003. Department of Conservation Internal Series No. 3, 30pp. Goring, D.G. (2002). Response of New Zealand waters to the Peru tsunami of 23 June 2001. New Zealand Journal of Marine and Freshwater Research 36: 225–232. Heath, R.A. (1976). The response of several New Zealand harbours to the 1960 Chilean tsunami. In: Heath, R.A., Cresswell, M. (eds) Tsunami Research Symposium 1974. Bulletin of the Royal Society of New Zealand 15: 71–82. Henry, R.F., and Walters, R.A. (1993). A geometrically-based automatic generator for irregular triangular networks. Communications in Applied Numerical Methods 9. Lowe, D.J., and de Lange, W.P. (2000). Volcano-meteorological tsunamis, the c. AD 200 Taupo eruption (New Zealand) and the possibility of a global tsunami. Holocene 10, 401-407.
150

Nichol, S., Goff, J, Regnauld, H. and Lian, O. (2002). Tsunami deposit of possible volcanogenic origin, Henderson Bay, New Zealand. Poster. First Symposium on New Zealand-France Collaborative Research in Geosciences, Wellington, New Zealand. July 15-16. Nichol, S.L., Lian, O.B., and Carter, C.H. (in press). Sheet-gravel evidence for a late Holocene tsunami run-up on beach dunes, Great Barrier Island, New Zealand. Sedimentary Geology. Rouse, H.L., Goff, J.R. and Nichol, S. (in press). Introduction. In: Rouse, H.L., Goff, J.R. and Nichol, S. (eds.) The coast of New Zealand: Te Tai O Aotearoa (Lincoln University Press). Smith, W.H.F. and Sandwell, D.T. (1997). Global sea floor topography from satellite altimetry and ship depth soundings. Science 277: 1956-1962. Walters, R.A. (1987). A model for tides and currents in the English Channel and North Sea. Advances in Water Resources 10: 138–148. Walters, R.A. (1992). A 3D, finite element model for coastal and estuarine circulation. Continental Shelf Research 12: 83–102. Walters, R.A. (2002). Long wave resonance on the New Zealand coast. NIWA Technical Report 109, 32 p. Walters, R.A., Goring, D.G., and Bell, R.G. (2001). Ocean tides around New Zealand. New Zealand Journal of Marine and Freshwater Research 35: 567–579. Witter, R.C., Kelsey, H.M., and Hemhill-Haley, E. (2001). Pacific storms, El Niño and tsunamis: competing mechanisms for sand deposition in a coastal marsh, Euchre Creek, Oregon. Journal of Coastal Research 17, 563-583. Wright, I.C. and Gamble, J.A. (1999). Southern Kermadec submarine caldera arc volcanoes (SW Pacific): caldera formation by effusive and pyroclastic eruption. Marine Geology 161, 207–227. Wright, I.C., Gamble, J.A., and Shane, P.A. (in press). Submarine silicic volcanism of the Healy caldera, southern Kermadec arc (SW Pacific): I-volcanology and eruption mechanisms. Bulletin of Volcanology.
151

Table 1: Diagnostic characteristics of tsunami (after Goff et al, 2001b) Diagnostic characteristics
• The deposit generally fines inland and upwards within the unit. Deposits often rise in altitude inland
• Each wave can form a distinct sedimentary unit, although this is not often recognised in the sedimentary sequence
• Distinct upper and lower sub-units representing runup and backwash can be identified
• Lower contact is unconformable or erosional
• Can contain intraclasts of reworked material, but these are not often reported
• Often associated with loading structures at base of deposit
• Particle/grain sizes range from boulders (up to 750 m3), to coarse sand to fine mud. However, most deposits are usually recognised as anomalous sand units in peat sequences
• Generally associated with an increase in abundance of marine to brackish water diatoms, but reworking of
estuarine sediments may simply produce the same assemblage • Marked changes in foraminifera (and other marine microfossils) assemblages. Deeper water species are
introduced with catastrophic saltwater inundation
• Pollen concentrations are often lower (diluted) in the deposit
• Increases in the concentrations of sodium, sulphur, chlorine, calcium and magnesium occur in tsunami deposits relative to under- and overlying sediments – indicates saltwater inundation and/or high marine shell content
• Individual shells and shell-rich units are often present (shells are often articulated)
• Often associated with buried vascular plant material and/or buried soil
• Shell, wood and less dense debris often found "rafted" near top of sequence
• Often associated with reworked archaeological remains (e.g. middens). In some cases occupation layers are separated by a palaeotsunami deposit
152

Table 2: Summary of palaeotsunami data (see Figure 1 for locations)
Date Location Comments References c.1450AD
c.1220AD
c.950AD
c.500AD
c.200AD
c.2500BP
c.3000BP
c.4000BP
c.5000BP
c.6300BP
Nationwide
Nationwide
Nationwide
Nationwide
Nationwide
Nationwide
Wairoa, Kapiti Nationwide?
Canterbury Wairoa, Kapiti Nationwide?
Wairoa
Nationwide?
The 1450AD ‘event’ is most likely related to a number of tsunamis generated by a cluster of large earthquakes in the 15th Century
• Abel Tasman National Park – up to 3.5km inland, primarily mud in sand
• Archaeological sites – almost ubiquitous signal of inundation found throughout the country
• Canterbury region – Up to 2 km inland, sand • Great Barrier Island/Far North – up to at least 350m inland,
runup over 32 masl, reworking of Maori ovens/midden sites • Kapiti Is. – over 200m inland, runup over 10 masl, saltwater
inundation of environment • Okarito – over 2.5km inland, runup over 5 masl, destruction of
nearshore vegetation • Palliser Bay –over 3.5km inland, erosion of coast for about
1.5 km landward Effects were similar in Abel Tasman National Park and on
Kapiti Is. Using the 1450AD as a template, it is likely that the event is not preserved in Palliser Bay (see above) because this is an exposed coastline and the last event (1450AD) removed evidence of previous ones. Identification of this event in association with archaeological sites on the east coast suggests that this was also nationwide
As per 1450AD, although probably smaller. No significant
field evidence has been found, but it links with other seismic related events occurring at the time. It is probable that much evidence was destroyed by later events, or that the deposit is present but not picked up by the broad brush, low resolution analyses undertaken so far
As per 950AD
Probably related to a volcano-meteorological tsunami
generated by the Taupo eruption, although seems to have occurred with some earthquake clustering. Similar to the 1450AD event
Probably smaller than the 1450AD event, but larger than the
possible 950AD and 500AD events. It is recorded in sediments of Abel Tasman National Park and Kapiti Is. Effects would have been similar to those reported for the 1450AD above, also appears to have affected Chatham Is.
If these events are near-synchronous, then it seems likely that
this would be of nationwide coverage. It is probably similar to the 1450AD template. At Wairoa the deposit is poorly preserved and assumed to be relatively smaller than earlier events (below).
Up to 2km inland, associated with mid-Holocene highstand?
As per 3000BP, but also found on Chatham Island.
This was a large event, penetrating at least 2 km inland. Runup
height is unclear because subsidence has taken place but probably about 15 masl.
Goff and McFadgen, 2002 Goff and Chagué-Goff, 1999 Goff and McFadgen, 2002 J. Goff, unpublished data Nichol et al, 2002; in press Goff et al., 2000 Goff et al., 2001c Goff et al., 1998 Goff and Chagué-Goff, 1999 Goff et al., 2000 Goff et al., 1998 Goff et al., 2001a Goff et al., 2001a Goff and McFadgen, 2002 Goff et al., 2001a Goff and McFadgen, 2002 Goff and Chagué-Goff, 1999 Lowe and de Lange, 2000 Goff et al., 2000 Goff and McFadgen, 2002 Goff and Chagué-Goff, 1999 Goff et al., 2000 Goff et al., 2001a Goff et al., 2000 Chagué-Goff et al. 2002 J. Goff, unpublished data Goff et al., 2000 Goff et al., 2001a Chagué-Goff et al. 2002 Chagué-Goff et al. 2002
153