assessing’ vulnerability’ and risk’ of’ climate’ change ...€™ vulnerability’ and...
TRANSCRIPT

Assessing Vulnerability and Risk of Climate Change Effects on Transportation Infrastructure
Hampton Roads Virginia Pilot

i
Table of Contents
Project Team ................................................................................................................ ii
Executive Summary ..................................................................................................... iii
Introduction ................................................................................................................. 1 Description of the Project Area ............................................................................................................................ 1 Climate change and Hampton Roads ................................................................................................................ 1
Summary of past work in this area ..................................................................................................................... 2 General Approach ...................................................................................................................................................... 4 Overview of existing FHWA framework ........................................................................................................... 4 Description of Virginia model supporting the FHWA framework ........................................................ 5
Roles and Responsibilities of the Parties Involved ..................................................................................... 7
Description of the work performed .............................................................................. 8 Transportation Infrastructure Inventory ........................................................................................................ 8 Existing Transportation Assets ............................................................................................................................ 8 Major Transportation Projects ............................................................................................................................ 8 Transportation Analysis Zones (TAZs) ............................................................................................................. 8 Multimodal Policies .................................................................................................................................................. 9
Climate Information .................................................................................................................................................. 9 Vulnerability and Risk Assessment ................................................................................................................. 10 Case study – Climate Impacts on Transportation Projects in Hampton Roads ............................ 11 Other perspectives .................................................................................................................................................. 16 Multiple Perspectives of Prioritization of the Transportation Plan Elements ............................. 17 Lessons Learned in the Virginia pilot ............................................................................................................. 19
References ................................................................................................................. 20
Appendix A: User guide for implementing the Virginia model ...................................... I
Appendix B: Mathematical statement of the Virginia model .................................... VIII

ii
Project Team Virginia Department of Transportation (VDOT)
University of Virginia (UVa) Center for Risk Management of Engineering Systems
Center for Transportation Studies Virginia Center for Transportation Innovation and Research (VCTIR)
Hampton Roads Planning District Commission (HRPDC)
Hampton Roads Transportation Planning Organization (HRTPO)

iii
Executive Summary This report describes how anticipated impacts of climate change on transportation infrastructure in the Hampton Roads region of Virginia were assessed via a decision model to help prioritize elements of the region’s long range strategic plan. This study is part of a larger effort by the United States Federal Highway Administration (FHWA) to understand the vulnerability of critical transportation infrastructure in several regions. The study of Hampton Roads region is significant in part because it is one of the most vulnerable to the projected impacts of sea-‐level rise by virtue of its low-‐lying topography, large population, and the density of military installations including the largest naval base on the east coast of the US. The risks associated with climate change in Hampton Roads have been well documented in a number of existing reports and outreach efforts carried out by a variety of agencies and these results are highlighted herein. The FHWA has developed a conceptual framework for evaluating this emerging risk. The framework is supported here by a quantitative model that is used to adjust priority setting in the regional long-‐range transportation plan under a range of climate and climate-‐related scenarios. The scenarios combine the conditions of climate change with several other types of conditions that could either increase or decrease the severity of the impact. The other types of conditions include economic recession, national security events, and additional population growth. Scenarios are developed over the time horizon of the long-‐term transportation plan. There is considerable knowledge uncertainty in any of the available projections of future climate. Four separate types of priority setting are addressed: (1) future transportation projects; (2) existing transportation assets; 3) long-‐term multimodal transportation policies; and 4) transportation analysis zones (TAZs). The results of this analysis for the Hampton Roads region suggest that significant reprioritization of investments would be warranted given the potential impacts of climate and climate-‐inclusive scenarios, particularly for the scenario of climate change (sea-‐level rise and increased storm surge) combined with increased traffic demands. Addressing multiple types of priority-‐setting provided decision makers with insight that would not be possible by considering only single assets or lists of assets in the context of single climate change impacts. The results in terms of adjusted priorities under the several scenarios are being utilized by the Hampton Roads Planning District Commission (Hampton Roads PDC) as they update the regional long-‐term transportation plan. This report contains a detailed description of how to use the developed model. The model is being made available via a website, in order that it can be adapted to the situations of other regions. The appendices to this report contain a user guide for the Microsoft Excel workbook that implements the Virginia model and a mathematical statement of the model.

1
Introduction
Description of the Project Area The Hampton Roads metropolitan area is located in southeastern Virginia at the base of the Chesapeake Bay. Three major rivers, the James, Nansemond, and Elizabeth, all discharge into the Bay here and consequently the region has hundreds of miles of coast and shoreline (Hapke, Himmelstoss et al. 2010). It is also extremely low-‐lying with the large majority of the region’s 2900 mi2 no more than a few feet above sea level (Kleinosky, Yarnal et al. 2007). The 2010 census estimated that the total population of the region is 1.7 million. It includes two primary cities: Norfolk and Virginia Beach and eight smaller ones including: Chesapeake, Franklin, Hampton, Newport News, Poquoson, Portsmouth, Suffolk, and Williamsburg. It consists of six countries: Gloucester, Isle of Wight, James City, Southampton, Surry, and York. The Hampton Roads area is a major economic hub for the state and a military hub for the country. The port is one of the largest on the east coat for shipping and so it has large economic importance for Virginia and beyond. The state’s tourism industry is also centered here. The Norfolk Naval base is the largest on the east coast and one of the largest in the world. All other braches of the armed forces, including the Coast Guard, Air Force, Marines and Army also maintain substantial facilities in the area. Because of its large population, proximity to the coast, low-‐lying topography, economic importance and military presence, the anticipated impacts of climate change on the region are of particular concern.
Climate change and Hampton Roads Increases in global average temperatures, as a result of anthropogenic emissions of greenhouse gases such as CO2, are expected to have profound impact on the man-‐made and natural systems over the coming decades. The impacts of this climate change are likely to differ by region. In general the expected impacts will include increased precipitation, extreme weather events like hurricanes, sea level rise, and extreme heat days (EPA 2009). Each of these manifestations of climate change could have profound effects on transportation infrastructure (CSIRO 2007). Some of these effects have been reported in other regions with rail buckling, flooding of tunnels, washing out of bridges, and other examples bringing this problem into focus for decision makers. In the Hampton Roads region, sea level rise is already underway in many of the low-‐lying population centers. Hampton Roads is also experiencing significant land subsidence. Most of the region is subsiding as a result of ongoing geologic forces that contribute a net loss of elevation of inches per decade. The land subsidence is driven by plate tectonics and post-‐glacial isostatic adjustment, the sinking of land south of

2
the previously ice-‐covered lands that are now rising due to glacial melting. Since much of the region’s drinking water comes from underground aquifers, there is some belief that groundwater withdrawals are also contributing to the problem (Boon, Brubaker et al. 2010). Erosion is also thought to play a role in the subsidence process. The ‘effective sea level rise’ of the region has been studied for years to understand the cumulative impact of climate-‐driven rise and land subsidence and the Hampton Roads area is undergoing significantly more effective sea level rise than pure sea level rise (Fears 2011). Land subsidence has been found to account for one-‐third to one-‐half of the total effective sea level rise in the region with location playing an important role (McFarlane 2011). The region’s proximity to the coast makes it particularly susceptible to tropical storms, hurricanes, and the tornadoes that can result from these. Over the past several decades, there have been a number of examples of major storm events that greatly impacted the region. In 1972, Hurricane Agnes caused $222M in damage and 13 people died from the flash flooding (NOAA 2011). In 1999, Hurricane Floyd passed directly over Virginia Beach after dropping from a Category 4 hurricane to a tropical storm. The rainfall associated with the combination of Floyd and a frontal system over the eastern United States produced rainfall of 6.8” with amounts as high as 18” in other parts of eastern Virginia (NOAA 2011). This rainfall, combined with the rains produced by Tropical Storm Dennis, together caused $3-‐6 billion in damages and the floods were responsible for 50 of the 56 reported deaths caused by Floyd in the U.S. More recently, Hurricane Isabel, the most significant hurricane to affect the Chesapeake Bay region since 1933 (reaching Category 5 at the peak), caused storm surges of more than eight feet, flooded rivers, resulted in 17 deaths and more than $3 billion in damages, produced a 500-‐year flood and caused the largest peacetime evacuation in U.S. history (NOAA 2011).
Summary of past work in this area The threat of climate change on the Hampton Roads region has been recognized for a number of years and several reports have been released exploring different aspects of the vulnerability (Governor's Commission on Climate Change(GCCC) 2008; Pyke, Najjar et al. 2008; Boon, Brubaker et al. 2010; Karvetski, Lambert et al. 2010; McFarlane 2011; Schroeder and Lambert 2011). The modeling approach developed here builds on this past work and was designed specifically to avoid duplicating any of these efforts. Highlights from these are summarized here to demonstrate how this effort fits within the broader context of understanding the risks to the region. In 2008, the Governor of Virginia organized a commission to study the effects of climate change on the Commonwealth (Governor's Commission on Climate Change(GCCC) 2008). Even though the group took a statewide perspective, they focused heavily on the Hampton Roads region because of its coastal location. The work of the commission was focused largely on inventorying existing contributions and sinks of greenhouse gases in the state. They evaluated the expected impacts of

3
climate on natural resources and human health but notably excluded several impacts of great importance to Hampton Roads including sea level rise or storm surge. The focus of this report also meant that limited consideration of transportation infrastructure was provided. The topic of sea level rise has been explored in detail, led primarily by researchers at the Virginia Institute of Marine Science (VIMS). Their results have demonstrated that sea level rise is more severe in Hampton Roads than in other comparable low-‐lying regions in the world. They calculated an effective sea level rise of 4.25 mm per year with a 95% confidence interval of 0.27 mm. They demonstrate convincingly, however, that sea level rise is accelerating with rise in the early part of the 20th century considerably slower than in the last few decades. The report from VIMS included data from ten active monitoring stations to try and tease apart the effect of land subsidence and sea level rise (Boon, Brubaker et al. 2010). They report extensive rise at all the monitoring sites with important differences between them. These reports focus exclusively on sea level rise and do not explicitly consider the effects on transportation infrastructure. There are a number of examples of studies looking at the ecological consequences of climate change on the region. The Chesapeake Bay Foundation released a report in 2007 exploring the impacts of warmer temperatures and higher sea levels on the ecosystems of the Bay. Even though a large focus of this report was on the interaction of man-‐made systems and the region’s sensitive ecosystems, e.g., increased precipitation leading to more pollution runoff, the report largely fails to explore the impacts on transportation around the heavily populated areas around the bay. The report does highlight certain unique features of the Bay that do provide important ecosystem services such as buffering from storm provided by natural wetlands, many of which are under stress from development. State and local transportation agencies and regional planning organizations have also begun to explore the ramifications of climate change on their activities. The HRPDC has been particularly focused on understanding the concerns of stakeholders in the relationship between climate change, planning, and natural resources (McFarlane and Walberg 2010). The community engagement work that is summarized in this report was carried out in an effort to understand the various concerns on natural resources in particular. A large goal of this activity was to provide public outreach and education (Institute for Environmental Negotiation 2011). This effort did not address transportation issues directly and it was not intended to inform decision-‐making. A follow-‐up study was conducted in 2011 to explore the role of storm surge specifically in the most vulnerable communities. The second effort was more quantitative and included a vulnerability analysis based on scenario development (McFarlane 2011). In spite of these efforts, the implications of climate change have yet to be incorporated satisfactorily into the region’s long-‐term transportation plans (Pickard, Perez et al. 2010). The most recent plan was released in 2010 and it does

4
not mention climate change, much less incorporate the impacts that these changes have to transportation infrastructure. Future plans are expected to include some discussion of climate change but given existing fiscal constraints, it is not expected that climate considerations will be used in priority setting of decision making in this next thirty-‐year plan. Importantly for the current effort, the region’s long-‐range transportation plan does provide a quantitative framework for evaluating new construction projects and ranking them. This framework was used as a starting point for the modeling efforts described herein.
General Approach
Overview of existing FHWA framework The Federal Highway Administration (FHWA) developed a conceptual model for understanding the ramifications of climate change on transportation infrastructure and administered a pilot study designed to generate feedback, provide lessons learned, and offer insight into the proposed methodology (Figure 1). The larger effort, entitled Assessing Vulnerability and Risk of Climate Change Effects on Transportation Infrastructure: Pilot of the Conceptual Model, was conducted by several State Departments of Transportation and/or Metropolitan Planning Organizations. The results of these pilot studies will enable refinement of the conceptual model and development of a composite final version for distribution for all transportation agencies. The goal of the study is to provide planning agencies and decision-‐makers with the tools necessary to identify which infrastructure is most at risk with regard to climate change, and which, if the threats are manifested, will result in the most significant consequences (Ashley, Diekmann et al. 2006). The FHWA conceptual framework consists of three interrelated component steps. The first is to develop an inventory of assets and prioritize based on vulnerability captured in the upper left hand corner of Figure 1. The second is to combine climate data for a region to understand the specific drivers of vulnerability as represented in the upper right hand corner of Figure 1. The third and final element of the conceptual framework, in the center of Figure 1, involved quantitative risk analysis to identify the most vulnerable transportation assets (Haimes, Lambert et al. 2004). Many of the individual elements of the FHWA conceptual model have been explored in existing reports as described in the Summary of Past Work section above and in other work exploring vulnerabilities of critical infrastructure (Baker 2005). A large number of the specific definitions used in describing the modeling framework are left intentionally ambiguous to enable specific pilot studies the flexibility to interpret and apply the model to their region. For example, transportation assets or infrastructure could be interpreted broadly to include all natural resources that enable transportation services or it could be considered more narrowly as the physical plant owned by the transportation agency. In either case, the model was subject to interpretation and application and the following section describes the particular circumstances of the Hampton Roads pilot and the modeling approach adopted here.

5
Figure 1. Structure of the FHWA conceptual framework for risk assessment and adaptation of transportation infrastructure to climate change
Description of Virginia model supporting the FHWA framework With the overarching goal of exploring the influence of climate change on long-‐term transportation planning, this project set out to develop a novel modeling technique. The goal was to develop a generalizable methodology that could be easily translated to transportation agencies in different areas. The key elements that the Hampton Roads pilot set out to explore with their model are: (1) the interactions between climate change and other factors such as economic recession, increased government regulation, maintenance/repair of existing infrastructure, technological innovation, and ecological degradation; (2) establish the connection between these combination of scenarios and transportation strategic planning; (3) enable prioritization of limited resources such that an optimal allocation and timely intervention can be achieved. The modeling approach adopted here has several distinctive characteristics that should maximize its utility for other transportation agencies. First transportation assets were interpreted broadly and four distinct classes of infrastructure were explored for priority setting in the models: (1) existing transportation assets (e.g., roads, bridges, etc.); (2) proposed transportation construction projects as described

6
in the long-‐term transportation plan; (3) traffic analysis zones (TAZs); and (4) multimodal transportation policies at several governmental levels. These elements of a transportation plan are not immediately comparable in a quantitative manner and by separating them, it was possible to develop four separate element rankings that can inform decision-‐making and prioritization. The second feature of the modeling approach is that since it is scenario-‐based, it can rely on the growing body of knowledge about climate impacts, particularly to coastal regions. Since transportation planners are not necessarily climate modelers, this model allows for climate data to be synthesized in such a way that re-‐prioritization of the plan elements can be explored even with the limited available data and knowledge base.
Identify projects Identify criteria
Multicriteria AnalysisResult
Adjust criteria importance
Scenario-informed AnalysisResult
1. Baseline Analysis
2. Scenario-Informed Analysis
Scenarios
Substitute with
Assets
Substitute with
Policies
Substitute with
TAZs
3. Multiple Perspective Scenario-Informed Analysis
Multiple Perspective
Results
Influential Scenarios
Figure 2: Structure of the Virginia model supporting the FHWA framework
The model enlists a multi-‐criteria decision analysis and involves several steps that result ultimately in a re-‐ranking of transportation assets and other plan elements under the scenarios of interest (Figure 2). To achieve this outcome the model requires several steps. For Hampton Roads, those steps are as follows. First, the relevant transportation document of interest was used to create a starting point of projects, TAZ’s, assets, etc. (e.g., the regional long-‐range transportation plan was used to identify projects and criteria of interest). Next, the model was used to try and reproduce and validate the baseline priority setting that the transportation agency had already agreed upon to ensure that the model was calibrated and that the criteria were interpreted correctly. In parallel, a series of climate-‐related impacts were combined with projections of economic conditions, maintenance plans, government regulation and other factors to create a realistic set of scenarios that

7
would impact transportation decision making. Then, multi-‐scenario priority-‐setting results were elicited from transportation and planning experts in the region to assess the influences of these scenarios to the relative importance of the planning goals and criteria. The model was then run to study the impacts of climate and climate-‐inclusive scenarios on the prioritization of the assets and the other plan elements. The new prioritizations were studied to understand the model influential scenarios. The results of re-‐prioritization were interpreted separately and together across the four plan elements: assets, projects, TAZs, and policies.
Roles and Responsibilities of the Parties Involved The Virginia Department of Transportation (VDOT) led this work in conjunction with the University of Virginia and the Hampton Roads Planning District Commission (HRPDC). At the University of Virginia, the Center for Risk Management of Engineering Systems and the Center for Transportation Studies directed most of the model development. Representatives from VDOT’s Virginia Center for Transportation Innovation and Research were involved in each step of the model development and they also served as an important liaison between the University partners and the regional planning organization representatives. In Hampton Roads, the HRPDC played a crucial role in informing the relationships between climate scenarios and transportation elements that enabled the ranking of large numbers of assets, projects, TAZs, etc. The regional Transportation Planning Organization (HRTPO) was also involved in reviewing the outcomes of the study. Since a central element of this study was to identify and prioritize assets, which can be a subjective exercise, it was important to obtain the distinct perspectives of these different planning organizations. The parties contributing to this study were each interested in identifying the key vulnerabilities of the region to climate change, but there were important differences between their perspectives. VDOT representatives identified eight specific transportation assets in the Hampton Roads area, bridges, tunnels, sections of highway, and traffic control infrastructure. These assets were derived primarily from hurricane evacuation planning efforts (Ferguson 2002). The HRTPO and HRPDC were concerned with transportation assets more generally as they relate to population centers, economic activity, and proposed transportation projects (McFarlane and Walberg 2010). The UVa team was primarily interested in creating innovative and appropriate modeling tools that would serve the broader community of transportation academics and planners. As a result, many of the details of this work are also presented in several peer-‐reviewed academic publications. The preparation of these manuscripts will also aid in the dissemination of the results to broad audience.

8
Description of the work performed
Transportation Infrastructure Inventory As described in the general approach section above, “assets” of the FHWA methodology were reinterpreted/redefined to be in four distinct categories of transportation infrastructure elements. The details of each are described below:
Existing Transportation Assets The asset list for this work was compiled from a variety of VDOT sources. VDOT maintains an asset management system (AMS) (Beauvais, Lam et al. 2003) that include mobile and immobile assets, such as roads, bridges, tunnels and the Pontis database (Thompson, Small et al. 1998) that includes primarily bridges. A preliminary compilation from all these databases includes thousands of assets. Four screening criteria were used to reduce the scale of the problem to fewer than twenty major assets. These include (1) those assets that are on hurricane evacuation routes (VDOT 2011); (2) those assets that carry high traffic volume (AADT > 10,000 vehicles/day); (3) those assets that represent a maintenance priority route (e.g. snow removal priority route); and (4) those that are at low-‐lying elevations. These criteria are intended to focus the demonstration on high-‐risk assets using a manageable set of major assets. The resulting list includes three bridges, the Chesapeake Bay Bridge-‐Tunnel, Berkley Bridge and Gilmerton Bridge, which are all important for moving freight and people. Also included are two traffic management center facilities that ensure the smooth operation of the region’s multimodal transportation.
Major Transportation Projects A list of 155 transportation projects planned over a thirty-‐year time horizon was developed from the long-‐term transportation plan for the region (Pickard, Perez et al. 2010). These projects have been prioritized according to published criteria, which formed the basis for the prioritization algorithm to ensure consistency between base case conditions and climate intensive conditions. The transportation projects were internally divided between highway, interchange, bridge/tunnel, intermodal, and transit projects since these are not easily comparable.
Transportation Analysis Zones (TAZs) Forty TAZs were identified as representative regions within the larger metropolitan area to demonstrate the impact that regional distinctions may have on overall planning in response to climate change induced impacts. The greater metropolitan area contains thousands of TAZs. Here a randomly selected grouping of TAZs were chosen making sure that there was a reasonable distribution of (1) locations (e.g., proximity to the coast); (2) size (e.g., to capture significant differences in population density in the region). A map of the representative TAZs used in the Hampton Roads pilot is presented in Figure 3.

9
Figure 3. Selected Traffic Analysis Zones to be Re-‐Prioritized for Importance Under
Scenarios that Include Climate Change
Multimodal Policies Recognizing that policy priorities are an important driver in transportation planning, a model was set up to evaluate the effect of different policy frameworks on vulnerability to climate change. A list of twenty-‐one statewide policies and four region-‐specific policies were chosen from the long-‐range transportation plan based on their relevance and impact on transportation infrastructure and funding allocation (VTrans 2004; Lambert and Schroeder 2009). The policies were subdivided into four categories: funding/investment, land use, connectivity, and priority setting. Examples of the policies include improving connections between transportation modes, considering state rules, increasing rail funding, and starting a trust fund for transportation.
Climate Information An important characteristic of this modeling effort is that it relies on climate impact scenarios rather than specific projections of future changes. This decision was made for two reasons. First, climate change projections are inherently uncertain (Jones 2001). The scientific community has demonstrated conclusively that the climate is warming on a global scale, but the specific effects on individual regions are more difficult to quantify. In addition, there is little historical precedent for many of the regional manifestations of climate change. For example, sea level in the Hampton Roads region has been steadily increasing for over a decade, but most expect this rate to increase in the coming decades. Second, since the relationship between transportation infrastructure and climate-‐related impacts are projected, it is difficult to expect that decision makers would be able to offer much more resolution than what could be achieved using a scenario approach. For example, a transportation expert would have little hope of differentiating between the impacts of a 0.2 m sea level rise and 0.24 m sea level rise on a particular bridge over a particular time horizon. Exploring these manifestations of climate change to the first significant digit seemed to be a useful first step.

10
Another reason that a scenario-‐based approach was appealing was that it allowed for combinations of manifestation of global changes. In particular, the climate scenarios included in the model here incorporated four manifestations of climate change. The first is sea level rise, a mechanism that would have obvious and permanent implications for transportation infrastructure located near the coast. The second is storm surge due to hurricanes. Since Hampton Roads is regularly subject to hurricanes and tropical storms making land fall from the Atlantic Ocean, the effects of sea level rise could be exacerbated during storms. The third impact is extreme temperature days, which have been shown to impact a variety of transportation assets from rails to pavements in other regions. The fourth impact of climate change that was included in the modeling scenarios is enhanced precipitation. The regional climatological estimates suggest that Hampton Roads, along with most of the mid-‐Atlantic of the United States will experience an increase in annual precipitation rates. This could impact transportation infrastructure in both subtle (e.g., increased use of ice on bridge decks during winter precipitation) to severe (e.g., washing out of culverts and other storm water structures during heavy rain fall events). The magnitude and time horizon over which these impacts can occur is left intentionally open such that the transportation agency using the model can specify these as part of the process of identifying which impacts will be most relevant to their area. An important feature of the climate scenario development is that it allows for decision-‐makers to explore the effect of interactions between the physical consequences of climate change and the socio-‐economic conditions that could interact with these consequences to either enhance or suppress their importance. For the case of Hampton Roads, several conditions were explored including (1) economic recession that would make governments less capable of taking climate mitigation steps; (2) increased government regulation that would slow the effects of predicted change; (3) maintenance/repair of existing infrastructure under business-‐as-‐usual conditions or under greatly enhanced fiscal conditions; (4) technological innovation that could either reduce the impacts of climate or provide adaptation to the region and; (5) increased ecological degradation that would interfere with existing resources such as wetlands that buffer storm surge.
Vulnerability and Risk Assessment Multicriteria decision analysis (MCDA) and related tools are widely used to perform risk and impact analysis on environmental and infrastructure systems (Linkov, Satterstrom et al. 2006; Linkov, Satterstrom et al. 2006; Linkov, Wenning et al. 2007; Linkov, Ferguson et al. 2008). MCDA allows vulnerable infrastructure to be prioritized based on a wide range of competing decision criteria. One of the most attractive features of MCDA is that is allows for complex decision analysis based on incomplete, empirical, or unstructured knowledge. It enables risk management, a primary objective of the FHWA pilot program, with few modeling or computational resources relative to more complex alternatives (Guerard and Ray 2006). Since it is automated and scales easily, it also allows for the study of large networks. If these

11
were studied on an individual basis, it could result in oversimplification or certain factors might be overlooked. MCDA is designed to handle multiple conflicting objectives and there is precedence for vulnerability assessments into the future when conditions are uncertain (Belton and Stewart 2002). In particular, there is a growing body of literature in which scenario-‐based MCDA has been used to capture scenario or stakeholder-‐dependent priorities and values. MDCA can better assist infrastructure agencies in priority setting when the traditional tools of MCDA are supplemented with scenarios (Karvetski, Lambert et al. 2009; Karvetski, Lambert et al. 2010; Karvetski, Lambert et al. 2010; Martinez, Lambert et al. 2010; Schroeder and Lambert 2011). Including scenarios into MCDA recognizes the high levels of future uncertainty and the role of uncertainty in long-‐term impacts of current decisions. Scenarios can also aid in including the perspectives of the civil and systems engineers, environment scientists, environmentalists, biologists, and other individuals from private and government organizations that are relevant stakeholders strategic planning related to climate change (Karvetski, Lambert et al. 2010).
Case study – Climate Impacts on Transportation Projects in Hampton Roads To demonstrate the utility of the model developed here, this section presents a case study for the prioritization of the projects included in the Hampton Roads long-‐term transportation plan. The step-‐by-‐step description of the modeling process is intended less as a guide, since that is provided in Appendix A, and is meant to illustrate the ways in which climate scenarios might impact prioritization of transportation projects and how the multicriteria model presented here provides unique insights for this case. At the end of this section is a comparative analysis where the results of the projects model are compared with the results from the other three infrastructure prioritization models created here i.e., assets, geographic locations (TAZs) and multimodal transportation policies. A methodology for comparing across these diverse classes of assets is also proposed. The majority of the data needed as inputs for the transportation projects model for the case of Hampton Roads can be found in the 2034 long-‐range plan of Hampton Roads Transportation Planning Organization (HRTPO) (HRTPO 2011). This includes the projects list, criteria, criteria weights and baseline ratings of projects. In some cases data had to be adapted to provide quantitative measures where only qualitative metrics are reported. The remainder of the input data came in the form of climate scenarios and expert opinions on adjustment of value function across constructed scenarios are obtained from discussion sessions with planners and engineers from Hampton Roads Planning District Commission (HRPDC). With all inputs described above, the MS Excel workbook generates a table to display the scores of the projects across the scenarios as well as the baseline score of each project. The tool includes another table that shows the ranking of each project against other projects for each scenario. X-‐Y graphs with sensitivity bars accompany

12
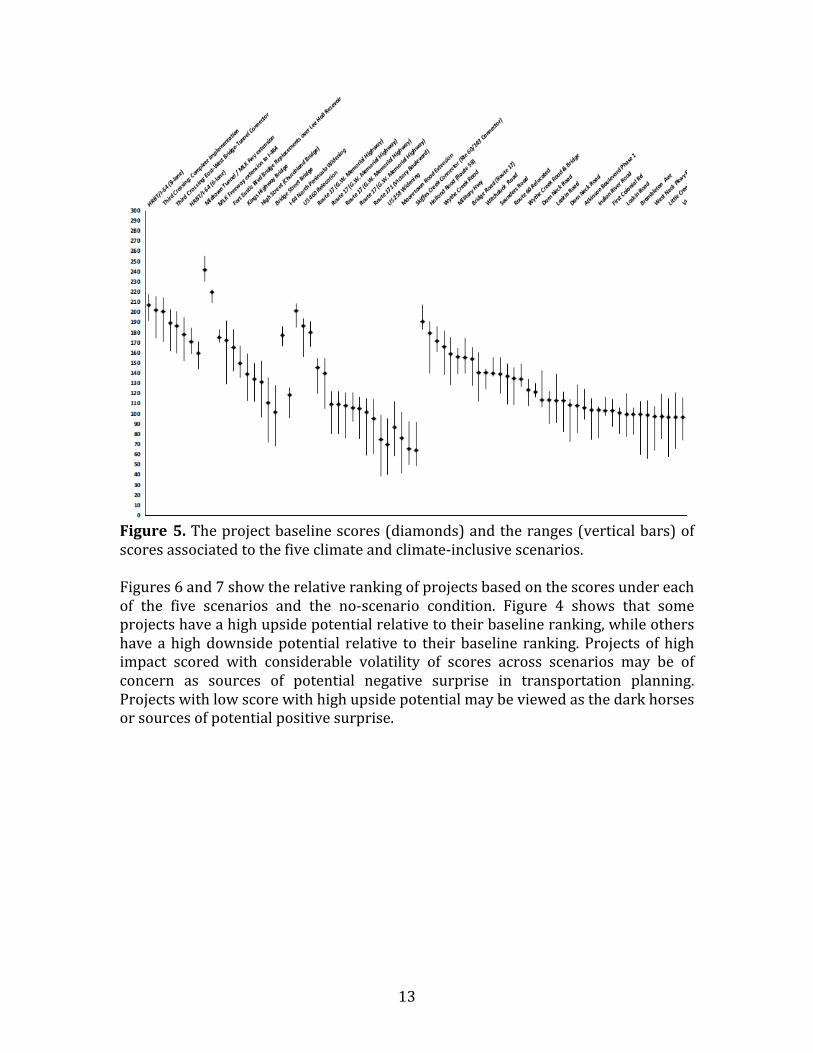
both tables in the MS Excel workbook. The graphs show the sensitivities of project prioritizations to scenarios. The displays of project scores make it possible for transportation planners to become acquainted with the effects of strategic transportation projects in climate and climate-‐inclusive scenarios. Figure 4 shows the results of the projects scoring across the scenarios climate only, climate and economy, climate and wear-‐and-‐tear, climate and ecology, and climate and increased traffic demand. Figure 5 graphically shows the range of scores for each project, marking the highest score and lowest score across scenarios. The baseline score is represented by the diamond and the sensitivity of the score to scenarios is represented by the bars extending above and below the diamonds. A taller bar suggests a relatively greater sensitivity of the project impact to the scenarios. Many of the score ranges overlap, which indicates that transportation planners need to consider more than only the baseline scores of the projects and the upside and downside potentials relative to the baseline score.
Figure 4. The scores of selected transportation projects across the baseline and additional five scenarios
13
Figure 5. The project baseline scores (diamonds) and the ranges (vertical bars) of scores associated to the five climate and climate-‐inclusive scenarios. Figures 6 and 7 show the relative ranking of projects based on the scores under each of the five scenarios and the no-‐scenario condition. Figure 4 shows that some projects have a high upside potential relative to their baseline ranking, while others have a high downside potential relative to their baseline ranking. Projects of high impact scored with considerable volatility of scores across scenarios may be of concern as sources of potential negative surprise in transportation planning. Projects with low score with high upside potential may be viewed as the dark horses or sources of potential positive surprise.

14
Figure 6. The rankings of selected transportation projects across the baseline and additional five scenarios
Figure 7. The project baseline rankings (diamonds) and the ranges (vertical bars) of scores associated to the five climate and climate-‐inclusive scenarios. Additional analysis can be conducted on projects with these typical characteristics, to obtain the most influential criteria and influential scenarios for re-‐prioritization of the projects. Figure 8 shows two examples of such analysis. The result is informative for transportation planners to assess the rationale for re-‐prioritization of these projects in detail.

15
Figure 8. Analysis of the projects with bars indicating sensitivity of the prioritization to the climate and climate-‐inclusive scenarios.
16
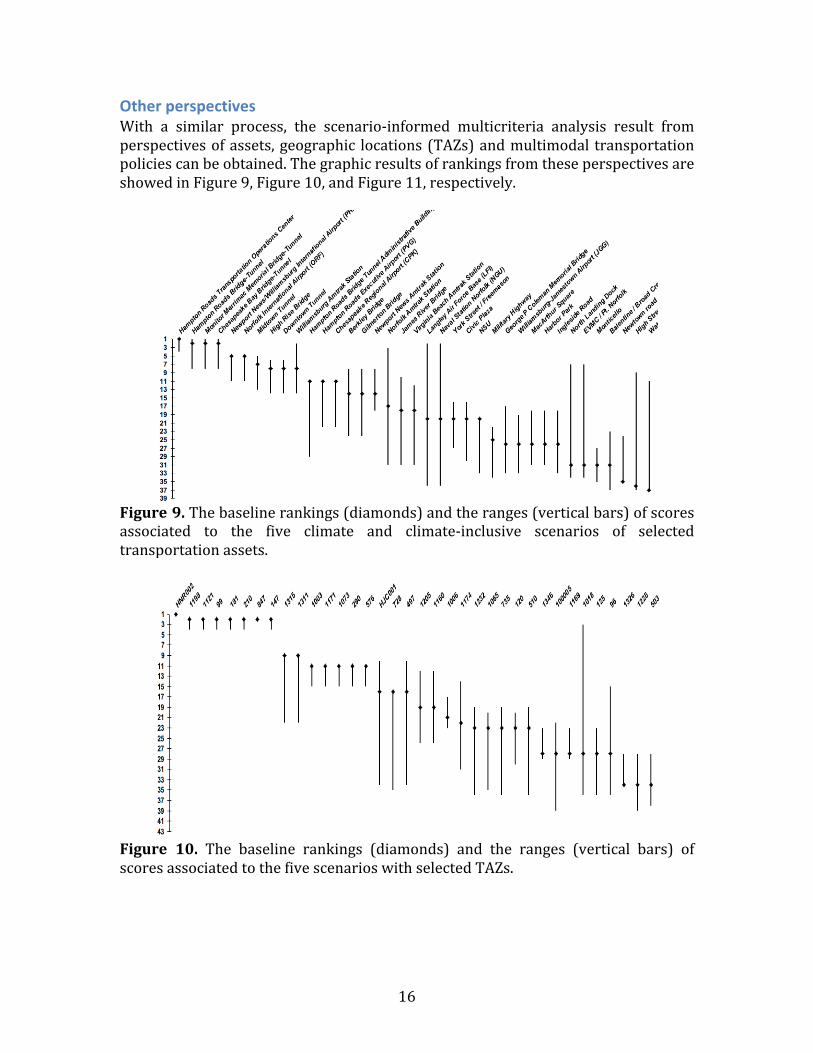
Other perspectives With a similar process, the scenario-‐informed multicriteria analysis result from perspectives of assets, geographic locations (TAZs) and multimodal transportation policies can be obtained. The graphic results of rankings from these perspectives are showed in Figure 9, Figure 10, and Figure 11, respectively.
Figure 9. The baseline rankings (diamonds) and the ranges (vertical bars) of scores associated to the five climate and climate-‐inclusive scenarios of selected transportation assets.
Figure 10. The baseline rankings (diamonds) and the ranges (vertical bars) of scores associated to the five scenarios with selected TAZs.

17
Figure 11. The baseline rankings (diamonds) and the ranges (vertical bars) of scores associated to the five constructed scenarios of selected multimodal transportation policies.
Multiple Perspectives of Prioritization of the Transportation Plan Elements The proposed scenario-‐informed multicriteria analysis framework quantifies the influence of each constructed scenarios in terms of a normalized coefficient defined by the overall ranking changes. The result of the quantified scenario influence is showed in Figure 12. With the radar chart in Figure 12, planners and decision-‐makers are able to have visualized information about the influence of scenarios to different category of agency’s generic assets. For example in this case study, an obvious observation is that the scenario with climate change and increase traffic demand has highest overall influences. This influence mainly consists of the effect on infrastructure assets’ and multimodal transportation policies’ prioritization. This scenario has relatively lower impact on the planning efforts towards strategic transportation projects. These observations are helpful to the decisions on where to allocate additional investigate, mitigation and prevention resources. In this case study, the result showed in Figure 12 supports the decisions in Table 1. The check mark in the table indicates the corresponding scenarios should acquire additional resources from the perspective of risk assessment and risk mitigation.

18
Figure 12. The influence of five constructed scenarios on four categories of plan elements. Table 1. The resource allocation decisions indicated by the multi-‐perspective analysis
Scenarios Priority-‐Setting in Several Perspectives Projects Assets TAZs Policies
S1. Climate Change ✔ S2. + Economy ✔ S3. + Wear and tear S4. + Ecology S5. + Traffic demand ✔ ✔ ✔

19
Lessons Learned in the Virginia pilot The lessons learned in implementation of the Virginia pilot are: 1. At the initiation of the pilot, significant scientific work had already been done to
find locations vulnerable to climate change, including sea level rise and storm surge, by identifying vulnerable transportation infrastructure, species, ecosystems, regional economic sectors, and socioeconomic structure of the Hampton Roads region.
2. However, regional climate change studies had not yet been incorporated to the process of updating the regional Long Range Transportation Plan. Since the long-‐range transportation plan has a planning horizon of thirty years and is periodically revised every four years, we recognized it as an appropriate venue for addressing impacts of climate change in the regional transportation system.
3. We recognized the need for existing scientific and engineering resources to be integrated for planning in an exercise that would involve modest additional resources and time of the staff.
4. A significant component of the long-‐range plan is priority setting, in terms of future investments. Priority setting is performed in several dimensions: Existing transportation assets, geographic locations (Traffic Analysis Zones), future projects, and multimodal transportation policies.
5. We found that climate change influences the priorities of transportation planning through combining with other factors including economics, ecology, transportation demand, condition of transportation infrastructure, land regulations, energy usage, market place and other factors. The factors combine as scenarios that influence priority settings from the several dimensions.
6. A quantitative multicriteria analysis was performed to identify the scenarios that were most influential in each dimension of priority setting for the Hampton Roads region. It was interesting that different scenarios were found to have different impacts for different priority setting objectives. The results suggest which scenarios need further study. For example, a scenario combining climate change effects with increased traffic demand was found to be the most influential for prioritizing geographic locations. The results of the analysis must be re-‐visited periodically to account for new scientific and engineering discoveries resulting from changes of subjective understanding of preference of decision-‐makers and leadership.
7. The Virginia model has been effective in education and training of officials and staff of the regional Metropolitan Planning Organization and the Hampton Roads Planning District Commission. A website was useful to provide access to the user-‐friendly, editable Microsoft Excel workbooks.
8. The Virginia model supplements and complements on-‐going scientific, engineering and planning effort to the region to understand and recognize the possibilities for adapting to climate change in the transportation planning process. Furthermore, the Virginia model will be applicable to regions across the nation.

20
References Ashley, D. B., J. E. Diekmann, et al. (2006). Guide to Risk Assessment and Allocation
for Highway Construction Management, Federal Highway Administration. Baker, G. H. (2005). A Vulnerability Assessment Methodology for Critical
Infrastructure Sites. DHS Symposium: R&D Partnerships in Homeland Security, Boston, Massachusetts.
Beauvais, J. C., J. C. Lam, et al. (2003). Asset management for Virginia highways and roads. Systems and Information Engineering Design Symposium, 2003 IEEE.
Belton, V. and T. J. Stewart (2002). Multiple Criteria Decision Analysis, An Integrated Approach. . Massachusetts, Kluwer Academic Publishers.
Boon, J. D., J. M. Brubaker, et al. (2010). Chesapeake Bay Land Subsidence and Sea Level Change: An Evaluation of Past and Present Trends and Future Outlook, Virginia Institute of Marine Science.
CSIRO (2007). Infrastructure and climate change risk assessment for Victoria, Commonwealth Scientific and Industrial Research Organisation.
EPA (2009). Coastal Sensitivity to Sea-‐Level Rise A Focus on the Mid-‐Atlantic Region. U. S. C. C. S. P. a. t. S. o. G. C. Research, U.S. Environmental Protection Agency, Climate Change Science Program: 320.
Fears, D. (2011). A new way of thinking as sea levels rise. The Washington Post. Ferguson, W. S. (2002). Hurricane Preparedness and Recovery by a Transportation
Agency Virginia Transportation Research Council. Governor's Commission on Climate Change(GCCC) (2008). Final Report: A Climate
Change Action Plan, Governor’s Commission on Climate Change.
Guerard, H. and M. Ray (2006). GERICI Project: Risk Management Related to Climate Change and its Impact on Infrastructures. Transport Research Arena Europe 2006. Goteborg, Sweden, Swedish Road Administration.
Haimes, Y. Y., J. H. Lambert, et al. (2004). Risk assessment and management of critical highway infrastructure Virginia Transportation Research Council
Hapke, C. J., E. A. Himmelstoss, et al. (2010). National Assessment of Shoreline Change: Historical Shoreline Change along the New England and Mid-‐Atlantic Coasts, United States Geological Survey (USGS).
HRTPO (2011). 2034 Long-‐Range Transportation Plan. Hampton Roads, Hampton Roads Transportation Planning Organization.
Institute for Environmental Negotiation, U. o. V. I.-‐U. (2011). "Sea Level Rise in Hampton Roads: Virginia Beach Listening Sessions." Retrieved July 1, 2011, from http://www.virginia.edu/ien/sealevelrise/contact.html.
Jones, R. N. (2001). "An Environmental Risk Assessment/Management Framework for Climate Change Impact Assessments." Natural Hazards 23(2): 197-‐230.

21
Karvetski, C. W., J. H. Lambert, et al. (2010). "Integration of Decision Analysis and Scenario Planning for Coastal Engineering and Climate Change." Systems, Man and Cybernetics, Part A: Systems and Humans, IEEE Transactions on 41(1): 63-‐73.
Karvetski, C. W., J. H. Lambert, et al. (2009). "Emergent conditions and multiple criteria analysis in infrastructure prioritization for developing countries." Journal of Multi-‐Criteria Decision Analysis 16(5-‐6): 125-‐137.
Karvetski, C. W., J. H. Lambert, et al. (2010). "Scenario and Multiple Criteria Decision Analysis for Energy and Environmental Security of Military and Industrial Installations." Integrated Environmental Assessment and Management. 7(2): 228-‐236.
Kleinosky, L., B. Yarnal, et al. (2007). "Vulnerability of Hampton Roads, Virginia to Storm-‐Surge Flooding and Sea-‐Level Rise." Natural Hazards 40(1): 43-‐70.
Lambert, J. H. and M. J. Schroeder (2009). Scenario-‐Based Transportation Planning with Involvement of Metropolitan Planning Organizations, Virginia Transportation Research Council.
Linkov, I., E. Ferguson, et al., Eds. (2008). Real Time and Deliberative Decision Making: Application to Emerging Stressors. Amsterdam, Springer.
Linkov, I., K. Satterstrom, et al. (2006). "From Comparative Risk Assessment to Multi-‐Criteria Decision Analysis and Adaptive Management: Recent Developments and Applications." Environment International 32(32): 1072-‐1093.
Linkov, I., K. Satterstrom, et al. (2006). "Multi-‐Criteria Decision Analysis: Comprehensive Decision Analysis Tool for Risk Management of Contaminated Sediments." Risk Analysis 26: 61-‐78.
Linkov, I., R. Wenning, et al., Eds. (2007). Managing Critical Infrastructure Risks: Decision Tools and Applications for Port Security. Amsterdam, Springer.
Martinez, L. J., J. H. Lambert, et al. (2010). "Public Perception of the Risks of Liquefied Gas Terminals in Mexico: A Prioritization of Communication Strategies." To appear in International Journal of Critical Infrastructures. 6(4): 327-‐346.
McFarlane, B. J. (2011). Climate Change in Hampton Roads: Phase II: Storm Surge Vulnerability and Public Outreach, Hampton Roads Planning District Commission (HRPDC).
McFarlane, B. J. and E. J. Walberg (2010). Climate Change in Hampton Roads: Impacts and Stakeholder Involvement. Chesapeake, VA, Hampton Roads Planning District Commission (HRPDC).
NOAA. (2011). "National Weather Service, National Hurricane Center." from http://www.nws.noaa.gov/.

22
Pickard, A., B. O. Perez, et al. (2010). Prioritization of Transportation Projects Hampton Roads Project Evaluation and Scoring, Hampton Roads Transportation Planning Organization.
Pyke, C. R., R. G. Najjar, et al. (2008). Climate Change and the Chesapeake Bay: State-‐of-‐the-‐Science Review and Recommendations, Chesapeake Bay Program Science and Technical Advisory Committee (STAC): 59.
Schroeder, M. J. and J. H. Lambert (2011). "Scenario-‐based multiple criteria analysis for infrastructure policy impacts and planning." Journal of Risk Research 14(2): 191 -‐ 214.
Thompson, P. D., E. P. Small, et al. (1998). "The Pontis Bridge Management System." Structural Engineering International 8: 303-‐308.
VDOT (2011). Hurricane Evacuation Guide, Virginia Department of Transportation. VTrans (2004). Virginia's Statewide Multimodal Long-‐Range Transportation Plan,
Phase 3 and Final Report. Richmond, VA.

I
Appendix A: User guide for implementing the Virginia model The model developed here is built in Microsoft excel and the steps involved in using the workbook for transportation project prioritization is provided here for the benefit of other users seeking to apply the model to their case: 1. The first step is to define the criteria and assign max score (indicating relative
importance) for each criterion. In the workbook, navigate to worksheet “Encoded Criteria List”, and enter the name, display name and MOD points. Criteria can be categorized by assigning criterion code starting with identical prefix (i.e. PU-‐HW in the screenshot).
Define Criteria 1

II
2. The second step is to define the list of projects to be prioritized. Navigate the worksheet “Projects List”, project ID, project Name and relevant information can be typed in. Import the filtered list of projects from rational database is another option.
3. The third step is to give baseline ratings to projects defined in step 2 over the
criteria defined in step 1. The worksheet “Projects Ratings” automatically generates the layout for input the ratings. The categorizing of projects and criteria are maintained in this worksheet to assist entering the ratings.
Define Projects 2
Baseline Ratings 3

III
4. The workbook will calculate the aggregated score of each project via built-‐in multicriteria value function based on the inputs from step 1 to step 3. The result is showed in the worksheet “Baseline Projects Ranking” in terms of table. Both cardinal (aggregated scores) and ordinal (ranks) result are displayed.
Baseline Result 4

IV
5. Scenario-‐based analysis starts from step 5. The worksheet “Scenario Definitions” defined default climate and non-‐climate conditions in list (conditions can be added or edited by users). Up to five scenarios can be constructed by checking corresponding checkbox. Important discussion, opinions and disagreement should be listed in the “User Note” box.
Define Scenarios 5

V
6. The worksheet “Adjustment for New Scenario” is used to record expert opinions on the changes of criteria relative importance across the scenarios constructed in step 5. Users can select appropriate natural language statement from a pre-‐defined list, to specify the direction and magnitude of the changes.
Adjust criteria importance 6

VI
7. After all inputs above are collected, users can navigate to the worksheet “Top Projects” to look at the scenario-‐informed results. Demonstration of results interpretation can be find in the studies by Karvetski et al. (2011), and Schroeder and Lambert (2011).
Output: Priority-‐Setting under multiple scenarios 7

VII
8. The worksheet “Top Influential Scenarios” quantifies and shows the influence of each individual scenario defined in step 5, in terms of the changes on rankings comparing to the baseline rankings. The result implies suggestions on additional investigation resource allocation.
Output: Scenario influence 8

VIII
Appendix B: Mathematical statement of the Virginia model (adapted from Schroeder et al. 2010) We define a set of assets { | , }iA a i I i N += ≤ ∈ where is the total number of assets that are to be prioritized. Each asset is evaluated across a set of criteria
{ | , }iC c j J j N += ≤ ∈ where J is the total number of criteria. For transportation systems, these criteria might be evident from a long-‐range, unconstrained strategic plan. Each asset is evaluated across the criteria by experts to yield asset ratings , where . This rating reflects an extent to which asset addresses criterion
. The rating , where , and ,p q I p q N +≤ ∈ , represents that the asset addresses criterion more adequately than asset . A vector represents the assessments across all criteria for asset . To enable comparisons and prioritization of assets, a mapping from this vector to the real number set is constructed as follow. An additive value function is defined as
(0)
where the set are the normalized weights for criteria, such that (0)
and
(0)
The weight represents the relative significance of criterion among other criteria.
Then the prioritization of assets can be determined by values of the function . Multicriteria decision analysis lacks a built-‐in capability to deal with the non-‐probabilistic uncertainties of emergent and future conditions, particularly without consensus across experts. Scenario-‐informed analysis has proven to be an effective approach to confront such uncertainties. Thus an integration of multicriteria decision analysis and scenario analysis is promising. By definition, a scenario is a plausible story about future conditions or circumstances. Without assigning probability to future events as traditional forecast-‐based approaches, scenario-‐informed analyses is not hindered by over-‐precision and/or lack of trustworthiness of forecasts. A set of scenarios is defined as { | , }kE e k K k N= < ∈ . Each scenario is a combination of emergent or future conditions. The set of conditions is { | , }mD d m M m N += ≤ ∈ . Conditions are statements about a future climate change factor and can be either quantitative as “global sea-‐level rise of 0.50 meters” or qualitative as “increase in the
ijz0 1ijz≤ ≤ jc
pj qjz z>
qa
ia
1
( ) 100J
i j ijj
u Z w z=
= ×∑{ }jw
0 1jw≤ ≤
1
1J
jjw
=
=∑
jc
( )iu Z

IX
frequency of tropical storms”. In practice, these conditions can be identified by expert and stakeholders of a large-‐scale system. A scenario is an element of the power set of the set of conditions . Mathematically, the relationships between the set of scenarios and conditions can be expressed as and . Each scenario will result in updating of criteria weights. To reflect this effect of scenarios, the additive value function defined in Equation (2) becomes
(0)
where is the aggregated rating of asset under scenario . This equation extends Equation (1) to yield a vector of the form, representing that the prioritization of assets differs across the several scenarios. As the scenario analysis provides significant new factors to the original prioritization problem, it engages experts, decision makers, and stakeholders. According to the additive value function in Equation (3), the number of variables that need to be elicited interactively from the experts is . In order to reduce the effort to elicit opinions from decision makers on the change of criteria relative importance, we consider the ratings, ,do not change across the scenarios. In this case, the expression of is determined by the weights only. The fixing of the rating reduces the number of variables that are required to be provided by experts to . This assumption is reasonable because the horizon for the policy making is most important in ascertaining whether scenarios most influence the criteria weights (as in this paper), or whether the scenarios most influence the ratings of the assets. We suggest that for a distant time horizon the influence on the criteria weights is predominant over the influence on the ratings. Removing the influence of scenarios on ratings, the additive value function in Equation (3) can be revised as:
(0)
The lower-‐order implications of varying the asset ratings with the scenarios could be considered in future effort.
With the fixed ratings, the required level of interaction with decision-‐makers and stakeholders is significantly reduced. However, the experts still need to update the weights for each scenario. From a perspective of human-‐factors and cognition, repetitive tasks can lead to undesired effects, tending to yield output with poor quality. A method to adjust the criteria weights incrementally in the additive value function between scenarios has been introduced by Karvetski et al. (2011), and Schroeder and Lambert (2011).
( )P D( )E P D⊆
1
( ) 100k
J
e i j k ijkj
u Z w z=
= ×∑
ke
( ) ( )jk ijk+
ijkz
( ) ( )jk ij+
1( ) 100
k
J
e i jk ijj
u Z w z=
= ×∑

X
For each scenario of , one of five natural-‐language statements regarding the relative importance of a criterion can be made: major increase, minor increase, no change, minor decrease, or major decrease. Each statement will affect the criteria weights differently. The weight value of criteria under a new scenario is,
(0)
such that
(0)
where , ( ) are coefficients assigned by decision makers or stakeholders, to define the significance of criteria importance change caused by natural-‐language statements. The recognition and argument that the above mathematics can be adapted to climate change scenarios is the theme of the rest of the paper.
ke
0
0
0
0
0
( ) if statement "major increase" is made ( ) if statement "minor increase" is made
if statement "no change" is made(1/ ) if statement "major decrease" is made(1/ ) if statement "minor decrea
j
j
jjk
j
j
ww
wwww
δ
ε
δ
ε
∝
se" is made
⎧ ⎫⎪ ⎪⎪ ⎪⎪ ⎪⎨ ⎬⎪ ⎪⎪ ⎪⎪ ⎪⎩ ⎭
11
and[0,1]
J
jkj
jk
w
w
=
=
∈
∑
δ δ ε>