assessment of balanced and indigenous populations in … q… · · 2017-08-17assessment of...
TRANSCRIPT

ASSESSMENT OF BALANCED AND INDIGENOUS POPULATIONS IN LAKE WYLIE NEAR ALLEN STEAM STATION
NPDES Permit No. NC0004979
Principal Investigators:
Michael A. Abney John E. Derwort Josh R. Quinn
DUKE ENERGY Environmental Services
McGuire Environmental Center 13339 Hagers Ferry Road
Huntersville, NC 28078
October 2014

THIS PAGE LEFT BLANK INTENTIONALLY

ii
ACKNOWLEDGMENTS The authors wish to express their gratitude to a number of individuals who made significant contributions to this report. First, we are much indebted to the Environmental Monitoring field staff in carrying out a complex, multiple-discipline sampling effort that provides the underpinning of this report. Glenn Long, David Horne, and Courtney Flowe contributed to water quality sample collections. Mark Auten, Kim Baker, David Coughlan, and Bob Doby contributed to fisheries collections and sample processing. Shannon McCorkle and Jan Williams contributed to macroinvertebrate collections and sample processing.
We would also like to thank multiple reviewers including Jason Brown and Tom Thompson.

THIS PAGE LEFT BLANK INTENTIONALLY

iii
TABLE OF CONTENTS
ACKNOWLEDGMENTS .................................................................................... ii LIST OF TABLES .............................................................................................. vii Chapter 1 ......... .................................................................................................... 1-1
STATION BACKGROUND................................................................................................. 1-1
RESERVOIR BACKGROUND ........................................................................................... 1-1
REGULATORY BACKGROUND ...................................................................................... 1-2
Chapter 2 ......... .................................................................................................... 2-1 REGULATORY CONSIDERATIONS ................................................................................ 2-1
METHODS............................................................................................................................ 2-1
RESULTS AND DISCUSSION ........................................................................................... 2-1
Station Operation ............................................................................................................ 2-1
Thermal Compliance ...................................................................................................... 2-2
Meteorology.................................................................................................................... 2-2
Chapter 3 ......... .................................................................................................... 3-1 METHODS AND MATERIALS .......................................................................................... 3-1
RESULTS AND DISCUSSION ........................................................................................... 3-1
Summer Thermal Profiles ............................................................................................... 3-2
Summer DO Profiles ...................................................................................................... 3-3
CONCLUSIONS ................................................................................................................... 3-3
Chapter 4 ......... .................................................................................................... 4-1 MATERIALS AND METHODS .......................................................................................... 4-1
RESULTS AND DISCUSSION ........................................................................................... 4-2
Substrate and Water Quality ........................................................................................... 4-2
Taxa ................................................................................................................................ 4-2
Density ............................................................................................................................ 4-3
Major Taxonomic Groups .............................................................................................. 4-3
CONCLUSIONS ................................................................................................................... 4-5
Chapter 5 ......... .................................................................................................... 5-1

iv
MATERIALS AND METHODS .......................................................................................... 5-1
Spring Electrofishing Surveys ........................................................................................ 5-1
Summer Electrofishing Surveys ..................................................................................... 5-2
Fall Purse Seine Surveys ................................................................................................ 5-2
Balanced and Indigenous Assessment ............................................................................ 5-2
RESULTS AND DISCUSSION ........................................................................................... 5-3
Spring Electrofishing Surveys ........................................................................................ 5-3
Fall Purse Seine Surveys ................................................................................................ 5-5
CONCLUSIONS ................................................................................................................... 5-5
LITERATURE CITED ........................................................................................ 1 APPENDIX APPENDIX A SPRING SEDIMENT AND HEXAGENIA SAMPLING IN
LAKE WYLIE

v
EXECUTIVE SUMMARY
Annual monitoring of physicochemical characteristics and assessments of macroinvertebrates and fish populations at selected locations in Lake Wylie continued through 2013, in accordance with Duke Energy’s agreement with the North Carolina Department of Environment and Natural Resources. This report presents data collected from 2009 through 2013. The objective of this ongoing monitoring program is to assess macroinvertebrate and fish populations with respect to operation of Allen Steam Station (AS) and support renewal of existing thermal limits in the AS National Pollutant Discharge Elimination System (NPDES) permit (NC0004979). During 2009 – 2013, AS operated less frequently than previous baseload periods. The AS generating facility produced electricity 75% of available days January 2009 – December 2013 compared to 99.2% of the available days during 2004 – 2008. The average monthly condenser cooling water (CCW) discharge water temperature ranged from a minimal 16.7 ºC (62 ºF) in February 2009 to a maximum equal to the upper permitted limit, 38.9 ºC (102 ºF), in June 2010, July 2010, August 2010, July 2011, and July 2012. Discharge temperatures followed a regular seasonal pattern and were typical of previously reported CCW discharge data for this facility. The thermal limits of the NPDES permit for AS were not exceeded during the 2009 – 2013 monitoring period. In-situ thermal and dissolved oxygen (DO) profiles were obtained in the vicinity of AS to evaluate potential water quality influences from operation of the CCW system at AS. Thermal profiles at three Lake Wylie locations sampled from surface to bottom indicated temperatures were generally representative of seasonal conditions seen in recent years. Lake Wylie DO profile concentrations were slightly higher than recent 2004 – 2008 historical trends and indicated adequate concentrations of DO were present during mid-summer of each year from 2009 to 2013 for the continued propagation of balanced and indigenous biological populations in Lake Wylie in the vicinity of AS. Generally, the macroinvertebrate data from 2009 to 2013 exhibited similar densities and taxa abundance as seen during previous report periods. Spatial variations in taxa abundance at the three monitoring locations were consistent with historical data and showed no impairment related to the AS thermal effluent. The current study results indicate that, overall, the macroinvertebrate densities and taxa diversity observed during 2009 – 2013 at locations

vi
uplake, downlake, and in the vicinity of AS are indicative of balanced and indigenous macroinvertebrate communities. A diverse fish community was present in the littoral surveys of Lake Wylie near AS from 2009 to 2013. Spring and summer electrofishing surveys documented 35 and 18 species, respectively, both numerically dominated by centrarchids, especially bluegill. Pollution-tolerant species comprised less of the spring AS fish population relative to the reference area, and comprised only 6.7% of individuals collected during summer surveys. The assorted fish species typically found in Lake Wylie near AS encompass multiple trophic guilds (i.e., insectivores, omnivores, and piscivores) supporting a balanced fish community. Non-indigenous species such as green sunfish are abundant near AS, but are also prevalent throughout Lake Wylie. Purse seine surveys from fall 2009 to 2013 indicate that threadfin shad continue to dominate the Lake Wylie forage fish community. Alewife percent contribution has remained relatively low since 2005 and was < 2.0% from 2009 to 2013. Based on the catch per unit effort of littoral fish during spring, total length distributions of resident important species during summer, and the regular availability of forage fish, it is concluded that the thermal discharge of AS has not impaired the Lake Wylie fish community. Ultimately, the collective information presented in this report indicates a balanced and indigenous aquatic population exists in the vicinity of AS. Water quality data reported by other researchers, as well as 2009 – 2013 Duke Energy results associated with AS CCW operation, serve to confirm that Lake Wylie in the vicinity of AS, and as a whole, is capable of sustaining a balanced and indigenous aquatic community. Additionally, comparison of AS operation to environmental monitoring data indicates that balanced and indigenous populations of macroinvertebrates and fish continue to exist in Lake Wylie near AS. These data support a conclusion that the present thermal limits are appropriately protective and should be maintained when the Station NPDES permit is renewed.

vii
LIST OF TABLES
Table Title Page
Table 4-1. General descriptions of the substrate found at Locations A, B, and C in the vicinity of AS from July 2009 to 2013. Substrates are listed with the most prevalent type first. Organic matter is typically composed of small sticks, leaf and/or grass fragments etc. .............................................................................. 4-7
Table 4-2. DO and temperature measured at the time of macroinvertebrate collection from Locations A, B, and C from July 2009 to 2013. .............................................. 4-7
Table 4-3. Macroinvertebrate taxa and densities (No./m2) from Location A (uplake of AS) during summer sampling from 2004 to 2013. .................................................. 4-8
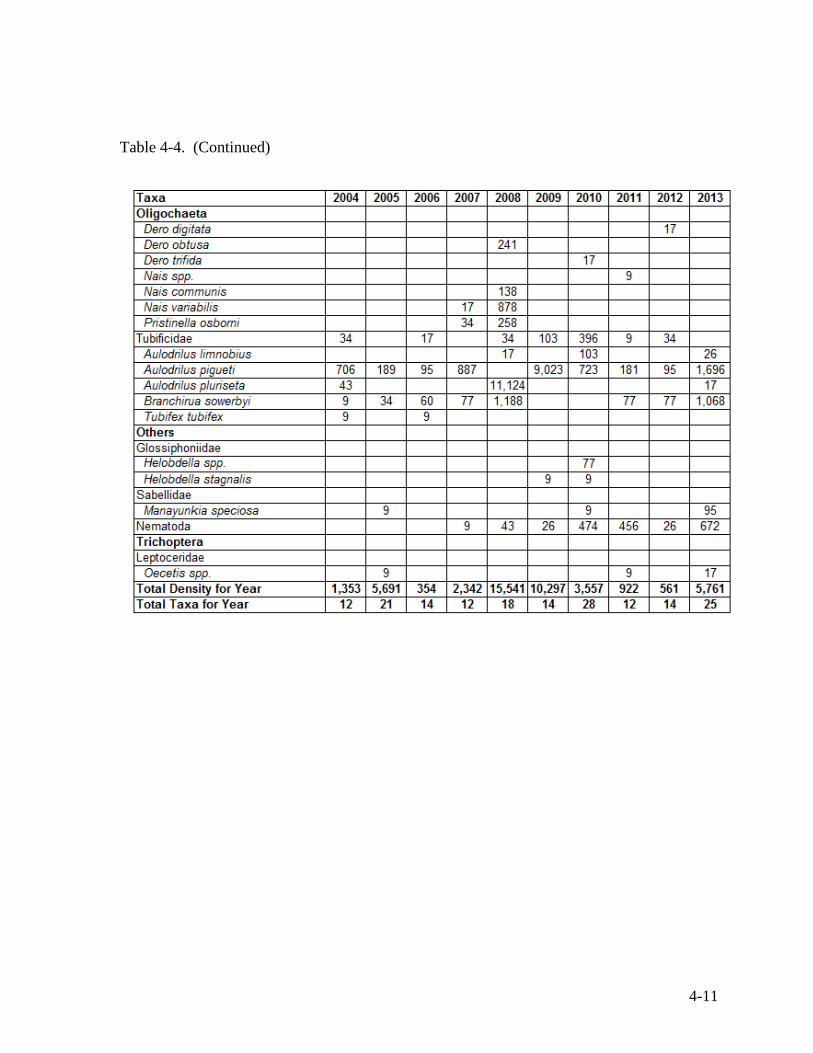
Table 4-4. Macroinvertebrate taxa and densities (No./m2) from Location B (AS discharge) during summer sampling from 2004 to 2013. ................................................ 4-10
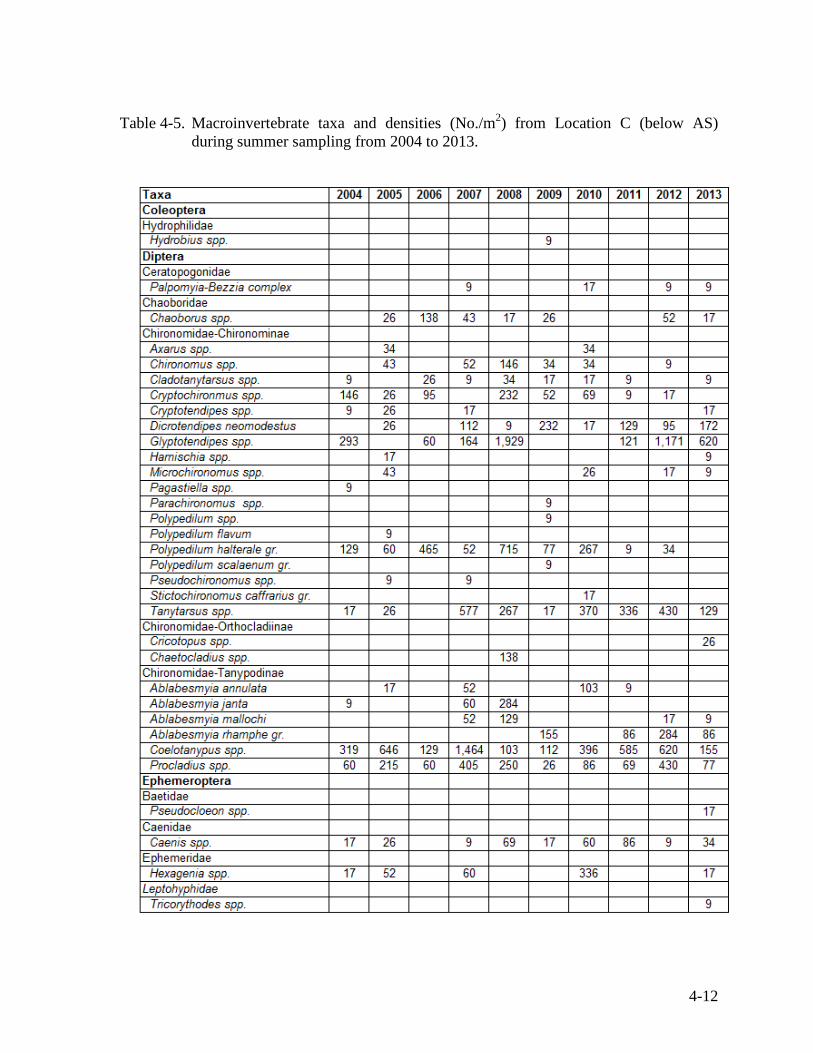
Table 4-5. Macroinvertebrate taxa and densities (No./m2) from Location C (below AS) during summer sampling from 2004 to 2013. ................................................ 4-12
Table 5-1. Total number of individuals, percent composition, and number of species in spring electrofishing surveys from two areas (AS and REF) in Lake Wylie, 1993 – 1997 and 1999, 2000 – 2003, 2004 – 2008, and 2009 – 2013. ............ 5-7
Table 5-2. Total number of individuals, percent composition, and number of species in summer electrofishing surveys from three areas (above, in, and below the discharge canal) near AS in Lake Wylie, 1991 – 1993, 1994 – 1999, 2000 – 2003, 2004 – 2008, and 2009 – 2013. .............................................................. 5-8
Table 5-3. Pelagic forage fish species composition from purse seine surveys in Lake Wylie, 1994 – 2013. ......................................................................................... 5-9

viii
LIST OF FIGURES
Figure Title Page
Figure 1-1. Lake Wylie map with AS and other Duke Energy stations. ............................ 1-4 Figure 2-1. Average monthly AS CCW discharge temperatures displayed over days per
month of generation during 2009 – 2013. ........................................................ 2-4 Figure 2-2. Total daily flow from AS CCW pumps during 2009 – 2013........................... 2-4 Figure 2-3 AS CCW daily average summer intake temperatures for 2009 – 2013 compared
to intake temperatures during the summer of 2007. ........................................ 2-5 Figure 2-4. Monthly average air temperatures calculated from data at a nearby Catawba
Nuclear Station meteorological tower. ............................................................ 2-6 Figure 2-5. Annual total rainfall from a nearby Catawba Nuclear Station meteorological
tower. ............................................................................................................... 2-6 Figure 2-6. Lake Wylie daily lake levels and drawdown 2009 – 2013. ............................. 2-7 Figure 3-1. Water quality sampling locations on Lake Wylie in the vicinity of AS. ......... 3-5 Figure 3-2. Comparison of August 2009 – 2013 Lake Wylie thermal and DO vertical
profiles with historical August data. ................................................................ 3-6 Figure 4-1. Macroinvertebrate sampling locations in the vicinity of AS. ........................ 4-15 Figure 4-2. Total number of taxa collected annually at Locations A, B, and C from Lake
Wylie near AS from 2004 to 2013. ................................................................ 4-16 4-17 Figure 4-3. Mean densities (No./m2) of macroinvertebrates collected annually at Locations
A, B, and C from Lake Wylie near AS from 2004 to 2013. ...................... 4-17 Figure 4-4. Densities (No./m2) of Corbicula, Chironomidae and Oligochaeta collected
annually at Location A from 2004 to 2013. ................................................... 4-18 Figure 4-5. Densities (No./m2) of Corbicula, Chironomidae, and Oligochaeta collected
annually at Location B from 2004 to 2013. ................................................... 4-18 Figure 4-6. Densities (No./m2) of Corbicula, Chironomidae, and Oligochaeta collected
annually at Location C from 2004 to 2013. ................................................... 4-19 Figure 4-7. Densities (No./m2) of Hexagenia collected annually at all locations during the
summer periods of 2004 to 2013. .................................................................. 4-19 Figure 4-8. Densities (No./m2) of Hexagenia collected annually at all locations during the
spring periods of 2010 to 2013. ..................................................................... 4-20 Figure 5-1. Locations associated with spring and summer electrofishing surveys, and fall
purse surveys of Lake Wylie. ........................................................................ 5-10

LIST OF FIGURES
Figures Title Page
ix
Figure 5-2. Total number of fish collected in spring electrofishing surveys from two areas (AS and REF) in Lake Wylie, 1993 – 1997 and 1999 – 2013. ...................... 5-11
Figure 5-3. Biomass of fish collected in spring electrofishing surveys from two areas (AS and REF) in Lake Wylie, 1993 – 1997 and 1999 – 2013. ............................. 5-11
Figure 5-4. Total number of fish species collected in spring electrofishing surveys from two areas (AS and REF) in Lake Wylie, 1993 – 1997 and 1999 – 2013. ...... 5-12
Figure 5-5. Length distribution of bluegill among survey locations in summer electrofishing surveys near AS in Lake Wylie, 2009 – 2013. ....................... 5-12
Figure 5-6. Length distribution of redbreast sunfish among survey locations in summer electrofishing surveys near AS in Lake Wylie, 2009 – 2013. ....................... 5-13
Figure 5-7. Length distribution of largemouth bass among survey locations in summer electrofishing surveys near AS in Lake Wylie, 2009 – 2013. ....................... 5-13

THIS PAGE LEFT BLANK INTENTIONALLY

1-1
CHAPTER 1
INTRODUCTION
STATION BACKGROUND Allen Steam Station (AS) is located on Lake Wylie (Figure 1-1) in Gaston County, North Carolina, southwest of Charlotte. The station is comprised of five fossil-fired steam generating units having a combined nameplate capacity of 1,145 MWE-gross. Units 1 and 2 are currently rated at 165 MW and began commercial operation in 1957. Units 3, 4, and 5 are currently rated at 265 MW, 280 MW, and 270 MW, and began commercial operation in 1959, 1960, and 1961, respectively. The intake structure for once-through condenser cooling water (CCW) is located on the Catawba River arm of Lake Wylie. The CCW system discharges heated effluent into the South Fork Catawba River arm of Lake Wylie via a 1.2-km-long discharge canal. Each steam generating unit has two conventional CCW pumps that can be operated independently. Station operators run either one or two pumps per unit as dictated by intake water temperature, discharge temperature limits, and operational efficiency. The maximum pumping capacity of the 10 CCW pumps is 34.38 m3/s (1,214 cfs). The AS discharge temperature is continuously monitored, and operations are modified as needed to ensure compliance with permitted thermal limits. In the previous permit cycle (2004 – 2008), Duke Energy operated a supplemental cooling system to assist in meeting discharge temperature limits following an exceptionally dry meteorological year in 2007. Operation of a supplemental cooling system was not utilized during the 2009 – 2013 time period.
RESERVOIR BACKGROUND Lake Wylie typically exhibits weak summer thermal stratification, due to the relatively

1-2
lacustrine nature of much of the reservoir, coupled with the routine withdrawal of mid-depth water via Wylie Hydroelectric Station (WHS). At the South Fork River arm confluence with the main channel (Figure 1-1), a mid-summer top to bottom thermal gradient ranging from about 2.5 to 8.0 ºC occurs, depending principally on AS generation, the temporal-spatial dynamics of the station thermal discharge plume, as well as reservoir hydroelectric inflows and outflows. The water quality standard minimum for dissolved oxygen, 4.0 mg/L measured instantaneously, has historically been exceeded near the surface of the reservoir throughout the year, including within the AS thermal plume (Duke Power Company 1976; Duke Power 2004b; Buetow 2008). Historical water quality assessments characterized Lake Wylie as a mesotrophic to eutrophic waterbody (Weiss and Kuenzler 1976; NCDEHNR 1994). Fluctuations in trophic classifications were attributed to temporal variations in meteorological conditions, closely linked to hydroelectric generation and watershed inputs. Inflows from the relatively expansive basin have led to spatial patterns of varying water quality within the reservoir. For example, water quality in the upper Catawba River arm of Lake Wylie has typically been characterized by lower concentrations of dissolved and suspended constituents, including nutrients, than the South Fork Catawba River arm of the reservoir. Exceedances of applicable water quality standards and action levels for chlorophyll a, major nutrients (i.e., total phosphorus, total organic nitrogen, and nitrate-nitrite nitrogen), and fecal coliform bacteria have been observed among various tributary arms receiving inflow from nutrient-impaired streams – most notably Dutchman’s Creek, the South Fork Catawba River arm, Withers cove, and Crowder’s Creek (NCDENR 2008; Buetow 2008).
REGULATORY BACKGROUND The AS station has historically operated, and continues to operate, under a 316(a) thermal discharge variance associated with the Clean Water Act (CWA). Assessment of the potential influence of thermal discharges on biological communities is a key component of thermal discharge variances granted under section 316(a) of the CWA. As defined in 40CFR125.71(c), “The term balanced, indigenous populations…refers to a biotic community typically characterized by diversity, the capacity to sustain itself through cyclic seasonal changes, presence of necessary food chain species and a lack of domination by pollution

1-3
tolerant species. Such a community may include historically non-native species introduced in connection with a program of wildlife management and species whose presence or abundance results from substantial, irreversible environmental modifications” (1972). In pursuance of a 316(a) variance, Duke Power Company developed an initial 316(a) “demonstration” document in 1976 that was submitted to NCDENR. The “demonstration” summarized the state of station operations, water chemistry, and aquatic biology of Lake Wylie in the vicinity of AS during previous AS operational years. The goal of the document was to demonstrate the maintenance of “balanced and indigenous populations” under the baseload AS station operational scheme at that time. The initial 316(a) demonstration was considered adequate by NCDENR to show protection of “balanced and indigenous” biological populations. The thermal discharge from AS was permitted under the 316(a) National Pollutant Discharge Elimination System (NPDES) provisions of the CWA, as authorized by the NCDENR. Subsequently, Pursuant to an agreement with the NCDENR, annual monitoring of macroinvertebrates and fish was implemented in 1990 at selected Lake Wylie locations in the vicinity of AS. The objective of this ongoing monitoring program was to assess macroinvertebrate and fish populations with respect to continued operation of AS, and provide an indication of the suitability of approved thermal limits as defined in the AS NPDES permit. Individual chapters of this report contain methods and location maps associated with fisheries, macroinvertebrates, and water quality portions of this on-going monitoring program. Previous summaries of monitoring in Lake Wylie have established that the existing AS CCW thermal limits incorporating the variance granted under the CWA section 316(a) has assured the protection and propagation of balanced, indigenous populations in Lake Wylie (Duke Power Company 1994; Duke Power 2001a, 2004b; Duke Energy 2009b). This report presents results related to AS operations from data collected since submittal of the previous (2009) summary report and includes data collected from 2009 – 2013. Also, the 2009 – 2013 data are discussed with other environmental monitoring programs conducted in this watershed.

1-4
Figure 1-1. Lake Wylie map with AS and other Duke Energy stations.

2-1
CHAPTER 2
STATION OPERATION REGULATORY CONSIDERATIONS Current National Pollutant Discharge Elimination System (NPDES) (NCDENR 2011a) permitted thermal limits for Allen Steam Station (AS) condenser cooling water (CCW) effluent, based upon an approved 316(a) thermal variance, are: • a monthly average CCW discharge (i.e., end-of-pipe) temperature limit of 35 °C (95 °F)
during October 1 through May 31, and • a monthly average CCW discharge temperature limit of 38.9 °C (102 °F) during June 1
through September 31. METHODS The AS discharge water temperatures were continuously monitored during 2009 – 2013 to assess thermal permit compliance. Thermal compliance data were obtained from NPDES discharge monitoring reports. Additional detailed (hourly) CCW thermal and flow data were from the Duke Energy Plant Information (PI) System. Meteorological data was retrieved from the Duke Energy Air Vision database as recorded at a nearby meteorological tower at Catawba Nuclear Station. RESULTS AND DISCUSSION Station Operation Unlike previous years of continual baseload operation, AS was operated less frequently during 2009 – 2013. One of the five units was in operation on 1,372 of 1,826 available days

2-2
over the 2009 – 2013 time period (75% of available days) compared to the previous 5-year operation period (2004 – 2008) where at least one of the five coal-fired units was generating on 99% of the available days (Figure 2-1; Duke Energy 2009b). Thermal Compliance The CCW discharge flows generally fluctuate seasonally, with AS electrical output, and were managed such that CCW discharge temperatures were maintained at or below NPDES thermal limits during 2009 – 2013 (Figures 2-1 and 2-2). The average monthly CCW discharge water temperature ranged from a minimal 16.7 ºC (62 ºF) in February 2009, to a maximum equal to the upper permitted limit, 38.9 ºC (102 ºF), in June 2010, July 2010, August 2010, July 2011, and July 2012 (Figure 2-1). Discharge temperatures followed a regular seasonal pattern and were typical of previously reported CCW discharge data for this facility (Duke Power Company 1976, 1994; Duke Power 2001a, 2004b, 2009b). From the standpoint of cooling water resources and thermal compliance margins, the summers of 2010 and 2011 proved to be the most challenging summers during the 2009 – 2013 monitoring period, as indicated by elevated summer intake and discharge temperatures, as well as CCW pump flows (Figures 2-1 through 2-3 ). Comparison of mid-summer 2010 and 2011 CCW daily intake temperatures with 2007 summer intake temperatures (the summer of 2007 was the most challenging thermal compliance period for the previous 5-year monitoring period) revealed that 2010 and 2011 daily intake temperatures were among the warmest, and often were warmer than 2007 intake temperatures (Figure 2-3). CCW intake temperatures in 2010 and 2011 reached a maximum daily average of 32.9 ºC (July 26, 2010) and 32.5 ºC (July 25, 2011), compared to the hot drought year of 2007, when intake temperatures reached 32.3 °C on August 10. Meteorology It is important to discuss meteorologically noteworthy years during the 2009 – 2013 period because of the overarching climatological and hydrological effects on station operations (and ultimately, lake temperature patterns). Meteorological and hydrological conditions substantially affect reservoir-wide physicochemical conditions. Rainfall totals affect the amount of water available for generation/releases, and ultimately, affect the balance of water

2-3
maintained in the reservoir at any given time. The amount of water in the reservoir is particularly important to the dissipation and distribution of heat from the thermal loads to the reservoir. During the 2009 – 2013 study period, several meteorologically extreme years were noted. Multiple years experienced air temperatures on a monthly timescale that were repeatedly above historical monthly means. In particular, monthly average air temperatures near AS in the late spring/summer of 2010 and 2011 were among the highest monthly average temperatures on record, for that site. Also, 2012 was considered the warmest year on record for the contiguous United States (National Climatic Data Center 2013) mainly due to an extremely warm winter/spring; however, division of water quality investigators indicated July of 2013 was also the third warmest July on record for the state of North Carolina since 1859 (NCDENR 2013). Conversely, monthly average air temperatures near AS in the spring/summer of 2013 were among the lowest monthly average temperatures at the nearby Catawba Nuclear Station site (Figure 2-4). Annual and spring/summer monthly rainfall totals, specifically in 2010 and 2012, were relatively low in comparison to summer months in other years during the 2009 – 2013 study period. Additionally, annual total rainfall for these years was among the lowest rainfall totals over the 1986 – 2013 period (Figure 2-5). Conversely, annual rainfall totals in 2009, 2011 and 2013 were near or above average for the 1986 – 2012 period with summer month (June and July) precipitation in 2013 being well above average. Lake levels varied seasonally and episodically over the 2009 – 2013 period based on expected rainfall patterns, in response to actual rainfall totals within the watershed, and in response to electrical demand (Figure 2-6).

2-4
Figure 2-1. Average monthly AS CCW discharge temperatures displayed over days per month of generation during 2009 – 2013.
Figure 2-2. Total daily flow from AS CCW pumps during 2009 – 2013.
0
100
200
300
400
500
600
700
800
900
1/1/2009 1/1/2010 1/1/2011 1/1/2012 1/1/2013
CCW
Flo
w (M
GD)
Date

2-5
Figure 2-3 AS CCW daily average summer intake temperatures for 2009 – 2013 compared to intake temperatures during the
summer of 2007.

2-6
Figure 2-4. Monthly average air temperatures calculated from data at a nearby Catawba
Nuclear Station meteorological tower.
Figure 2-5. Annual total rainfall from a nearby Catawba Nuclear Station meteorological
tower.
0
5
10
15
20
25
30
Jan Feb Mar Apr May Jun Jul Aug Sep Oct Nov Dec
Tem
pera
ture
(°C)
Month
2009
2010
2011
2012
2013
Historic Monthly mean 1986 - 2013
0
20
40
60
80
100
120
140
160
1986
1987
1988
1989
1990
1991
1992
1993
1994
1995
1996
1997
1998
1999
2000
2001
2002
2003
2004
2005
2006
2007
2008
2009
2010
2011
2012
2013
Tota
l rai
nfal
l (cm
)
Year

2-7
Figure 2-6. Lake Wylie daily lake levels and drawdown 2009 – 2013.
0
1
2
3
4
5
694
95
96
97
98
99
100
Jan-
09
Apr-
09
Jul-0
9
Oct
-09
Jan-
10
Apr-
10
Jul-1
0
Oct
-10
Jan-
11
Apr-
11
Jul-1
1
Oct
-11
Jan-
12
Apr-
12
Jul-1
2
Oct
-12
Jan-
13
Apr-
13
Jul-1
3
Oct
-13
Lake
Dra
wdo
wn
(ft)
Lake
Lev
el (f
t)
Date

2-8
THIS PAGE LEFT BLANK INTENTIONALLY

3-1
CHAPTER 3
WATER QUALITY MONITORING
METHODS AND MATERIALS To evaluate operation of the Allen Steam Station (AS) condenser cooling water (CCW) system, vertical profiles of temperature and dissolved oxygen (DO) were collected in the winter and summer at three conventional water quality sampling locations in Lake Wylie (Locations 235, 242, and 250; Figure 3-1) that correspond closely with summer electrofishing transects (Figure 4-1) and macroinvertebrate sampling locations (Figure 5-1). Sample locations provided coverage (as ordered above) ranging from the furthest downstream site near the confluence of South Fork and mainstem Catawba Rivers to the furthest upstream site at the AS CCW intake. At each location, thermal and DO vertical profiles were collected in situ with a calibrated Hydrolab DataSonde at near-surface (0.3 m) and 1-m depth increments, to within 0.5 m of bottom. Analyses were performed by Duke Energy Scientific Services personnel.1 Graphical techniques were used to assess selected summer vertical profile data. Additionally, references to data and summaries from other investigators are made, where appropriate. RESULTS AND DISCUSSION In recent years, the North Carolina Division of Water Quality (NCDWQ), Mecklenburg County Department of Environmental Protection, and Duke Energy (NCDENR 2013; Buetow 2013; Duke Energy 2013) researchers have continued to characterize Lake Wylie as mesotrophic/eutrophic. Nutrient inputs from the South Fork Catawba River and other tributaries in the sub-basin, coupled with development in the watershed, continue to 1 The Duke Energy Scientific Services organization is presently certified by the North Carolina Division of Water Quality (DWQ) under the Field Parameter Certification program (certificate number 5193). However, all field chemistry data represented in this report are uncertified data; i.e., not collected for effluent compliance monitoring purposes.

3-2
contribute to elevated nutrient concentrations in Lake Wylie compared to Mountain Island Lake, immediately upstream on the Catawba River. The nutrients supplied to the reservoir continue to provide abundant foundation for primary and secondary production in the reservoir. Summer Thermal Profiles Thermal profiles at all three sampling locations from the 2009 – 2013 period were indicative of the historical Lake Wylie summer thermal patterns reported previously (Duke Power Company 1976; Duke Energy 2009b). The mixed (near isothermal) temperature pattern at the reference location (Location 250) was typical of the riverine nature of Lake Wylie at this location. The near-field location (Location 242) exhibited temperature patterns of a typical thermal plume with warmer, less dense, water near the surface and cooler, more dense water at lower depths. Additionally, the far-field location (Location 235) exhibited the weak stratification pattern typically apparent in the more lacustrine portions of the reservoir. This weak stratification pattern continued to be driven in the 2009 – 2013 period, largely by the AS-heated discharge, climatic conditions, and mid-depth water withdrawals by Wylie Hydroelectric Station (WHS), as reported previously (Duke Energy 2009b). As expected, variability in water temperature within the typical temperature pattern was observed at all locations among the summers of 2009 – 2013 (Figure 3-2) and was closely connected to variability in meteorology. Thermal profiles from the mid-summers of 2009 – 2013 at all three lake water quality sampling locations reflected trends in air temperatures and CCW intake temperatures for those years (see Chapter 2). Like the 2010 summer air temperatures and intake temperatures, summer water temperatures at the three lake locations were elevated, and in some cases, greater than previously measured temperatures (mainly in the middle depths of the reservoir). Mid-depth temperatures in 2012 were also slightly elevated compared to historical data; however, temperatures in the upper portion of the water column at the discharge location (242) remained below historical maximum temperatures for all summer monitoring events from 2009 – 2013. Elevated summer lake profile temperatures were common in other reservoirs in the Catawba River Basin, as well as other North Carolina watershed reservoirs in 2010 (Duke Energy 2011b; NCDENR 2011b). Elevated water temperatures statewide were noted as being

3-3
heavily influenced by meteorological conditions; namely, air temperatures that were persistently above average in the spring to late summer of 2010 (NCDENR 2011b). Mid-depth summer water temperatures at location 235 were also slightly elevated compared to historic temperatures despite water temperatures at the discharge location (242) being within historical ranges (Figure 3-2). As indicated in Chapter 2, air temperatures in late July 2012 were exceedingly above average, as were air temperatures in the preceding winter/spring of 2012. Lake temperatures in August of 2012 were likely influenced by these elevated air temperatures, as evidenced by temperature profiles at the background location (250) relative to profiles from other years during 2009 – 2013. Summer intake temperatures (Figure 2-3) for 2012 were also at maximum levels at the time of lake sampling (August 1) for 2012 and were consistent with temperatures from the background Lake Wylie location (250). Summer DO Profiles The 2009 – 2013 summer dissolved oxygen (DO) profile data exhibited a vertical distribution pattern similar to the historically observed Lake Wylie DO distribution (Figure 3-2). As with temperature profiles, the summer DO profiles exhibited characteristics of both a riverine and lacustrine water body depending upon the monitoring location, meteorological conditions, and water movement in and out of the reservoir. Profile DO values were mostly within the range of previously recorded values, with no measured DO values being less than the historical 1998 – 2008 minimums. Additionally, measured profile DO values during the 2009 – 2013 period indicated Lake Wylie exhibited well-oxygenated waters in the upper portion of the water column, adequate for fish survival, every summer in the vicinity of AS (see Chapter 5). CONCLUSIONS Lake Wylie water quality has, in recent years, been fairly consistent with previous assessments. In somewhat of a contrast to the two Catawba River reservoirs immediately upstream (Lake Norman and Mountain Island Lake), Lake Wylie has an expansive sub-catchment, resulting in significant inflows to the reservoir from a number of nutrient-enriched tributaries. This factor can contribute to an increased element of spatial and

3-4
temporal water quality variability within Lake Wylie, compared to other upstream reservoirs. It also leads to an abundant supply of nutrients for primary and secondary productivity in the reservoir (see Chapter 4 and 5). The reservoir as a whole continues to be classified as a eutrophic/mesotrophic waterbody. Despite meteorologically challenging years in 2010, 2011, and 2012, the effects of AS operational thermal load on the temperature and DO in Lake Wylie during 2009 – 2013 appeared to be similar to previous years when biological communities have been sustained. Although some mid-depth temperatures were slightly above historical values, all temperatures in the upper portion of the reservoir were below historical maximums. Ultimately, water quality monitoring conducted by Duke Energy Environmental Services Personnel, and water quality data reported by other researchers during 2009 – 2013, indicate that Lake Wylie in the vicinity of AS, and as a whole, continues to exhibit water quality conditions fairly consistent with historical observations. These conditions have been, and should continue to be, conducive to sustaining a balanced and indigenous aquatic biological community.

3-5
Figure 3-1. Water quality sampling locations on Lake Wylie in the vicinity of AS.

3-6
Figure 3-2. Comparison of August 2009 – 2013 Lake Wylie thermal and DO vertical profiles with historical August data.
0
2
4
6
8
10
12
14
20 22 24 26 28 30 32 34 36 38 40 42D
epth
(m)
Temperature (°C)
min 1998 - 2008
max 1998 - 2008
2009
2010
2011
2012
2013
Location 250
0
2
4
6
8
10
12
14
20 22 24 26 28 30 32 34 36 38 40 42
Dep
th (m
)
Temperature (°C)
min 1998 - 2008
max 1998 - 2008
2009
2010
2011
2012
2013
Location 242
0
2
4
6
8
10
12
14
20 22 24 26 28 30 32 34 36 38 40 42
Dep
th (m
)
Temperature (°C)
min 1998 - 2008
max 1998 - 2008
2009
2010
2011
2012
2013
Location 235
0
2
4
6
8
10
12
14
0 1 2 3 4 5 6 7 8 9 10
Dep
th (m
)
Dissolved Oxygen (mg/L)
min 1998 - 2008
max 1998 - 2008
2009
2010
2011
2012
2013
Location 250
0
2
4
6
8
10
12
14
0 1 2 3 4 5 6 7 8 9 10
Dep
th (m
)
Dissolved Oxygen (mg/L)
min 1998 - 2008
max 1998 - 2008
2009
2010
2011
2012
2013
Location 242
0
2
4
6
8
10
12
14
0 1 2 3 4 5 6 7 8 9 10
Dep
th (m
)
Dissolved Oxygen (mg/L)
min 1998 - 2008
max 1998 - 2008
2009
2010
2011
2012
2013
Location 235

4-1
CHAPTER 4
MACROINVERTEBRATES
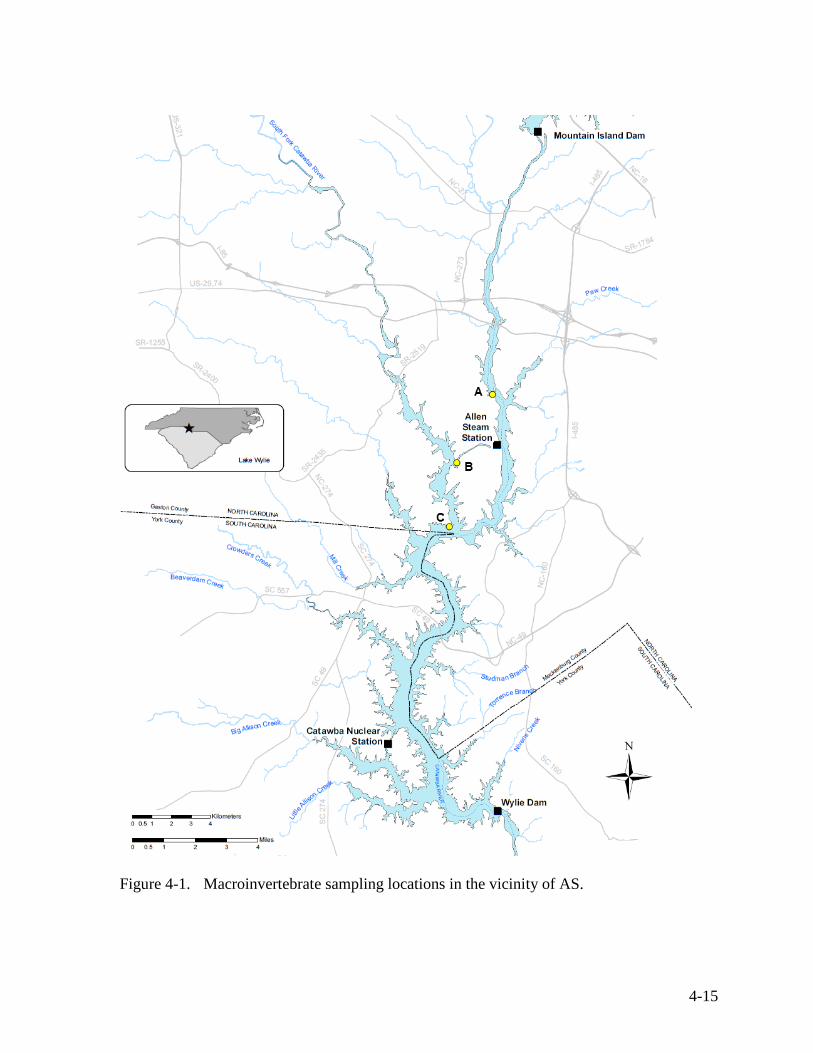
MATERIALS AND METHODS Benthic macroinvertebrate sampling was conducted annually in late July (Table 4-1) each year from 2009 to 2013, as part of the continued monitoring program for Allen Steam Station (AS). As in previous years, samples were collected from three locations in Lake Wylie: Location A, a reference site uplake of AS; Location B, a near-field site in the mouth of the AS discharge canal; and Location C, a far-field site downlake of AS at the confluence of the South Fork Catawba River and the Catawba River (Figure 4-1). A petite Ponar dredge was used to collect five sample replicates at each location. Samples were collected at depths ranging from 2 m to 3 m to bracket the depth of peak benthic abundance (Brinkhurst 1974). Samples were washed through a 500-µm mesh sieve and individually preserved with 70% ethanol containing rose bengal stain. The substrate of each replicate was identified, based on a visual analysis of substrate types during the sieving process, and the resulting data were recorded. Organisms were sorted in the laboratory and identified to the lowest practicable taxon. Beginning in 2001, Oligochaeta, which were only identified to taxonomic order in previous study years, were identified to genus and species. Macroinvertebrate densities were expressed in numbers/m2 bottom area. The assessment of the balanced and indigenous nature of the benthic community was determined by comparing macroinvertebrate densities and taxa abundance among the three sample locations. At the request of the North Carolina Department of Environment and Natural Resources (NCDENR) (letter dated January 13, 2010), Duke Energy personnel initiated specific sampling for Hexagenia. Sampling began in the spring (April) of 2010 and has been conducted annually each spring through 2013. In addition to Hexagenia sampling, an analytical assessment of substrates at Lake Wylie locations was conducted in 2010. Methods and results for both Hexagenia and sediment sampling are presented in Appendix A.

4-2
Beginning in 2005, in conjunction with macroinvertebrate sampling, a pre-calibrated YSI Model 55 handheld dissolved oxygen (DO) meter was used to measure water temperature and DO just above the sediment at each location. Starting in 2008, water temperatures and DO values were measured in situ, using a pre-calibrated Hach® HQ40d water quality meter. RESULTS AND DISCUSSION Substrate and Water Quality Upon visual assessment, substrates typically consisted of varying proportions of silt, sand, and organic matter. Locations A and B had primarily silt-dominated substrates, with lesser amounts of organic matter and sand (Table 4-1). Location C substrates were variously dominated by all three types during successive years of sampling. Substrate composition at Lake Wylie locations, based on visual assessments, has essentially been the same since sampling was initiated (Duke Power 2004; Duke Energy 2009c). At the request of NCDENR, an analytical assessment of substrates at Lake Wylie locations was undertaken. Results indicated that substrate from Location A consisted of fine sand particles with a large proportion of silt and very fine sand (Appendix A). At Locations B and C, the bulk of sediments consisted of material ranging from fine to coarser sand and smaller amounts of silt. The DO concentrations were generally highest at Location A, with minimum values most often recorded from Location C. Maximum temperatures consistently occurred at Location B near the AS discharge, with minimum temperatures observed most often at Location A, upstream of AS (Table 4-2). Taxa The number of different macroinvertebrate taxa collected at a location is often an indicator of the overall diversity of a community and can signify the presence of a balanced indigenous population. Taxa numbers during 2009 ‒ 2013 varied temporally and spatially (numbers ranged from 12 to 32) and total taxa numbers were somewhat higher during 2009 ‒ 2013 than during 2004 ‒ 2008 (Tables 4-3 through 4-5 and Figure 4-2). Numbers at all locations appeared to show a decline from 2009 through 2011, and then an increase through 2013. Maximum taxa numbers most often occurred at Location A, with minima most often

4-3
recorded from Location B near the discharge. Density During 2009 – 2013, overall mean macroinvertebrate densities, expressed as numbers/m2, varied substantially among years and locations. High spatial and temporal variability are characteristic of macroinvertebrate communities in North Carolina piedmont reservoirs (Duke Energy 2009a, 2009b, 2009c, 2011a). The difference between minimum and maximum densities during 2009 ‒ 2013 ranged up to over 20 times. Total densities were within historical ranges and averaged about the same as those of 2004 ‒ 2008 (Figure 4-3). Densities at Location A showed an overall decline from 2009 through 2013, while densities at Location B showed a decline from 2009 through 2012, and then a sharp increase in 2013. Densities at Location C showed the opposite trend with increasing values through 2012, followed by a decline in 2013 (Tables 4-3 through 4-5 and Figure 4-3). Spatially, maximum densities were most often observed at Location C (2010 through 2012), while Location B demonstrated maxima in 2009 and 2013. Minimum densities were recorded from Location A in 2012 and 2013, Location B in 2011 and 2012, and Location C in 2009 (Figure 4-3). Considering the visual determinations of substrate composition among the three locations (Table 4-1), as well as results of the analyses performed in 2010 (Appendix A), the observed spatial differences in total density may not be specifically attributed to substrate habitat. Nutrient availability may be responsible for much of the observed variability. The South Fork Catawba River, a tributary characteristically known for nutrient levels higher than those of the Catawba River arm (see Chapter 3), may provide nutrient enrichment and resulting higher productivity at Location C, at the confluence of the South Fork arm and the Catawba River. Variability observed at Location B may have been due to comparatively high temperatures at the mouth of the discharge (Table 4-2). Major Taxonomic Groups Considerable variability was observed among major taxonomic groups, particularly the Oligochaeta, Chironomidae, and Corbicula. Oligochaetes were represented by 15 taxa among Lake Wylie locations during 2009 ‒ 2013. Oligochaeta densities during 2009 ‒ 2013 ranged over two orders of magnitude from minimum to maximum (Tables 4-3 through 4-5 and Figures 4-4 through 4-6). Oligochaetes were dominant in Lake Wylie macroinvertebrate

4-4
samples approximately two-thirds of the time and comprised the major portions of populations at Locations B and C and were typically observed to have the highest densities at Location C. At all locations, the majority of oligochaetes were tubificids. Milligan (1997) stated that Tubificidae frequently form dense populations in organically enriched habitats with a silty or muddy substrates tending toward anoxic conditions. The sediment types at Locations B and C (Table 4-1, Appendix A), as well as the organic enrichment characteristic of the South Fork Catawba River, contributed to increased oligochaeta populations at Locations B and C as opposed to Location A. At Location A, oligochaeta densities showed a sharp increase in 2010, followed by an equally dramatic decline in 2011. Densities then increased though 2012 and declined slightly in 2013 (Figure 4-4). At Location B, oligochaeta densities declined from 2009 through 2012, and then increased sharply in 2013 (Figure 4-5). At Location C, oligochaeta densities demonstrated an overall increase from 2009 through 2012, and then decreased by 75% in 2013 (Figure 4-6). These trends tended to spatially mirror the temporal trends observed among total densities (Figure 4-3). Chironomidae are among the most ubiquitous and wide-spread families of aquatic macroinvertebrates, and are found in a wide variety of habitats. Chironomids were represented by between 20 and 27 taxa and were dominant in approximately one-third of the samples collected during 2009 ‒ 2013 (Tables 4-3 through 4-5 and Figures 4-4 through 4-6). Densities of chironomids ranged up to nearly 30 times from minimum to maximum during 2009 ‒ 2013. Chironomids were generally more abundant at Lake Wylie locations during 2009 ‒ 2013 than during the previous five-year period. They were typically the most abundant macroinvertebrates observed at Location A and often demonstrated high densities at Location C (Table 4-3 and Figure 4-4). At Location A, chironomids demonstrated a marked decline from 2009 through 2012, and then increased slightly during 2013 (Figure 4-4). Chironomid densities at Location B increased from 2009 to 2010, and then declined through 2011 (Figure 4-5). Densities increased through 2012, followed by a dramatic increase to the five-year peak at Location B in 2013. At Location C, chironomid densities showed an overall increase from 2009 through 2012, and then declined by 60% from 2012 through 2013 (Figure 4-6). No consistent patterns of temporal abundance of Corbicula at Lake Wylie locations were apparent due to extreme variability. Corbicula densities ranged nearly 70 times from minimum to maximum during 2009 ‒ 2013. Location C most often demonstrated higher densities than other locations (Tables 4-3 through 4-5 and Figures 4-4 through 4-6). At

4-5
Location A, overall abundance during 2009 ‒ 2013 was higher than during 2004 ‒ 2008 (Table 4-3 and Figure 4-4). At Location A, Corbicula showed an overall increase from 2009 through 2011, followed by a decline in 2012 and a slight increase in 2013. At Location B, Corbicula densities were extremely low throughout 2009 ‒ 2013 and an overall increase was observed between 2009 and 2013 (Table 4-4 and Figure 4-5). Corbicula densities at Location C showed a dramatic increase from 2009 to 2010, and then gradually declined through 2013 (Table 4-5 and Figure 4-6). Summer populations of Hexagenia showed considerable variability and densities during 2009 ‒ 2013 and were considerably higher than those of 2004 ‒ 2008 (Tables 4-3 through 4-5 and Figure 4-7). The highest summer densities of Hexagenia were typically observed at Location A, although during 2010 a high density was recorded from Location B. The presence and abundance of mayflies were irregular Locations B and C. Hexagenia typically prefer the finer sediments, cooler temperatures, and higher DOs observed at Location A (Tables 4-1 and 4-4, Appendix A). Summer Hexagenia densities at Location A peaked in 2011, and then declined through 2013. During spring periods of 2010 ‒ 2013, Hexagenia were never collected from Location C and small numbers were collected from Location B in 2010 and 2012 (Figure 4-8). Spring Hexagenia densities peaked at Location A in 2011, while similar numbers were collected at this location in 2010, 2012, and 2013. Based on sediment analyses during 2010 and temperature and DO data (Appendix A and Table 4-2), conditions at Location A appeared to be more suitable for Hexagenia than at Locations B and C. CONCLUSIONS The observed variability in Lake Wylie macroinvertebrate density and taxa numbers is indicative of the general variability of reservoir macroinvertebrate data. This variability is an important consideration when comparing density data among years and locations and assessing community changes relative to natural variability and potential operational impacts. The data for the current study generally exhibited somewhat higher taxa numbers and similar densities as reported during the previous period. Taxa numbers at most locations tended to decline from 2009 through 2011, and then increase through 2013. Consistent spatial trends of taxa numbers and total densities were difficult to discern; however, maximum taxa numbers and densities were most often recorded from Locations A and C, respectively, while
4-6
minimum taxa numbers were most often recorded from Location B. No consistent spatial trends of minimum densities were observed. Oligochaetes and chironomids were the most abundant forms observed at Lake Wylie locations, with oligochaetes being most abundant at Location C, while chironomids were dominant at Location A. The vast majority of oligochaetes were tubificids. The sediment types at Locations B and C, as well as the possible higher organic enrichment in the South Fork and adjacent confluence area as compared to the reference location, would likely facilitate increased oligochaete populations at these locations. Temporal trends among oligochaetes and chironomids varied from location to location, while spatial trends varied from year to year. Corbicula densities were typically highest at Location C and no consistent temporal trends among Corbicula were observed during 2009 ‒ 2013. Hexagenia densities during summer periods of 2009 ‒ 2013 were much higher than those recorded in the previous five-year period and mayflies were generally most abundant at Location A. Hexagenia were also most abundant at Location A during spring Hexagenia sampling since 2010. High abundances of Hexagenia at Location A were likely due to a combination of sediment types and water quality conditions. Previous and current study results indicated that the macroinvertebrate densities and taxa diversity observed during 2009 – 2013 at locations uplake, downlake and in the vicinity of AS are indicative of balanced and indigenous macroinvertebrate communities. Thermal effluents from AS have not impaired macroinvertebrate communities in Lake Wylie.

4-7
Table 4-1. General descriptions of the substrate found at Locations A, B, and C in the vicinity of AS from July 2009 to 2013. Substrates are listed with the most prevalent type first. Organic matter is typically composed of small sticks, leaf and/or grass fragments etc.
Year Location A Location B Location C
2009 silt
organic matter sand
silt organic matter
sand
silt organic matter
2010 silt
organic matter
silt sand
organic matter
sand silt
organic matter
2011 silt
organic matter sand
sand silt
organic matter
organic matter silt
sand
2012 silt
sand organic matter
silt sand
organic matter
silt organic matter
sand
2013 silt
sand silt
sand organic matter
silt sand
Table 4-2. DO and temperature measured at the time of macroinvertebrate collection from
Locations A, B, and C from July 2009 to 2013.
Year Location A Location B Location C
2009 7.16 mg/L 27.0 °C
7.01 mg/L 29.1 °C
6.17 mg/L 28.5 °C
2010 7.26 mg/L 31.4 °C
6.6 mg/L 37.2 °C
5.95 mg/L 32.7 °C
2011 7.40 mg/L 30.2 °C
7.22 mg/L 34.7 °C
7.24 mg/L 30.1 °C
2012 7.30 mg/L 30.4 °C
7.00 mg/L 34.0 °C
6.28 mg/L 31.5 °C
2013 6.37 mg/L 27.5 °C
6.74 mg/L 32.4 °C
7.65 mg/L 30.8 °C

4-8
Table 4-3. Macroinvertebrate taxa and densities (No./m2) from Location A (uplake of AS) during summer sampling from 2004 to 2013.

4-9
Table 4-3. (Continued)

4-10
Table 4-4. Macroinvertebrate taxa and densities (No./m2) from Location B (AS discharge) during summer sampling from 2004 to 2013.
4-11
Table 4-4. (Continued)
4-12
Table 4-5. Macroinvertebrate taxa and densities (No./m2) from Location C (below AS) during summer sampling from 2004 to 2013.

4-13
Table 4-5. (Continued)

4-14
Table 4-5. (Continued)
4-15
Figure 4-1. Macroinvertebrate sampling locations in the vicinity of AS.

4-16
Figure 4-2. Total number of taxa collected annually at Locations A, B, and C from Lake Wylie near AS from 2004 to 2013.

4-17
Figure 4-3. Mean densities (No./m2) of macroinvertebrates collected annually at Locations A, B, and C from
Lake Wylie near AS from 2004 to 2013.

4-18
Figure 4-4. Densities (No./m2) of Corbicula, Chironomidae and Oligochaeta collected
annually at Location A from 2004 to 2013.
Figure 4-5. Densities (No./m2) of Corbicula, Chironomidae, and Oligochaeta collected
annually at Location B from 2004 to 2013.

4-19
Figure 4-6. Densities (No./m2) of Corbicula, Chironomidae, and Oligochaeta collected
annually at Location C from 2004 to 2013.
Figure 4-7. Densities (No./m2) of Hexagenia collected annually at all locations during the
summer periods of 2004 to 2013.

4-20
Figure 4-8. Densities (No./m2) of Hexagenia collected annually at all locations during the
spring periods of 2010 to 2013.

5-1
CHAPTER 5
FISH
MATERIALS AND METHODS Spring Electrofishing Surveys Annual (2009 – 2013; current NPDES permit cycle) boat electrofishing surveys were continued in Lake Wylie in March or April at two areas: in the South Fork Catawba River near the thermal influence of Allen Steam Station (AS; Figure 5-1) and at a reference area (REF) in the Catawba River located between AS and Catawba Nuclear Station. Ten 300-m shoreline transects were surveyed in each area and were identical to historical locations surveyed since 1993. Transects included littoral habitats representative of those found in Lake Wylie. All sampling was conducted when surface water temperatures were expected to be 15 – 20 °C. Stunned fish were collected by two netters and identified to species. Fish were enumerated and weighed in aggregate by taxon, except for spotted bass (Micropterus punctulatus) and largemouth bass (M. salmoides), where total length (TL, mm) and weight (g) were obtained for each individual collected. Surface water temperature (°C) was measured with a calibrated thermistor at each transect. Annual catch per unit effort (CPUE per 100 m) was determined by area for number of individuals, biomass, and number of species collected. Condition (Wr) based on relative weight was calculated for spotted bass and largemouth bass ≥ 150 mm TL, using the formula Wr = (W/Ws) x 100, where W = weight of the individual fish and Ws = length-specific mean weight for a fish as predicted by a weight-length equation for each species (Neumann et al. 2012). Resulting metrics were compared between areas using a t-test (P < 0.05).

5-2
Summer Electrofishing Surveys Annual (2009 – 2013) boat electrofishing surveys were continued in Lake Wylie in July or August near the thermal influence of AS. Six 100-m shoreline transects were surveyed to represent three areas (Figure 5-1): two transects above the AS intake canal (A), two in the discharge canal (B), and two below the discharge canal (C). Transects were identical to historical locations surveyed since 1991 and independent of spring transects. Surface water temperature and dissolved oxygen (DO, mg/L) were measured with a calibrated thermistor and DO probe, respectively, at each location. Stunned fish were collected by two netters, identified to species, and measured for TL. Representative and Important Species (RIS) were selected based upon abundance, distribution, and ecological significance as a prey (bluegill [Lepomis macrochirus] and redbreast sunfish [L. auritus]) or predator (largemouth bass) species. Fall Purse Seine Surveys Species composition and size distribution of pelagic forage fish in the Lake Wylie epilimnion were determined annually in mid-September. Purse seine sample techniques were used at midlake (Figure 5-1; near Crowders Creek) and downlake (near Wylie Hydroelectric Station) areas in water deep enough for unhindered net deployment (Hayes et al. 2012). The purse seine measured 122.0 x 9.1 m, with a mesh size of 4.8 mm. A subsample of forage fish collected from each area was used to estimate taxa composition and TL size distribution. Balanced and Indigenous Assessment Annual surveys are used to assess the balanced and indigenous nature of the Lake Wylie fish community and provide information relative to the potential thermal influence of AS. The assessment includes comparisons of spring electrofishing CPUE (spatially and temporally) and of summer electrofishing RIS length distributions. Results from both seasonal surveys were examined according to species pollution tolerance and trophic guild. Purse seine surveys of pelagic forage fish were examined for trends.

5-3
RESULTS AND DISCUSSION Spring Electrofishing Surveys Spring electrofishing surveys from 2009 to 2013 were conducted at average water temperatures ranging from 18.0 to 22.5 °C. Surveys resulted in the collection of 24,703 individuals comprising 34 species at the AS area and 20,592 individuals comprising 26 species at the REF area (Table 5-1). The number of individuals per 100 m ranged from 139.7 to 197.6 at the AS area and from 96.5 to 192.1 at the REF area (Table 5-1 and Figure 5-2). Fish biomass per 100 m ranged from 9.7 to 16.0 kg at the AS area and from 8.0 to 14.3kg at the REF area (Figure 5-3). The number of species per 100 m ranged from 17 to 25 at the AS area and from 16 to 22 at the REF area (Figure 5-4). Since 1993, the number of individuals, biomass, and number of species collected from the AS area were significantly greater than those from the REF area. When limited to the current permit cycle (2009 – 2013), only the biomass collected from the AS area was significantly greater than from the REF area. The number of species from the AS area was either equal to (2009) or greater than (2010 – 2013) values from the REF area, although not statistically significant (t-test; P = 0.06). The number of individuals in spring electrofishing surveys from 2009 to 2013 was dominated by centrarchids (AS-79.9%, REF-90.3%; Table 5-1), followed by clupeids (AS-14.5%, REF-6.6%), cyprinids (AS-3.0%, REF-2.0%), and ictalurids (AS-1.4%, REF-0.9%). Spotted bass were collected for the first time during spring electrofishing surveys (REF in 2010, AS in 2011). Green sunfish (Lepomis cyanellus) exhibited a considerable (and similar) increase in relative abundance at both areas compared to the 2004 – 2008 study period. Overall, current species composition data are similar to previously reported spring electrofishing data near AS (Duke Power 2001a, 2004b; Duke Power Company 1994; Duke Energy 2009b) and from other Catawba River reservoirs (Duke Power 1999, 2001b, 2004a, 2004c; Duke Energy 2009a, 2009c). Species considered pollution tolerant for wadeable stream assessments (e.g., longnose gar [Lepisosteus osseus], goldfish [Carassius auratus], common carp [Cyprinus carpio], golden shiner [Notemigonus crysoleucas], white catfish [Ameiurus catus], redbreast sunfish, green sunfish, and hybrid sunfish; NCDENR 2013b) represented 5.9% of AS and 12.9% of REF individuals during spring 2009 – 2013. This percent representation was an increase from

5-4
spring 2004 – 2008 (AS-4.0%, REF-5.6%) and spring 2000 – 2003 (AS-4.1%, REF-6.2%) due to an increased abundance of redbreast and green sunfish. Species considered insectivorous for wadeable stream assessments (NCDENR 2013) represented 74.1% of AS and 83.7% of REF from 2009 to 2013. Species considered piscivorous (AS-8.4%, REF-8.3%) and omnivorous (AS-17.4%, REF-8.0%) also reflected similar guild contributions when comparing areas from 2009 to 2013. Largemouth bass from AS (91.6) had a higher mean Wr than from REF (89.6), although not statistically significant. Summer Electrofishing Surveys Summer electrofishing surveys from 2009 to 2013 resulted in the collection of 3,352 individuals comprising six families, 18 species, and one hybrid centrarchid combination (Table 5-2). The species composition for the combined summer electrofishing surveys was dominated by centrarchids (94.7%) followed by clupeids (3.5%). The remaining families represented less than 1.0% of individuals each. Previously reported summer data also documented dominance by centrarchids during summer 2004 – 2008 (89.1%) and 2000 – 2003 (74.0%). Spotted bass were collected for the first time during summer electrofishing surveys in 2013 from the area above the AS intake canal. Overall, current CPUE and species composition data are similar to previously reported summer electrofishing data near AS (Duke Power 2001a, 2004b; Duke Power Company 1994; Duke Energy 2009b) and from other Catawba River reservoirs (Duke Power 1999, 2001b, 2004a, 2004c; Duke Energy 2009a, 2009c). Pollution-tolerant species represented 6.7% of the collected fish during summer 2009 – 2013 surveys, similar to summer 2004 – 2008 (6.7%) and summer 2000 – 2003 (7.4%). Insectivorous (90.7%), piscivorous (5.0%), and omnivorous (4.3%) species from 2009 to 2013 surveys had guild contributions similar to summer 2004 – 2008 (84.8%, 7.5%, 7.7%), respectively. Summer 2000 – 2003 had a similar representation of piscivores (4.4%), although fewer bluegill and more threadfin shad contributed to lower insectivore (75.0%) and higher omnivore (20.6%) representation, respectively. The TL distributions of RIS (i.e., bluegill, redbreast sunfish, and spotted bass) during summer 2009 – 2013 surveys (Figures 5-5 to 5-7) indicated successful reproduction and multiple age groups from above, in the vicinity of, and below the AS discharge canal.

5-5
However, the area in the discharge canal maintained considerably lower numbers of fish during the summer likely due to the localized impact of the AS thermal discharge (as high as 41.6 °C; annual DO was 6.4 mg/L or higher). Fall Purse Seine Surveys Threadfin shad (Dorosoma petenense) continued to dominate annual purse seine surveys of the Lake Wylie forage fish community from 2009 to 2013, comprising 97.9 – 100.0% of fish collected (Table 5-3). Alewife (Alosa pseudoharengus), first detected in low numbers in Lake Wylie in 2001, have comprised as much as 10.6% (2004) of mid-September pelagic forage fish surveys, but percent contribution has remained relatively low since 2005 and was < 2.0% from 2009 to 2013. CONCLUSIONS A diverse fish community was present in the littoral surveys of Lake Wylie near AS from 2009 to 2013. Spring and summer electrofishing documented 35 and 22 species, respectively, both numerically dominated by centrarchids, especially bluegill. Pollution-tolerant species comprised less of the spring AS fish population (5.9%) relative to the REF area (12.9%), and comprised only 6.7% of individuals collected during summer surveys. The assorted fish species typically found in Lake Wylie near AS encompass multiple trophic guilds (i.e., insectivores, omnivores, and piscivores) supporting a balanced fish community. Non-indigenous species such as green sunfish are abundant near AS, but are also prevalent throughout Lake Wylie. Purse seine surveys from 2009 to 2013 indicate that threadfin shad continue to dominate the Lake Wylie forage fish community. Alewife percent contribution has remained relatively low since 2005 and was < 2.0% from 2009 to 2013. Past studies have indicated that a balanced indigenous fish community exists near AS (Duke Power 2001a, 2004b; Duke Power Company 1994; Duke Energy 2009b). The present study adds more years of comparable data, reinforcing that conclusion. Based on the CPUE of littoral fish during spring, TL distributions of RIS during summer, and the regular availability

5-6
of forage fish, it is concluded that the thermal discharge of AS has not impaired the Lake Wylie fish community.

5-7
Table 5-1. Total number of individuals, percent composition, and number of species in spring electrofishing surveys from two areas (AS and REF) in Lake Wylie, 1993 – 1997 and 1999, 2000 – 2003, 2004 – 2008, and 2009 – 2013.
Scientif ic name Common name No. % No. % No. % No. % No. % No. % No. % No. %Lepisosteidae Lepisosteus osseus Longnose gar 2 0.01% 1 0.00% 3 0.01% 6 0.02% 2 0.01%Clupeidae Alosa pseudoharengus Alew ife 1 0.00% 10 0.04% Dorosoma cepedianum Gizzard shad 872 5.45% 1,356 10.75% 529 2.43% 430 2.45% 305 1.14% 247 1.10% 862 3.49% 339 1.65% Dorosoma petenense Threadfin shad 894 5.58% 2 0.02% 2,155 9.88% 521 2.97% 4,737 17.72% 868 3.86% 2,714 10.99% 1,020 4.95%Cyprinidae Carassius auratus Goldfish 1 0.00% Ctenopharyngodon idella Grass carp 1 0.00% 1 0.00% Cyprinella chloristia Greenfin shiner 4 0.02% 15 0.12% 5 0.02% 99 0.56% 26 0.10% 235 1.05% 3 0.01% 59 0.29% Cyprinella nivea Whitefin shiner 37 0.23% 157 1.25% 167 0.77% 296 1.69% 387 1.45% 629 2.80% 324 1.31% 247 1.20% Cyprinus carpio Common carp 136 0.85% 33 0.26% 67 0.31% 5 0.03% 138 0.52% 6 0.03% 123 0.50% 5 0.02% Cyprinus carpio Koi 1 0.00% Carassius auratus x Cyprinus carpio Goldfish x common carp hybrid 4 0.02% Hybognathus regius Eastern silvery minnow 1 0.01% 19 0.09% 47 0.18% 1 0.00% 39 0.16% Nocomis leptocephalus Bluehead chub 1 0.00% Notemigonus crysoleucas Golden shiner 42 0.26% 2 0.02% 9 0.04% 4 0.02% 157 0.59% 11 0.05% 250 1.01% 5 0.02% Notropis hudsonius Spottail shiner 2 0.01% 8 0.03% 20 0.09% 2 0.01% 83 0.40% Notropis procne Sw allow tail shiner 8 0.04% 1 0.00% Notropis scepticus Sandbar shiner 1 0.00% Pimephales promelas Fathead minnow 1 0.00% 1 0.01% 1 0.00%Catostomidae Carpiodes cyprinus Quillback 2 0.01% 5 0.04% 4 0.02% 4 0.01% 8 0.03% 1 0.00% Catostomus commersoni White sucker 3 0.02% 1 0.00% 2 0.01% 2 0.01% 2 0.01% Erimyzon oblongus Creek chubsucker 5 0.03% Ictiobus bubalus Smallmouth buffalo 3 0.01% Moxostoma collapsum Notchlip redhorse 2 0.01% 5 0.02% Moxostoma macrolepidotum Shorthead redhorse 1 0.00% 5 0.02% 3 0.01% Moxostoma sp. Brassy jumprock 1 0.01%Ictaluridae Ameiurus brunneus Snail bullhead 1 0.00% Ameiurus catus White catf ish 1,354 8.46% 887 7.03% 581 2.66% 506 2.89% 156 0.58% 182 0.81% 16 0.06% 107 0.52% Ameiurus nebulosus Brow n bullhead 4 0.02% 1 0.00% 1 0.00% 1 0.00% Ameiurus platycephalus Flat bullhead 1 0.01% 2 0.01% 1 0.01% Ictalurus furcatus Blue catf ish 3 0.01% Ictalurus punctatus Channel catf ish 47 0.29% 26 0.21% 219 1.00% 49 0.28% 343 1.28% 37 0.16% 320 1.30% 85 0.41% Pylodictis olivaris Flathead catf ish 5 0.02%Poeciliidae Gambusia holbrooki Eastern mosquitofish 1 0.01% 1 0.00% 1 0.01% 19 0.07% 2 0.01% 2 0.01%Moronidae Morone americana White perch 24 0.11% 114 0.43% 1 0.00% 230 0.93% 5 0.02% Morone chrysops White bass 26 0.16% 4 0.03% 12 0.06% 1 0.00% Morone saxatilis Striped bass 1 0.00%Centrarchidae Lepomis auritus Redbreast sunfish 363 2.27% 389 3.09% 191 0.88% 540 3.08% 239 0.89% 632 2.81% 151 0.61% 1,506 7.31% Lepomis cyanellus Green sunfish 3 0.01% 10 0.06% 259 0.97% 397 1.77% 829 3.36% 975 4.73% Lepomis gibbosus Pumpkinseed 327 2.04% 81 0.64% 219 1.00% 64 0.36% 154 0.58% 18 0.08% 447 1.81% 18 0.09% Lepomis gulosus Warmouth 156 0.97% 267 2.12% 249 1.14% 379 2.16% 298 1.11% 756 3.36% 149 0.60% 302 1.47% Lepomis hybrid Hybrid sunfish 27 0.17% 10 0.08% 30 0.14% 12 0.07% 85 0.32% 26 0.12% 70 0.28% 44 0.21% Lepomis macrochirus Bluegill 8,039 50.20% 6,135 48.66% 15,366 70.46% 13,015 74.22% 16,628 62.19% 16,390 72.94% 15,338 62.09% 13,437 65.25% Lepomis microlophus Redear sunfish 929 5.80% 313 2.48% 584 2.68% 241 1.37% 845 3.16% 504 2.24% 974 3.94% 644 3.13% Micropterus punctulatus Spotted bass 4 0.02% 1 0.00% Micropterus salmoides Largemouth bass 2,347 14.66% 2,062 16.35% 1,191 5.46% 1,092 6.23% 1,582 5.92% 1,338 5.95% 1,529 6.19% 1,521 7.39% Micropterus hybrid Hybrid black bass 4 0.02% Pomoxis annularis White crappie 1 0.01% Pomoxis nigromaculatus Black crappie 271 1.69% 420 3.33% 143 0.66% 145 0.83% 178 0.67% 98 0.44% 253 1.02% 144 0.70%Percidae Etheostoma fusiforme Sw amp darter 1 0.00% Etheostoma olmstedi Tessellated darter 2 0.02% 7 0.04% 14 0.05% 13 0.06% 1 0.00% 4 0.02% Perca flavescens Yellow perch 123 0.77% 441 3.50% 31 0.14% 114 0.65% 2 0.01% 35 0.16% 33 0.13% 29 0.14%Total 16,014 100.00% 12,609 100.00% 21,809 100.00% 17,535 100.00% 26,737 100.00% 22,470 100.00% 24,703 100.00% 20,592 100.00%Total no. species 26 21 29 22 29 29 34 26
REFSpring 2009 - 2013
AS REFSpring 1993 - 1997, 1999 Spring 2000 - 2003 Spring 2004 - 2008AS REF AS REF AS

5-8
Table 5-2. Total number of individuals, percent composition, and number of species in summer electrofishing surveys from three areas (above, in, and below the discharge canal) near AS in Lake Wylie, 1991 – 1993, 1994 – 1999, 2000 – 2003, 2004 – 2008, and 2009 – 2013.
Scientif ic name Common name No. % No. % No. % No. % No. %
Lepisosteidae
Lepisosteus osseus Longnose gar 2 0.09% 3 0.09%
Clupeidae
Dorosoma cepedianum Gizzard shad 32 3.40% 152 6.93% 86 3.40% 79 2.31% 51 1.52%
Dorosoma petenense Threadfin shad 158 16.79% 260 11.86% 337 13.33% 107 3.13% 67 2.00%
Cyprinidae
Cyprinella chloristia Greenfin shiner 1 0.11% 8 0.36% 10 0.40% 41 1.20% 6 0.18%
Cyprinella nivea Whitefin shiner 5 0.53% 23 1.05% 109 4.31% 35 1.02% 14 0.42%
Cyprinus carpio Common carp 2 0.09% 2 0.08% 3 0.09% 1 0.03%
Notemigonus crysoleucas Golden shiner 9 0.36% 23 0.67%
Ictaluridae
Ameiurus catus White catf ish 12 1.28% 107 4.88% 61 2.41% 29 0.85% 5 0.15%
Ameiurus nebulosus Brow n bullhead 1 0.04%
Ameiurus platycephalus Flat bullhead 1 0.05%
Ictalurus furcatus Blue catf ish
Ictalurus punctatus Channel catf ish 2 0.21% 16 0.73% 25 0.99% 21 0.61% 21 0.63%
Pylodictis olivaris Flathead catf ish 1 0.04% 3 0.09%
Poeciliidae
Gambusia holbrooki Eastern mosquitofish 18 0.53% 4 0.12%
Moronidae
Morone chrysops White bass 1 0.05%
Centrarchidae
Lepomis auritus Redbreast sunfish 138 14.67% 207 9.44% 109 4.31% 103 3.01% 102 3.04%
Lepomis cyanellus Green sunfish 8 0.85% 41 1.20% 102 3.04%
Lepomis gibbosus Pumpkinseed 17 1.81% 36 1.64% 19 0.75% 12 0.35% 4 0.12%
Lepomis gulosus Warmouth 24 2.55% 60 2.74% 83 3.28% 85 2.49% 40 1.19%
Lepomis hybrid Hybrid sunfish 2 0.21% 4 0.18% 5 0.20% 8 0.23% 12 0.36%
Lepomis macrochirus Bluegill 419 44.53% 1,078 49.18% 1,515 59.91% 2,471 72.27% 2,672 79.71%
Lepomis microlophus Redear sunfish 27 2.87% 37 1.69% 47 1.86% 81 2.37% 83 2.48%
Micropterus punctulatus Spotted bass 2 0.06%
Micropterus salmoides Largemouth bass 90 9.56% 158 7.21% 93 3.68% 234 6.84% 156 4.65%
Pomoxis nigromaculatus Black crappie 3 0.12% 8 0.23%
Percidae
Etheostoma olmstedi Tessellated darter 5 0.23% 4 0.12% 2 0.06%
Perca flavescens Yellow perch 6 0.64% 35 1.60% 14 0.55% 10 0.29% 8 0.24%
Total no. individuals 941 100.00% 2,192 100.00% 2,529 100.00% 3,419 100.00% 3,352 100.00%
Total no. species 14 18 18 21 18
a Locations consisted of 200 m sampled shoreline in 1991, 1992, 1994, and 1995.
Summer 1991 - 1993a Summer 1994 - 1999a Summer 2000 - 2003 Summer 2004 - 2008 Summer 2009 - 2013

5-9
Table 5-3. Pelagic forage fish species composition from purse seine surveys in Lake Wylie, 1994 – 2013.
Species CompositionYear Threadfin shad Gizzard shad Alewife1994 99.99% 0.01%1995 100.00%1996 99.77% 0.23%1997 99.99% 0.01%1999 99.96% 0.04%2000 100.00%2001 99.96% 0.02% 0.02%2002 99.99% 0.01%2003 99.10% 0.22% 0.68%2004 89.21% 10.58%2005 97.83% 2.17%2006 99.65% 0.08% 0.27%2007 100.00%2008 100.00%2009 99.99% 0.01%2010 99.99% <0.01% <0.01%2011 99.99% <0.01%2012 99.33% 0.15% 0.52%2013 97.89% 0.63% 1.48%

5-10
Figure 5-1. Locations associated with spring and summer electrofishing surveys, and fall
purse surveys of Lake Wylie.

5-11
Figure 5-2. Total number of fish collected in spring electrofishing surveys from two areas
(AS and REF) in Lake Wylie, 1993 – 1997 and 1999 – 2013.
Figure 5-3. Biomass of fish collected in spring electrofishing surveys from two areas (AS
and REF) in Lake Wylie, 1993 – 1997 and 1999 – 2013.
0
50
100
150
200
250
300
1993
1994
1995
1996
1997
1998
1999
2000
2001
2002
2003
2004
2005
2006
2007
2008
2009
2010
2011
2012
2013
Fish
(no.
/100
m)
Year
ASREF
0
5
10
15
20
25
1993
1994
1995
1996
1997
1998
1999
2000
2001
2002
2003
2004
2005
2006
2007
2008
2009
2010
2011
2012
2013
Fish
(kg/
100
m)
Year
ASREF

5-12
Figure 5-4. Total number of fish species collected in spring electrofishing surveys from two
areas (AS and REF) in Lake Wylie, 1993 – 1997 and 1999 – 2013.
Figure 5-5. Length distribution of bluegill among survey locations in summer electrofishing
surveys near AS in Lake Wylie, 2009 – 2013.
0
5
10
15
20
25
30
1993
1994
1995
1996
1997
1998
1999
2000
2001
2002
2003
2004
2005
2006
2007
2008
2009
2010
2011
2012
2013
Fish
spe
cies
(no.
/100
m)
Year
ASREF
0%
2%
4%
6%
8%
10%
12%
14%
20 40 60 80 100
120
140
160
180
200
Perc
ent c
ompo
sitio
n
TL class (mm)
Above Discharge Below

5-13
Figure 5-6. Length distribution of redbreast sunfish among survey locations in summer
electrofishing surveys near AS in Lake Wylie, 2009 – 2013.
Figure 5-7. Length distribution of largemouth bass among survey locations in summer
electrofishing surveys near AS in Lake Wylie, 2009 – 2013.
0%
10%
20%
30%
40%
50%
60%
70%
20 40 60 80 100
120
140
160
180
200
Perc
ent c
ompo
sitio
n
TL class (mm)
Above Discharge Below
0%
5%
10%
15%
20%
25%
30%
20 60 100
140
180
220
260
300
340
380
420
460
500
Perc
ent c
ompo
sitio
n
TL class (mm)
Above Discharge Below

THIS PAGE LEFT BLANK INTENTIONALLY

L-1
LITERATURE CITED Brinkhurst, RO. 1974. The Benthos of Lakes. The MacMillan Press. London. 190 pp.
Buetow, D. 2008. 2007 Lake monitoring Report: Mecklenburg County Water Quality Program, SWIM Phase I Part 2-CO. Mecklenburg County Department of Environmental Protection. Charlotte, NC
Buetow, D. 2013. 2012 Lake monitoring Report: Mecklenburg County Water Quality Program, SWIM Phase I Part 2-CO. Mecklenburg County Department of Environmental Protection. Charlotte, NC
Duke Energy. 2009a. Assessment of balanced and indigenous populations in Lake Norman near Marshall Steam Station. Duke Energy, Charlotte, NC.
Duke Energy. 2009b. Assessment of balanced and indigenous populations in Lake Wylie near Allen Steam Station. Duke Energy, Charlotte, NC.
Duke Energy. 2009c. Assessment of balanced and indigenous populations in Mountain Island Lake near Riverbend Steam Station. Duke Energy, Charlotte, NC.
Duke Energy. 2011a. Assessment of balanced and indigenous populations in Belews Lake for Belews Creek Steam Station: NPDES No. NC0024406. August 2006. Duke Energy, Huntersville, NC.
Duke Energy. 2011b. Lake Norman Maintenance Monitoring Program: 2010 Summary. Duke Energy, Charlotte, NC.
Duke Energy. 2013. Assessment of balanced and indigenous populations in Lake Wylie near Catawba Nuclear Station. Duke Energy, Charlotte, NC.
Duke Power. 1999. Assessment of balanced and indigenous populations in Lake Norman near Marshall Steam Station. Duke Power, Charlotte, NC.
Duke Power. 2001a. Assessment of balanced and indigenous populations in Lake Wylie near Plant Allen. Duke Power, Charlotte, NC.

L-2
Duke Power. 2001b. Assessment of balanced and indigenous populations in Mountain Island Lake near Riverbend Steam Station. Duke Power, Charlotte, NC.
Duke Power. 2004a. Assessment of balanced and indigenous populations in Lake Norman near Marshall Steam Station. Duke Power, Charlotte, NC.
Duke Power. 2004b. Assessment of balanced and indigenous populations in Lake Wylie near Plant Allen. Duke Power, Charlotte, NC.
Duke Power. 2004c. Assessment of balanced and indigenous populations in Mountain Island Lake near Riverbend Steam Station. Duke Power, Charlotte, NC.
Duke Power Company. 1976. Plant Allen 316(a) demonstration. Duke Power Company. Charlotte, NC.
Duke Power Company. 1994. Assessment of balanced and indigenous populations in Lake Wylie near Plant Allen. Duke Power Company, Charlotte, NC.
Hayes, DB, CP Ferrier, and WW Taylor. 2012. Active fish capture methods. Pages 267-304 in AV Zale, DL Parrish and TM Sutton, editors. Fisheries Techniques, 3rd edition. American Fisheries Society, Bethesda, MD.
Milligan, MR. 1997. Identification manual for the Oligochaeta of Florida. Vol. 1. 187 pp
Neumann, RM, CS Guy, and DW Willis. 2012. Length, weight, and associated indices. Pages 637-676 in AV Zale, DL Parrish and TM Sutton, editors. Fisheries Techniques, 3rd edition. American Fisheries Society, Bethesda, MD.
North Carolina Department of Environment, Health, and Natural Resources (NCDEHNR). 1994. Basinwide assessment report support document, Catawba River basin. NCDEHNR, Water Quality Section, Raleigh, NC.
NCDENR. 2008. Lake & reservoir assessments: Catawba River basin. NCDENR, Division of Water Quality, Intensive Survey Unit. June 23, 2008. Raleigh, NC.
NCDENR. 2011a. Permit to discharge wastewater under the National Pollutant Discharge Elimination System: Duke Energy Carolinas, Plant Allen Steam Station, Gaston County, NC.

L-3
NCDENR. 2011b. Lake & reservoir assessments: Neuse River basin. NCDENR, Division of Water Quality, Intensive Survey Unit. May 31, 2011. Raleigh, NC.
NCDENR. 2012. Lake & reservoir assessments: Yadkin-Pee Dee River basin. NCDENR, Division of Water Quality, Intensive Survey Unit. March 13, 2012. Raleigh, NC.
NCDENR. 2013. Lake & reservoir assessments: Catawba River basin. NCDENR, Division of Water Quality, Intensive Survey Unit. July 18, 2013. Raleigh, NC.
NCDENR. 2013b. Standard operating procedure. Biological monitoring: stream fish community assessment program. NCDENR, Division of Water Resources, Environmental Sciences Section, Biological Assessment Branch. Raleigh, NC.
National Climatic Data Center (NCDC). 2013. NCDC Announces Warmest Year on Record for Contiguous U.S. http://www.ncdc.noaa.gov/news/ncdc-announces-warmest-year-record-contiguous-us. (accessed: 08/26/2013).
Rudstam, LG, JM Jech, SL Parker-Stetter, JK Horne, PJ Sullivan, and DM Mason. 2012. Fisheries acoustics. Pages 597-636 in AV Zale, DL Parrish and TM Sutton, editors. Fisheries Techniques, 3rd edition. American Fisheries Society, Bethesda, MD.
United States. Environmental Protection Agency (USEPA). 1977. Interagency 316(a) technical guidance manual and guide for thermal effects sections of nuclear facilities environmental impact statements. Draft May 1, 1977. USEPA Office of Water Enforcement, Washington, DC.
Weiss, CM and EJ Kuenzler. 1976. The trophic state of North Carolina Lakes. University of North Carolina, Water Resources Research Institute. July 1976. Chapel Hill, NC.

THIS PAGE LEFT BLANK INTENTIONALLY

APPENDIX

A-1
APPENDIX A
SPRING SEDIMENT AND HEXAGENIA SAMPLING IN LAKE WYLIE SEDIMENT ANALYSIS Methods Spring sampling was conducted on Lake Wylie on April 13, 2010 for the purpose of determining the presence and abundance of Hexagenia in spring samples, as well as for sediment particle size analyses. Samples were collected at four locations in the vicinity of the Allen Steam Station (AS): Location A, well uplake of AS; Location B, at the mouth of the AS discharge; Location C, at the confluence of the South Fork and Catawba River; and, Location D, a newly added location in the South Fork upstream of the AS discharge, roughly between the Upper Armstrong bridge and the AS discharge (Figure 1). A petite Ponar dredge (15.3cm X 15.3cm) was used to collect five replicate samples for sediments from each location. Sediment replicates were composited in labeled five-gallon buckets and returned to the lab for processing and analysis of particle size. Samples were collected at depths ranging from two to three meters. Each sediment composite was well mixed using a garden trawl and subsamples were removed from each composite for individual analysis. Subsamples from each composite were placed in Teflon-coated bake pans (5 cm in height, 20 cm in width, and 30 cm in length). Pans were filled to the half-way mark with sediment, allowing for approximately 1,500 cm3 of sample. The amount of sediment from each five-grab composite was determined by filling the drying pans with all of the material in each five-gallon bucket, counting the number of pans of material then determining approximate volumes based on pan volumes. Pans comprising one subsample from each composite were placed in a drying oven at 70 ºC (158 ºF) for at least 24 hours to insure the samples were thoroughly dried. After drying, the material was removed from the pans, broken up, and macerated to break up any agglomerates.

A-2
Fifteen sieves were selected to break down samples into component particle sizes. Sieve numbers and sizes are presented in Table 1. Racks of five sieves each were placed in a mechanical shaker (W. S. Tyler, Co., RO-TAP.®) for 2.5 to 5.0 minutes. Fractions were removed and placed in labeled sample containers. Each fraction was weighed on a one-place, calibrated scale (Scout-Pro, OHAUS®, max. wt. 2,000g). The composition of particle sizes was expressed as a percentage of the total weight of the subsample analyzed. Results Location A represented the largest volume of total sediment collected (≈ 6,000 cm3), followed by Locations B (≈ 3,300 cm3), and D (≈ 3,200 cm3). Location C had the least amount of sediment volume (≈ 2,100 cm3). This indicated that while considerable viable substrate was available at Location A, the viable sediment layer at Location C was comparatively thin and could have sat atop underlying hardpan clay or bedrock. At Location A, the largest percentage (<48%) of the sediment ranged in size from 125 to 250 μm, representing mostly sand and fine sand particle sizes, with >35% of particles ranging from <53 to 125 μm, in the silt to very fine sand range (Table 1, Figure 2). The largest portion of the substrate at Location B (>38%) was in the range of coarse sand to granular material (850 μm to 2.36 mm), with about one-third of the sediment in the sand to coarse sand range (250 to <850 μm). At Location C, over 26% of the substrate collected was greater than 4.75 mm. This large material was composed primarily of Corbicula shells and shell fragments. Most of the remainder of the sediment at this location (>48%) consisted of particles ranging from 125 to 850 μm, and could be described as sand ranging from fine to coarse. Sediment at Location D was also composed mainly of particles ranging from 125 to 850 μm in size, but this range represented a much high percentage of total sediment (<79%). Clearly, Location A not only represented far more available substrate than at other sites, but substrate particle sizes more suitable for certain macroinvertebrate species, including burrowing mayflies. Location B substrate was considerably less suitable based on particle size, while substrate at Location D was also unsuitable based on larger particle sizes. Location C appeared to be less habitable than other locations based on much less available substrate and smaller proportions of suitable particle sizes.

A-3
HEXAGENIA Methods Field sampling methods and laboratory methods for sorting macroinvertebrates were the same as those presented in the five-year summary report of 2009 (Duke Energy, 2009c), except that only Hexagenia were sorted and identified from sample replicates. Results Temperatures and dissolved oxygen concentrations were recorded from sampling depths at each location on April 13 (Table 2). Temperatures ranged from 16.1 ºC at Location D, the newly added location upstream of the AS discharge to 23.1 ºC at Location B, at the mouth of the discharge. Dissolved oxygen concentrations ranged from 7.63 mg/L at Location C to 9.16 mg/L at Location D. The highest numbers of Hexagenia were observed in replicates from Location A, while Hexagenia were absent from all replicates collected from Locations C and D (Table 2). Several Hexagenia were collected from Location B replicates. Compared to summer populations, the mean density of Hexagenia from Location A was substantially higher than summer densities observed at this location during 1994 – 2008 (Figure 3). The absence of Hexagenia from Location C may have been due, in part, to the limited amount and overall unsuitability of the substrate from that location. As to the absence of these insects from Location D, substrate deficiencies may have also played a role since substrate type was mostly sand and coarse sand (Table 1, Figure 2).

A-4
Table 1. Sediment sample weights, weights of particle fractions, and percent composition of each fraction from samples collected on Lake Wylie, NC on April 13, 2010.
Sieve
Number Size Location A Location B Location C Location D
Wt. (g) % Wt. (g) % Wt. (g) % Wt. (g) % 4 4.75 mm 49.9 2.79 19.7 1.11 368.9 26.09 26.3 1.33 6 3.35 mm 11.4 0.64 17.5 0.98 7.1 0.50 15.3 0.77 8 2.36 mm 10.1 0.57 21.2 1.19 13.0 0.92 41.6 2.1
12 1.70 mm 10.0 0.56 172.3 9.68 27.9 1.97 25.9 1.31 16 1.18 mm 10.7 0.60 266.6 14.94 52.0 3.68 66.9 3.38 20 850 μm 11.3 0.63 251.0 14.1 47.2 3.34 41.3 2.09 30 600 μm 12.6 0.70 189.8 10.66 46.1 3.26 38.9 1.96 40 425 μm 55.4 3.1 190.8 10.72 59.7 4.22 70.9 3.58 60 250 μm 129.9 7.26 212.7 11.95 168.7 11.93 767.1 38.74 80 180 μm 157.9 8.82 81.5 4.58 176.5 12.48 515.0 26.01 100 150 μm 43.3 2.42 35.9 2.02 79.5 5.62 114.2 5.77 120 125 μm 652.4 36.46 50.6 2.84 155.6 11.01 55.9 2.82 140 106 μm 40.3 2.25 41.5 2.33 41.9 2.96 31.5 1.59 200 75 μm 384.7 21.5 89.8 5.04 112.2 7.94 52.0 2.63 270 53 μm 50.3 2.81 37.6 2.11 29.5 2.09 45.8 2.31
<53 μm 159.3 8.90 102.4 5.75 28.1 1.99 71.7 3.62 Total 1,789.4 1,780.3 1,413.9 1,980.3

A-5
Table 2. Raw counts of Hexagenia observed in samples collected on April 13, 2010, and temperatures and dissolved oxygen values recorded at the time of sampling.
Loc. Rep. 1 Rep. 2 Rep. 3 Rep. 4 Rep. 5 Mean Temp (ºC) DO (mg/L)
A 8 4 11 11 6 8.0 16.8 8.57 B 0 2 0 1 0 0.6 23.1 8.29 C 0 0 0 0 0 0 20.6 7.63 D 0 0 0 0 0 0 16.1 9.16

A-6
Figure 1. Macroinvertebrate and sediment monitoring locations in the vicinity of Allen
Steam Station on Lake Wylie, NC sampled on April 13, 2010.

A-7
Figure 2. Sediment particle size composition at locations sampled in Lake Wylie, NC on
April 13, 2010.
Figure 3. Mean densities (No./m2) of Hexagenia collected annually at all locations from
1994 to 2008 and densities recorded from three locations in the spring of 2010. No Hexagenia were collected at newly added Location D.

A-8
LITERATURE CITED Duke Energy. 2009. Assessment of balanced and indigenous populations in Lake Wylie near
Plant Allen. Duke Energy, Charlotte, NC.

THIS PAGE LEFT BLANK INTENTIONALLY