assessment of biomass technical report report . nrel/tp-7a2-48073 . may 2010 . assessment of biomass...
TRANSCRIPT

Technical Report NREL/TP-7A2-48073 May 2010
Assessment of Biomass Pelletization Options for Greensburg, Kansas S. Haase

National Renewable Energy Laboratory 1617 Cole Boulevard, Golden, Colorado 80401-3393 303-275-3000 • www.nrel.gov
NREL is a national laboratory of the U.S. Department of Energy Office of Energy Efficiency and Renewable Energy Operated by the Alliance for Sustainable Energy, LLC
Contract No. DE-AC36-08-GO28308
Technical Report NREL/TP-7A2-48073 May 2010
Assessment of Biomass Pelletization Options for Greensburg, Kansas S. Haase
Prepared under Task No. IDKS.1070

NOTICE
This report was prepared as an account of work sponsored by an agency of the United States government. Neither the United States government nor any agency thereof, nor any of their employees, makes any warranty, express or implied, or assumes any legal liability or responsibility for the accuracy, completeness, or usefulness of any information, apparatus, product, or process disclosed, or represents that its use would not infringe privately owned rights. Reference herein to any specific commercial product, process, or service by trade name, trademark, manufacturer, or otherwise does not necessarily constitute or imply its endorsement, recommendation, or favoring by the United States government or any agency thereof. The views and opinions of authors expressed herein do not necessarily state or reflect those of the United States government or any agency thereof.
Available electronically at http://www.osti.gov/bridge
Available for a processing fee to U.S. Department of Energy and its contractors, in paper, from:
U.S. Department of Energy Office of Scientific and Technical Information P.O. Box 62 Oak Ridge, TN 37831-0062 phone: 865.576.8401 fax: 865.576.5728 email: mailto:[email protected]
Available for sale to the public, in paper, from: U.S. Department of Commerce National Technical Information Service 5285 Port Royal Road Springfield, VA 22161 phone: 800.553.6847 fax: 703.605.6900 email: [email protected] online ordering: http://www.ntis.gov/ordering.htm
Printed on paper containing at least 50% wastepaper, including 20% postconsumer waste

iii
NREL Contacts
Laboratory Point Scott Haase of Contact: Phone: 303-275-3057
Project Team: Scott Haase Lynn Billman Anelia Milbrandt Dave Peterson Chris Gaul Rachel Gelman Alexander Dane
Project Name: Assessment of Biomass Pelletization Options for Greensburg, Kansas

iv
Acknowledgments
This work was conducted by the U.S. Department of Energy’s (DOE) National Renewable Energy Laboratory (NREL) to provide input on the potential to establish a biomass pelletization or briquetting plant in or around the community of Greensburg, Kansas. A number of organizations and individuals contributed information that was useful in the analysis. The authors wish to thank the following persons and organizations for their assistance with this project (listed alphabetically):
• Bob Dickson, Mayor of Greensburg, Kansas • Kelly Estes, BTI Industries • Mike Estes, BTI Industries • Josh Harden, Biomass Energy Development Company • Steve Hewitt, Greensburg City Administrator • Brian Hoffman, Pratt Area Chamber of Commerce • Roger Masenthin, USDA, Sunflower Resource Conservation and Development (RC&D)
Program • Mike Mayberry, USDA, Sunflower RC&D Program • Don Queal, Queal Enterprises • Jeanette Siemens, Kiowa County Economic Development • Terry Studer, Local Agricultural Producer.
At NREL, staff who contributed to the effort in addition to the main author include: Lynn Billman, Alexander Dane, Chris Gaul, Rachel Gelman, Anelia Milbrandt, and Dave Peterson.

v
Table of Contents
NREL Contacts .............................................................................................................................. iii Acknowledgments.......................................................................................................................... iv Table of Contents ............................................................................................................................ v Figures............................................................................................................................................ vi Tables ............................................................................................................................................ vii 1. Introduction ................................................................................................................................. 1
1.1 Study Goal and Objectives .................................................................................................... 1 1.2 Study Area ............................................................................................................................ 2
2. Biomass Resource Assessment ................................................................................................... 3 2.1 Biomass Residues ................................................................................................................. 3 2.2 Results for Immediate Vicinity near Greensburg and Pratt ................................................ 13 2.3 Costs of Residue Collection ................................................................................................ 19 2.4 Feedstock Summary ............................................................................................................ 21
3. Market Demand and Competing Fuels ..................................................................................... 22 3.1 Cost Comparison with Other Fuels ..................................................................................... 22 3.2 Regional Natural Gas Market ............................................................................................. 24 3.3 Potential Customers ............................................................................................................ 29 3.4 Competitor Analysis ........................................................................................................... 30 3.5 Are Pellets The Best Solution as an Alternative to Fossil Fuels? ....................................... 32 3.6 Summary of Market Potential ............................................................................................. 33
4. Densification Plants—Process Flows and Equipment .............................................................. 34 4.1 Feedstock Consistency ........................................................................................................ 34 4.2 Compressed Biomass Forms ............................................................................................... 34 4.3 Pellet Manufacturing ........................................................................................................... 35 4.4 Briquetting .......................................................................................................................... 43 4.5 Bripells ................................................................................................................................ 45 4.6 Comparison of Pellets, Briquettes and Bripells .................................................................. 46
5. Biomass Conversion Technologies ........................................................................................... 47 5.1 Combustion ......................................................................................................................... 47 5.2 Gasification ......................................................................................................................... 48 5.3 Pellets vs. Chips or Bales .................................................................................................... 48 5.4 Biopower Resource Requirements ...................................................................................... 48
6. Conclusions ............................................................................................................................... 49 7. Next Steps ................................................................................................................................. 50 Appendix A: Biomass Resource Assessment ............................................................................... 51
Methodology ............................................................................................................................. 51 Counties .................................................................................................................................... 52 Biomass Feedstocks .................................................................................................................. 52 Other Sources ............................................................................................................................ 54
Appendix B: Analysis of Physical and Chemical Characteristics of Local Biomass Resources .. 56 Appendix C: Natural Gas Demand Maps ..................................................................................... 65 Appendix D: Potential Customers ................................................................................................ 72 Appendix E: List of Biomass Conversion Technology Manufacturers ........................................ 74

vi
Figures
Figure 1. Twenty-five- and 50-mile radius circles from Greensburg and Pratt .............................. 2
Figure 2. Map of residue generation ............................................................................................... 4
Figure 3. Estimated annual residue production, by county ............................................................. 5
Figure 4. Percentage breakdown of feedstock types in the entire region ....................................... 5
Figure 5. Residue yields by county and feedstock .......................................................................... 7
Figure 6. Residue yields per acre, by feedstock type and county ................................................... 8
Figure 7. Encroachment of eastern red cedars, Barber County, Kansas ....................................... 10
Figure 8. Eastern red cedars ready for field burning .................................................................... 10
Figure 9. Feedstock collection zones around Greensburg ............................................................ 13
Figure 10. Feedstock collection zones around Pratt ..................................................................... 14
Figure 11. Satellite image of 25-mile radius of Greensburg, Kansas ........................................... 15
Figure 12. Satellite image of 25-mile radius of Pratt, Kansas ...................................................... 15
Figure 13. Feedstock costs - $/Mbtu equivalent ........................................................................... 19
Figure 14. Delivered cost of energy for various fuels ($/Million Btu) ......................................... 23
Figure 15. Five-year price chart for natural gas (Source: EIA) .................................................... 24
Figure 16. Kansas industrial customer natural gas prices (1970-January 2009) .......................... 25
Figure 17. Gas utility service territories in the study area ............................................................ 26
Figure 18. Industrial natural gas usage (therms) ........................................................................... 27
Figure 19. General pellet mill layout ............................................................................................ 36
Figure 20. Production costs versus plant capacity (source: Campbell) ........................................ 43
Figure 21. Sample briquettes ........................................................................................................ 44

vii
Tables
Table 1. All Agricultural and Logging Residues Generated in the Study Area ............................. 4
Table 2. Wheat, Sorghum and Corn Residues Technically Available in the Study Area (bdt/yr) . 6
Table 3. Acres Harvested—Wheat, Sorghum, and Corn (10-Year Average) ................................ 7
Table 4. Estimated Per-Acre Residue Yields (bdt/acre) by Feedstock Type and County .............. 8
Table 5. CRP Acres for Counties Near Greensburg ..................................................................... 11
Table 6. Ten-Year Average of Corn Acres Harvested in the Study Area ..................................... 12
Table 7. Overall Summary of Biomass Feedstocks for Study Area ............................................. 13
Table 8. Summary of Residue Availability Within 25 and 50 Miles of Pratt and Greensburg .... 14
Table 9. Number of Acres Needed to Produce 25,000 bdt/yr Residue ......................................... 16
Table 10. Summary of Lab Results for Biomass Samples ............................................................ 18
Table 11. Summary of Feedstock Collection Costs ...................................................................... 20
Table 12. Cost Comparison of Various Fuels ($/MMbtu Delivered to the Building) .................. 23
Table 13. Average 2008 Monthly Natural Gas Prices in Kansas, by Customer Type .................. 25
Table 14. Regional Demand for Natural Gas by Customer Type ................................................. 27
Table 15. Estimated Tons of Pellets Equivalent to Regional Natural Gas Consumption ............ 28
Table 16. Capital Cost Estimates for Various Sized Pellet Mills (Campbell, 2007) .................... 40
Table 17. Estimated Labor Costs of Pellet Manufacturing ($/ton) ............................................... 41
Table 18. Estimated Electrical Requirements for a 24,000-Ton-Per-Year Pellet Mill ................. 41
Table 19. Estimated Manufacturing Costs of Pellets ($/ton) ........................................................ 42
Table 20. Estimated Labor Costs of Briquette Manufacturing ($/ton) ......................................... 44
Table 21. Estimated Labor Costs of Bripell Manufacturing ($/ton) ............................................. 45
Table 22. Estimated Labor Costs of Bripell Manufacturing ($/ton) ............................................. 45
Table 23. Summary Cost Estimates .............................................................................................. 46

1
1. Introduction
On May 4, 2007, the farming community of Greensburg, Kansas, was hit by an EF-5 tornado, resulting in the destruction of 90% of the community. After this event, Greensburg community leaders made a commitment to rebuilding as a sustainable community, emphasizing goals for energy efficiency and the use of renewable energy. The U.S. Department of Energy funded the National Renewable Energy Laboratory (NREL) to provide technical assistance to the community in support of their efforts.
In November 2009, NREL released a comprehensive case study describing those activities.1
NREL recommended in April 2008 that entities in Greensburg consider using biomass, especially agricultural wastes, for various solid fuel, commercially proven, heating applications. Boilers are available that will burn almost any type of dry biomass to generate hot water; and heaters are available that will burn corn or biomass pellets, briquettes, or other solid or loose forms of material. Boilers and heaters need to have emissions acceptable to Kansas and EPA regulations. Collecting and supplying waste biomass to use with boilers in the community, or pelletizing biomass into a solid fuel for customers using heaters in the community, could represent a business opportunity for an entrepreneur.
One of the findings from a study upon which the report was based was that there are opportunities for residents and businesses in the area to use biomass resources, particularly agricultural residues, as a source of thermal energy. Specifically, the report stated:
2
Based on the study findings, NREL conducted a more detailed analysis of market opportunities to establish a biomass densification facility in or near the Greensburg, Kansas, area. The densification technologies considered in this report include pellets, briquettes, and bripells. Each has pros and cons that will be discussed later in the report.
Note that throughout the study, we use the terms agricultural pellets, ag pellets, or biomass pellets interchangeably to refer to a densified product that can be made from a wood/agricultural residue blend. The product may end up being a pellet, a bripell (a larger pellet approximately 1-½ inch in diameter), or a briquette. The final product to be manufactured must ultimately be the choice of the project developer.
Also note that the study does not represent a feasibility study for any one specific business or model. We attempted to compile detailed, unbiased information on the potential business opportunity in one location. We hope that a potential entrepreneur or developer who is interested in the potential opportunity will use this information as a starting point to guide their own detailed analysis and feasibility study. This report should not be taken as investment advice, and any potential project developer must do his or her own due diligence.
1.1 Study Goal and Objectives The goal of this study is to assess the business case of establishing a biomass pelletization or briquetting plant in or around Greensburg, Kansas. The objectives of the study were as follows:
1 Billman, Lynn. Rebuilding Greensburg, Kansas, as a Model Green Community: A Case Study. NREL's Technical Assistance to Greensburg June 2007-May 2009. Technical Report NREL/TP-6A2-45135. November 2009. Available online at: http://www1.eere.energy.gov/buildings/greensburg/pdfs/45135-1.pdf. 2 Ibid., page 42

2
• Estimate the sustainable supply of biomass feedstock in the region. Determine feedstock types, locations, quantities, physical and chemical characteristics, and estimated collection costs.
• Evaluate the potential market for biomass pellets or briquettes in the region.
• Evaluate the process manufacturing technologies for making pellets, briquettes or bripells.
• Provide an overview of commercially available end-use technologies (e.g. boilers and furnaces) suitable for utilizing agricultural biomass feedstocks as a fuel source.
• Compile economic information related to the project feasibility.
1.2 Study Area Figure 1 shows the project study area, which consists of all or part of 15 counties in western Kansas. A county was included only if all or most of the it lies within a 50-mile radius of either Pratt or Greensburg. Therefore, in the figure below, Ford County is included but the counties of Gray and Meade are not.
Figure 1. Twenty-five- and 50-mile radius circles from Greensburg and Pratt
The following counties are included in the study area: Barber, Barton, Clark, Comanche, Edwards, Ford, Harper, Hodgeman, Kingman, Kiowa, Pawnee, Pratt, Reno, Rice, and Stafford. NREL also assessed potential demand for agricultural/pellets in the region. In addition to the counties mentioned above, Sedgwick County is included in the market assessment portion of the study, as this county contains Wichita, which may be a good regional outlet for ag pellets.

3
2. Biomass Resource Assessment
As with any biomass energy project, it is very important to develop a thorough understanding of the local biomass supply through a detailed feedstock assessment. The biomass resource assessment: • Helps define the size of the plant
• Provide an estimate of supply sustainability
• Gives an idea for the collection area needed in terms of acres and farmers
• Determines cost and logistics of collecting the feedstock and transporting it to the plant.
o Because feedstock cost is typically the largest component of the operating costs of any biomass project—whether it is biofuels, biopower, or pellets—we have spent a lot of time trying to define the local resource.
The specific objective of this resource assessment is to determine the quantity, quality, types, and costs of potential biomass feedstocks located within a 50-mile radius of both Pratt and Greensburg. 2.1 Biomass Residues 2.1.1 All Residues The analysis of agricultural residues is based on data from the U.S. Department of Agriculture’s (USDA) National Agricultural Statistics Service (NASS). Results are based on each county’s 10-year average number of acres harvested and total yields for the period from 1998-2007. Detailed information about the methodology, data sources, and analysis techniques used is shown in Appendix A. This section summarizes the overall results of the assessment.
Table 1 shows the quantities of all residues available in the study area, including wheat straw, sorghum, corn stover, soybean, sunflower, cotton, logging wastes, and corn cobs. Alfalfa and hay are not included, since we assume they have higher value for animal feed than energy. As expected, the biomass resource base in the region is dominated by agricultural residues. NREL estimates that there are more than 1.7 million bone dry tons per year (bdt/yr) of residues currently produced within the study area. Converting some Conservation Reserve Program (CRP) land to switchgrass could produce an additional 100,000 bdt/yr.

4
Table 1. All Agricultural and Logging Residues Generated in the Study Area
County Wheat Corn Sorghum Soybean Sunflower Cotton Logging Residues
Other Forestry
RemovalsCorn Cobs Total
Barber 25,283 407 4,004 1,337 46 210 161 2,818 623 34,888 Barton 74,604 17,556 47,399 14,320 222 - 22 14,760 168,882 Clark 469 9,681 345 - - - 218 10,713 Comanche 3,835 285 5,357 627 - - - 450 10,554 Edwards 31,955 39,921 18,599 21,961 60 - - 31,913 144,409 Ford 55,368 22,632 53,883 10,214 136 - - 21,533 163,765 Harper 96,815 146 9,270 1,821 65 436 0 135 108,687 Hodgeman 21,536 2,228 18,130 1,287 - - - 4,200 47,380 Kingman 78,586 5,270 8,869 6,458 185 - - 3,810 103,177 Kiowa 17,281 15,562 12,205 12,255 24 - - 15,113 72,438 Pawnee 59,127 21,710 35,327 16,494 52 - - 18,915 151,626 Pratt 58,679 38,472 19,270 17,711 377 1,122 12,500 33,533 181,663 Reno 89,693 13,495 51,240 22,829 1,253 - 15 13,118 191,642 Rice 111,254 14,194 50,816 15,130 931 - 24 8,190 200,539 Stafford 35,258 18,182 20,366 14,845 85 - - 31,935 120,670 Total 759,742 210,058 364,416 157,632 3,435 1,768 222 15,318 198,443 1,711,034
Residues Available (bdt/yr)
Figure 2 shows a map of residue distribution by county. The greatest concentration of residue is in the eastern region of the study area, particularly Barton, Rice, and Reno counties. However, when looking closer to Greensburg itself, it can be seen that Edwards, Ford, Kiowa, and Pratt counties also have significant quantities of biomass. Quantities differ depending upon feedstock type desired.
Figure 2. Map of residue generation
Figure 3 shows average annual residue totals by county, based on data for the period 1998–2007. The top five counties, in terms of total production, are Rice, Reno, Pratt, Barton, and Ford, with each one producing more than 150,000 bdt/yr. Kiowa County produces approximately 75,000 bdt/yr.

5
Average Resiude Production (bdt/yr for 1998-2007)
0
50000
100000
150000
200000
250000
RiceReno
Pratt
Barton Ford
Pawnee
Edwards
Harper
Kingman
Stafford
Kiowa
Hodgem
an
Barber
Clark
Comanche
County
bdt/y
r
Corn CobsOther Forestry RemovalsLogging ResiduesCottonSunflower ResidueSoybean ResidueCorn StoverSorghum ResidueWheat Straw
Figure 3. Estimated annual residue production, by county
Residue Production by Type
Wheat Straw46%
Sorghum Residue22%
Corn Stover13%
Corn Cobs9%
Logging Residues0%
Sunflower Residue0%
Other Forestry Removals1%
Soybean Residue9%
Cotton0%
Figure 4. Percentage breakdown of feedstock types in the entire region
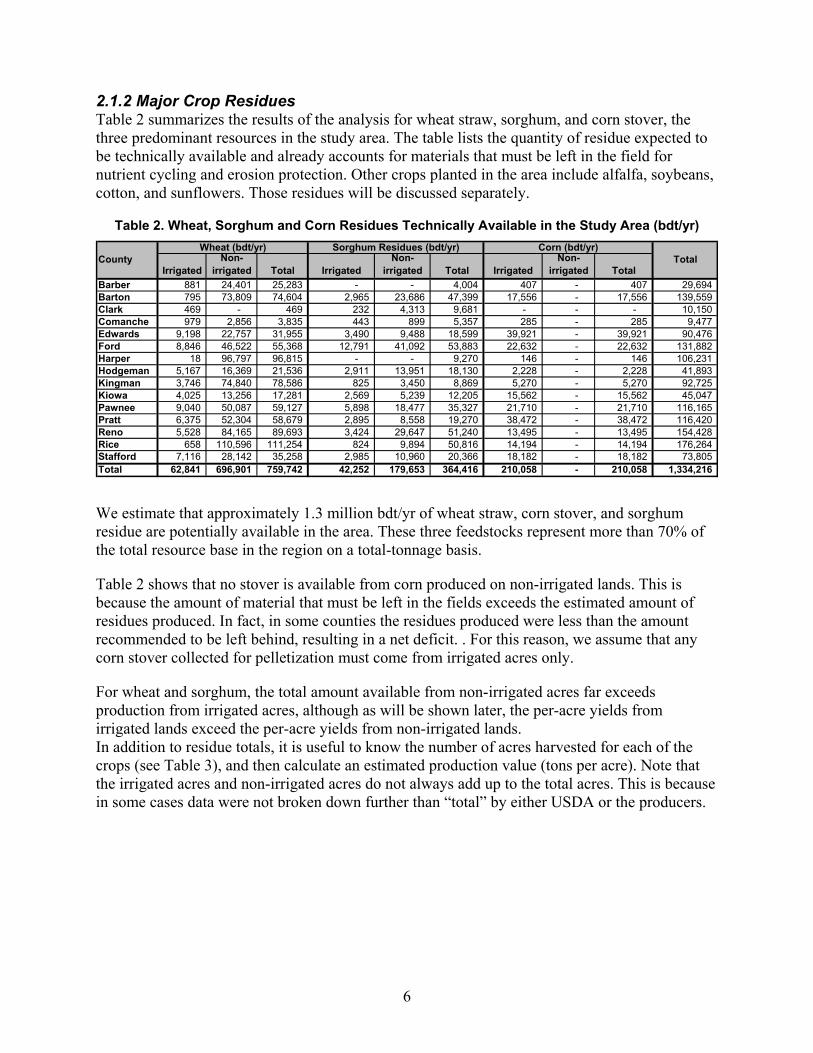
6
2.1.2 Major Crop Residues Table 2 summarizes the results of the analysis for wheat straw, sorghum, and corn stover, the three predominant resources in the study area. The table lists the quantity of residue expected to be technically available and already accounts for materials that must be left in the field for nutrient cycling and erosion protection. Other crops planted in the area include alfalfa, soybeans, cotton, and sunflowers. Those residues will be discussed separately.
Table 2. Wheat, Sorghum and Corn Residues Technically Available in the Study Area (bdt/yr)
IrrigatedNon-
irrigated Total IrrigatedNon-
irrigated Total IrrigatedNon-
irrigated TotalBarber 881 24,401 25,283 - - 4,004 407 - 407 29,694 Barton 795 73,809 74,604 2,965 23,686 47,399 17,556 - 17,556 139,559 Clark 469 - 469 232 4,313 9,681 - - - 10,150 Comanche 979 2,856 3,835 443 899 5,357 285 - 285 9,477 Edwards 9,198 22,757 31,955 3,490 9,488 18,599 39,921 - 39,921 90,476 Ford 8,846 46,522 55,368 12,791 41,092 53,883 22,632 - 22,632 131,882 Harper 18 96,797 96,815 - - 9,270 146 - 146 106,231 Hodgeman 5,167 16,369 21,536 2,911 13,951 18,130 2,228 - 2,228 41,893 Kingman 3,746 74,840 78,586 825 3,450 8,869 5,270 - 5,270 92,725 Kiowa 4,025 13,256 17,281 2,569 5,239 12,205 15,562 - 15,562 45,047 Pawnee 9,040 50,087 59,127 5,898 18,477 35,327 21,710 - 21,710 116,165 Pratt 6,375 52,304 58,679 2,895 8,558 19,270 38,472 - 38,472 116,420 Reno 5,528 84,165 89,693 3,424 29,647 51,240 13,495 - 13,495 154,428 Rice 658 110,596 111,254 824 9,894 50,816 14,194 - 14,194 176,264 Stafford 7,116 28,142 35,258 2,985 10,960 20,366 18,182 - 18,182 73,805 Total 62,841 696,901 759,742 42,252 179,653 364,416 210,058 - 210,058 1,334,216
CountyWheat (bdt/yr) Corn (bdt/yr)
TotalSorghum Residues (bdt/yr)
We estimate that approximately 1.3 million bdt/yr of wheat straw, corn stover, and sorghum residue are potentially available in the area. These three feedstocks represent more than 70% of the total resource base in the region on a total-tonnage basis.
Table 2 shows that no stover is available from corn produced on non-irrigated lands. This is because the amount of material that must be left in the fields exceeds the estimated amount of residues produced. In fact, in some counties the residues produced were less than the amount recommended to be left behind, resulting in a net deficit. . For this reason, we assume that any corn stover collected for pelletization must come from irrigated acres only.
For wheat and sorghum, the total amount available from non-irrigated acres far exceeds production from irrigated acres, although as will be shown later, the per-acre yields from irrigated lands exceed the per-acre yields from non-irrigated lands. In addition to residue totals, it is useful to know the number of acres harvested for each of the crops (see Table 3), and then calculate an estimated production value (tons per acre). Note that the irrigated acres and non-irrigated acres do not always add up to the total acres. This is because in some cases data were not broken down further than “total” by either USDA or the producers.

7
Table 3. Acres Harvested—Wheat, Sorghum, and Corn (10-Year Average)
CountyIrrigated
Corn AcresNon-irrigated Corn Acres
Total Corn Acres
Irrigated Sorghum
Acres
Non-irrigated Sorghum
Acres
Total Sorghum
AcresAll Irrigated Wheat Acres
All Non-irrigated Wheat Acres
Total Wheat Acres
Barber 830 610 2,300 0 0 8,030 1,690 112,340 114,030Barton 19,680 6,640 26,320 2,190 29,770 55,230 1,190 160,470 161,660Clark 290 90 1,030 190 6,150 14,910 1,720 57,230 58,950Comanche 600 140 1,260 360 2,450 9,800 2,240 60,060 62,300Edwards 42,550 8,850 62,370 3,080 15,920 26,300 13,110 84,440 97,550Ford 28,710 1,900 46,860 9,990 57,700 67,690 15,540 150,570 166,110Harper 180 250 1,080 0 0 16,300 30 218,790 218,820Hodgeman 5,600 1,510 9,680 2,680 21,800 26,100 8,080 96,690 104,770Kingman 5,080 1,440 7,950 690 6,380 14,970 5,460 187,270 192,730Kiowa 20,150 4,440 27,610 2,030 8,270 16,710 8,540 60,720 69,260Pawnee 25,220 3,900 31,400 4,580 25,330 42,760 12,170 118,640 130,810Pratt 44,710 8,650 59,780 2,320 13,420 27,440 11,040 134,620 145,660Reno 17,490 7,860 25,350 2,930 44,360 71,870 8,130 225,930 234,060Rice 10,920 10,770 21,690 770 15,760 59,820 1,150 147,870 149,020Stafford 42,580 18,870 61,450 2,400 15,910 27,210 12,780 123,420 136,200Total 264,590 75,920 386,130 49,100 339,970 578,040 158,790 2,108,690 2,267,480 Figure 5 shows the average per-acre residue yields by feedstock and county, based on the values for “total residues produced” (from Table 2) divided by the total acres column for each of the three feedstocks (as shown in Table 3).
The highest yield value is in Rice County, which produces more than 2.0 tons per acre of corn stover and cobs on irrigated land. As the figure shows, the per-acre yields of corn and sorghum residues exceed the yield of wheat straw in every county.
Residue Yields (bdt/acre) by County and Type
-
0.50
1.00
1.50
2.00
2.50
Barber
Barton
Clark
Comanche
Edwards Ford
Harper
Hodgem
an
Kingman
Kiowa
Pawnee
Pratt
RenoRice
Stafford
County
bdt/a
cre Wheat Total
Sorghum TotalCorn Stover and Cobs
Figure 5. Residue yields by county and feedstock

8
Table 4 shows the specific values for average residue yields for irrigated acres, non-irrigated acres, and total acres (with the exception of corn, which is irrigated only) by feedstock type and county. As would be expected, the residue yields from irrigated wheat and irrigated sorghum are more than twice the yields from non-irrigated acres. Figure 6 shows the data from Table 4 graphically (for the irrigated and non-irrigated lands) by crop and county.
Table 4. Estimated Per-Acre Residue Yields (bdt/acre) by Feedstock Type and County Corn
(bdt/acre)
Wheat IrrigatedWheat Non-
irrigated Wheat Total Sorghum IrrigatedSorghum Non-
irrigatedSorghum
TotalCorn Stover
and CobsBarber 0.52 0.22 0.22 0.50 1.24 Barton 0.67 0.46 0.46 1.35 0.80 0.86 1.64 Clark 0.27 - 0.01 1.22 0.70 0.65 0.75 Comanche 0.44 0.05 0.06 1.23 0.37 0.55 1.23 Edwards 0.70 0.27 0.33 1.13 0.60 0.71 1.69 Ford 0.57 0.31 0.33 1.28 0.71 0.80 1.54 Harper 0.61 0.44 0.44 0.57 1.56 Hodgeman 0.64 0.17 0.21 1.09 0.64 0.69 1.15 Kingman 0.69 0.40 0.41 1.20 0.54 0.59 1.79 Kiowa 0.47 0.22 0.25 1.27 0.63 0.73 1.52 Pawnee 0.74 0.42 0.45 1.29 0.73 0.83 1.61 Pratt 0.58 0.39 0.40 1.25 0.64 0.70 1.61 Reno 0.68 0.37 0.38 1.17 0.67 0.71 1.52 Rice 0.57 0.75 0.75 1.07 0.63 0.85 2.05 Stafford 0.56 0.23 0.26 1.24 0.69 0.75 1.18 Average 0.51 0.26 0.28 1.05 0.52 0.58 1.47
Wheat (bdt/acre) Sorghum Residues (bdt/acre)County
The data in Table 4 and Figure 6 indicate that we should look more closely at corn and sorghum residues in the study area. Higher yields per acre means it will take less total acres to supply the pellet plant with these two feedstocks than it would if using wheat straw. This statement presumes that corn (stover and/or cobs) and sorghum residues are suitable for producing a quality pellet or briquette when combined with cedar—something that must be investigated further.
Residue Yields for Irrigated vs. Non-irrigated Acres
-
0.50
1.00
1.50
2.00
2.50
Barber
Barton
Clark
Coman
che
Edward
sFord
Harper
Hodge
man
Kingman
Kiowa
Pawne
ePrat
tRen
oRice
Staffor
d
County
bdt/a
cre/
year
Wheat Irrigated Wheat Non-irrigated Sorghum Irrigated Sorghum Non-irrigated Corn Stover and Cobs Figure 6. Residue yields per acre, by feedstock type and county

9
Looking at the results from Figure 6, twelve out of 15 counties have the highest per acre biomass yields from corn. In 11 of the 15 counties, irrigated sorghum is the second highest yielding feedstock, behind corn.
Clearly if one wants to reduce the number of acres required to supply a plant (and hence reduce the collection costs and transport distance), the initial emphasis for feedstock infrastructure development should be on sorghum residues (depending upon the tons needed), corn stover and perhaps corn cobs.
2.1.3 Woody Biomass Residues – Logging and Other Removals As one would expect, there are minimal residues from logging in the region. The logging that is conducted is typically small-scale and focuses on small removals from private lands along river bottoms.
In Table 1, the Pratt County figure for “other forestry removals” of 12,500 bdt/yr is based on an interview with Don Queal of Queal Enterprises. The company, which is in Pratt County, conducts mitigation of eastern red cedar trees from agricultural lands around the area. Therefore, we have attributed the residues to Pratt County. There may be other similar companies in the area that we did not identify.
Eastern red cedar—which is actually a juniper and not a true cedar—is the only evergreen tree native to Kansas.3
A study conducted by Oklahoma State University (Fact Sheet No. 2868) showed that a red cedar with a 6-foot crown diameter can cover an area 28 square feet in size. The study also showed that on shallow prairie soils otherwise capable of producing 3,000 pounds of forage per acre in a good year, the presence of 250 red cedars per acre reduced forage yields by 50%. In addition, red cedar displaces desirable plants, decreasing plant diversity and water infiltration into the soil, and increasing the risk of wildfire, soil erosion, and pollen levels, the latter causing a greater number of allergic reactions.
Red cedar was once found only where fire did not occur, such as on rock bluffs and in deep canyons. However, in the last 50 years or so it has spread invasively over a wide region, mainly in Oklahoma and into southern Kansas. While the tree has many beneficial uses, such as habitat for wildlife, forage for birds, and as a windbreak, it also spreads rapidly if left unchecked and can have many negative impacts on agricultural lands and operations.
4
No detailed information was available on the extent of eastern red cedar coverage in the study area. One report states that in Oklahoma, red cedars had invaded 1.5 million acres by the 1950s; by 2007, that number had risen to 9 million acres. The Natural Resources Conservation Service NRCS estimates that 760 acres per day, or more than 270,000 acres per year, are being lost to red cedar.
Because the spread of red cedar has significant impacts on the availability and productivity of grazing lands, the U.S. Department of Agriculture subsidizes landowners to remove these trees.
5
3
Based on conversations with Don Queal and other producers in the study region, the extent of red cedar coverage in southwestern Kansas is significant and spreading rapidly,
http://www.kansasforests.org/conservation/evergreens/easternredcedar.shtml 4 http://www.noble.org/ag/nf4/brushcontrol/redcedar.html 5 Truitt, John-Kyle. The Silent Invader. Speech given at the Oklahoma Chapter of the FFA, April 17, 2007. Accessed online, November 15th, 2008 http://www.okffa.org/cde/PlSci_07.pdf.

10
particularly in Comanche, Clark, Barber, Pratt, and Kiowa counties. Figure 7 shows a view of red cedars in one location of Barber County. Figure 8 shows cedars that have been cut and piled and are ready for burning.
Figure 7. Encroachment of eastern red cedars, Barber County, Kansas
Figure 8. Eastern red cedars ready for field burning
Mr. Queal estimates that he could easily collect at least 25,000 green tons per year of eastern red cedar chips. He is currently limited in his ability to collect materials by a shortage of labor and a lack of market outlets. He does chip some of the material and sells it as mulch. The mulch market is rather small, however, so most of the cedar is either chipped in the field, or piled and burned a year or so after it is cut.

11
2.1.4 CRP Land An additional potential source of biomass feedstock in the study area, not shown in Table 1, is CRP land. As shown in Table 5, there are more than 300,000 acres of CRP land in the counties immediately surrounding Greensburg. There may be potential opportunities to convert this land to biomass energy crops. The median estimated mature yield for switchgrass in this area is 4.5 dry tons per acre per year.6
Table 5. CRP Acres for Counties Near Greensburg
Assuming that 10% of CRP lands could be converted to switchgrass production, an additional 120,000 dry tons per year of feedstock could be produced for a bioenergy facility.
County CRP AcresKiowa 53,337Comanche 43010Clark 52,114Barber 21,018Pratt 47,750Ford 59,469Edwards 34,101Total 310,799
2.1.5 Other Potential Sources Corn Cobs. The production of corn cobs is primarily a function of corn yield per acre. Cobs typically represent 15% to 25% of the stover in the field. Corn cobs are typically discarded in the field and could be collected as a feedstock. Several companies are developing cob harvesting equipment, including attachments to existing combines and development of new combines. For example, POET is focusing on the collection of cobs as feedstock for its pilot cellulosic ethnol plant in Emmetsburg, Iowa. POET believes that collection of cobs will improve both yields of biomass per acre and ethanol at minimal additional costs.7
As shown in
Table 6, 386,000 acres of corn are harvested in the counties covered by the study, 265,000 of which are irrigated, 76,000 are non-irrigated, and about 45,000 are not defined in the data. Yields of cobs are estimated to range between 0.6 and 1 ton per acre, depending upon moisture content and corn yield.8,9
6 Billman, Lynn. Volume I. Near Term Energy Strategy Recommendations for Greensburg, Kansas. Draft Report. NREL Technical Report NREL/TP-670-43014. May, 2008. Available on-line at:
Assuming cobs will be collected from irrigated acres only, with an average yield of 1 ton per acre and an average moisture content of 25% on a wet basis, we estimate that approximately 198,000 bdt of cobs that could be collected on an annual basis from the study area. Adding Gray and Meade counties, which were excluded from the study area, an additional 88,000 bdt/yr would be available.
http://www.nrel.gov/docs/temp/43014_vol1_draft.pdf 7 Hoskins, Tim. Ethanol Distiller Announces Breakthrough. Iowa Farmer Today. Accessed on-line at http://www.iowafarmer.com/articles/2008/01/22/ethanol/02aethanolresearch.txt 8Thomas, Robert E. MU tests mixing corn cobs with coal to fuel campus power plant. Accessed on-line at: http://agebb.missouri.edu/news/ext/showall.asp?story_num=3906&iln=713 9 http://www.grainnet.com/articles/Harvesting_Cobs_for_Cellulosic_Ethanol_to_be_Studied_by_Poet-47777.html

12
Table 6. Ten-Year Average of Corn Acres Harvested in the Study Area
CountyIrrigated
Corn AcresNon-irrigated Corn Acres
Total Corn Acres
Barber 830 610 2,300Barton 19,680 6,640 26,320Clark 290 90 1,030Comanche 600 140 1,260Edwards 42,550 8,850 62,370Ford 28,710 1,900 46,860Harper 180 250 1,080Hodgeman 5,600 1,510 9,680Kingman 5,080 1,440 7,950Kiowa 20,150 4,440 27,610Pawnee 25,220 3,900 31,400Pratt 44,710 8,650 59,780Reno 17,490 7,860 25,350Rice 10,920 10,770 21,690Stafford 42,580 18,870 61,450Total 264,590 75,920 386,130
Any potential pellet plant operator interested in using cobs should send them to a lab for ultimate and proximate analysis, and sample cob/wood pellets should be produced to determine their performance characteristics in a boiler or furnace.
Cotton Gin Trash. High Plains Cotton Gin is a small cotton gin located on Highway 54 between Pratt and Greensburg. We learned that all of their gin trash is sold to a broker in Wichita under a long-term contract. The material ends up primarily as animal feed for feedlots. The person at the gin to whom we spoke was not familiar with the terms of the contract. We have not included any material from this source as a potential feedstock because it is likely to have higher value as feed than as an energy source.
2.1.6 Summary – All Residues Including CRP Table 7 shows the overall feedstock summaries for the entire study area. In all, we estimate that more than 1.8 million dry tons per year of biomass feedstock could be produced in the study area, including possible switchgrass production in the future.
The total energy content of all the biomass is 28,000,000 million British thermal units (Mbtu), or 280 million therms. As will be shown in Section 3, this is more than enough biomass to offset the entire demand of natural gas consumed in the region, including the Wichita area. While we are not suggesting that biomass could replace the entire supply of gas in the region, it gives the reader an order-of-magnitude estimate of the amount of energy that not being collected at present that could potentially be made available in the region.

13
Table 7. Overall Summary of Biomass Feedstocks for Study Area
Feedstock Bone dry tons/year
Energy equivalent
(MMBtu/yr)
Equivalent Therms/yr
Agricultural residues 1,497,051 23,054,588 230,545,879 Cedar and other wood 15,540 273,501 2,735,014 10% CRP Land 120,000 1,752,000 17,520,000 Corn cobs 198,000 3,168,000 31,680,000 Total 1,830,591 28,248,089 282,480,893
2.2 Results for Immediate Vicinity near Greensburg and Pratt Because transportation costs represent a large portion of the delivered cost of biomass to a bioenergy facility, it is desirable to place a facility as close as possible to a large concentration of residues, while balancing the needs for the plant to be located in a community with good transportation access, reliable and affordable utilities, and access to strong local and regional market outlets. For these reasons, we narrowed the feedstock assessment to look at how much material is produced within a 25- and 50-mile radius of Greensburg and Pratt. The 25- and 50-mile radii from Greensburg (Figure 9) and Pratt (Figure 10) are shown below.
Figure 9. Feedstock collection zones around Greensburg

14
Figure 10. Feedstock collection zones around Pratt
Table 8 shows the residue available within 25 and 50 miles of both Greensburg and Pratt. The results indicate that there is a greater quantity of residues within 25 miles of Greensburg (266,000 bdt/yr) than there are within 25 miles of Pratt (217,000 bdt/yr). However, when looking at a 50-mile radius, Pratt has about 200,000 more tons per year, though both locations contain well over 1 million bdt/yr of residue. These results do not include cobs.
Table 8. Summary of Residue Availability Within 25 and 50 Miles of Pratt and Greensburg
Figure 11 shows a satellite image centered on the Greensburg area with a 25-mile radius drawn as an overlay (the dark brown swaths are the result of different satellite sources or processing techniques used to prepare the images.) Note the large number of center pivot irrigation circles in the northern half of the circle, and the encroaching eastern red cedars in the southwestern and southeastern parts of the circle. Figure 12 below shows a satellite image and 25-mile radius circle centered on Pratt. The eastern red cedars can be seen in the southwestern part of the circle.10
10 Source: Google Earth
Crop Residues
Logging and
Primary Mill
Residues
Urban Wood and Secondary
Mill Residues Total
Crop Residues
Logging and
Primary Mill
Residues
Urban Wood and Secondary
Mill Residues Total
Pratt 199,100 16,755 1,470 217,325 1,320,000 16,777 9,363 1,346,140 Greensburg 266,200 - - 266,200 1,100,000 16,755 7,480 1,124,235
bdt/yr within 25 Mile Radius bdt/yr within 50 mile radius

15
Figure 11. Satellite image of 25-mile radius of Greensburg, Kansas
Figure 12. Satellite image of 25-mile radius of Pratt, Kansas

16
If the plant is to be located in Pratt, residues from Pratt, Kiowa, Kingman, and Reno counties alone would provide more than 500,000 bdt/year. If the plant were to be located in Greensburg, residues from Kiowa, Pratt, Edwards, and Ford counties would also total more than 500,000 bdt/yr.
2.2.1 Sizing the Plant Based on Resource To reduce transportation costs, a developer of a biomass densification facility should seek to keep the distance from which feedstock is collected to a minimum. Also, a rule of thumb in the biomass industry is to be sure that the estimated supply in a given area is at least three times above the amount of material that a proposed plant will require. So for both the Pratt and Greensburg sites, the best size for a densification plant would be one that uses no more than about 70,000 bdt/yr to 80,000 bdt/yr based on feedstock generated in the 25-mile radius of approximately three times the expected plant requirements. Depending upon the moisture content of incoming feedstock and actual feedstock throughput rates, this plant would produce 40,000 tons to 70,000 tons per year of finished pellets or briquettes.
A larger plant could be built if residues are acquired from a greater distance. However, this would increase the delivered cost of biomass to the plant, especially if fossil fuel prices return to levels seen in the summer of 2008. Keeping biomass sourced from as close as possible to the field will reduce feedstock collection costs and help ensure that the end product is as cost-competitive as possible with other choices in the marketplace.
In addition to resources, the size of the plant will also be influenced by the potential demand for the finished product in the region. Potential regional demand will be discussed in greater detail in Section 3 of this report.
2.2.2 Land Requirements For illustrative purposes, let’s assume that a pellet plant needs 25,000 bdt of agricultural residues as feedstock, perhaps to be blended with 25,000 tons of cedar. How much land would be required to procure this feedstock? The answer depends on which specific ag residues we wish to collect.
Table 9 shows the number of acres, sections, and center pivot circles needed to produce 25,000 bdt/yr. For sorghum residues, one would need 23,750 acres annually to supply the material. Accounting for crop rotations, one would need access to nearly all of the irrigated sorghum acres in the entire study area, making the collection costs much higher than for other residues.
Table 9. Number of Acres Needed to Produce 25,000 bdt/yr Residue
Acres Needed/yr SectionsNumber of Center Pivot Circles (126
acre)48,804 76 387 95,907 150 23,756 37 189 47,972 75 34,654 54 275 33,333 52 265 16,997 27 135 5,000 8 40
Irrigated Corn StoverCorn cobs from irigated cornHalf corn stover/half cobSwitchgrass @ 5 bdt/acre
Irrigated WheatNon-irrigated WheatIrrigated SorghumNon-irrigated Sorghum
Feedstock Type

17
A better option may be to focus on corn stover and cobs. Presuming that we can get at least three-quarters of a ton of cobs and three-quarters of a ton of stover from each irrigated acre, the plant would require 17,000 acres (27 sections, 135 circles) of irrigated corn per year. As shown in Table 6, Pratt and Kiowa counties combined contain approximately 65,000 acres of irrigated corn, or about 3.5 times the amount required to supply the plant with 25,000 bdt/yr. A larger plant would require more acres.
Switchgrass. Additional research needs to be done on the pelletization of switchgrass, since production would require the fewest acres. However, several studies have found that pelletizing switchgrass presents several challenges. It is a difficult material to pelletize, according to one pellet manufacturer, and has less-than-optimal binding characteristics and large fine production.11
2.2.3 Physical and Chemical Properties of Biomass Feedstocks
Also, the costs are estimated to be $115 to $125 per ton delivered to the plant. Other than quantifying the potential resource base in the region, we do not investigate the concept of converting switchgrass to pellets in any greater detail in this study.
The physical and chemical characteristics of biomass that is used as input for a pelletization or briquette mill will directly impact the performance of the product in potential end-use conversion technologies. To determine the quality of local feedstocks, NREL sent several samples of potential feedstocks to Hazen Laboratories in Golden, Colorado, for ultimate and proximate analyses and several additional tests.
NREL collected samples of wheat straw, freshly cut cedar (approximately 1 week to 2 weeks old) and seasoned cedar (12 months old). We also obtained samples of the pellets being made by Show Me Energy Cooperative (SMEC) of Centerview, Missouri. SMEC makes a blended pellet consisting of wheat straw and wood waste, so potentially it will have similar properties to any pellets made of straw and cedar in the Greensburg region.12
Table 10
We did not obtain any samples of corn stover, corn cobs, cotton gin trash, sorghum residue, or soybean residue because of the time of year when the samples were collected (June 2008). These materials represent additional potential feedstocks for a local pellet or briquette mill, and if a developer wishes to use these, tests should be conducted on samples of these materials as well.
summarizes the major test results from Hazen. Appendix B contains the detailed lab results for these samples, as well as the results for analysis of samples of corn stover, corn cobs, and sorghum residue.
The value of lb alkali/Mbtu is an important measure. Research conducted by Tom Miles and NREL13
11 As documented in Ken Campbell. A Feasibility Study for an Agricultural Biomass Pellet Company. Agricultural Utilization Research Institute. November 2007. pg 43.
indicates that fuels with alkali values above .4 lb/Mbtu are likely to exhibit slagging and fouling in conventional biomass boilers. Alkali levels in agricultural residues are typically well over this threshold value. Slagging is caused by minerals in the feedstock melting during combustion and then cooling to form a hard glass-like or rock-like substance within the burn chamber or on the fire tubes of boilers. Formation of this material reduces combustion efficiency,
12 While the pellets may have similar characteristics. It is not known exactly what feedstocks went into the batch of pellets (they told us straw and wood waste) that SMEC sent. Also, if a local pellet is blended with cedar, it may improve the characteristics. 13 Miles, Tom; Tom Miles Jr; et.al. Alkali Deposits Found in Biomass Power plants: A Preliminary Investigation of Their Extent and Nature. April, 1995. NREL Subcontract TZ-2-11226-1. Accessed online on Ocotber 6, 2008: http://www.trmiles.com/alkali/alkali.htm

18
impacts boiler operation, and can be difficult and time-consuming to remove. While there are adjustments that can be made to firing conditions, and limestone can be injected to reduce boiler fouling, there will still be increased O&M requirements compared to natural gas and even wood-fired boilers. Related to this project, the samples for wheat straw and the SMEC pellets are both well above 0.4 lb/Mbtu alkalis.
Table 10. Summary of Lab Results for Biomass Samples
ValueWheat Straw
Freshly Cut Cedar
Seasoned Cedar
SMEC Pellets
Btu content as received HHV (Btu/lb) 7,125 8,143 8,056 7,059 Btu content bone dry (Btu/lb) 7,709 8,827 8,976 7,680 Moisture content as received (%) 7.57 7.75 10.25 8.09Percentage Ash (%) 7.83 1.63 0.88 9.04Lbs Alkali/Mmbtu 1.3 0.08 0.05 1.44Lbs ash/MMBtu 10.99 2.00 1.09 12.81Potassium in ash as K2O (%) 11.4 3.25 4.55 10.8
There are several issues that should be noted with the data in Table 10.
Cedar. The first issue is the difference in the values for the freshly cut cedar and the seasoned cedar. Based on the results, it would appear that the samples may have been mixed up, as one would expect the seasoned cedar to have a lower moisture content and higher “as received” energy value than the freshly cut cedar. But the opposite is true. There may have been rain in the area before the samples were collected, and the seasoned cedar had been stored outside in an open pile for a long time, so moisture may have been absorbed this way. Nevertheless, both cedar samples indicate a very low moisture content of between 7% and 10%, and high energy content of about 8,100 Btu/lb. Cedar is also very low in ash percentage (.9% – 1.6%) as well as in pounds of alkali per Mbtu.
Red cedar represents an important feedstock for the potential pellet manufacturer in the region because it can be blended with agricultural residues to increase the energy content and reduce the ash and alkali content of the finished product. Depending upon the percentage of cedar needed to make a high quality biomass pellet, the ability to collect sufficient cedar may be the limiting factor in the sizing of any potential plant to be established in the region.
Wheat Straw. The wheat straw is high in ash and high in alkalis. Though not analyzed for this report, corn stover will exhibit similar characteristics to wheat straw—about 8,000 Btu/lb and 8% to10% ash, according to a U.S. Department of Energy Web site. The site presents chemical composition and physical property data on more than150 samples, including corn stover, wheat straw, switchgrass, and sorghum.14
SMEC Pellets. The results for the SMEC pellets indicate a moisture content of 8% and an energy content of 7,059 Btu/lb. The pellets were at 9% ash, 11% potassium (K2O) in the ash, and 1.44 pounds of alkali per Mbtu. Any conversion technology that is going to use pellets similar to this as a feedstock must be designed to handle at least 9% ash as well as fuels that are high in
Cotton gin trash and other crop residues will exhibit similar properties. Switchgrass actually seems to be fairly high in energy content.
14 Biomass Feedstock Composition and Property Database. U.S. Department of Energy, Energy Efficiency and Renewable Energy Biomass Program. http://www.afdc.energy.gov/biomass/progs/search2.cgi?25471

19
alkali. As a comparison, premium hardwood pellets are typically less than 1% ash and well below 0.4 lbs alkali/Mbtu.
2.2.4 Impacts of Feedstock Characteristics on Pellet/Briquette Quality Based on the data shown in Table 10, most of the biomass in the region will be high in ash and alkalis. Any pellets or briquettes made from these feedstocks may present challenges in combustion appliances if they are not designed to handle high ash and high alkali fuels.
Consistent blends of ag residue and wood (cedar) will be necessary to produce a higher quality fuel, and any planned facility should have various blend percentages tested to optimize and balance combustion characteristics, binding quality, and overall costs of production. It is also essential that potential end users understand the characteristics of the fuel prior to designing and installing a biomass energy system to use it.
2.3 Costs of Residue Collection Feedstock cost is the greatest factor impacting the economics of a biomass densification plant. A great deal of research has been conducted over the past 10 years on the economics of collecting, transporting, and storing agricultural residues. In addition to the actual costs associated with equipment and labor to collect and transport the feedstocks, one must also consider the potential value of alternative uses of the biomass, as well as the lost nutrient value of any material removed from the land.
Importantly, the price paid for feedstock must work for both the agricultural producer as well as the pelletizer. If the price offered is too low, it will not be worth the producer’s time and effort to collect the feedstock. If the cost to the facility is too high, the manufacturing costs may be too high and the finished product will not be cost-competitive with other fuels such as natural gas and propane. Figure 13, for example, shows the cost of biomass in $/Mbtu for various collection costs per ton (assuming an average of 7,000 Btu/lb for the biomass).
$1.43
$2.14
$2.86
$3.57
$4.29
$5.00
$-
$1.00
$2.00
$3.00
$4.00
$5.00
$6.00
$20 $30 $40 $50 $60 $70
$/M
mbt
u
$/ton delivered
Figure 13. Feedstock costs - $/Mbtu equivalent

20
As can be seen, if the facility were to pay an average price of $40 per ton for material delivered to the plant, the cost of feedstock alone would be $2.86/Mbtu. If the feedstock were delivered for $60 per ton, the cost would be $4.29/Mbtu. In addition to feedstock, pelletization costs include on-site fuel handling, labor, electricity, equipment amortization and depreciation, bagging or bulk storage, and customer delivery.
It is generally accepted that feedstock costs represent 40% to 60% of the final pellet cost. Assuming that feedstock is 50% of the cost, then pellets using $40 per ton feedstock would cost at least $80 per ton to manufacture, or $5.75/Mbtu, prior to facility profit and delivery to the customer. Additional costs incurred by the end user include on-site storage and fuel handling costs, labor for boiler operation and maintenance, ash removal, and potentially lower appliance efficiency compared to natural gas. The end user will also need to purchase or lease a biomass furnace or boiler, which is more expensive than a comparable natural gas appliance and may require financing. Adding all of these, the delivered cost of energy using pellets compared to today’s natural gas price is going to be a good deal higher (more about this in Section 3).
Any pellet plant will need to keep the delivered cost of feedstock as low as possible. Given today’s low price of competing fuels, it will be difficult to make the economics work if a pellet plant has to pay more than an average of $40 per ton, and $30 would be better. It should be mentioned that the ability to get sufficient feedstock for a plant at $40 per ton is by no means assured. It will take careful planning and large numbers of efficient producers who are located near the pellet plant. Residue collection will need to be highly optimized.
However, we feel it is highly likely that feedstock will be in the $55 to $65 per ton range by the time it is input to the process at the pellet mill. This is based on conversations with other biomass pellet producers, as well as documentation provided by Campbell.15 Campbell summarizes several other feedstock cost analysis reports, including one performed by Perlack and Turnhollow of Oak Ridge National Labs (ORNL)16 and one by the Center for Agricultural and Rural Development (CARD) of Iowa State University.17
Table 11 Campbell also develops his own
estimates. The results of these studies are summarized in .
Table 11. Summary of Feedstock Collection Costs
Feedstock Source Delivered Cost ($/bdt) Corn stover (500 to 2000 bdt/day) ORNL, 2002 $52.00 - $56.00 (in 2008 $) Corn stover CARD, 2007 $68.50 ($58.26 per 15%
moisture content ton) Corn stover Campbell $61.52 Soybean straw Campbell $40.70 Wheat straw Campbell $62.90 15 Campbell, Ken. A Feasibility Study for an Agricultural Biomass Pellet Company. Agricultural Utilization Research Institute. November 2007. Pgs 27-42 16 Perlack, Robert D. and Anthony F. Turhollow. Assessment of Options for the Collection, Handling, and Transport of Corn Stover. Oak Ridge National Laboratory, Department of Energy, Oak Ridge, Tennessee, September 2002. 17 Tokgoz, Simla, Amani Elobeid, Jacinto Fabiosa, Dermot J. Hayes, Bruce A. Babcock, Tun-Hsiang (Edward) Yu, Fengxia Dong, Chad E. Hart and John C Beghin, Emerging Biofuels: Outlook of Effects on U.S. Grain, Oilseed, and Livestock Markets. Center for Agricultural and Rural Development, Iowa State University, Ames, Iowa, May 2007.

21
NREL interviewed several producers in the region as part of this study, and the results are worth noting. One told us that it cost at least $20 in terms of time, fuel, and equipment for him to make a bale of wheat straw (this was during the summer of 2008). We estimate that it would take another $5 per bale to get it to the roadside. Assuming the producer will want at least a $5 per bale profit, we estimate the roadside cost is $30 per bale. Assuming further a cost of $0.25 per ton mile and an average haul distance of 20 miles, add another $5 per bale. Loading and unloading and profit for the hauler adds another $7. Thus the final cost is approximately $42 per bale. Assuming that a 5 ft x 6 ft round bale weighs an average of 0.75 per ton, the cost of the bale delivered to the plant would be $55 per ton, or $3.93/Mbtu. This figure does not contain any payment to the producer for lost nutrient value, annual acreage reservation, or additional on-site processing costs at the mill such as grinding or drying. Costs for cedar are estimated to be in the range of $50 per green ton.18
2.4 Feedstock Summary
The ultimate decision as to which feedstocks to use is largely dependent on final product quality of the blend selected, as opposed to the trade-off in biomass availability and collection costs. Cedar is the highest quality and lowest cost feedstock in the region. For agricultural residues, the data indicate there should be lower per-ton collection costs associated with residues collected from irrigated sorghum and irrigated corn acres because of the higher yields of residues per acre. Potential entrepreneurs evaluating this business opportunity should develop test blends of eastern red cedar, corn stover, corn cobs, and sorghum residues in various percentages, and test the resulting pellets in the lab as well as in appliances. This will help guide the feedstock selection process.
Entrepreneurs should also evaluate in detail producer interest in supplying the plant. The key will be to identify and contact the local landowners (focusing on largest-acreage landowners first), interview them regarding their cropping patterns and interest in providing residues, and then secure rights to the necessary acres to provide the feedstock for the plant on an annual basis.
There are numerous feedstock contracting methods available, but we strongly encourage that, at a minimum, the plant owner include an annual per-acre “reservation” payment to effectively ensure that sufficient acres of feedstock are under contract. This reservation payment would be made in addition to payments for nutrient values, biomass values, and collection and delivery costs. As mentioned earlier, it must be worth the producers’ time to interest them in providing feedstock. Another model would be for the producers to become owners of the pellet mill through a co-op structure, and then the producers/owners become feedstock suppliers. The potential pellet mill owner should give careful consideration to feedstock supply and ensure that an adequate supply is placed under a long-term contract.
Without a return to high natural gas prices of summer 2007, or some type of carbon tax or other incentive/regulatory program that will make biomass pellets more competitive on a cost basis with natural gas, the incentive for customers to switch from a clean-burning, low-maintenance, low-cost fuel such as natural gas to a more expensive, high-ash, high-labor fuel such as pellets will be minimal.
18 Personal communication, Don Queal, Queal Enterprises.

22
3. Market Demand and Competing Fuels
This section outlines the potential demand for agricultural biomass pellets or briquettes in the study area. While there are certainly also opportunities to ship the product to other locations, we limit our focus to the local market, again trying to keep transportation and end-user costs as low as possible.
It is difficult to estimate the demand for pellets in a given region. Natural gas is the primary fuel used to provide thermal energy in the study area, thus it is the primary fuel that pellets must compete against. When gas prices are high, people tend to look for alternatives. When gas prices are low, people tend to rely on natural gas. However, because a heating project at an end-use site can take a year or more to develop, the time to build awareness and interest among potential customers is now.
Other fuels in the region include propane, fuel oil, and electricity. We did not quantify the use of these fuels as part of this study. However, ag pellets will be more cost effective compared to these fuels because they each have a higher delivered fuel cost. Any facility currently using propane, fuel oil, or electricity should evaluate biomass options even under today’s conditions.
Natural gas is convenient, safe, easy to use, clean burning and, for many consumers, virtually maintenance free. The major concerns over natural gas are price volatility, delivered cost, and the fact that natural gas is a fossil fuel and therefore will most likely face a carbon tax. Also, at some point in the future, we will again face supply constraints and higher prices since natural gas is a nonrenewable resource.
It is not known how much a carbon tax or cap and trade system might add to the cost of natural gas. On the other hand, biomass will at least be treated as carbon neutral, and there are strong arguments for the case that biomass should be considered to actually reduce greenhouse gases and therefore should get a credit under any type of climate change program implemented in the U.S.19
3.1 Cost Comparison with Other Fuels
Table 12 shows the delivered cost of energy (taking into account likely appliance efficiencies) of various fuels. So the value listed under the column entitled “$/Mbtu” represents the output side of the conversion appliance. The following assumptions are used in the table:
• Chipped cedar is based on the estimated costs of having a third party chip and deliver a ton of air-dried, eastern red cedar chips to an end user, assuming a delivered moisture content of 25% and a Btu content of 8,800 Btu/dry lb.
• The cost of straw bales is the estimated cost of collecting and delivering a bale of field-dried straw to a consumer (7,000 Btu/lb as delivered), plus $5 per ton on-site processing.
• Natural gas prices are based on the April-December 2008 average value for Kansas (Table 13, Section 3.2).
• Price and energy content for hardwood pellets was obtained from Ozark Hardwood Products in Seymour, Missouri (closest wood pellet plant to the study area).
19 Morris, Greg. Bioenergy and Greenhouse Gasses. The Green Power Institute, May 2008. http://www.pacinst.org/reports/Bioenergy_and_Greenhouse_Gases/Bioenergy_and_Greenhouse_Gases.pdf

23
• The price of wood/straw agricultural pellets is based on estimated costs (sales price freight on board the plant plus transportation) from Show Me Energy Cooperative (SMEC) in Missouri, using 7,500 Btu/lb as the energy content. If Btu content were higher, delivered cost would be lower.
• Fuel oil and propane prices are from the Energy Information Administration (EIA) data for the Midwest region (Petroleum Administration for Defense Districts II (PADD II)).
Figure 14 shows the data from Table 12 in graph form. Note that the lowest cost biomass feedstocks are also the ones that are processed the least. As discussed earlier, while these fuels may cost less, they typically have higher labor requirements for fuel preparation, delivery to the boiler/furnace, and ash removal. These bulk fuels also require large space for fuel storage when compared to pellets. Densified fuels are typically more consistent, easier to handle, take up less space, produce lower ash (compared to bulk fuels), and have a higher Btu content because they have been dried.
Table 12. Cost Comparison of Various Fuels ($/MMbtu Delivered to the Building)
Source Units Cost to User ($)
Appliance Efficiency Btu/unit $/MMBtu
Chipped cedar $/green ton 50.00$ 75% 13,200,000 5.05$ Wheat straw bales $/ton 55.00$ 70% 14,000,000 5.61$ Natural gas (industrial) $/therm 0.69$ 80% 100,000 8.63$ Wood/ag pellets ($130/ton) $/ton 130.00$ 80% 15,000,000 10.83$ Wood/ag pellets ($160/ton) $/ton 160.00$ 80% 15,000,000 13.33$ Hardwood pellets $/ton 185.00$ 80% 16,600,000 13.93$ Natural gas (commercial) $/therm 1.50$ 80% 100,000 18.75$ Fuel oil $/gallon 2.17$ 85% 135,000 18.91$ Natural gas (residential) $/therm 2.10$ 80% 100,000 26.25$ Propane $/gallon 2.13$ 85% 91,600 27.36$ Electricity $/kWh 0.10$ 100% 3,413 29.30$
$5.05 $5.61
$8.63$10.83
$13.33 $13.93
$18.75 $18.91
$26.25$27.36
$29.30
$-
$5.00
$10.00
$15.00
$20.00
$25.00
$30.00
$35.00
Chipped
ceda
r
Wheat s
traw ba
les
Natural ga
s (indu
strial)
Wood/ag
pelle
ts ($13
0/ton
)
Wood/ag
pelle
ts ($16
0/ton
)
Hardwoo
d pell
ets
Natural ga
s (co
mmercial
)
Fuel o
il
Natural ga
s (res
identia
l)
Propan
e
Electric
ity
Fuel
$/M
Mbt
u
Figure 14. Delivered cost of energy for various fuels ($/Million Btu)

24
Chipped cedar at $50 per ton has the lowest delivered cost, followed by straw bales. However, the use of these fuels will require additional on-site labor and higher up-front capital costs compared with systems that burn pellets or other densified fuels. Note that wood/ag pellets at $130 per ton are about $0.67 less per Mbtu than the cost of energy at the average industrial rate for gas in Kansas. It is difficult to compete with natural gas if your fuel is just slightly less expensive yet takes more labor and maintenance, and requires an up-front purchase of a new appliance. Ag pellets at $130 per ton compare nicely, however, with hardwood pellets at $185 per ton, fuel oil at $2.17 per gallon, propane at $2.13 per gallon, and electrical resistance heat at $0.10 per kilowatt-hour (kWh). Ag pellets also compare well with commercial natural gas rates of $19.63/Mbtu. Ag pellets at $160 per ton compare favorably with fuel oil, commercial and residential gas, propane, and electricity. It must be noted that it may be a challenge for a pellet plant to deliver wood/ag pellets to its customers at $130 per ton, even if using bulk shipments instead of plastic bags. A cost of $160 per ton for bulk pellets delivered to a regional customer is more likely.
3.2 Regional Natural Gas Market The U.S. Department of Energy EIA states that the November 2008 Henry Hub price for natural gas was $6.87 per thousand cubic feet (Mcf) ($6.87/Mbtu). Although there are important regional differences, the Henry Hub price is a major trading point for natural gas and thus reflects general market conditions for U.S. natural gas. Compare the November 2008 price with the summer of 2008, when Henry Hub natural gas prices reached nearly $14/Mbtu ($1.40/therm). Natural gas prices have fallen over the past several months for several reasons, predominantly because of increased U.S. production, weakness in the U.S. and global economy, and the collapse of oil prices.20
Figure 15 The EIA projects that the Henry Hub price of gas will average $6.25/Mcf
in 2009. shows the 5-year price chart for U.S. natural gas prices.
Natural Gas Prices
Forecast
0
5
10
15
20
Jan 2004 Jan 2005 Jan 2006 Jan 2007 Jan 2008 Jan 2009
Dollarsper
thousandcubic feet
Residential PriceHenry Hub Spot PriceComposite Wellhead Price
Short-Term Energy Outlook, December 2008
Figure 15. Five-year price chart for natural gas (Source: EIA)
20 Source: U.S. Dept of Energy, Energy Information Administration (EIA). Available on-line at http://www.eia.doe.gov/steo#Natural_Gas_Markets

25
Note that residential retail prices are significantly higher than Henry Hub (wholesale) prices. The cost of gas delivered to customers includes distribution and pipeline costs as well as metering, taxes, and other costs from the local utility. Commercial and industrial customers typically pay lower rates than residential customers. Table 13 shows the average natural gas rates in Kansas by customer type through December 2008.21
Table 13. Average 2008 Monthly Natural Gas Prices in Kansas, by Customer Type
It is likely that in the near term these rates will show a continued downtrend. The value for “electric power price” is the rate paid for gas used to generate electricity. EIA reports the data in terms of $/Mcf. We have reported these values in $/Mbtu to be consistent with the other units used in this report.
Sector/ $/MMBtu Apr-08 May-08 Jun-08 Jul-08 Aug-08 Sep-08 Oct-08 Nov-08 Dec-08 AverageResidential Price 15.29 17.14 22.41 23.81 24.90 21.82 18.73 12.71 10.41 18.58Commercial Price 14.57 15.71 18.61 19.11 19.32 17.54 15.15 11.64 10.06 15.75Industrial Price 9.30 9.64 10.09 11.09 10.11 8.35 6.95 7.84 9.25 9.18
Electric Power Price 10.22 10.98 11.65 10.85 8.97 6.67 4.50 4.88 8.59 Figure 16 shows the historic price of Kansas natural gas, adjusted to 2008 dollars. Prices have experienced significant volatility over the 36-year period. From the early 1990s until approximately 2000, prices were near or below $4/Mbtu and relatively stable. Since the year 2000, prices had been on a steady upward trend until the fall of 2008. With the recent economic downturn, prices have fallen significantly. On January 22, 2009, the Henry Hub natural gas price closed at $4.72/Mbtu. Although prices have fallen precipitously over the last few months, the long-term trend line is still upward, at least for now.
Kansas Natural gas Price in Real Dollars
$-
$2.00
$4.00
$6.00
$8.00
$10.00
$12.00
1970
1972
1974
1976
1978
1980
1982
1984
1986
1988
1990
1992
1994
1996
1998
2000
2002
2004
2006
Jan -
Aug 20
08
Oct-08
Dec-08
Year
$/M
MB
tu
Figure 16. Kansas industrial customer natural gas prices (1970-January 2009)
21 Source: EIA Natural Gas Navigator, http://tonto.eia.doe.gov/dnav/ng/ng_pri_sum_dcu_sks_m.htm

26
3.2.1 Regional Demand for Natural Gas The primary providers of natural gas in the study area are Kansas Gas Service and Black Hills Energy (formerly Aquila). Figure 17 shows the approximate service territory boundaries for the natural gas providers in the region.
Figure 17. Gas utility service territories in the study area
NREL contacted the gas providers, who provided aggregate data on customer demand by zip code or town/city place name. NREL staff then aggregated these data to the county level. Table 14 shows the estimated regional demand for thermal energy based on natural gas consumption. These numbers do not account for customers heating with propane, fuel oil, or other sources such as electricity, corn, or wood pellets. Overall, nearly 235 million therms of natural gas are consumed each year by more than 225,000 customers in the study area. The largest county in terms of both consumption and number of users is Sedgwick, which contains Wichita.

27
Table 14. Regional Demand for Natural Gas by Customer Type
County Therms # of Users
Average Use
Therms # of Users
Average Use
Therms # of Users
Average Use
Therms # of Users
Barber 1,040,442 1,481 702 391,788 256 1,532 0 0 0 1,432,230 1,737Clark 576,868 777 743 181,722 133 1,366 233,991 7 33,427 992,581 917Comanche 457,942 626 732 266,810 128 2,089 0 0 0 724,752 753Edwards 691,173 911 758 500,976 188 2,660 142,831 16 8,927 1,334,980 1,116Ford 6,609,854 10,616 623 4,433,399 1,071 4,139 14,841,118 189 78,524 25,884,371 11,876Kingman 1,354,386 1,990 680 588,138 306 1,919 180,679 5 35,543 2,123,203 2,302Kiowa 634,912 689 922 285,830 135 2,111 408,839 37 11,050 1,329,581 861Pawnee 1,528,536 2,029 753 529,844 256 2,069 169,351 8 21,169 2,227,731 2,293Prattt 2,386,993 3,201 746 1,498,291 487 3,074 234,771 18 13,043 4,120,055 3,706Reno 13,864,507 20,655 671 4,683,720 1,907 2,457 23,068,579 27 854,392 41,616,806 22,588Sedgwick 106,217,438 162,805 652 34,022,082 12,565 2,708 11,267,245 75 150,230 151,506,766 175,445Stafford 1,032,418 1,348 766 398,222 257 1,549 84,910 9 9,434 1,515,550 1,615Total 136,395,468 207,128 47,780,823 17,690 50,632,314 391 234,808,605 225,209
TotalCOMMERCIAL INDUSTRIALRESIDENTIAL
Figure 18. Industrial natural gas usage (therms)

28
The maps showing number of users, therms per user, and total therms are shown in Appendix C for each of the three customer segments. Looking at the map above and the maps in Appendix C, it is clear that the largest potential customer base is in Wichita, Hutchinson, and Dodge City, collectively, with the exception of some scattered larger facilities across the region.
3.2.2 Potential Demand for Pellets Based on Regional Natural Gas Use Table 15 shows the tons-of-pellet equivalents if all natural gas usage in the region was converted to pellets. Clearly pellets will not replace 100% of gas usage, although the annual consumption of natural gas in the region is equivalent to approximately 1.6 million tons of pellets, assuming 7,000 Btu/lb for the pellets.
Table 15. Estimated Tons of Pellets Equivalent to Regional Natural Gas Consumption
County Tons # of Users
Average Use
Tons # of Users
Average Use
Tons # of Users
Average Use
Tons # of Users
Barber 7,432 1,481 5.02 2,798 256 10.95 0 0 10,230 1,737Clark 4,120 777 5.30 1,298 133 9.76 1,671 7 238.77 7,090 917Comanche 3,271 626 5.23 1,906 128 14.92 0 0 5,177 753Edwards 4,937 911 5.42 3,578 188 19.00 1,020 16 63.76 9,536 1,116Ford 47,213 10,616 4.45 31,667 1,071 29.56 106,008 189 560.89 184,888 11,876Kingman 9,674 1,990 4.86 4,201 306 13.71 1,291 5 253.88 15,166 2,302Kiowa 4,535 689 6.59 2,042 135 15.08 2,920 37 78.93 9,497 861Pawnee 10,918 2,029 5.38 3,785 256 14.78 1,210 8 151.21 15,912 2,293Prattt 17,050 3,201 5.33 10,702 487 21.96 1,677 18 93.16 29,429 3,706Reno 99,032 20,655 4.79 33,455 1,907 17.55 164,776 27 6,102.80 297,263 22,588Sedgwick 758,696 162,805 4.66 243,015 12,565 19.34 80,480 75 1,073.07 1,082,191 175,445Stafford 7,374 1,348 5.47 2,844 257 11.06 606 9 67.39 10,825 1,615Total 974,253 207,128 341,292 17,690 361,659 391 1,677,204 225,209
RESIDENTIAL COMMERCIAL INDUSTRIAL Total
The data in Table 14 and Table 15 show that Ford, Reno, and Sedgwick counties are by far the largest consumers of natural gas in the region. The best opportunities to identify potential users of biomass pellets will be within the consumer and industrial sectors. Totaling the pellet potential across these two sectors, we get approximately 700,000 tons maximum potential per year. Assuming pellets can capture 5% of this market, we get a total of approximately 35,000 tons per year potential in the local market place. This is not to suggest that the market in the area is limited to 35,000 tons. It may be possible to identify several larger potential customers that could consume more than 35,000 tons at a single facility. These large potential users should be contacted directly to discuss their possible interest in biomass pellets. It is also possible to develop markets outside of the local area, especially if pellets can be loaded onto rail cars at the plant.
The residential sector may have some interest in biomass pellets as well, but consumers must be made aware that they will need to purchase an appliance that can handle the higher-ash pellets.
Entrepreneurs interested in starting a pellet facility should be prepared spend signification amounts of time educating potential end users and developing the market prior to constructing the facility. One of the biggest challenges of building a facility to make ag pellets is that there are no existing customers. This is the proverbial “chicken and egg” problem — end users will only be willing to invest in the conversion technologies to burn pellets if there is a reliable, affordable, high quality product available, and the builders of a pellet mill must have a reliable, credit-worthy customer base to ensure that the product they make can be sold. Under current market conditions, there are not many compelling reasons to be an early adopter.

29
3.3 Potential Customers There are no real incentives or rewards for customers to implement biomass heating at this time. Most consumers will make a decision on which fuel to use based on price and convenience. If natural gas is the most convenient reliable, lowest cost, and cleanest burning fuel, then that is a clear market advantage. Consumers may be willing to switch to biomass, but they will want a price concession to offset on-site fuel handling, ash disposal, appliance costs, and increased labor costs.
However, American consumers have short memories, and they tend to grow complacent when fossil fuel prices are low. When natural gas prices start creeping up again, or when some kind of carbon accounting mechanism is implemented, interest in the biomass concept will once more develop. Project proponents should be spending this time educating the market and developing the groundwork for potential projects that can move forward rapidly when market conditions change. Proponents should also be spending time developing fuel supply contracts.
Appendix D contains a listing of the largest potential customers we could identify in the study area. The list is certainly not all-inclusive because we did not perform a thorough search, especially in the Wichita area. We attempted to obtain a state-wide database of boilers, available from the Kansas Department of Labor, but received only an Adobe PDF copy of a directory, sorted alphabetically by company name for the entire state. The data could not be sorted or manipulated in any way. After repeated attempts to obtain the data behind the PDF, we gave up and did not use the list.
3.3.1 Potential Large Industrial Customers One of the things that would make life easier for a potential pellet plant developer is to identify potential large commercial or industrial customers who may be interested in switching from their current heating technology to ag pellets. The residential sector is also a possible market outlet as long as the consumer has a stove that can handle the fuel characteristics of the pellets being produced. It will take perseverance and staying power for project proponents to educate and develop a customer base in the region.
A successful large-scale, biomass fuel production facility in the Greensburg/Pratt area would likely need long-term supply contracts with consumers in order to obtain financing. Two industrial plants in the area meet the criteria for significant year-round use: Orion Ethanol in Pratt and National Gypsum in Medicine Lodge. The Pratt ethanol plant is not operating at this writing but presumably could be reactivated when more favorable business conditions return.
The National Gypsum drywall manufacturing plant in Medicine Lodge, Kansas, could also utilize biomass fuel. The plant currently consumes about 900,000 Mbtu per year of natural gas in its dryers. Offsetting 75% of this load would require on the order of 45,000 tons of biomass pellets (or 50,000 tons of 25% moisture content cedar chips) per year. As of February 2009, National Gypsum Manager Jim Ruggerio is interested in exploring the economics of switching from gas to biomass.22
Mr. Ruggerio stated that biomass costs must compete with natural gas. National Gypsum currently purchases natural gas for the NYMEX price, plus about 45 cents for delivery. The delivered cost of gas is presently about $5.00/Mbtu, although this price fluctuates daily. We do
He envisions adding biomass-fired dryers to supplement the existing gas burners and prefers a compacted fuel to alleviate large quantities of baled biomass on the plant site.
22 Personal communication with Chris Gaul of NREL, August 2008, February 2009.

30
not believe that biomass pellets can be delivered to National Gypsum for $5 per million. If 1 ton of biomass pellets has 15 Mbtu, then the delivered cost would need to be $75 per ton to meet $5/Mbtu gas. About the only biomass that comes close to meeting this cost is cedar chips.
It is interesting to consider emissions of carbon dioxide. Consumption of 675,000 Mbtu/yr of natural gas (75% of National Gypsum’s consumption) emits 39,500 tons of CO2/yr. Since biomass is considered CO2 neutral, conversion to biomass could potentially make available carbon credits for National Gypsum under a cap and trade system. Some of these credits may need to be given to the biomass supply company to offset the emissions of the biomass pellet operation (from field to customer). NREL has not calculated the total life-cycle cost of biomass pelletization. Alternatively, the price of natural gas would go up by approximately $1.20/Mbtu if CO2 is taxed at $20 per ton. This would make biomass pellets more attractive to the plant.
National Gypsum and interested entrepreneurs should explore the economics in greater detail and monitor market conditions. A customer of this size would allow for a pellet mill in the region large enough to take advantage of economies of scale associated with equipment sizing and reduced processing costs. Pellets or briquettes could be truck shipped to Medicine Lodge, which is 30 miles from Pratt and 60 miles from Greensburg.
Other large industrial customers would include meat packing and other agricultural processing facilities in Dodge City, and many potential users in Wichita. (See Appendix D for a partial list.) No other potential large customers were contacted in this study.
3.3.2 Other Potential Customers Other potential biomass end-users include schools and universities, large agricultural operations, federal facilities (which are required to install renewable energy systems and reduce fossil fuel usage), hospitals, state and local government buildings, industrial parks, and large commercial users (e.g. Boeing in Wichita). Appendix D shows a partial list of these customers.
In addition, as Greensburg constructs new infrastructure, we strongly suggest that biomass be evaluated as a heating technology. For example, the new municipal buildings and hospital could easily be heated with biomass pellet technology.
3.4 Competitor Analysis Currently, there are not any other biomass pelletization companies in the local area, so direct competition is limited. There are, however, at least two agricultural pellet manufacturers located within a few hundred miles of Pratt/Greensburg.
SMEC, in Centerview, Missouri, organized a cooperative to collect and pelletize agricultural residues. SMEC, which is 340 miles from Greensburg and 236 miles from Wichita, was one of, if not the first, large-scale pelletizer of ag residues for the thermal energy market. Early adopters experience a steeper learning curve. SMEC has had various production and market-development issues to overcome, including improperly sized motors for the local electrical system. Currently, they are producing 30,000 tons per year rather than the planned 60,000 tons. SMEC uses a 50-50 blend of ag residues (currently old hay) and wood (pine and/or oak). As documented in Section 2, we tested samples of their pellets and found them to have an energy content of about 7,059 Btu/lb, 9% ash, and 1.44 lbs alkali/Mbtu. The current selling price FOB at the plant in Centerview is $130 per ton, or about $9/Mbtu. The plant is also selling undensified biomass—essentially ground up straw or hay—to a coal-fired power plant located about 50 miles away. The coal plant is also purchasing pellets and, presumably, is comparing the performance of the densified versus undensified form.

31
The developers of this plant have expressed interest in helping others who want to start similar plants, either as a partner in a new facility or through provision of consulting services.
Prairie Fire Bioenergy Cooperative in Healy, Kansas, also has a new pellet operation. At present, they are producing about 26,000 tons per year. They describe their raw material as “agrifiber material (crop wastes like straw and stalks, perennial native grasses, weeds and ditch grass, wood wastes, paper and cardboard)…blended, chopped, dried and milled.” Production capacity is claimed to be seven to eight tons per hour. Prairie Fire is presently making a blend of 85% wood and 15% ag residue. They are bagging their product and selling it into the residential pellet market, meeting the Standard Grade of the Pellet Fuels Institute (less than 3% ash). The product is being sold in eight locations in Kansas, including Dodge City and Scott City on the west, and as far east as Manhattan.
Prairie Fire’s original business model was based on finding a heavy industrial user and replacing gas and/or coal. Densification was used only to get trucks fully loaded to 23 tons so pellets could be shipped to the SMEC plant in Centerview, Missouri. From there, agricultural residue pellets would go by rail to a seaport and be shipped to Europe. This scheme collapsed with the 2008 recession.
Prairie Fire also proposed to a nearby ethanol plant the retrofit a Uniconfort biomass-fueled gasifier to provide steam (provided by AES/Wichita Boilers). Prairie Fire proposed that they would finance, install, and own the boiler, and sell steam at the equivalent price of $6.25/Mbtu natural gas price in a typical Energy Service Performance Contract arrangement. Prairie Fire told NREL that the ethanol plant was not interested in using biomass fuel, even when natural gas was more than $8/Mbtu. Prairie Fire could have readily provided 80,000 tons per year for the ethanol plant.
Finally, Prairie Fire switched its emphasis to producing fuel meeting Pellet Fuel Institute Standard Grade specifications. Their pellet contains 15% agricultural residues (85% wood) to meet the >3% ash requirement of the institute. With this restriction, the plant can produce 26,000 tons per year. On agricultural residues alone, their annual output could be 50,000 tons.
Ozark Hardwood Products is a wood pellet manufacturer located in Seymour, Missouri. Ozark is the closest wood pellet manufacturer to potential end users in the study area. Ozark hardwoods is presently selling high Btu (> 8,000 Btu/lb), low ash (<1 %) oak pellets (as of December 2008) for $130 per ton FOB Missouri. Ozark provided an estimated delivery cost to Greensburg of $55 per ton using bulk delivery (not bagged). As shown earlier in Table 12, biomass pellets at $160 per ton would be only $0.60 per Mbtu cheaper than Ozark’s pellets at $185 per ton. It is not likely that end users would be willing to deal with a higher ash biomass pellet which requires a high-ash appliance if premium pellets (which can be burned in any pellet or corn burning appliance on the market) are available for only $0.60/Mbtu more.
Ozark Hardwoods has also begun offering a new service whereby they sell a pre-packaged pellet boiler/storage system that is assembled in a shipping container and shipped to the customer site, where it is then connected to existing equipment. Ozark provides the end-user with the boiler and bulk pellets. The end-user must sign a long term contract with Ozark for supply of pellets.
Abengoa Ethanol Plant. As of the summer of 2008, Abengoa was proceeding with plans to build a combination corn ethanol/cellulosic ethanol plant in Hugoton, Kansas, which is 130 miles from Greensburg. Current plans call for production of 88 million gallons of ethanol per year from approximately 32 million bushels of corn. The plant will also produce 12 million gallons

32
per year of ethanol from cellulosic biomass, requiring over 490,000 “as is” tons of feedstock per year. Abengoa states that they will require 10%-12% of the biomass within a 50 mile radius of Hugoton. With this plant being 130 miles away from Greensburg, we do not see it as being a competitor for feedstocks in the Pratt or Greensburg area. Of particular interest with this facility is their plan for biomass procurement. Summary information on the plan is provided below:
• Producers obtain a contract signing bonus of $1 per acre for signing up as a supplier. • Abengoa pays an annual reservation payment to each producer of $0.50 per acre. This is
paid to the supplier every year even if Abengoa does not need the biomass from that supplier.
• Nutrients (P and K) returned to producers (residues from ethanol plant are high in P and K). Producers will be given coupons to replace the N removed in the harvested feedstock.
• Base payment
o Abengoa pays a single negotiated per ton price to every supplier in its network.
o Abengoa equipment and labor collect the biomass (or use contract harvester).
• Revenue sharing payment (optional)
o Producer accepts lower base payment for some biomass and takes share of ethanol plant profit.
3.5 Are Pellets The Best Solution as an Alternative to Fossil Fuels? So far, this chapter has focused on potential opportunities for pellets to act as a substitute for fossil fuels, primarily natural gas. To date, the U.S. pellet market has been dominated by premium wood pellets sold to the residential sector. Small commercial applications are beginning to come on line but have not yet taken off in a meaningful way.
As Campbell discusses in his report, for the industrial, institutional, and utility sectors, it would be instructive to consider whether biomass pellets are a superior solution (rather than a viable product). After all, pelletizing biomass requires equipment, energy, and labor. One should incur the costs to pelletize biomass if pelletizing appears to be the only solution or the most cost effective solution to a problem or challenge. For the large industrial customer, this is not always the case.23
Pellets have some excellent characteristics, including consistency of shape, density, moisture content, and energy value; and pellets can be blended and pulverized with coal, unlike some other biomass forms. Pellets can also be stored vertically in silos and thus do not require bulk storage of bales or large wood chip bunkers. Because the fuel is uniform and low moisture, the boiler or appliances can be significantly smaller (hence, lower capital costs) when compared to bulk fossil fuels. However, pellets can disintegrate in mechanical handling systems, they are more expensive than bulk biomass, and they lose functionality when they absorb moisture.
Campbell documents that in the past decade, there have been numerous opportunities to choose the solution of pelletizing biomass for large-scale biomass projects in the upper Midwest, but pelletizing was not selected:
• For the Chariton Valley switchgrass/coal co-firing project, the fuel processing solution is to deliver bales of switchgrass to a processing facility adjoining the Ottumwa Generating
23 The bulk of the discussion in this section comes from Campbell’s report.

33
Station. The bales are shredded, and the switchgrass is blown into the boiler. This is a sufficient processing solution to convert farmers large round bales of switchgrass into boiler fuel.
• The Fibrominn power plant in Benson, Minnesota has arrangements for turkey litter to be shipped from western Wisconsin, a distance of more than 200 miles. This solution does not entail pelleting the turkey litter to improve its hauling and handling characteristics.
• The University of Minnesota is receiving large quantities of oat hulls at its Twin Cities campus for co-firing with coal in the Southeast Steam Plant. Oat hulls do not have ideal physical characteristics, but there is no need to incur the expense of pelleting the oat hulls for transportation, storage, or blending.
• When the St. Paul cogeneration facility had quality control problems with its wood supply, its solution was not to contract for pellets. Instead, an off-site receiving and processing station with grinding and screening equipment was developed to ensure that wood delivered to the cogeneration plant meets fuel specifications.
• At the University of Minnesota, Morris, a biomass gasification facility is under construction. The primary fuel is intended to be corn stover. To date, the project team has apparently not anticipated a problem for which pelleting the corn stover is the only solution or the most cost-effective solution.
Biomass pellets would work in all of these facilities, but pellets simply aren’t necessary. For these facilities, pelletizing the biomass would be over-processing; it would not make economic sense to pay for the added costs when all they need is grinding and/or drying to make the combustion or gasification process work.
The examples above are relatively large-scale. It could be that the economics and physical possibilities are different for smaller-scale industrial, institutional, and utility plants, especially those located in areas with restricted space. For them, buying, storing, and using pellets may be a more cost-effective solution. To date, however, there does not seem to be a market for biomass pellets to fuel heating and power systems in these large sectors. Thus, the viability of this solution is not evident in the United States, although it should be mentioned that Europe has implemented many large-scale pellet heating systems. The present economic and political policies in Europe are driving the markets in those countries.
3.6 Summary of Market Potential For a compressed agricultural residue product to be commercially viable, it has to have a cost advantage over more convenient and widely available fuels. This includes wood pellets as well as fossil fuels. The Pellet Fuel Institute has established wood pellet specifications to assure consumers and heating equipment manufacturers of a consistent product. Thus wood pellets are truly a commodity product. A lower-cost producer can ship farther and thus compete with smaller, higher-production cost pellet mills, even in the smaller mill’s own back yard. Agricultural residue pellets are generally lower grade than wood pellets. If agricultural residue pellets are available in the same market as wood pellets they would have to sell at a lower price to compete with both wood pellets and natural gas. Biomass pellets are likely to compete very favorably with propane, fuel oil, commercial natural gas rates, and electricity, but so will wood pellets.
Any entrepreneur who seeks to develop a biomass pelletization facility in the Greensburg/Pratt region should be prepared to spend considerable time and effort to educate potential consumers and develop the market.

34
4. Densification Plants—Process Flows and Equipment
This section draws heavily from “A Feasibility Study Guide for an Agricultural Biomass Pellet Company” by Ken Campbell, produced under contract for Agricultural Utilization Research Institute by Cooperative Development Services of Madison, Wisconsin and Campbell Consulting LLC, of Shoreview, Minnesota.
A biomass or wood pellet plant has a receiving area, unload facilities, a tub grinder to reduce wood or baled biomass into smaller particles, and equipment for drying, extruding, cooling, and packaging. The plant will have a storage area for pellet production to continue in the slow summer season. Pellet plants are capital intensive, producing a low-value commodity product. Pellets must compete against fossil fuel on a cost basis. This will be the case until a carbon tax, renewable energy standard, or some other financial incentive exists to use pellets.
4.1 Feedstock Consistency It is important to note that feedstock consistency is an important aspect of the pellet manufacturing process. Inconsistencies can be experienced in supply and quality. Inconsistencies in supply of the raw material will cause inefficiencies in plant productivity, which in turn will cause operating costs to be higher because processing equipment is designed to operate at full capacity.
Variations in feedstock quality will have a detrimental effect on final product quality. A premium quality wood pellet, as defined by the Pellet Fuels Institute, states that ash content must be below 1%. With wood biomass, the highest source of ash is bark; therefore, woody biomass is typically debarked prior to processing. In residential or commercial use, burning pellets that have high ash content results in increased maintenance because of the need to remove excess ash. Therefore, high ash pellets currently are not used extensively.
It is also possible for “tramp” or foreign material to be present in the feedstock. Tramp material can include stones, glass, metal, dirt, and other contaminants. Multiple magnets should be inserted before the hammermill or dryer. It is important for all tramp material to be removed prior to the raw material being introduced to the processing equipment. Tramp material that is present while in the processing equipment can significantly reduce the expected lifetime of consumable components (i.e., hammermill screens, pellet mill dies, etc.).
4.2 Compressed Biomass Forms Pellets that are ¼ in. or 5/16 in. in diameter are the most costly compressed biomass form. It appears from the literature that the term briquette can be applied to any compressed biomass form larger than a pellet. Typically, briquettes are square or rectangular and can range in size from that of the typical backyard-barbeque fuel to the size of a building brick. Bripells are the same shape as pellets but are 1-1/2 in. in diameter. They are so named because they are between briquettes and pellets in size.
Pellets are a refined product and require the most expensive processing. The higher fuel cost is offset by the convenience of fuel burning equipment that can be automated and needs minimal attention when compared to bulk biomass systems. This is important when competing against almost zero-maintenance natural gas, propane, or electric heat. Larger compressed agricultural-residue fuel forms require less energy input and can have simpler production methods.

35
Equipment ranges from industrial sized that makes many tons per hour to trailer-mounted machines towable by a pickup that produce 600 pounds per hour.
With briquettes the supplier will want to provide a quality-consistent product, but that product is not competing head-to-head with wood pellets. When moving from pellets to briquettes, a solid fuel manufacturer leaves the pellet fuel commodity market. Briquette manufacturing is reported to have lower capital costs and lower manufacturing costs when compared with pellets. There are several manufacturers with products on the market. We obtained information from A3 Energy Partners of Oregon, which is a U.S. distributor for the RUF briquetting machine (from Germany). Renew Energy Systems of Osage, Iowa, represents a different machine (CF Nielsen from Denmark).
Information from Bioenergy Investments LLC on bripell production claims a $6 per ton cost advantage on electricity input as compared to pellets. Their production equipment uses fines from biomass processing to fuel the dryer. Using data from Campbell, this saves another $4 per ton on natural gas. Bioenergy Investments LLC sold a bripell plant in August 2008 to Raceland Raw Sugar in Louisiana to compress bagasse. Equipment and spare parts for the 75 ton per day plant was $950,000. Production is scalable by adding additional bripell machines while utilizing common raw and finished material handling equipment.
4.3 Pellet Manufacturing 4.3.1 Costs of Production and Economies of Scale Pellet mill technology has evolved from pelletization of various agricultural crops. The technology is mature, there are vendors with many years of operating experience, and plant operations are well understood. Figure 19 shows a general layout for a wood pellet mill.
While the proposed project for this study is a combination of wood and agricultural residues, the general layout, equipment and process flows will be the same. The wood-pellet mill business is dominated by three firms: California Pellet Mills, Bliss Industries, and Andritz-Sprout. Numerous smaller manufacturers are also available. In addition, there is used and refurbished equipment on the market.
The general process is as follows. 24
If initial raw material sizes are uniform and small (generally less than ¾ in.), then it may make sense to run the material through a dryer prior to hammermilling, because the small particle size will allow for complete drying and hammermilling dry feedstock takes less energy and leads to less wear and tear on the hammermill when compared to wetter feedstock.
Raw material is brought to the pellet manufacturing facility, where it is then fed into a hammermill and reduced in size, if necessary. The raw material is then dried before being processed in the pellet mill. The finished pellets are then cooled and packaged (if selling into the retail market), then shipped out or moved to storage, where they await delivery.
24 Most of the material in this section was adapted from personal communications provided by Jack Whittier of CH2MHill.

36
Figure 19. General pellet mill layout
The following contains a general discussion of the equipment needed for a pellet mill.
Front-end Loader or Forklift. A front-end loader or forklift (in the case of bales) is used to move raw material from the main feedstock storage area into the processing stream. Forklifts are also used after bagging to stack bagged pellets on pallets. A forklift is used to transport the palleted fuel to storage and to assist in loading and unloading.
Primary Grinder (not shown in figure). The primary grinder reduces raw material into 1-1/2 in. to 2 in. x 1/4 in. chips (approximately the size of a matchbook). A primary grinder can be either a chipper, large hammermill, tub mill, or “hog.” The material is then able to be processed by a hammermill and dryer. Bales of ag residues will need to be ground prior to additional processing.
Conveyors. Screw conveyors, air conveyors, cyclones, and high-speed elevators are used to transport raw materials in the pellet plant. Belt conveyors, chain drags, and low-speed elevators are used to transport pellets because pellets are more fragile than the raw material.
Dryer and Burner Assembly. A dryer is usually a rotary drum with an attached burner that blows heated air through the tumbling raw material. The drum is designed as either a one-pass (once through) or three-pass system. If the raw material is wet, drying is necessary. If the moisture content of the incoming biomass is less than 10% to 15%, no dryer is needed. Moisture content is reduced to approximately 8% to 10% in the dryer. Dryers can run on fossil fuels or biomass. If running on biomass, it is important to budget for the raw material needed to supply

37
the dryer. A commonly used assumption based on operational experience is that 15% of the raw material will be used by the burner in the drying process.25
Feed Hopper. A feed hopper is used to feed material to the hammermill using a screw conveyor.
Therefore, a 50,000-ton-per-year pellet mill (output) would require an additional 9,000 tons per year for dryer fuel.
Hammermill. A hammermill reduces the particle size to 1/8 in. nominal size or less. This particle size allows the downstream pellet mill to operate efficiently and to produce a more presentable and durable pellet. In this process, a large amount of stress is placed on the screens, which have a limited life and must be replaced regularly.
Conditioner. A boiler or hot water heater is often used to create steam that lubricates and heats the fiber to make it easier for the material to pass through the pellet mill die. The heat also softens the lignin in the feedstock so the pellet binds better and further lubricates the die. Because the cost of a boiler is excessive for smaller installations, a hot water heater can also be used although it is not as effective.
Feed Hopper. A bin or hopper must be placed directly before the pellet mill to ensure a steady flow of material for the pellet mill’s feed screw. The pellet mill will not work properly unless its feed rate can be controlled independently from the rest of the plant. Since biomass does not feed well in ground form, it is important to have this bin furnished with a screw auger to keep the material flowing. The screw in the bottom of this bin should be driven by a variable speed drive that controls the feed rate of the pellet mill.
Pellet Mill. During the pellet process, the biomass is pressed through a rotating or stationary die with holes the same diameter as the desired pellet. For typical pellets, the size is 1/4 in. or 5/16in. The pellets are cut off after exiting the die by knives or by centrifugal force to a length of not more than approximately 1 inch. At this point, the pellets are hot (190 to 220°F) and fragile because to the moisture from steam and/or water added by the conditioner. The densification rate of the finished product should be 40 to 44 pounds per cubic foot of volume, or more than twice the density of the incoming material. A great deal of stress is placed on the die in the pellet mill; therefore dies must be replaced regularly.
Pellet Cooler. The temperature of the hot pellets must be reduced in order to harden and strengthen the pellets prior to bagging. Cooling also stabilizes the pellet moisture levels and prevents “sweating” in the bag when the pellets are stored. The pellet cooler does this by drawing ambient air through the pellets as they pass through the holding compartment of the machine. The counter-flow cooler, which uses evaporative and convective cooling techniques, is most widely used for this application.
Pellet Shaker. The pellet shaker or screening device separates whole pellets from broken pellets and fines that are created in the manufacturing process. Excessive fines can cause problems in pellet stoves and create dust as the bag of pellets is emptied, therefore fines should not be bagged. Fines are returned to surge bins and are either used as fuel for the dryer or reintroduced in the process line.
Bagging Bin and Bagger. A bagging system is either automatic or manual. An automatic bagging system represents a significant capital cost; on the other hand, it mitigates the labor costs associated with manual bagging. In both processes, the finished pellets are moved to a surge bin 25 Google video. http://video.google.com/videoplay?docid=-5902182363142348090

38
prior to bagging. A metering device ensures the proper amount of pellets is being placed in each bag, which should contain 40 pounds of pellets. A bagger is needed only if selling to the residential market.
Buildings. Typically, most of the processing machinery will need to be housed in a building. The building should also be used for storage of the finished pellets.
Fire Suppression System. For drying and grinding systems, some plants add fire suppression systems, an electronic spark detection and suppression system that helps control costly fires and subsequent down time. The benefits of adding this type of equipment vary widely and are dictated by the cleanliness of the raw material (e.g., stones, metal, etc.). Often times the installation of fire suppression equipment is required by law and will result in lower annual insurance premiums.
Cyclone. A cyclone is used in the dust separation process. The fine particles can either be removed from the system or used as fuel for the burner.
4.3.1 Capital Costs Estimates This section provides general information on the approximate costs of setting up a pellet mill in the study area. It is important to note that these costs are only estimates and do not represent a project budget. They are intended to give the entrepreneur an idea of the amount of capital required to start and operate a plant.
Based on the feedstock in the region, we estimate the costs for setting up a 4 dry ton per hour (dtph) pellet mill. This number is derived as follows. A pellet mill will operate year round, 16 hours a day for 6 days per week, 50 weeks per year. This is equivalent to 4,800 operating hours per year, or production of 19,200 dtph. We feel this is the minimum size of plant that one could build and still hope to be economically viable. Assuming that 15% of the feedstock input will need to be used to fuel the dryer, and that 15% will be lost in processing, approximately 26,500 dtpy will be needed to feed the plant. Depending upon the moisture content, this equates to raw feedstock requirements of 35,000 to 52,000 tons per year. In general terms, this is a small pellet mill, and larger mills will have better economies of scale. Moving to a third shift and running 7 days a week would increase the production of this plant to 33,000 tons per year.
Assuming a cedar resource of 12,500 bdt/yr, this means an additional 14,000 bdt/yr of ag residues will need to be procured for the plant. This total feedstock requirement seems to be in line with the feedstock constraints in the region (e.g., that there are only 12,500 bdt/yr of cedar available and that the target blend would be a minimum of 50-50 wood/ag). The pellets from this plant would be approximately 50% wood and 50% ag residues, assuming that ag residues can be used to fuel the dryer. Remember that SMEC is a 50-50 wood/ag blend, and Prairie Fire is an 85-15 wood/ag blend.
Based on data from Campbell26
26 Ken Campbell. A Feasibility Study for an Agricultural Biomass Pellet Company. Agricultural Utilization Research Institute. November 2007, pg. 84.
, a 4 ton per hour pellet mill will not be as cost effective as a larger plant. In fact, Campbell finds that the costs of building larger plants do not increase linearly (e.g., the cost of an 8 dtph mill is only about 50% higher than the cost of a 4 dtph mill). Campbell goes into great detail on the estimated capital costs of various sized pellet mills (see chapter 13 of Campbell’s report for more detailed information).

39
As Campbell stresses, the cost estimates in his report are just that—estimates—and they should not be used as a basis for financial decisions. The same can be said for this report. Any entrepreneur seeking to build a pellet mill in the region should obtain detailed, site-specific cost estimates from reliable equipment suppliers. Campbell only considers new equipment and does not look into used or refurbished equipment. While refurbished equipment may have lower up-front costs, the warranties and performance are not likely to be as good as that of new equipment. Any pellet mill developer will need to weigh the pros and cons of new versus used equipment for his or her particular case.
Table 16 shows Campbell’s cost estimates for various sized pellet mills. The 2-ton-per-hour mill is a “farm-scale” operation that only produces about 4,000 tons of pellets per year. This is a bare bones plant that we feel is really not a suitable model for a commercial enterprise, because the costs of production will be quite high on a per-ton basis and the market outlets will be limited. We believe that a 4-ton-per-hour plant is the smallest plant one would build if trying to develop a viable commercial business.
As can be seen in the table, the installed cost (per ton of manufacturing capacity) decreases as the plant gets larger. This supports the case for building the largest plant that the local biomass resource will support. A 4 ton per hour plant will cost approximately $5.5 million to construct, not including financing charges. Campbell provides two separate estimates for a 14 ton per hour plant.

40
Table 16. Capital Cost Estimates for Various Sized Pellet Mills (Campbell, 2007)
4.3.2 Costs of Production This section provides a general estimate for the cost of making pellets for a 3 dtph pellet mill (approximately 24,000 tons per year capacity). Much of the data from this section are taken from a presentation given by Jack Whittier at a biomass energy utilization course held at Colorado

41
State University in 2007.27
Table 17
Mr. Whittier presented the results of a detailed economic analysis for a hypothetical pellet plant sized at either 1 or 3 dtph. The 1 dtph plant was found to be too small to be economically feasible.
shows the estimated labor requirements for the plant. Total labor requirements are 15 full time employee equivalents (FTEs) with an annual payroll of $473,000. The operations manager charges only 50% of his time to this plant and is engaged in other activities the remaining 50% of the time.
Table 17. Estimated Labor Costs of Pellet Manufacturing ($/ton)
Classification Rate Number Labor Charge Benefits @35% PayrollOperations Mgr. 50,000$ 0.5 25,000$ 8,750$ 33,750$ Operators 30,000$ 4 120,000$ 42,000$ 162,000$ Fuel Handling 30,000$ 3 90,000$ 31,500$ 121,500$ Maintenance 28,000$ 3 84,000$ 29,400$ 113,400$ Baggers 28,000$ 3 84,000$ 29,400$ 113,400$ Sales & Marketing 60,000$ 1 60,000$ 21,000$ 81,000$ Administration 20,000$ 0.5 10,000$ 3,500$ 13,500$
Total 15 473,000$ 165,550$ 638,550$ Table 18 shows the estimated power requirement for the mill. These numbers were used to determine the costs of electricity for the plant. The total power demand for the 3 tph machine (dtph) is estimated to be 773 kW.
Table 18. Estimated Electrical Requirements for a 24,000-Ton-Per-Year Pellet Mill
Machine 3 tph 1 tphRaw Material Feeders 10 10Conveyor system
Transfer conveyor (recapture to screen) 5 5Drag conveyor (from dryer to hammermill) 1 1Bucket elevator (from hammermill to pellet mill) 3 3Bagger Conveyor 1 1
ScreenScrew 2 2
Rotary dryer 350Hammermill 150 75Wood chipper 40Live Bottom/Mixing Surge Bin 10 10Pellet Mill, (2 motors @ 200 hp for 3 tph) 400 100Pellet Cooler 15 15Bagging system 50Total Horsepower 1,037 222Total Power (kW) 773 166
Table 19 shows the total estimated manufacturing costs for pellets. Note that feedstock costs are listed at $25.70 per dry ton. The estimate we are using for this study is $65 per dry ton, so the costs are estimated to be $40 per ton higher, or $159 per ton. Assuming 15 Mbtu/ton for a wood/ag residue blend, this is equivalent to a cost of $10.60/Mbtu. Also note that the estimate of 27 Whittier, Jack. Presentation entitled “United States Pellet Systems: A Business Plan” May 2007.

42
$159 includes $24.30 for bagging. Removing the bagging operation would reduce the production costs to approximately $135 per ton, or $8.93/Mbtu for wood/ag pellets. If the pellets are 100% cedar, the cost would be approximately $8.44/Mbtu.
Table 19. Estimated Manufacturing Costs of Pellets ($/ton)
Expense Category Total $ $/tonPayroll 638,550$ 30.37$ Feedstock cost 540,317$ 25.70$ Packaging 510,924$ 24.30$ Utilities 325,645$ 15.49$ Debt repayment 212,178$ 10.09$ Front-end loader operation 109,601$ 5.21$ Advertising and sales 77,100$ 3.67$ Dyes and rollers 41,120$ 1.96$ Dryer fuel 25,052$ 1.19$ Repairs and maintenance 10,280$ 0.49$ Insurance 2,570$ 0.12$ Legal 2,570$ 0.12$
Total 2,495,907$ 118.72$ 4.3.2 Economies of Scale The larger the plant, the lower the per-ton costs will be. As shown in Figure 20, Campbell found a 14-ton-per-hour pellet mill to have the lowest production costs and hence the best chances of business success. In his study, each individual piece of process equipment was matched in capacity, i.e., a 14-ton-per-hour grinder, dryer, pellet mill, etc. The costs shown do not include feedstock costs, and the units are in metric tonnes, not short tons (one metric tonne = 1.1 short ton).
In the chart, Campbell shows that a 3-ton- per-hour plant (approximately 24,000 tons per year) has a manufacturing cost of $60 per metric tonne, which is equal to a manufacturing cost of $55 per short ton. Adding in feedstock collection costs of $65 per ton brings the estimated production costs to $120 per ton. This does not include any profit for the plant owner, or loading, shipping and unloading costs associated with moving the product to the final customer’s site. Any assumptions Campbell made in developing the estimates for operating and capital costs are not known.

43
Figure 20. Production costs versus plant capacity (source: Campbell)
4.3.2 Summary of Pellet Economics We estimate that the capital cost for a 24,000-ton-per-year pellet mill will be approximately $5.5 million if new equipment is used. The cost can likely be reduced considerably if high-quality used equipment is used instead. Estimated production costs will be between $120 to $160 per ton.
4.4 Briquetting Briquetting is an alternative densification process of possible interest in the Greensburg region. The briquetting process and the flow of materials are demonstrated in an online video on YouTube™.28 Two recent articles in Biomass Magazine (April 2008; November 2008) discuss the briquetting process and two different machines.29, 30 Briquette production requires less energy, labor, and maintenance than does pellet production. Briquette machines use a high-pressure mechanical press, a screw auger, or an extrusion process similar to pellet making. A number of manufacturers offer briquette machines.31
Figure 21 Briquettes can be either square or round
(see ).
28 http://www.youtube.com/watch?v=RwhRmUof26E 29 Ebert, Jessica. “The Beauty of Biomass Briquettes,” Biomass Magazine, April, 2008. http://www.biomassmagazine.com/article.jsp?article_id=1524 30Schmidt, Suzanne H. “Betting on Biobriks,” Biomass Magazine, November, 2008. http://www.biomassmagazine.com/article.jsp?article_id=2145 31 Manufactures include RUF and CF Nielsen. There are several US distributors for these machines.

44
Figure 21. Sample briquettes
4.4.1 Costs We received a detailed pro forma and capital-cost estimate for a 24,000-ton-per-year briquetting line from A3 Energy Partners of Portland, Oregon.32
The estimated greenfield cost of developing a 25,000-ton-per–year, turn-key briquette plant is $4.75 million. This includes all civil/structural work, a dryer, all feedstock handling and briquette processing equipment, a bagger, engineering and design, electrical and mechanical hook-up, indirect costs (engineering, construction management, controls, testing) freight, contingency, and a spare parts allowance. The plant is assumed to operate 23 hours a day, 6 days a week, producing 3.6 tons per hour of briquettes (84 tons per day, 25,000 tons per year).
A3 did not want us to include their pro forma in this report because they consider it to be proprietary; however, they did say that we could summarize the results.
The A3 cost estimate for manufacturing these briquettes includes biomass at $65/bdt; plastic packaging; salaries and benefits; utilities; repairs; delivery; facility lease; legal fees; and insurance, general, and administrative costs. NREL added the cost of debt repayment (principal and interest), assuming that $4.7 million is financed. We estimate the total manufacturing cost to be $143 per ton, including bagging costs (see Table 20) and delivery costs of up to 36 miles distant. Assuming 100% cedar briquettes (16 Mbtu/ton) and removing the $20 bagging expenses yields a bulk cost of $7.66/Mbtu, including delivery.
Table 20. Estimated Labor Costs of Briquette Manufacturing ($/ton)
Feedstock 65.00$ $/tonBagging and plastic wrap 20.03$ $/tonLabor & fringe 12.00$ $/tonUtilities 17.49$ $/tonRepair and maintenance 3.00$ $/tonDelivery expense 3.68$ $/tonRent and lease 2.40$ $/tonDebt repayment (P&I) 18.94$ $/tonTotal 142.54$ $/ton
32 See http://a3energypartners.com/ for additional information. A3 is also a U.S. distributor for Kob boilers, a high-efficiency commercial boiler from Europe.

45
4.5 Bripells Bripells are larger than pellets but smaller than briquettes. Bioenergy Investments LLC distributes a bripell manufacturing system developed and manufactured in Brazil.33
Table 21
Bioenergy Investments states that the equipment cost for a one-line plant with one year of spare parts (capacity of 12,000 to 15,000 tons per year of bripells) is about $980,000. Two lines would be roughly $2 million in capital costs for the equipment. Additional costs would include engineering and design, land, building, concrete pad, access roads, fuel storage, front-end loader, and fork lift, among others. The total cost is estimated to be $4 million for a 24,000-ton-per-year plant. The additional $2 million above the $2 million quoted by the vendor is an NREL estimate only and is not based on any information provided by Bioenergy Investments.
shows the estimated per-ton costs of bripell manufacturing for the first year of a plant’s operation. It must be stressed that this is an estimate for illustrative purposes only. Project developers should develop their own pro-forma analyses before any investment decisions are made. NREL did not take into account the time value of money, inflation, selling price of bripells, risk, or market conditions. It is assumed that two bripell lines will be required (12,000 tons each), and the total amount financed will be $4 million at 6% interest over 15 years. The estimates for electrical and spare parts were provided by Bioenergy Investments, and the value for maintenance is an estimate by NREL. Note that there are no provisions for bagging the finished product in this example. The total estimated cost is $134 per finished ton, or $8.36/Mbtu for cedar and $8.92/Mbtu for a cedar/ag blend.
Table 21. Estimated Labor Costs of Bripell Manufacturing ($/ton)
Labor Costs/Ton 19.17$ $/tonEnergy 6.00$ $/tonSpares/maintenance 5.00$ $/tonFeedstock loading/unloading 5.00$ $/tonDebt repayment (P&I)) 33.59$ $/tonFeedstock 65.00$ $/tonTotal 133.76$ $/tonCedar (16 MMBtu/ton) 8.36$ $/MmbtuAg/cedar blend (15 MMBtu/ton) 8.92$ $/Mmbtu
Table 22 shows a breakdown of the estimated labor costs for the plant. We estimate 3 shifts per day, 6 days a week will be required to produce 24,000 finished tons per year. An additional 10% of the input biomass will be required to run the dryer. All told, this plant will require about 52,000 green tons per year of feedstock. Approximately 10 people would be employed.
Table 22. Estimated Labor Costs of Bripell Manufacturing ($/ton)
Labor Number Rate ($/hr) Fringe Fully Loaded Hourly Rate Hrs/shift Shifts Daily Total
General labor 2 12.00$ 0.35 32.40$ 8 3 777.60$ Operator 1 16.00$ 0.35 21.60$ 8 3 518.40$ Plant Manager 1 22.00$ 0.35 29.70$ 8 1 237.60$
Daily Cost 1,533.60$ Cost/ton for 80 ton/day capacity 19.17$
33 See http://www.bioenergyinvestments.net/images%20and%20video.html for additional information.

46
4.6 Comparison of Pellets, Briquettes and Bripells Table 23 shows an estimated cost comparison between pellets, briquettes, and bripells for both bagged and bulk products. How well bripells lend themselves to bagging or what that cost would be is not known, but we add $20 per ton to the bulk cost for comparative purposes. An advantage of bagging for any product is that it opens up residential or small consumer markets in addition to bulk markets. The pellet and bripell plants would employ more people than the briquette plant, although briquette manufacturing appears to have the lowest costs of production (about $7.66 per Mbtu for 100% bulk cedar briquettes).
The cost of briquette manufacturing includes an estimate for product delivery of $3.68 per ton for an average 36-mile delivery, whereas the estimates for pellets and bripells do not include a delivery charge. Excluding delivery, the manufactured cost for briquettes is approximately $120 per ton.
Table 23. Summary Cost Estimates
Product
Plant Capacity
(tons/year)Capital
Costs ($)Employees
(FTEs)
Estimated Cost
Bagged ($/ton)
Estimated Cost Bulk
($/ton)
Cost for 100% Cedar ($/MMBtu
Bulk)
Cost for 50/50 Ag-Cedar
Blend ($/MMBtu
Bulk)Pellets 24,000 5,500,000$ 15 159$ 135$ 8.42$ 8.98$ Briquettes 25,000 4,700,000$ 6 143$ 123$ 7.66$ 8.17$ Bripells 24,000 3,000,000$ 10 154$ 134$ 8.36$ 8.92$
It must be stressed that these are estimated values only, and no investment decisions should be made based on the numbers presented here. Interested entrepreneurs are encouraged to perform their own economic analysis and develop their own detailed pro-forma models.

47
5. Biomass Conversion Technologies
There are numerous commercial technologies available to convert biomass pellets or briquettes to heat, power, or combined heat and power (CHP). Proper feedstock handling systems can be designed to handle any feedstock type—pellets, briquettes, chips, bales, or ground. The focus of this report is on the potential to convert biomass to thermal energy.
NREL recently completed a study for the Clean Energy States Alliance on the commercial status of small-scale gasification and combustion technologies and companies.34
5.1 Combustion
The study document provides an in-depth discussion of the status of these technologies. The main results are summarized below.
In the United States and around the world, direct combustion is the most common method of converting biomass resources into heat, power, or combined heat and power (CHP). A direct combustion system burns the biomass to generate hot flue gas, which is used directly to provide heat or fed into a boiler to provide hot water or steam. In a boiler system, the steam can be used to provide heat for industrial processes or space heating; a steam turbine can be added to generate electricity. Biomass boilers have thermal conversion efficiencies in the range of 80% to 93%, while direct combustion biomass facilities that produce electricity through a steam turbine have conversion efficiency in the range of 20% to 25%. CHP systems can have overall efficiencies in the range of 70% to 80%. Although most CHP direct combustion systems generate power utilizing a steam-driven turbine, a limited number of companies are developing CHP direct combustion technologies that use hot, pressurized air or another medium to drive the turbine.
Another emerging application is the potential to couple an Organic Rankine Cycle (ORC) power generator to a biomass hot water source. ORC technology uses hot water to heat up a compressed working fluid that has a lower boiling point than water. In this manner, electricity can be produced from low temperature (approximately 185°F and up), low pressure sources such as biomass hot water boilers, or waste industrial heat.35
The two principle types of direct combustion boiler systems that utilize biomass are fixed bed (stoker) and fluidized bed systems. In a fixed bed system, the biomass is fed onto a grate where it is burned as air passes through the fuel, releasing the hot flue gases into the heat exchanger section of the boiler to generate steam, hot water, or hot air (in the case of a furnace). A fluidized bed system instead feeds the biomass into a hot bed of suspended, incombustible particles (such as sand), where the biomass combusts to release the hot flue gas. The advantage of a fluidized bed system is that it produces a more complete combustion of the feedstock, resulting in reduced SO2 and NOx emissions and improved system efficiency. Fluidized-bed boilers can also utilize a wider range of feedstocks, while meeting stringent emission limitations.
The efficiency of a direct combustion biomass boiler system is largely influenced by the following factors: (1) the moisture content of the biomass, (2) the amount of air introduced into the combustion chamber, and (3) the percentage of biomass left unburned by the system.
34 Peterson, Dave and Scott Haase. A Market Assessment of Gasification and Combustion Technology for Small and Medium Scale Applications. NREL. March, 2009. 35 For additional information on ORC, see http://en.wikipedia.org/wiki/Organic_Rankine_Cycle#cite_note-1 or http://www.gmk.info/ORC_process.603.html?#

48
5.2 Gasification Instead of directly burning the fuel to generate heat, gasification systems convert biomass into a low-Btu to medium-Btu content combustible gas, which is a mixture of carbon monoxide, hydrogen, water vapor, carbon dioxide, tar vapor, and ash particles. In gasification, biomass is heated with a reduced amount of air or oxygen, driving off the combustible gasses. In a close-coupled gasification system, the gas is ignited without further clean-up for space heat or drying, or burned in a boiler to produce steam. Alternatively, the gas can be cleaned up by filters and gas-scrubbers removing tars and particulate matter, resulting in a cleaner gas that is suitable for use in a generator, gas turbine, or other application requiring a high-quality gas.
Although most biomass resources are suitable for gasification systems, certain high moisture fuels may be uneconomic because of high drying costs. In addition, some agricultural residues generate a combustible gas that requires special processing before it can be utilized in a boiler, turbine, or engine.
5.3 Pellets vs. Chips or Bales There are many technologies that can use wood chips, straw bales, briquettes, bripells, or pellets for thermal-energy production. The specific end-use conversion technology to be used for any given application will be selected based on the needs of the facility being served, as well as the biomass product being used (e.g., pellets, briquettes, bripells, straw bales, or cedar chips). Appendix E contains a partial list of potential biomass vendors. Interested parties should contact these vendors directly.
Many of the vendors sell both chip and pellet systems. Any of the chip systems could be retrofit with a fuel chopper to break up bripells or briquettes into particles the correct size for a chip boiler. In general, pellet burning appliances will have a smaller footprint and cost less than chip systems because pellet fuel is more uniform, more compact, and has lower moisture than raw chipped biomass. Pellets can also be stored in silos and do not require the construction of bulky fuel storage containers that are a hallmark of bulk biomass systems.
Interested end-users will need to conduct their own analysis of the pros and cons of using pellets (or briquettes, bripells) rather than chips or other bulk biomass products.
5.4 Biopower Resource Requirements The focus of this report is on producing thermal energy from biomass. NREL did not evaluate biomass power generation options as part of this effort, and a separate study would be required to do so. However, a general rule of thumb in the biomass power industry is that a power plant requires 1 bdt/h/MW of capacity. Thus, a 20-MW biomass power plant operating at an 80% capacity factor would require approximately 140,000 bdt of biomass per year.

49
6. Conclusions
The major goal of this assessment was to evaluate the potential opportunity for an entrepreneur to construct a pellet mill in or around the vicinity of Greensburg, Kansas.
Based on the analysis, NREL believes that there is sufficient feedstock in the region to support a pellet, bripell, or briquette plant. A key decision for the interested entrepreneur to make is which specific feedstock to use, and the blend percentage between cedar and agricultural residues. Cedar is the highest-quality feedstock in the region and will have the highest Btu content, lowest ash, and lowest alkali percentage. Agricultural residues are higher in ash and alkalis and lower in energy content. When making pellets, briquettes, or bripells, consistency in the blend is extremely important. The plant owner should not use corn stover one day, wheat straw the next, and then sorghum another. The plant must make a consistent, uniform product so that end-users will be assured that each batch of product will burn the same.
Feedstock cost is extremely important in the overall economics of pellet or briquette production. The plant owner must keep feedstock costs low enough to make the economics of the plant work, but at the same time, the price paid has to be attractive enough to producers that they will collect the material. If plant owners are depending upon agricultural residues, they must be able to demonstrate to investors that they hold contracts for the acres necessary to supply the plant on a long-term basis. Feedstock collection costs are estimated to be in the range of $50 to $65/bdt in the region.
Based on an analysis of natural gas usage in the area, demand for thermal energy from the commercial and industrial sector appears to be sufficient in the region. There are no utility power plants in the region, although it may be possible to ship the finished product to utilities interested in co-firing biomass and coal. Any end-users interested in converting their facilities to biomass heat should understand the characteristics of the fuel they are purchasing and the boiler or furnace they are installing. The plant owner will need to work with potential customers to educate them about the nuances of using biomass as a thermal energy source. Market development efforts will be needed to create regional outlets for densified biomass.
The plant owner is advised to contact potential end-use customers, help them understand biomass, assist with the economic evaluation of converting their facility, and help identify appropriate end-use technologies and financing sources. Inform end-users that they should identify appliances designed to handle high-ash fuels, or else be ready to remove ash more frequently than they would expect. A target list of potential customers has been generated in the report. Another potential customer is Abengoa. Although located more than 100 miles away, Abengoa has plans to construct a cellulosic ethanol plant in Hugoton, Kansas. It may be possible for a biomass plant to supply densified feedstock to the Abengoa plant.
The current low price of natural gas has reduced demand for alternative fuels such as biomass. Because installing a new biomass conversion device is expensive, the savings of pellet use compared with gas (only a few dollars per Mbtu for residential and commercial customers, and even less for industrial customers) may not be realized for a longer period of time, if at all. Many industries and commercial users are unwilling to implement projects that take longer than five years to show a return on their investment. Should fossil fuel prices increase or some form of greenhouse gas reduction strategy be implemented in the United States, then biomass will become more competitive.

50
7. Next Steps
This report has confirmed that there is a potential business opportunity in the region to develop some form of densified biomass business, be it pellets, bripells or briquettes. The following actions are suggested as potential next steps for interested parties:
• Product Development
o Make sample blends of various feedstock combinations (e.g. cedar/corn stover, cedar/sorghum) in various percentage mixtures
o Send samples to the lab for chemical analysis, especially to asses ash percentages, Btu content and alkali content
o If possible, conduct test burns of products in candidate appliances to assess ash, feed handling, slagging and odor.
• Feedstock Procurement
o Identify producers interested in biomass supply options
o Develop contract mechanisms for biomass supply
o Assess potential for planting CRP land in switchgrass, mixed grass prairie or other biomass for specific production of biomass for pellets or bricks. Some sample questions to answer would be:
o What is the best mix of plants for the local region?
o What are the yields and economics versus alternative CRP options?
o What is the best mix of plants in terms of energy content and use?
• Market Development
o Perform additional market development efforts and educate potential end users about biomass energy
o Seek state support to organize a local biomass heating workshop in the region
o Contact large commercial loads to analyze their actual energy usage and costs. Potential targets for example would include National Gypsum in Medicine Lodge, the VA hospital in Wichita, the new hospital in Greensburg, community college in Pratt, agricultural processing plants in Dodge City, and any federal facilities
o Continue to identify end-use technologies that are commercially available and can be deployed at customer sites.
• Business Analysis
o Conduct detailed pro forma analyses for bripells, briquettes, and pellets
o Develop a business plan and conduct a detailed plant design.

51
Appendix A: Biomass Resource Assessment This appendix contains information on the potential biomass resource base in the region surrounding Pratt and Greensburg, Kansas. The results of the study are based on analysis of existing data, interviews with local producers and USDA representatives, and information obtained from third-party sources. We did not contact local producers to discuss specific quantities of biomass produced on a farm-by-farm basis, and we did not ascertain the interest of the producers in providing material to a potential pelletization or briquetting facility. Our assessment does, however, provide information on potential quantities of feedstock in the region, as well as the estimated costs of collecting that material.
If a developer decides to build a biomass plant in the region, a detailed “on-the-ground” resource assessment should be performed. This can be accomplished by directly contacting potential suppliers to determine their interest in the concept, their willingness to enter into supply contracts, price points that will ensure adequate supply, potential competing uses, and any potential infrastructure needs. For crop residues, it will be important to consider collection infrastructure, the amount of residue that must be left on the ground for nutrient cycling and erosion prevention, and competing regional uses for the feedstock.
Methodology The following steps were undertaken to define the biomass resources in the region:
• Identify the counties that are intersected by a 50-mile radius from Greensburg and Pratt accomplished using a geographic information system (GIS) and drawing circles from Pratt and Greensburg.
• Download from the USDA National Agricultural Statistics Service Web site the past 10 years of crop production and yield data for primary crops grown in the target counties36
• Calculate the 10-year average of acres planted, yield, and harvest.
.
• Apply standard factors based on crop yield to estimate the quantity of residue produced per acre for each crop type grown in the study area. (These factors will be listed in a later section of this appendix.)
• Using “residue-leave” factors (tons of residue per acre to leave on the ground for nutrient cycling and erosion purposes), estimate the quantity of residue potentially available for collection. These county-specific factors were developed by Dr. Richard Nelson of Kansas State University for corn and wheat (for both irrigated and nonirrigated lands). 37
• Estimate the collection and transportation costs of the feedstock.
36 USDA National Agricultural Statistics Service, 1998-2007 data. Accessed online August 2008 http://www.nass.usda.gov/ 37 Dr. Nelson’s methodology is documented in the following paper: Nelson, Richard G. Resource assessment and removal analysis for corn stover and wheat straw in the Eastern and Midwestern United States – rainfall and wind-induced erosion methodology. Biomass and Bioenergy 22 (2002) 349-363.

52
Counties The following counties were included in the initial list for data collection: Barber, Barton, Clark, Comanche, Edwards, Ford, Gray, Harper, Hodgeman, Kingman, Kiowa, Meade, Pawnee, Pratt, Reno, Rice, and Stafford. Gray and Meade counties were excluded because they intersect a 50-mile radius circle from Greensburg by only a very slight margin.
Biomass Feedstocks38
This section discusses the feedstocks used in the analysis.
Crop Residues. NREL analyzed production data for corn, wheat, soybeans, cotton, sorghum, hay, and sunflowers. The quantities of crop residues potentially available in each county are estimated using total grain production, crop to residue ratio, moisture content, and the amount of residue that must be left on the field for soil protection, grazing, and other agricultural activities.39
Depending upon the units in which the crop production is reported, the following equations were used to estimate residue weights in bone dry tons:
For crops reported in pounds (cotton, sunflowers):
BDT residue = crop production * crop to residue ratio * Dry Matter % / 2205 For crops reported in bushels (BU) (corn, sorghum, soybeans, wheat):
BDT residue = crop production * crop to residue ratio * Dry Matter % / K Where:
• BDT – Bone dry tonnes
• BU – Bushel
• 1 metric ton (MT) = 2,205 pounds
• K = BU to MT conversion or 2,205 / bushel weight (in lb), see Table A-1
• 0.9072 – conversion from short (U.S.) tons to metric tons
38 For a detailed description of the methodology on how tons of residue are calculated for each feedstock, see the following report: A. Milbrant. A Geographic Perspective on the Current Biomass Resource Availability in the United States. NREL Technical Report NREL/TP-560-39181, December, 2005. Available on-line at: http://www.nrel.gov/docs/fy06osti/39181.pdf 39 Data for the target counties were obtained from the USDA National Agricultural Statistics Service, 1998-2007 data. www.nass.usda.gov/

53
Table A-1: Crop to Residue Ratio and Moisture Content of Selected Crops
Crop Ratio of Residue to Crop Volume*
Moisture Content (Percent)**
Bushel Weight (lb)***
Corn 1.0 15.5 56 Cotton 4.5 12.0 32
Sorghum 1.4 12.0 56 Soybeans 2.1 13.0 60 Sunflower 2.1 10.0 30
Wheat 1.3 13.5 60 Quantities that must remain on the field for erosion control differ by crop type, soil type, weather conditions, and the tillage system used. It was assumed that 30% residue cover is reasonable for soil protection.40
For corn and wheat resides, a more detailed, site-specific analyses was available.
Animals seldom consume more than 20% to 25% of the stover in grazing, and we presume about 10% to 15% of the crop residue is used for other purposes such as bedding and silage. Therefore, it was assumed that approximately 35% of the total residue could be collected as biomass. This methodology was applied to sorghum, soybeans, alfalfa, hay, sunflowers, and cotton.
41
Forest Residues. Forest residues are logging residues and other removable material left after silviculture operations and site conversions. Logging residue consists of unused portions of trees cut or killed by logging and left in the woods. Other removable materials are the unused volume of trees cut or killed during logging operations.
In his paper, Nelson calculates the quantity of residues (in bdt/acre) that must be left on the land for erosion protection for both irrigated and nonirrigated wheat and corn crops in Kansas, by county. So for wheat and corn, NREL estimated the total amount of residue that is produced, and then subtracted the amount that Nelson said should be left on the land. Based on these numbers, it was quite apparent that no residues would be available for collection from nonirrigated corn land throughout the study area. In fact, many nonirrigated corn acres were at a net deficit, meaning that more residues than are produced should be left on the land.
42
Primary Mill Residues. Primary mill residues include wood materials (coarse and fine) and bark generated at manufacturing plants (primary wood-using mills). The residues are produced when round wood products are processed into primary wood products such as slabs, edgings, trimmings, sawdust, veneer clippings and cores, and pulp screenings.
Only Barber, Barton, Bourbon, Harper, Reno, and Rice counties had data for logging residues. Seventy-five percent of the feedstock is listed as coming from Bourbon County.
43
40 In general, tillage practices that maintain between 30% and 50% groundcover throughout the period when no crop is growing that will adequately protect soil from erosion due to wind and water.
Standard factors of metric tonnes per company type per year were applied to the data. There are minimal primary mill residues in the region.
41 Nelson, Richard G. “Resource assessment and removal analysis for corn stover and wheat straw in the Eastern and Midwestern United States—rainfall and wind-induced soil erosion methodology,” Biomass and Bioenergy 22 (2002) 349 – 363. 42 USDA Forest Service, Timber Product Output database, 2002. 43 USDA Forest Service, Timber Product Output database, 2002.

54
Secondary Mill Residues. Secondary mill residues include wood scraps and sawdust from woodworking shops—furniture factories, truss manufacturing, wood container and pallet mills, and wholesale lumberyards. Data on the number of businesses by county were gathered from the U.S. Census Bureau.44
Urban Wood Waste. This analysis includes wood residues from municipal solid waste (wood chips and pallets), utility tree trimming, private tree companies, and construction and demolition sites.
Standard factors of metric tonnes per company type per year were then applied to the data. There are minimal secondary mill residues in the region.
45
Minimal amounts of urban wood waste and secondary mill residues are produced in the study area—less than 9,000 tons per year from both sources.
Data are calculated by applying a factor based on pounds of residue generation per person per day.
Other Sources Eastern Red Cedar. Significant quantities of red cedar in the region are also potentially available for harvest. Red cedar is viewed primarily as a detrimental species in the region because they spread rapidly and reduce the amount of rangeland available for farming. USDA pays producers a portion of the cost of removing these trees from their lands. One producer in the region, Don Queal of Queal Enterprises, a cedar mitigation business, sells some material as mulch, but the market is limited in the area. Much of the material is piled in the field and burned the following year. Mr. Queal estimates that if he had the labor crews available, he could readily collect 25,000 green tons per year, or 12,500 bdt/yr.
Cotton Gin Trash. Limited amounts of gin trash may be available on a periodic basis from a cotton gin located between Pratt and Greensburg. . The amount of cotton planted in the region has dropped significantly over the past several years as farmers plant greater amounts of corn, sorghum, soybeans, and wheat in response to higher prices for those products. The cotton gin reports that all of its feedstock is sold to a broker in Wichita under a long-term contract. If any potential pellet producer were interested in this feedstock, they would need to contact the mill and determine specific prices paid and then beat that price. Before doing so, however, we would suggest that a sample of the gin trash be analyzed at a lab to determine physical and chemical properties. It may not be an ideal feedstock for the pellet plant.
Corn Cobs. The following table shows the average acres of corn harvested in the study area over the 10-year period from 1998-2007. Assuming 0.75 bdt of cobs per acre harvested, an estimated 480,000 tons of cobs are potentially available in the region, including Gray and Meade counties. Excluding these 2 counties, we estimate a total of 198,000 bdt/yr.
44 2002 County Business Patterns. 45 U.S. Census Bureau, 2000 population data; BioCycle Journal, State of Garbage in America, January 2004; County Business Patterns 2002.

55
Table A-2: Average Acres of Corn Harvested 1998-2007
County
Total Corn Acres
Barber 2,300 Barton 26,320 Brown 98,550 Clark 1,030 Comanche 1,260 Edwards 62,370 Ford 46,860 Gray 83,070 Harper 1,080 Hodgeman 9,680 Kingman 7,950 Kiowa 27,610 Meade 72,950 Pawnee 31,400 Pratt 59,780 Reno 25,350 Rice 21,690 Stafford 61,450 Total 640,700
CRP Lands. Dedicated energy crops (switch grass, willow, hybrid poplar, etc.) can often be grown economically on land that is not suitable for conventional crops, and it can provide erosion protection for agricultural set-aside or CRP lands. The CRP is a voluntary program for agricultural landowners, administered by the USDA Farm Service Agency. It provides technical and financial assistance to eligible farmers and ranchers to address soil, water, and other related natural resource concerns on their lands.
Data on the CRP acres by county were obtained from the USDA’s Farm Service Agency. Examining some of the core counties in the study shows there are more than 300,000 acres of CRP land near Greensburg. Some of this land could possibly be converted to fast-growing energy crops. Yields of 4 tons per acre could be expected. So, if 10% of the CRP land is planted in a crop such as switchgrass, total yields of biomass of approximately 120,000 bone dry tons per year could be expected.
Table A-3: CRP Acres by County
County CRP Acres
Kiowa 53,337Comanche 43010Clark 52,114Barber 21,018Pratt 47,750Ford 59,469Edwards 34,101Total 310,799

56
Appendix B: Analysis of Physical and Chemical Characteristics of Local Biomass Resources
The figures on the following pages show lab analyses for various biomass feedstocks collected in the study area. The following samples were tested:
• Wheat straw collected from a field about 5 miles southeast of Pratt
• Seasoned cedar mulch that had been sitting out for several months from Don Queal
• Freshly cut cedar mulch that had been chipped a few days before
• Sample pellets made by Show Me Energy Cooperative (SMEC). The pellets that SMEC provided were a blend of wood and ag residues (blend percentage is not known but suspected to be about 50/50).
• Corn stover
• Corn cobs
• Sorghum residues

57
Figure B-1: Lab analyses for wheat straw

58
Figure B-2: Lab analyses for seasoned cedar mulch

59
Figure B-3: Lab analyses for freshly cut cedar mulch

60
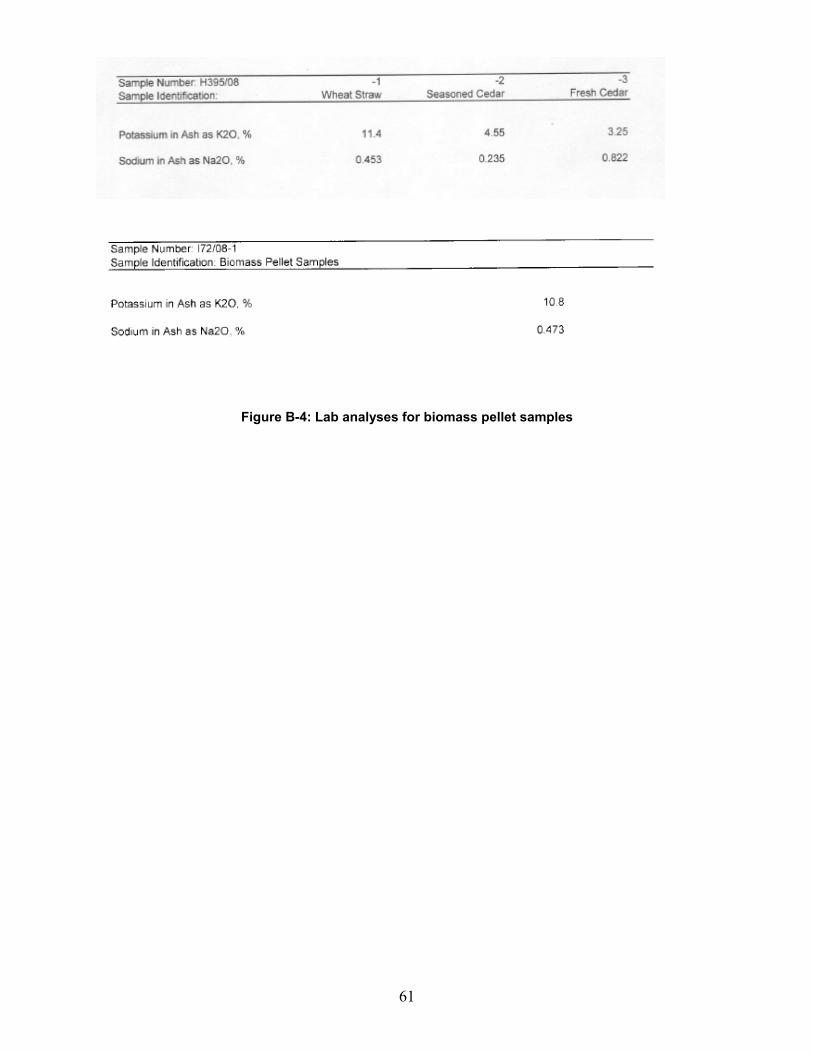
61
Figure B-4: Lab analyses for biomass pellet samples

62
Figure B-5: Lab analyses for corn cobs

63

64
Figure B-6: Lab analyses for sorghum residues

65
Appendix C: Natural Gas Demand Maps
Figure C-1: Total commercial users

66
Figure C-2: Therms per commercial user

67
Figure C-3: Total therms in industrial use

68
Figure C-4: Total industrial users

69
Figure C-5: Therms per industrial user

70
Figure C-6: Total therms in residential use

71
Figure C-7: Therms per residential user

72
Appendix D: Potential Customers (Excluding Wichita) Table D-1: Hospitals
Name County Town Beds ContactKiowa County Memorial Hospital Kiowa Greensburg 12Pratt Regional Medical Center Pratt Pratt www.prmc.orgWestern Plains Medical Complex Ford Dodge City http://www.westernplainsmc.comKiowa District Hospital Barber Kiowa 620-825-4131Minneola District Hospital Clark Minneola 54 620-885-4264Ashland Health Center Clark Ashland 12 620-635-2241Kingman Community Hospital Kingman Kingman http://www.nvhsinc.com
Table D-2: Industrial Facilities
Name Type County City ContactCross Manufacturing Hydrolic Components Pratt Pratt www.crossmfg.comOrion Ethanol Ethanol Pratt Pratt www.orionethanol.comNational Gypsum Co Building Products Barber Medicine LodgePolymer Group, Inc (PGI) Polysynthetic Twine Kingman Kingman 620-532-5141
Doskocil Foods/FoodBrands America/Tyson Food Products Reno South Hutchinsonhttp://www.tyson.com/Corporate/AboutTyson/Locations/ListPage.aspx ;

73
Table D-3: Schools and Universities
Name County TownYear Built (Rennovations) Link
Pratt Community College Pratt Pratt www.prattcc.eduHaskins Elementary Pratt Pratt www.usd382.comSouthwest Elementary Pratt Pratt www.usd382.comLiberty Middle Pratt Pratt www.usd382.comPratt High Pratt Pratt www.usd382.comSkyline School Pratt Pratt www.usd438.k12.ks.usSacred Heart/Holy Child Pratt Pratt home.catholicweb.com/sacredheartholychild Beeson Elementary Ford Dodge City 1995 www.usd443.org/Central Elementary Ford Dodge City 1927 (2006, 2007) www.usd443.org/Linn Elementary Ford Dodge City 1995 www.usd443.org/Miller Elementary Ford Dodge City 1951 (1991, 2001) www.usd443.org/Northwest Elementary Ford Dodge City 1957 www.usd443.org/Ross Elementary Ford Dodge City 2000 www.usd443.org/Sunnyside Elementary Ford Dodge City 1956 (1995) www.usd443.org/Wilroads Gardens Elementary Ford Dodge City 1964 www.usd443.org/Comanche Intermediate Ford Dodge City 1924 www.usd443.org/Soule Intermediate Ford Dodge City 1995 www.usd443.org/Dodge City Middle Ford Dodge City 1956 www.usd443.org/Dodge City High Ford Dodge City 2001 www.usd443.org/Dodge City Community College Ford Dodge City http://www.dccc.cc.ks.us
Kansas State U at Dodge City Ford Dodge Cityhttp://www.dce.k-state.edu/affiliations/westernkansas
South Barber High Barber Kiowa www.southbarber.comSouth Barber K-8 Barber Kiowa www.southbarber.comMedicine Lodge Primary Barber Medicine Lodge www.usd254.orgMedicine Lodge Middle Barber Medicine Lodge www.usd254.orgMedicine Lodge High Barber Medicine Lodge www.usd254.orgMinneola Grade Clark Minneola http://www.usd219.k12.ks.usMinneola High Clark Minneola http://www.usd219.k12.ks.usAshland Grade Clark Ashland http://www.ashland.k12.ks.usAshland High Clark Ashland http://www.ashland.k12.ks.usBucklin Elementary Ford Bucklin www.bucklinschools.comBucklin Middle Ford Bucklin www.bucklinschools.comBucklin High Ford Bucklin www.bucklinschools.comKingman K-8 Kingman Kingman http://usd331.groupfusion.netKingman High Kingman Kingman http://usd331.groupfusion.netNorwich K-12 Kingman Norwich http://usd331.groupfusion.netMullinville K-6 Kiowa Mullinville http://www.mullinville.orgMullinville Junior High Kiowa Mullinville http://www.mullinville.orgMullinville High Kiowa Mullinville http://www.mullinville.orgGreensburg High Kiowa Greensburg http://www.usd422.orgGreensburg Junior High Kiowa Greensburg http://www.usd422.orgGreensburg K-8 Kiowa Greensburg http://www.usd422.orgHaviland High Kiowa Haviland http://www.usd474.orgKinsley-Offerle High Edwards Kinsley http://www.kinsleypublicschools.orgKinsley-Offerle Junior High Edwards Kinsley http://www.kinsleypublicschools.orgKinsley-Offerle Elementary Edwards Kinsley http://www.kinsleypublicschools.orgSouth Central High Comanche Coldwater http://www.southcentralusd300ks.com/South Central Middle Comanche Coldwater http://www.southcentralusd300ks.com/South Central Elementary Comanche Coldwater http://www.southcentralusd300ks.com/
Table D-4: Ag Producers
Name Type County Town ContactPratt Feeders, LLC feedlot Pratt PrattGreat Plains Alfalfa Alfalfa Pellets Pratt PrattHigh Plains Cotton Gin cotton gin Pratt PrattX-tra Factors, Inc animal feed supplements Pratt PrattCoake Feeding Co. Inc. feedlot Ford Dodge City 620-227-2673Dodge City Leeders, Inc. feedlot Ford Dodge City 620-227-9700Ford County Feed Yard Inc. feedlot Ford Dodge City 620-369-2250National Beef Packing Co. Beef Processing Ford Dodge City 620-338-4339Excel/Cargill Meat Solutions Beef Processing Ford Dodge City 620-225-2610U.S. Premium Beef Beef Processing Ford Dodge City 620-225-1811

74
Appendix E: List of Biomass Conversion Technology Manufacturers
Table E-1: Direct Combustion System Manufacturers
Company Headquarters
Biomass Fuels
System Size Comments Contact Info
A3 Energy Partners
Wide range of fuels.
0.25 - 8.5 Mbtu/h
Distributor of KÖB Systems
Andrew Haden A3 Energy Partners [email protected] 503-706-6187
Advanced Recycling Equipment St. Marys, PA
Wide range of biomass
0.75-60 Mbtu/h
Fixed bed boiler systems for heat.
814-834-4470 [email protected] www.advancedrecyclingequip.com
AFS Energy Systems Lemoyne, PA
Wood 3 - 27 Mbtu/h
Fixed bed boiler systems for heat
717-763-0286 [email protected] www.afsenergy.com
Bioheat USA (Fröling) Lyme, NH
Pellets, Wood chips
0.07 – 0.2+ Mbtu/h
Fixed bed boiler systems for heat
800-782-9927 [email protected] www.bioheatusa.com
Biomass Combustion Systems Worcester, MA
Wood 3 - 40 Mbtu/h
Fixed bed boiler systems for heat.
508-798-5970 [email protected] www.biomasscombustion.com
Central Boiler Greenbush, MN
Wood (pallets, crates, etc)
0.25 - 2 Mbtu/h
Small-scale furnace for forced air, boiler, or radiant floor heating system
218-782-2575 [email protected] www.centralboiler.com
Energy Products of Idaho Coeur d'Alene, ID
Wide range of biomass
15 - 160 Mbtu/h
Fluidized bed boiler systems for heat, power, or CHP
208-765-1611 [email protected] www.energyproducts.com
Fink Machine (KÖB) Enderby, BC
Wood 0.27 - 8.5 Mbtu/h
Fixed bed boiler systems for heat; Fink Machine is the Canadian vendor for KÖB (Austria)
250-838-0077 [email protected] www.finkmachine.com
Heatmor Warroad, MN Wood
0.45 - 0.8 Mbtu/h
Small-scale furnace
218-386-2769 [email protected] www.heatmor.com
Hurst Boilers South Coolidge, GA
Wide range of biomass
0.4 - 56 Mbtu/h
Fixed bed boilers for heat; can be used for power production via a steam turbine
877-994-8778 [email protected] www.hurstboiler.com
King Coal Furnace Corp Bismarck, ND
Wood 3.4 - 34 Mbtu/h
Fixed bed, staged combustion system
701-255-6406 [email protected] www.kingcoal.com

75
McBurney Norcross, GA Wood 20 - 80
Mbtu/h
Medium to large scale boiler systems for industry
770-925-7100 [email protected] www.mcburney.com
Messersmith Bark River, MI Wood 0.5 -10
Mbtu/h Fixed bed boiler systems for heat
906-466-9010 [email protected] www.burnchips.com
Pro-Fab Industries Arborg, Manitoba
Wood, corn
0.75 - 2.5 Mbtu/h
Pre-Fab makes the Pelco, a light industrial, hot water boiler
204-364-2211 [email protected] www.profab.com
Wellons, Inc Vancouver, WA Wood 5 - 10
Mbtu/h
Boiler systems designed for the forest products industry
360-750-3500 [email protected] www.wellonwusa.com

76
Table E-2: Direct Combustion, Non-boiler Combined Heat and Power Technology Companies
Company Headquarters Fuels System
Size
Approximate # Units operating in the US
Comments Contact Info
AgriPower, Inc. Variety 300 kW 1
Utilizes an "open" Brayton Cycle process in CHP unit, using hot air (the working fluid) to drive the turbine.
516-829-2000 http://www.agripower.com/
Zilkha Biomass Energy Houston, TX
Wood 1.5 - 4.5MW 1
CHP pressurized direct combustion system; only operating unit is co-located with a New England wood pellet production facility.
713-979-9962 [email protected] www.zilkha.com

77
Table E-3: Gasification Technology Companies
Company Headquarters
Use of Gas Fuels System
Size
Approximate # Units operating in the US
Comments Contact Info
Alternative Energy Solutions (Uniconfort) Wichita, KS
Close-coupled
Wood, ag. Residues, pellets
1 - 20 Mbtu/h
1; 25 in development for 2009-2010 in U.S.; 3,500 installed world-wide
Alternative Energy Solutions, a subsidiary of Wichita Boiler, is the exclusive North American licensee for Uniconfort (Italy); close-coupled gasification systems that produce heat, power, and CHP
316-201-4143 [email protected] www.aesenergy.net
ChipTec Wood Energy South Burlington, VT
Close-coupled Wood
1.5 - 125 Mbtu/h
175+
Crossdraft boiler systems; Large scale close-coupled gasifiers
800-244-4146 [email protected] www.chiptec.com
Nexterra Energy Vancouver, BC
Close-coupled
Wood, switchgrass, egrass, misc, paper
7 - 144 Mbtu/h
0; 3 in operation in Canada; 4 in development, including at Oak Ridge National Lab
Systems are operating at pulp-paper mills; system to be built at Oak Ridge National Lab to displace existing natural gas steam plant utilizing locally sourced woody biomass
604-637-2502 [email protected] www.nexterra.ca/
Primenergy Tulsa, OK
Close-coupled
Wood, corn fiber, carpet scraps
18 Mbtu/h and up
6; 1 in Italy
Updraft, fixed bed gasification systems; most systems have on-site feedstocks
918-835-1011 [email protected] www.primenergy.com
PRM Energy Systems Hot Springs, AR
Close-coupled
Variety of biomass; rice husk/straw,
13 - 118 Mbtu/h; 1-15MW
5 - 6 in U.S.; 25 world-wide
Close-coupled gasification systems that produce heat, power, and CHP; most systems have on-site feedstock; one project has
501-767-2100 [email protected] www.prmenergy.com

78
wood waste brought to an ethanol plant to provide heat for one project
Frontline Bioenergy Ames, IA
Two-staged
Wood residues, corn stover, switchgrass
100 Mbtu/h 1
The integrated biomass gasification system currently in operation utilizes wood and ag wastes to offset natural gas use at an ethanol plant in Minnesota.
515-292-1200 www.energyproducts.com
Community Power Corp. Littleton, CO
Two-staged
Variety of biomass
5 -100 kW
1 operating 24/7; 6 demonstration units
Small-scale, modular gasifier-genset unit designed to provide distributed CHP.
303 933-3135 [email protected] www.gocpc.com
Energy & Environmental Research Center (EERC) Grand Forks, ND
Two-staged
Variety of biomass
100 kW - 1 MW
2 (both demonstration)
Developing a micorgasification technology that utilizes the combustible gas in a piston engine generator for power production
701-777-5120 [email protected] www.undeerc.org
Cratech Tahoka, TX
Diverse Use
Variety of biomass
5, 10, and 20 MW
0; 2 in development
Developing a pressurized fluidized bed gas turbine system
806 327 5220 [email protected] http://cratech.com
Diversified Energy Gilbert, AZ
Diverse Use
Variety of biomass
50 - 300 Mbtu/h
1 (pilot plant)
Developing a molten metals-based gasification technology
480-507-0297 [email protected] www.diversified-energy.com
Thermogenics Albuquerque, NM
Diverse Use
Variety of biomass
2 -200 Mbtu/h 1
Bottom fed inverted downdraft gasifier
505-463-8422 [email protected] www.thermogenics.com

F1147-E(10/2008)
REPORT DOCUMENTATION PAGE Form Approved OMB No. 0704-0188
The public reporting burden for this collection of information is estimated to average 1 hour per response, including the time for reviewing instructions, searching existing data sources, gathering and maintaining the data needed, and completing and reviewing the collection of information. Send comments regarding this burden estimate or any other aspect of this collection of information, including suggestions for reducing the burden, to Department of Defense, Executive Services and Communications Directorate (0704-0188). Respondents should be aware that notwithstanding any other provision of law, no person shall be subject to any penalty for failing to comply with a collection of information if it does not display a currently valid OMB control number. PLEASE DO NOT RETURN YOUR FORM TO THE ABOVE ORGANIZATION. 1. REPORT DATE (DD-MM-YYYY)
May 2010 2. REPORT TYPE
Technical Report 3. DATES COVERED (From - To)
4. TITLE AND SUBTITLE
Assessment of Biomass Pelletization Options for Greensburg, Kansas
5a. CONTRACT NUMBER DE-AC36-08-GO28308
5b. GRANT NUMBER
5c. PROGRAM ELEMENT NUMBER
6. AUTHOR(S) S. Haase
5d. PROJECT NUMBER NREL/TP-7A2-48073
5e. TASK NUMBER IDKS1070
5f. WORK UNIT NUMBER
7. PERFORMING ORGANIZATION NAME(S) AND ADDRESS(ES) National Renewable Energy Laboratory 1617 Cole Blvd. Golden, CO 80401-3393
8. PERFORMING ORGANIZATION REPORT NUMBER NREL/TP-7A2-48073
9. SPONSORING/MONITORING AGENCY NAME(S) AND ADDRESS(ES)
10. SPONSOR/MONITOR'S ACRONYM(S) NREL
11. SPONSORING/MONITORING AGENCY REPORT NUMBER
12. DISTRIBUTION AVAILABILITY STATEMENT National Technical Information Service U.S. Department of Commerce 5285 Port Royal Road Springfield, VA 22161
13. SUPPLEMENTARY NOTES
14. ABSTRACT (Maximum 200 Words) This report provides an overview of a technical report on an assessment NREL conducted in Greensburg, Kansas, to identify potential opportunities to develop a biomass pelletization or briquetting plant in the region. See NREL/TP-7A2-45843 for the Executive Summary of this report.
15. SUBJECT TERMS National Renewable Energy Laboratory; NREL; DOE; U.S. Department of Energy; Greensburg; TP-48073; TP-45843; technical report; technical assistance; Greensburg tornado; Kansas; tornado; tornado damage; EF-5 tornado; severe weather; green communities; green buildings; green community development; sustainable development; rebuilding green; energy efficiency; biomass; pelletization; briquetting; eastern red cedar
16. SECURITY CLASSIFICATION OF: 17. LIMITATION OF ABSTRACT
UL
18. NUMBER OF PAGES
19a. NAME OF RESPONSIBLE PERSON a. REPORT
Unclassified b. ABSTRACT Unclassified
c. THIS PAGE Unclassified 19b. TELEPHONE NUMBER (Include area code)
Standard Form 298 (Rev. 8/98) Prescribed by ANSI Std. Z39.18