assessment of building heights from pléiades satellite
TRANSCRIPT
http://dx.doi.org/10.4314/rj.v1i1S.6D
Rwanda Journal, Series D, Volume 1, 2016, Life and Natural Sciences: Special issue II
Assessment of Building Heights from Pléiades Satellite Imagery for the
Nyarugenge Sector, Kigali, Rwanda
F. Bachofer
University of Tuebingen, Faculty of Science, Department of Geosciences, 72070 Tuebingen, Germany, Tel.: +49 7071 2977528,
email: [email protected]
Abstract
Quantitative and qualitative information about land-use and buildings are important for spatial planning
decision processes. The proposed study determines the suitability of multispectral information and
stereoscopic-derived heights of Pléiades tri-stereoscopic satellite imagery for the identification of building
footprints and the assessment of building heights. The study area is the Nyarugenge sector in the center of the
City of Kigali. A tri-stereoscopic Pléiades satellite scene was used to process a digital surface model. An
object-based image analysis provided the basic geometries and respective variables, which served as input
features for a Support Vector Machine based classification. The comparison of the building footprints with
ground reference information indicates a high accuracy. The assessment of building heights led to mixed
results. The heights of buildings were derived with medium to high accuracies for building blocks with a well-
developed road network or open spaces, which allowed the assessment of the elevation of the terrain surface.
In densely built-up areas, with a lack of road accessibility and located mainly on steep slopes, the derived
heights of single buildings or building blocks did not produce satisfying results. However, for urban planners,
policy and decision makers, the method yields a high potential in analyzing and monitoring urban areas.
Keywords - building extraction, DSM, remote sensing, SVM, Pléiades
1. Introduction
Dynamically changing urban environments in countries of the Global South experience rapid changes in their
urban structure, due to a growth of population and socioeconomic developments. For different purposes, such
as the monitoring of the housing sector, spatial and infrastructure planning, frequent information on the

http://dx.doi.org/10.4314/rj.v1i1S.6D
Rwanda Journal, Series D, Volume 1, 2016, Life and Natural Sciences: Special issue II
qualitative and quantitative status and the changes in settlement structure are necessary. A cost effective
method to gather urban land-use data, assess information on built-up areas and identify the characteristics of
single buildings, is the application of high-resolution multispectral imagery (Wurm, et al., 2014). The last
aerial photography mission resulted in orthophotos covering nearly the entire territory of Rwanda, took place
in the summers of 2008 and 2009 (Sagashya, 2014). Rapid changes in urban environments, especially in a
dynamic city like Kigali, require up-to-date information. Spaceborne remote sensing images provide large
spatial and high temporal coverage. Yet, the spatial resolution of satellite-based images is low, compared to
aerial images. Hence, effective classification methods are required to achieve reliable information on urban
land-use and land-cover (LULC). The use of height information may be used to improve the image analysis
and provide additional information of objects on the ground, like buildings and trees. The access to LIDAR-
based digital surface models (DSM) is mostly limited or not available at all. This may be overcome by
stereoscopic spaceborne image acquisitions, like from the Pléiades satellite system (Gleyzes, et al., 2012).
Various studies addressed the extraction of information or urban environments from high-resolution optical
satellite data. Aytekın, et al. (2012) used spectral and spatial properties of image segments to derive roads and
buildings automatically in complex urban environments. Comber, et al. (2012) and Singh, et al. (2015) used
shadows in remote sensing images to extract buildings and to determine building heights. For the detection
and classification of build-up structures, LIDAR based DSMs proved to be beneficial (Sohn and Dowman,
2007; Priestnall, et al., 2000; Malpica, et al., 2013). DSMs from optical stereo satellite images provide also
the opportunity to enable and improve urban land-use and building identification (Poli, et al., 2013; Poli, et
al., 2014). Shaker, et al. (2011) combined multispectral analysis with DSM information to identify buildings
in Cairo, Egypt. Qin, et al. (2015) used multitemporal spectral and spaceborne height information for building
detection. Sirmacek, et al. (2010) show that also DEMs can be improved by building footprint information
from satellite images. Bernard, et al. (2012) proved that multi angle stereo acquisitions reduce the occlusions
behind buildings and that a stereoscopic image acquisition, with a nadir image and two opposed oblique
images, result in high accuracies of DSMs.

http://dx.doi.org/10.4314/rj.v1i1S.6D
Rwanda Journal, Series D, Volume 1, 2016, Life and Natural Sciences: Special issue II
The objective of this study is to determine the applicability of Pléiades data to identify and to extract building
footprints for the City of Kigali. For this case study, a subset of the Pléiades scene was selected, which focuses
on the Nyarugenge Sector. A DSM was processed of tri-stereoscopic Pléiades data, topographic derivatives
and multispectral information of the satellite scene were utilized. If successful, the methodology will be able
to support urban planners, policy and decision makers in monitoring changes, updating cadastral information
and improving planning solutions.
2. Study area, data and methods
2.1. Study area
Figure 1: Location of the study area: a) Pléiades subset; b) The sectors of Kigali
Kigali is the capital city of Rwanda. It is a dynamically developing city with a population of 1,132,686 (2012
census). The Nyarugenge sector has a population of 21,302 (NISR and MINECOFIN, 2015). The study area
covers also areas of the Muhima (N), Gitega (W), Rwezamenyo (SW) and Kigarama (SE) sectors. The
Nyarugenge sector and its’ neighbouring sectors are characterized by a heterogeneous building structure (Fig.
http://dx.doi.org/10.4314/rj.v1i1S.6D
Rwanda Journal, Series D, Volume 1, 2016, Life and Natural Sciences: Special issue II
1). The central and north-western part of the study area is characterized by the central business district (CBD),
with mid- to high-rise commercial buildings. The eastern part is dominated by single-family detached houses,
with a high percentage of urban green space. The southern and south-western part dominates low-rise
unplanned squatter housing. Characteristic for the topography of Kigali is the elevated position of the CBD
on a ridge, which is surrounded by slopes.
2.2. Data
A Pléiades tri-stereoscopic satellite image (2015-08-09) is the base data for the analysis. The two satellites of
the Pléiades mission (1A and 1B) were launched in 2011 and 2012. The satellite constellation provides images
with a resolution 70 cm for the panchromatic channel and 2.8 m for the 4 multispectral channels. The physical
resolution is resampled to 50 cm, respectively 2 m, ground sampling distance (GSD) (Gleyzes et al., 2012).
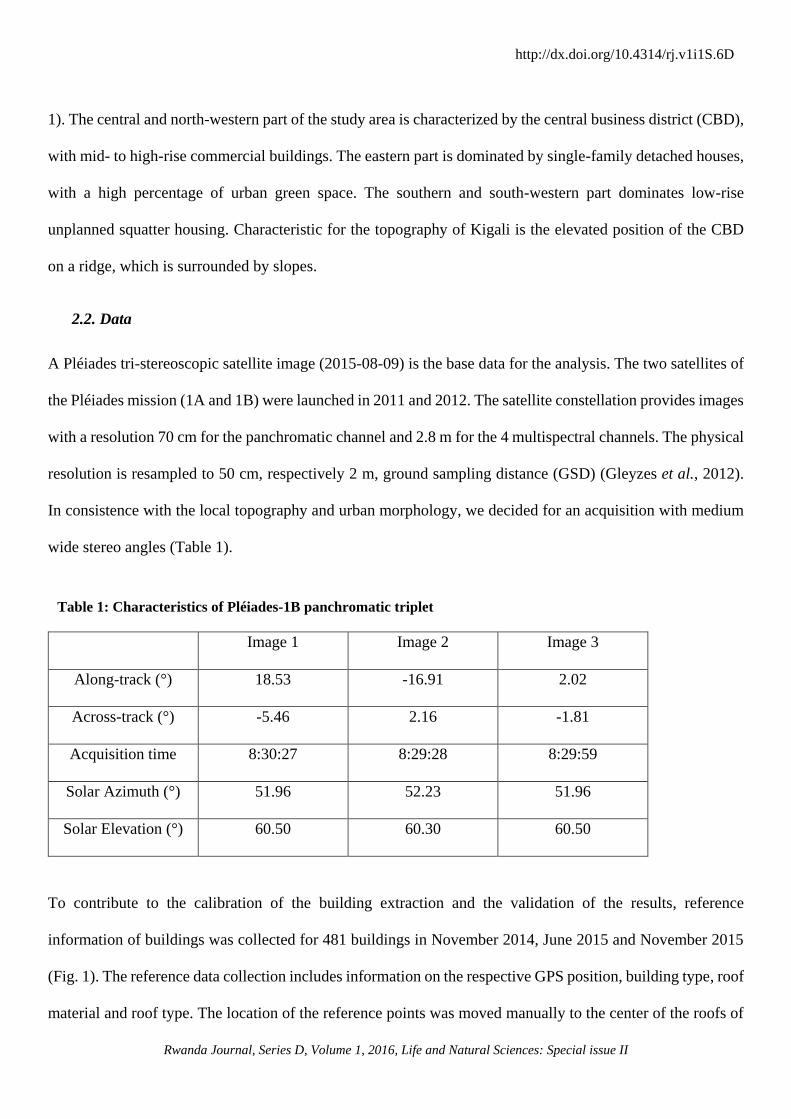
In consistence with the local topography and urban morphology, we decided for an acquisition with medium
wide stereo angles (Table 1).
Table 1: Characteristics of Pléiades-1B panchromatic triplet
Image 1 Image 2 Image 3
Along-track (°) 18.53 -16.91 2.02
Across-track (°) -5.46 2.16 -1.81
Acquisition time 8:30:27 8:29:28 8:29:59
Solar Azimuth (°) 51.96 52.23 51.96
Solar Elevation (°) 60.50 60.30 60.50
To contribute to the calibration of the building extraction and the validation of the results, reference
information of buildings was collected for 481 buildings in November 2014, June 2015 and November 2015
(Fig. 1). The reference data collection includes information on the respective GPS position, building type, roof
material and roof type. The location of the reference points was moved manually to the center of the roofs of

http://dx.doi.org/10.4314/rj.v1i1S.6D
Rwanda Journal, Series D, Volume 1, 2016, Life and Natural Sciences: Special issue II
the respective buildings, to allow an evaluation of the processing results. For 337 of these reference buildings,
the building height was measured with a laser measure handheld.
2.3. Digital Elevation Model processing
A DSM was generated, using the Rational Polynomial Coefficients (RPCs) to describe the exterior and interior
orientation of each image of the Pléiades triplet (Fig. 2) (Topan, et al., 2013; Hu, et al., 2016). Ground control
points (GCPs) were defined and for each image pair more than 100 tie points were automatically generated
and visually checked for their consistency. Semi-Global Matching (SGM) was applied, which minimizes a
one dimensional and multi-directional global cost function following epipolar lines in stereo pairs
(Hirschmüller, 2008; Hirschmüller, 2005). The SGM approach allows DSM generation at image GSD. The
resulting point cloud was filtered and interpolated to a raster surface (Fig. 3). The DSM was used for the ortho-
correction of the Pléiades image (Fig. 2, image 3). A Digital Terrain Model (DTM), which represents the
elevation of the terrain without built-up objects or vegetation, is necessary for the calculation of object heights.
A preliminary LULC classification (compare with section 2.4) was used to identify non-elevated land-cover
as roads, open space, bare earth and barren land. For those areas, the elevation points of the DSM original
point cloud were extracted and used to interpolate a DTM. By subtracting the DTM from the DSM, a
normalised DSM is generated, indicating the object heights in the study area. Statistics for the pixels
underlying each building footprints were extracted of the normalized DSM.

http://dx.doi.org/10.4314/rj.v1i1S.6D
Rwanda Journal, Series D, Volume 1, 2016, Life and Natural Sciences: Special issue II
Image 1 Image 2 Image 3
Figure 2: Example of the Pléiades-1B panchromatic triplet of Kigali City centre
Figure 3: 2.5-dimensional representation of Kigali City centre
http://dx.doi.org/10.4314/rj.v1i1S.6D
Rwanda Journal, Series D, Volume 1, 2016, Life and Natural Sciences: Special issue II
2.4. Land-use and Land-cover classification
For the delineation of LULC, an object based image analysis approach was chosen (Blaschke, 2010; Blaschke,
et al., 2014). The method groups neighbouring pixel with similar spectral or thematic values into image
segments (Benz, et al., 2004). For these segments rulesets were developed, which comprise spectral and height
values, geometrical features, as well as spatial relationships between image objects. Additionally, the
Normalized Differential Vegetation Index (NDVI) (Rouse, 1974) was generated from the red and near-
infrared bands. The Topographic Position Index (TPI) (Guisan, et al., 1999; Weiss, 2001; De Reu, et al., 2013)
with varying radii was computed from the DSM to support the differentiation between elevated objects and
ground surface. The index calculates the distance between a central point (z0) and the average elevation (�̃�) of
a kernel, which is predefined by a radius (R).
TPI = z0 – �̃� (1)
�̃� =1
𝑛𝑅∑ 𝑧𝑖𝑖∈𝑅 (2)
Negative TPI values indicate relative low positions of z0, while positive values indicate elevated positions.
The classification of the image segments, which were not classified by the ruleset approach, was conducted
with Support Vector Machines (SVMs). SVMs is a classification method, which maximizes the boundaries
between intended classes within an n-dimensional feature space, by applying kernel functions (Burges, 1998;
Vapnik, 1998). Within this study the Support Vector Classifier (C-SVC) from the Library for Support Vector
Machines (LIBSVM) developed by Chang and Lin (2011) was utilized. The method is widely used in remote
sensing applications (Esch, et al., 2009; Bachofer, et al., 2015).
Target classes for the LULC classification were “Tree”, “Meadow / Shrub”, “Asphalt Road”, “Barren land /
Dirt Road” and “Buildings”. The building footprints were subdivided into different roofing materials.
Subsequently, the resulting building footprints were simplified and artifacts deleted.
http://dx.doi.org/10.4314/rj.v1i1S.6D
Rwanda Journal, Series D, Volume 1, 2016, Life and Natural Sciences: Special issue II
3. Results
The analysis resulted in basic land-use information and building footprints of the study area. Figure 4 shows
exemplary the results for a small focus area. 447 of 475 reference points (94 %) were located in the shape of
the identified buildings. Misclassifications occurred between rusty roofs and adjacent dirt roads. In addition,
an increased number of false matching points were identified in the villa area in the eastern part of the study
area.
The extraction of the object heights for the building footprints led to mixed accuracies. Table 2 illustrates the
mean error of the Pléiades derived average building heights to the measured maximum building height. For
the CBD and for Biryogo Cell, the error is relatively low, compared to the average building height and the
standard deviation of the building heights. For the eastern villa dominated area and the unplanned settlements,
the mean error is considered as relatively high.

http://dx.doi.org/10.4314/rj.v1i1S.6D
Rwanda Journal, Series D, Volume 1, 2016, Life and Natural Sciences: Special issue II
Figure 4: Focus area showing the LULC result (2) and the derived building footprints (3)
Table 2: Statistical evaluation of building heights extraction (STDEV = standard deviation)
Urban structure
No. of reference
points with height
information
Average building
height (from
reference)
Mean error in m
1. CBD 34 7.08 m
(STDEV 5.06 m)
2.33 m
(STDEV 2.56 m)
2. Single-family
villa-type 53
6.01 m
(STDEV 3.15 m)
5.04 m
(STDEV 3.70 m)
3. Biryogo regular
spaced pattern 36
3.95 m
(STDEV 0.80 m)
1.95 m
(STDEV 1.48 m)
4. Unplanned
settlement on slope 205
3.75 m
(STDEV 0.92 m)
3.40 m
(STDEV 2.94 m)

http://dx.doi.org/10.4314/rj.v1i1S.6D
Rwanda Journal, Series D, Volume 1, 2016, Life and Natural Sciences: Special issue II
4. Discussion and conclusions
The extraction of building footprints by multispectral and height information of a Pléiades satellite scene led
to promising results with a high accuracy. Nevertheless, various difficulties occurred during the processing,
which had a negative impact on the classification accuracy. The unplanned squatter areas with a high building
density and relatively small share of bare ground made it difficult to distinguish between single buildings and
to identify the building heights. The TPI helped to differentiate very well between single detached buildings.
The index improved the result in some areas, but could not increase the accuracy in densely built-up areas
located on steep slopes. Roofs consisting of rusty corrugated metal proved to be another difficulty. They
showed the same spectral properties as open soil for the four spectral channels. Since rusty roofs and open soil
/ dirt roads occur often adjacent to each other, the segmentation was compromised and misclassifications
occurred. Dark asbestos roofs of single-family detached buildings in the eastern part of the study area proved
to be spectral similar to vegetation shadows. Since trees often surround this kind of building, positive matches
of building footprints were low.
A big challenge is the generation of a valid DTM, which would improve the identification of buildings
significantly. Slopes, densely build-up areas, as well as shadows made it difficult to identify the elevation of
the bare ground. Especially for the assessment of a reliable DTM on horizontally and vertically convex and
concave slopes, a high density of elevation points on bare ground are needed. Thus, the error caused by a low
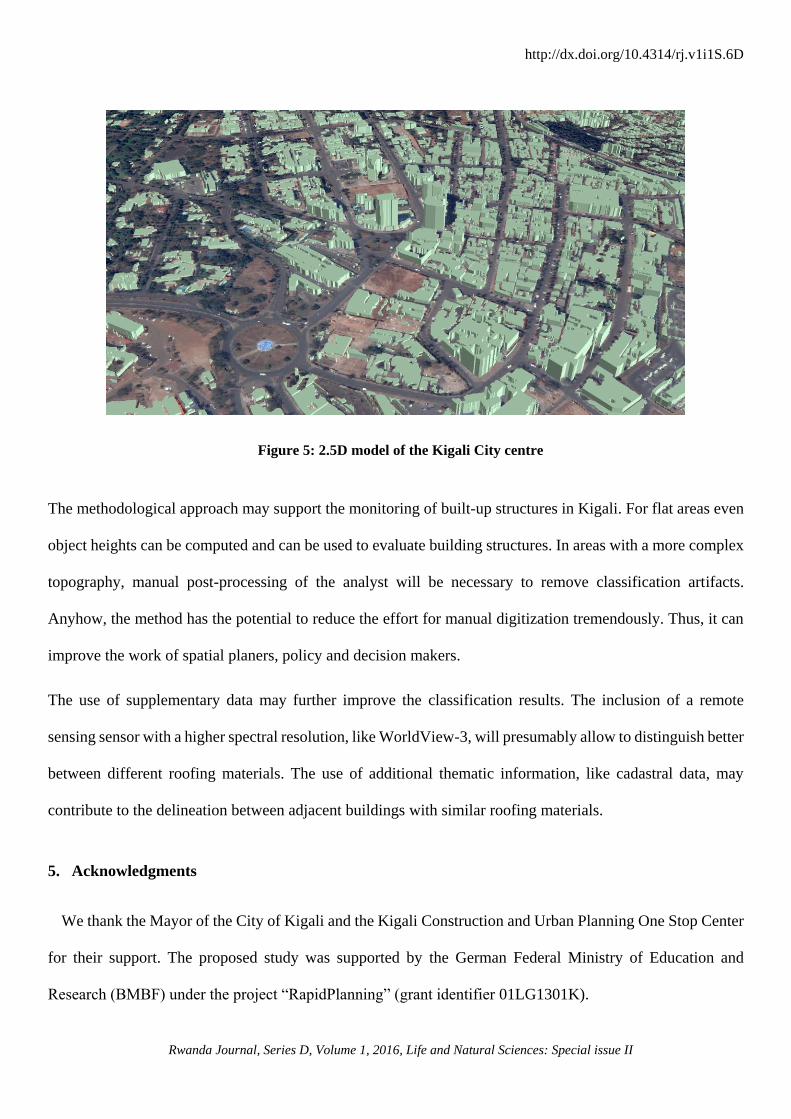
number of elevation points is introduced into the assessment of the building heights. Even though the results
are satisfying so far (Fig. 5), further investigations are necessary on the influence of roofing material and roof
shape on the derivation of heights.
http://dx.doi.org/10.4314/rj.v1i1S.6D
Rwanda Journal, Series D, Volume 1, 2016, Life and Natural Sciences: Special issue II
Figure 5: 2.5D model of the Kigali City centre
The methodological approach may support the monitoring of built-up structures in Kigali. For flat areas even
object heights can be computed and can be used to evaluate building structures. In areas with a more complex
topography, manual post-processing of the analyst will be necessary to remove classification artifacts.
Anyhow, the method has the potential to reduce the effort for manual digitization tremendously. Thus, it can
improve the work of spatial planers, policy and decision makers.
The use of supplementary data may further improve the classification results. The inclusion of a remote
sensing sensor with a higher spectral resolution, like WorldView-3, will presumably allow to distinguish better
between different roofing materials. The use of additional thematic information, like cadastral data, may
contribute to the delineation between adjacent buildings with similar roofing materials.
5. Acknowledgments
We thank the Mayor of the City of Kigali and the Kigali Construction and Urban Planning One Stop Center
for their support. The proposed study was supported by the German Federal Ministry of Education and
Research (BMBF) under the project “RapidPlanning” (grant identifier 01LG1301K).
http://dx.doi.org/10.4314/rj.v1i1S.6D
Rwanda Journal, Series D, Volume 1, 2016, Life and Natural Sciences: Special issue II
References
1. Aytekın, Ö., Erener, A., Ulusoy, İ. & Düzgün, Ş., 2012. Unsupervised building detection in complex
urban environments from multispectral satellite imagery. International Journal of Remote Sensing, 33
(7), pp. 2152-2177.
2. Bachofer, F., Quénéhervé, G., Märker, M. & Hochschild, V., 2015. Comparison of SVM and Boosted
Regression Trees for the Delineation of Lacustrine Sediments using Multispectral ASTER Data and
Topographic Indices in the Lake Manyara Basin. Photogrammetrie, Fernerkundung, Geoinformation
(PFG), 1 / 2015 pp. 81-94.
3. Benz, U. C., Hofmann, P., Willhauck, G., Lingenfelder, I. & Heynen, M., 2004. Multi-resolution,
object-oriented fuzzy analysis of remote sensing data for GIS-ready information. ISPRS Journal of
Photogrammetry and Remote Sensing, 58 (3–4), pp. 239-258.
4. Bernard, M., Decluseau, D., L.Gabet & Nonin, P., 2012. 3D Capabilities of Pléiades satellite. In
XXXIX-B3, International Archives of the Photogrammetry, Remote Sensing and Spatial Information
Sciences. Melbourne, Australia,
5. Blaschke, T., 2010. Object based image analysis for remote sensing. ISPRS Journal of
Photogrammetry and Remote Sensing, 65 pp. 2-16.
6. Blaschke, T., Hay, G. J., Kelly, M., Lang, S., Hofmann, P., Addink, E., Queiroz Feitosa, R., van der
Meer, F., van der Werff, H., van Coillie, F. & Tiede, D., 2014. Geographic Object-Based Image
Analysis – Towards a new paradigm. ISPRS Journal of Photogrammetry and Remote Sensing, 87 (0),
pp. 180-191.
7. Burges, C., 1998. A Tutorial on Support Vector Machines for Pattern Recognition. Data Mining and
Knowledge Discovery, 2 (2), pp. 121-167.
8. Chang, C.-C. & Lin, C.-J., 2011. LIBSVM: A library for support vector machines. ACM Transactions
on Intelligent Systems and Technology, 2 (3), pp. 1-27.

http://dx.doi.org/10.4314/rj.v1i1S.6D
Rwanda Journal, Series D, Volume 1, 2016, Life and Natural Sciences: Special issue II
9. Comber, A., Umezaki, M., Zhou, R., Ding, Y., Li, Y., Fu, H., Jiang, H. & Tewkesbury, A., 2012. Using
shadows in high-resolution imagery to determine building height. Remote Sensing Letters, 3 (7), pp.
551-556.
10. De Reu, J., Bourgeois, J., Bats, M., Zwertvaegher, A., Gelorini, V., De Smedt, P., Chu, W., Antrop,
M., De Maeyer, P., Finke, P., Van Meirvenne, M., Verniers, J. & Crombé, P., 2013. Application of the
topographic position index to heterogeneous landscapes. Geomorphology, 186 pp. 39-49.
11. Esch, T., Himmler, V., Schorcht, G., Thiel, M., Wehrmann, T., Bachofer, F., Conrad, C., Schmidt, M.
& Dech, S., 2009. Large-area assessment of impervious surface based on integrated analysis of single-
date Landsat-7 images and geospatial vector data. Remote Sensing of Environment, 113 (8), pp. 1678-
1690.
12. Gleyzes, M. A., Perret, L. & Kubik, P., 2012. Pleiades System Architecture and main Performances.
In ISPRS - International Archives of the Photogrammetry, Remote Sensing and Spatial Information
Sciences. Melbourne, Australia, 25 August – 01 September 2012.
13. Guisan, A., Weiss, S. & Weiss, A., 1999. GLM versus CCA spatial modeling of plant species
distribution. Plant Ecology, 143 (1), pp. 107-122.
14. Hirschmüller, H., 2005. Accurate and Efficient Stereo Processing by Semi-Global Matching and
Mutual Information. In Computer Vision and Pattern Recognition.
15. Hirschmüller, H., 2008. Stereo Processing by Semiglobal Matching and Mutual Information. Pattern
Analysis and Machine Intelligence, IEEE Transactions on, 30 (2), pp. 328-341.
16. Hu, F., Gao, X. M., Li, G. Y. & Li, M., 2016. Dem Extraction from Worldview-3 Stereo-Images and
Accuracy Evaluation. ISPRS - International Archives of the Photogrammetry, Remote Sensing and
Spatial Information Sciences, XLI-B1 pp. 327-332.
17. Malpica, J. A., Alonso, M. C., Papí, F., Arozarena, A. & Martínez De Agirre, A., 2013. Change
detection of buildings from satellite imagery and lidar data. International Journal of Remote Sensing,
34 (5), pp. 1652-1675.

http://dx.doi.org/10.4314/rj.v1i1S.6D
Rwanda Journal, Series D, Volume 1, 2016, Life and Natural Sciences: Special issue II
18. NISR & MINECOFIN, 2015. Rwanda Fourth Population and Housing Census 2012. District Profile:
Nyarugenge.
19. Poli, D., Remondino, F., Angiuli, E. & Agugiaro, G., 2013. Evaluation of PLEIADES-1A Triplet on
Trento Testfield. In ISPRS - International Archives of the Photogrammetry, Remote Sensing and
Spatial Information Sciences.
20. Poli, D., Remondino, F., Angiuli, E. & Agugiaro, G., 2014. Radiometric and geometric evaluation of
GeoEye-1, WorldView-2 and Pléiades-1A stereo images for 3D information extraction. ISPRS Journal
of Photogrammetry and Remote Sensing, pp.
21. Priestnall, G., Jaafar, J. & Duncan, A., 2000. Extracting urban features from LiDAR digital surface
models. Computers, Environment and Urban Systems, 24 (2), pp. 65-78.
22. Qin, R., Tian, J. & Reinartz, P., 2015. Spatiotemporal inferences for use in building detection using
series of very-high-resolution space-borne stereo images. International Journal of Remote Sensing,
pp. 1-22.
23. Rouse, J. W., R. H., Haas, J. A., Shell, D.W., Deering and J.C., Harlan, 1974. Monitoring the vernal
advancement of retrogradation of natural vegetation. Final Report, Type III, 371.
24. Sagashya, D. G., 2014. Launching the new Rwanda basemap 1:50,000. ESRI GIS-day Kigali, Rwanda,
Rwanda Natural Resources Authority - RNRA.
25. Shaker, I. F., Abd-Elrahman, A., Abdel-Gawad, A. K. & Sherief, M. A., 2011. Building Extraction
from High Resolution Space Images in High Density Residential Areas in the Great Cairo Region.
Remote Sensing, 3 (12), pp. 781-791.
26. Singh, G., Jouppi, M., Zhang, Z. & Zakhor, A., 2015. Shadow based building extraction from single
satellite image. In Proc. SPIE 9401, Computational Imaging XIII. San Francisco, California, United
States,
http://dx.doi.org/10.4314/rj.v1i1S.6D
Rwanda Journal, Series D, Volume 1, 2016, Life and Natural Sciences: Special issue II
27. Sirmacek, B., d’Angelo, P. & Reinartz, P., 2010. Detecting complex building shapes in panchromatic
images for digital elevation model enhancement. In ISPRS Istanbul Workshop 2010 on Modeling of
Optical Airborne and Spaceborne Sensors. Istnabul, Turkey, Oct. 11-13.
28. Sohn, G. & Dowman, I., 2007. Data fusion of high-resolution satellite imagery and LiDAR data for
automatic building extraction. ISPRS Journal of Photogrammetry and Remote Sensing, 62 (1), pp. 43-
63.
29. Topan, H., Taşkanat, T. & Cam, A., 2013. Georeferencing Accuracy Assessment of Pléiades 1A
Images Using Rational Function Model. In ISPRS - International Archives of the Photogrammetry,
Remote Sensing and Spatial Information Sciences.
30. Vapnik, V. N., 1998. Statistical learning theory. New York, Wiley.
31. Weiss, A. D., 2001. Topographic Position and Landforms Analysis In Poster Presentation at the ESRI
User Conference. San Diego, CA, USA,
32. Wurm, M., d Angelo, P., Reinartz, P. & Taubenbock, H., 2014. Investigating the Applicability of
Cartosat-1 DEMs and Topographic Maps to Localize Large-Area Urban Mass Concentrations. IEEE
Journal of Selected Topics in Applied Earth Observations and Remote Sensing, (99), pp. 1-15.