assessment of burden of disease in nepalnhrc.gov.np/wp-content/uploads/2018/02/assessment_of...dr...
TRANSCRIPT

Assessment of Burden of Disease in Nepal
i
Assessment of Burden of Disease in
Nepal
2009
Report
Nepal Health Research Council
February, 2018

Assessment of Burden of Disease in Nepal
ii
Assessment of Burden of Disease in Nepal, 2009
© Nepal Health Research Council, Ramshah Path Kathmandu
No part of this report may be reproduced in any written, electronic, recording, or photocopying
without written permission of the Nepal Health Research Council. The exception would be in the
case of brief quotations embodied in the critical articles or reviews and pages where permission
is specifically granted by the Council.
Recommended Citation Nepal Health Research Council. Assessment of Burden f Disease in Nepal, 2009. Kathmandu, Nepal; Nepal Health Research Council, 2018.

Assessment of Burden of Disease in Nepal
iii
Acknowledgement
I would like to express my sincere thanks to all those research participants without whose
support this research work would not have been completed.
My special thanks are to the entire study team, the executive boards, the staring committee and
the sub committees the members of which are as stated here.
NHRC Executive Board 2007
NHRC Executive Board 2009
Dr Mahesh Kumar Maskey Prof Dr Chop Lal Bhusal
Dr Buddha Basnyat Dr Rishi Ram Koirala
Dr.Sharad Onta Dr Narendra Kumar Singh
Dr.Sri Krishna Giri Dr Suman Rijal
Dr.Somnath Aryal Dr Meeta Singh
Dr Basanta Raj Pant Dr Samjhana Dhakal
Dr.Kedar Prasad Baral Dr Devi Gurung
Mr.Prem Karki Mr Laxman Aryal
Dr Dirgh Raj RC Mr Atma Ram Pandey
Dr Lumeshwor Acharya Dr Senendra Raj Uprety
Dr Sheila Verma Prof Dr Arun Sayami
Dr Shital Kaji Sjrestha Dr Damodar Gajurel
Mr. Laxman Aryal Dr Sankher Pratap Singh
Mr. Atma Ram Pandey
Dr Senendra Raj Uprety
Prof Dr Arun Sayami
Dr Damodar Gajurel
Dr Sarita Upadhyay

Assessment of Burden of Disease in Nepal
iv
Steering Committee
Dr Mahesh Kumar Maskey
Dr Badri Raj Pandey
Dr Tirtha Rana
Dr Nirakarman Shrestha
Dr Mahendra Bahadur Bista
Dr Nilambar Jha
Dr Sarad Raj Onta
Dr Mahendra Keshari Chhetri
Prof Dr Madan Prasad Upadhya
Sub Committee members
Dr Chop Lal Bhusal
Dr Badri Raj Pandey
Dr Tirtha Rana
Dr Anjani Kumar Jha
Dr Kedar Prashad Baral
Prof Dr Madan Prashad Upadhya
Dr Mahendra Keshari Chhetri
Dr Babu Ram Marasini
Dr Shankar Pratap Singh
Dr Rajendra Kumar BC
Dr Meghnath Dhimal
Mr. Purushottam Dhakal
Mr. Bijay Kumar Jha
DoHS Representative

Assessment of Burden of Disease in Nepal
v
Project staffs
Ms. Alina Maharjan Mr. Shekhar Payhak Mr. Sobit Kunwar
Ms. Milima Singh Dangol Mr. Tikaram Ghimire Ms. Pooja Bariya
Mr. Krishna Kumar Karki Mr. Wakil Jha Ms. Gita Devi Poudyal
Mr. Prakash Kumar Baral Ms. Karauna Pulami Magar
Mr. Sudan Shrestha Mr. Dhan Bahadur Moktan
Mr. Bikesh Bajracharya Mr. Dipak Poudel
Ms. Alina Tandukar Mr. Uttam K.C
Ms. Sarada Dwadi Ms. Suna Sharma
Mr. Durga Prashad Adhkari Mr. Janak Bhusal
Mr. Rajendra Mahato Mr. Kshitiz Karki
Mr. Manoj Kumar Lal Mr. Md. Kafulwara
Mr. Bhauch Prashad Yadav Ms. Satyawan Sabitri Kasati
Mr. Kiran Lama Ghising Ms. Tuka Cheki Sherpa
Mr. Jay Prakash Yadav Mr. Khem Bhurtel
Mr. Nagerndra Prasad Yadav Mr. Kamal Raj pandit
Ms. Dipika Das Mr. Bharat Pd. Adhkari
Ms. Kimat Adhkari Mr. Toyanath Tiwari
Mr. Ramesh Adhkari Ms. Ranjani Shah
Mr. Paramod Katuwal Mr. Biswo Ratna Ghimire
Mr. Prasanna Sharma Mr. Baikuntha Sharma
Mr. Sumanta Ghimire Ms. Trishna Khanal
Mr. Ram Kumar Prasai Ms. Rita Rai
Mr. Om Bahadur Basnet Mr. Iswor Koirala
Mr. Basanta Budathoki Mr. Sobit Kunwar
Ms. Kopila Budhaprithi Mr. Balaram Adhkari
Mr. Uddim Bdr Devkota Mr. Ganga Poudel
Mr. Him Kanta Bhusal Ms. Tanka Maya pokherl
Mr. Gopal Sharma Mr. Hem Raj Chalise
Ms. Bandana Gautam Mr. Manoj Chettri
Last but not least, I would like to thank all those individuals and organizations who had helped
directly and indirectly to make this study successful.
Prof Dr Anjani Kumar Jha
Executive Chairman

Assessment of Burden of Disease in Nepal
vi
CONTENTS
Acknowledgement ................................................................................................... iii
List of Tables ........................................................................................................... xi
List of Figures ........................................................................................................ xiv
Abbreviations .........................................................................................................xvii
Key Findings .......................................................................................................... xix
1.1. Background ...................................................................................................... 1
1.2. History of Burden of Disease Studies ............................................................. 2
1.3. Rationale .......................................................................................................... 4
1.4. Objective ........................................................................................................... 6
Chapter 2 ................................................................................................................... 7
2.1 Methodology ...................................................................................................................................... 7
2.2 Sampling technique ........................................................................................................................... 7
2.3 Population .......................................................................................................................................... 8
2.4 Disease Categories ............................................................................................................................. 8
2.5 Discounting and Age weights ........................................................................................................... 9
2.6 Life Expectancy ................................................................................................................................. 9
2.7 Years of Life Lost (YLL) .................................................................................................................. 9
2.8 Tools and Techniques ....................................................................................................................... 9
2.9 Information collected ...................................................................................................................... 10
2.10 Selection and training of enumerators ........................................................................................ 10
2.11 Data collection process.................................................................................................................. 10
2.11 a) District level Orientation ......................................................................................................... 10
2.11 b) VDC level Orientation ............................................................................................................ 11
2.11 c) Community Level Activities ................................................................................................... 11
2.12 Data Coding ................................................................................................................................... 12
2.13 Data Quality .................................................................................................................................. 12
2.14 Data Entry and Analysis .............................................................................................................. 13

Assessment of Burden of Disease in Nepal
vii
2.15 Limitations of the Study ............................................................................................................... 13
Chapter 3: Results and findings .............................................................................14
3.1 Overview .......................................................................................................................................... 14
3.2 Broad Group wise YLL .................................................................................................................. 18
3.3 Group I: Communicable, Maternal, Perinatal and Nutritional Diseases .................................. 18
I-A Infectious and Parasitic Diseases .................................................................................................. 20
I-A1 Tuberculosis ............................................................................................................................... 22
I-A3 Human Immunodeficiency Virus (HIV)..................................................................................... 24
I-A4 Diarrhoeal Diseases .................................................................................................................... 25
I-A5 Childhood cluster diseases ......................................................................................................... 27
I-A5b Acute Flaccid Paralysis ........................................................................................................................ 28
I-A5c Diphtheria ............................................................................................................................................. 29
I-A5d Measles ................................................................................................................................................ 29
I-A5e Tetanus ................................................................................................................................................. 30
I-A6 Meningitis ................................................................................................................................... 32
I-A7 Hepatitis ...................................................................................................................................... 33
I-A8 Malaria ........................................................................................................................................ 35
I-A9 Tropical Cluster Disease ............................................................................................................. 36
I-A9d Leismaniasis ......................................................................................................................................... 37
I-A9e Lymphatic filariasis .............................................................................................................................. 39
I-A9g Rabies ................................................................................................................................................... 40
I-A10 Leprosy ..................................................................................................................................... 41
I-A12 Japanese Encephalitis ............................................................................................................... 43
I-A14 Worm Infestation ...................................................................................................................... 44
I-A15 Other Infectious Diseases ......................................................................................................... 44
I-B Respiratory Infections .................................................................................................................... 46
I-B1 Lower Respiratory Infections ..................................................................................................... 47
I-B2 Upper Respiratory Infections ...................................................................................................... 48
I-B3 Otitis Media ................................................................................................................................ 50
I.C. Maternal Conditions ..................................................................................................................... 51
I-C1 Maternal Haemorrhage ............................................................................................................... 53
I-C2 Maternal Sepsis ........................................................................................................................... 54
I-C3 Hypertensive disorders of pregnancy ......................................................................................... 54
I-C4 Obstructed labour........................................................................................................................ 55
I-C5 Abortion ...................................................................................................................................... 56
I-C6 Other Maternal Conditions ......................................................................................................... 57
I-D Neonatal Conditions ....................................................................................................................... 58
I-D1 Low Birth Weight ....................................................................................................................... 59
I-D2 Birth asphyxia and birth trauma ................................................................................................. 61
I.D.3 Other Perinatal conditions ......................................................................................................... 62
I.E. Nutritional Deficiencies ........................................................................................................... 63

Assessment of Burden of Disease in Nepal
viii
I-E1 Protein-Energy Malnutrition ......................................................................................................................... 64
I-E2 Iron-deficiency anaemia .................................................................................................................................. 66
I-E3 Other nutritional disorders ............................................................................................................................ 67
3.4 Group II: Non-Communicable Diseases .................................................................................... 69
II-A Malignant neoplasms ............................................................................................................. 71
II-A1 Mouth and oropharynx .................................................................................................................................. 73
II-A2 Oesophagus Cancer .......................................................................................................................................... 74
II-A3 Stomach Cancer ................................................................................................................................................. 75
II-A4 Colon and rectum Cancer .............................................................................................................................. 77
II-A5 Liver Cancer ........................................................................................................................................................ 79
II-A7 Trachea bronchus and lung Cancer .......................................................................................................... 80
II-A9 Breast Cancer ..................................................................................................................................................... 82
II-A10 Cancer of cervix .............................................................................................................................................. 84
II-A14 Bladder Cancer ................................................................................................................................................ 85
II-A16 Leukemia ........................................................................................................................................................... 85
II-A17 Other Malignant Neoplasms ...................................................................................................................... 86
II-B Other neoplasms .................................................................................................................... 87
II-C Diabetes mellitus.................................................................................................................... 89
II-D Endocrine disorders ............................................................................................................... 91
I-E Neuropsychiatric disorders ...................................................................................................... 93
II-E1 Unipolar depressive disorders .................................................................................................................... 95
I-E2 Bipolar affective disorders ............................................................................................................................. 95
I-E4 Epilepsy .................................................................................................................................................................. 95
I-E5 Alcohol use disorders ....................................................................................................................................... 97
I-E14 Migraine ............................................................................................................................................................... 98
I-E15 Mental retardation attributable to lead exposure ............................................................................. 99
I-E16 Other neuropsychiatric disorders ......................................................................................................... 100
II-F Sense organ disorders ........................................................................................................... 102
II-G Cardiovascular diseases ........................................................................................................ 103
II-G1 Rheumatic heart disease ............................................................................................................................ 105
II-G2 Hypertensive heart disease ....................................................................................................................... 106
II-G3 Ischaemic heart disease .............................................................................................................................. 108
II-G4 Cerebrovascular disease ............................................................................................................................. 109
II-G5 Other Cardiovascular disease ................................................................................................................... 112
II-H Respiratory diseases ............................................................................................................ 114
II-H1 Chronic Obstructive Pulmonary diseases ........................................................................................... 115
II-H2 Asthma ............................................................................................................................................................... 117
II-H4 Other respiratory diseases ........................................................................................................................ 118
II- I Digestive diseases................................................................................................................. 120
Assessment of Burden of Disease in Nepal
ix
II-I1 Peptic ulcer disease ........................................................................................................................................ 121
II-I2 Cirrhosis of the liver ...................................................................................................................................... 123
II-I3 Appendicitis ...................................................................................................................................................... 124
II-I4 Other digestive diseases .............................................................................................................................. 125
II-J Genito-urinary diseases ......................................................................................................... 127
II-J1 Nephritis and nephrosis ............................................................................................................................... 128
II-J2 Benign prostatic hypertrophy ................................................................................................................... 129
II-J3 Other genitourinary system ....................................................................................................................... 130
II-K Skin diseases ........................................................................................................................ 131
II-L Musculoskeletal diseases ...................................................................................................... 133
II-L1 Rheumatoid arthritis .................................................................................................................................... 135
II-L3 Gout ..................................................................................................................................................................... 136
II-L4 Low back pain.................................................................................................................................................. 136
II-L5 Other musculoskeletal diseases ............................................................................................................... 136
II-M Congenital anomalies .......................................................................................................... 138
II-M1 Unclassified Congenital anomalies ........................................................................................................ 139
II-M2 Anencephaly ................................................................................................................................................... 139
II-M3 Anorectal Atresia .......................................................................................................................................... 140
II-M4 Cleft Lip ............................................................................................................................................................. 140
II-M5 Cleft palate ....................................................................................................................................................... 140
II-M7 Renal agenesis................................................................................................................................................ 141
II-M9 Congenital heart anomalies ...................................................................................................................... 141
II-M10 Spina Bifida ................................................................................................................................................... 141
II-M11 Other Congenital Anomaly ..................................................................................................................... 141
II-N Blood Disorder ..................................................................................................................... 142
3.5 Injuries ................................................................................................................................. 144
III-A Unintentional Injuries ......................................................................................................... 145
III-A1 Road Traffic Accident ................................................................................................................................. 146
III-A2 Poisonings ....................................................................................................................................................... 148
III-A3 Falls .................................................................................................................................................................... 150
III-A4 Fires ................................................................................................................................................................... 152
III-A5 Drowning ......................................................................................................................................................... 153
III-A6 Other unintentional injuries .................................................................................................................... 154
III-A7 Snake Bite ........................................................................................................................................................ 156
III-B Intentional injuries .............................................................................................................. 157
III-B1 Self-inflicted injuries .................................................................................................................................. 158
III-B2 Violence ............................................................................................................................................................ 160
III-B3 War..................................................................................................................................................................... 161
III-B4 Other intentional injuries ......................................................................................................................... 162
Assessment of Burden of Disease in Nepal
x
3.6 Unidentified Cases ................................................................................................................ 164
ANNEX I - Disease and injuries categories ..................................................... 166
Annex II- Sampling ............................................................................................... 168
References ............................................................................................................... 189

Assessment of Burden of Disease in Nepal
xi
List of Tables TABLE 3.1.1: TOP 20 CAUSES OF YEARS OF LIFE LOST, NEPAL ................................................................................................... 15
TABLE 3.1.2 : TOP 20 YEARS OF LIFE LOST BY CAUSE AND SEX, NEPAL ....................................................................................... 16
TABLE 3.1.3: TOP 10 YEARS OF LIFE LOST IN 0-14 AND 15-29 YEARS OF AGE GROUP, NEPAL ......................................................... 17
TABLE 3.1.4: TOP 10 YEARS OF LIFE LOST IN 30-59 AND 60+ YEARS OF AGE GROUP ..................................................................... 17
TABLE 3.2.1: YLL DISTRIBUTION OF BROAD DISEASE CATEGORIES ............................................................................................... 18
TABLE 3.3.1. YLL DISTRIBUTION OF COMMUNICABLE, MATERNAL, PERINATAL AND NUTRITIONAL DISEASES ........................................ 19
TABLE 3.3.2: TOP 20 CAUSES OF YLL DUE TO COMMUNICABLE, MATERNAL, PERINATAL AND NUTRITIONAL DISEASES .......................... 20
TABLE 3.3.3 YLL DISTRIBUTION OF INFECTIOUS AND PARASITIC DISEASES .................................................................................... 22
TABLE 3.3.4 YLL DISTRIBUTION OF TUBERCULOSIS .................................................................................................................. 23
TABLE 3.3.5. YLL DISTRIBUTION OF HIV/AIDS ...................................................................................................................... 24
TABLE 3.3.6. YLL DISTRIBUTION OF DIARRHOEAL DISEASES ...................................................................................................... 25
TABLE 3.3.7. YLL DISTRIBUTION OF CHILDHOOD CLUSTER DISEASES .......................................................................................... 28
TABLE 3.3.8. YLL DISTRIBUTION OF ACUTE FLACCID PARALYSIS ................................................................................................. 28
TABLE 3.3.9. YLL DISTRIBUTION OF MEASLES ........................................................................................................................ 30
TABLE 3.3.10. YLL DISTRIBUTION OF TETANUS ...................................................................................................................... 31
TABLE 3.3.11.YLL DISTRIBUTION OF MENINGITIS .................................................................................................................. 33
TABLE 3.3.12. YLL DISTRIBUTION OF HEPATITIS ..................................................................................................................... 34
TABLE 3.3.13. YLL DISTRIBUTION OF MALARIA ...................................................................................................................... 36
TABLE 3.3.14. YLL DISTRIBUTION OF TROPICAL CLUSTER DISEASES ............................................................................................ 37
TABLE 3.3.15. YLL DISTRIBUTION OF LEISHMANIASIS .............................................................................................................. 38
TABLE 3.3.16. YLL DISTRIBUTION OF LYMPHATIC FILARIASIS..................................................................................................... 39
TABLE 3.3.17. YLL DISTRIBUTION OF RABIES ......................................................................................................................... 41
TABLE 3.3.18. YLL DISTRIBUTION OF LEPROSY ...................................................................................................................... 42
TABLE 3.3.19. YLL DISTRIBUTION OF JAPANESE ENCEPHALITIS .................................................................................................. 44
TABLE 3.3.20. YLL DISTRIBUTION OF OTHER INFECTIOUS DISEASES ............................................................................................ 45
TABLE 3.3.21. YLL DISTRIBUTION OF RESPIRATORY INFECTION ................................................................................................. 47
TABLE 3.3.22. YLL DISTRIBUTION OF LOWER RESPIRATORY INFECTIONS ...................................................................................... 48
TABLE 3.3.23. YLL DISTRIBUTION OF UPPER RESPIRATORY INFECTIONS ...................................................................................... 49
TABLE 3.3.24. YLL DISTRIBUTION OF OTITIS MEDIA ................................................................................................................ 51
TABLE 3.3.25. YLL DISTRIBUTION OF MATERNAL CONDITIONS .................................................................................................. 52
TABLE 3.3.26. YLL DISTRIBUTION OF MATERNAL HAEMORRHAGE .............................................................................................. 53
TABLE 3.3.27. YLL DISTRIBUTION OF MATERNAL SEPSIS .......................................................................................................... 54
TABLE 3.3.28. YLL DISTRIBUTION OF HYPERTENSIVE DISORDERS OF PREGNANCY .......................................................................... 55
TABLE 3.3.29.YLL DISTRIBUTION OF OBSTRUCTED LABOUR ...................................................................................................... 56
TABLE 3.3.30. YLL DISTRIBUTION OF ABORTION ................................................................................................................... 57
TABLE 3.3.31. YLL DISTRIBUTION OF OTHER MATERNAL CONDITIONS......................................................................................... 58
TABLE 3.3.32. YLL DISTRIBUTION OF NEONATAL CONDITIONS ................................................................................................. 59
TABLE 3.3.33. YLL DISTRIBUTION OF LOW BIRTH WEIGHT ....................................................................................................... 60
TABLE 3.3.34. YLL DISTRIBUTION OF BIRTH ASPHYXIA AND BIRTH TRAUMA ................................................................................. 61
TABLE 3.3.35. YLL DISTRIBUTION OF OTHER PERINATAL CONDITIONS ......................................................................................... 63
TABLE 3.3.36. YLL DISTRIBUTION OF NUTRITIONAL DEFICIENCIES .............................................................................................. 64
TABLE 3.3.37. YLL DISTRIBUTION OF PROTEIN-ENERGY MALNUTRITION ...................................................................................... 65
TABLE 3.3.38. YLL DISTRIBUTION OF IRON-DEFICIENCY ANAEMIA .............................................................................................. 66
TABLE 3.3.39.YLL DISTRIBUTION OF OTHER NUTRITIONAL DISORDERS ....................................................................................... 67

Assessment of Burden of Disease in Nepal
xii
TABLE 3.4.1: PERCENTAGE YLL DISTRIBUTION OF NON COMMUNICABLE DISEASES ....................................................................... 70
TABLE 3.4.3: PERCENTAGE YLL DISTRIBUTION DUE TO MALIGNANT NEOPLASM CATEGORIES ........................................................... 72
TABLE 3.4.4: YLL DISTRIBUTION OF MOUTH AND OROPHARYNX CANCERS ................................................................................... 74
TABLE 3.4.6: YLL DISTRIBUTION OF STOMACH CANCER ............................................................................................................ 76
TABLE 3.4.7: YLL DISTRIBUTION OF COLON AND RECTUM CANCERS ............................................................................................ 78
TABLE 3.4.8: YLL DISTRIBUTION OF LIVER CANCER ................................................................................................................. 80
TABLE 3.4.9: YLL DISTRIBUTION OF TRACHEA, BRONCHUS AND LUNG CANCERS ............................................................................ 82
TABLE 3.4.10: YLL DISTRIBUTION OF BREAST CANCER ............................................................................................................ 83
TABLE 3.4.11 : YLL DISTRIBUTION OF CERVIX UTERI CANCER .................................................................................................... 85
TABLE 3.4.12: YLL DISTRIBUTION OF OTHER CONGENITAL ANOMALIES ....................................................................................... 85
TABLE 3.4.13: YLL DISTRIBUTION OF OTHER MALIGNANT NEOPLASMS ....................................................................................... 87
TABLE 3.4.14 : YLL DISTRIBUTION OF OTHER NEOPLASMS ....................................................................................................... 88
TABLE 3.4.15: YLL DISTRIBUTION OF DIABETES MELLITUS ....................................................................................................... 90
TABLE 3.4.16: YLL DISTRIBUTION OF ENDOCRINE DISORDERS .................................................................................................. 93
TABLE 3.4.17: YLL DISTRIBUTION OF NEUROPSYCHIATRIC DISEASES .......................................................................................... 94
TABLE 3.4.18:YLL DISTRIBUTION OF EPILEPSY ....................................................................................................................... 96
TABLE 3.4.19: YLL DISTRIBUTION OF ALCOHOL USE DISORDERS ................................................................................................ 98
TABLE 3.4.20: YLL DISTRIBUTION OF MIGRAINE .................................................................................................................... 99
TABLE 3.4.21: YLL DISTRIBUTION OF MENTAL RETARDATION ATTRIBUTABLE TO LEAD EXPOSURE ................................................... 100
TABLE 3.4.22: YLL DISTRIBUTION OF OTHER NEUROPSYCHIATRIC DISORDERS ............................................................................. 101
TABLE 3.4.23: YLL DISTRIBUTION OF OTHER SENSE ORGAN DISORDERS .................................................................................... 103
TABLE 3.4.24: YLL DISTRIBUTION OF CARDIOVASCULAR DISEASES .......................................................................................... 104
TABLE 3.4.25:YLL DISTRIBUTION OF RHEUMATIC HEART DISEASE ............................................................................................ 106
TABLE 3.4.26: YLL DISTRIBUTION OF HYPERTENSIVE HEART DISEASE ........................................................................................ 107
TABLE 3.4.27: YLL DISTRIBUTION OF ISCHAEMIC HEART DISEASE ............................................................................................. 109
TABLE 3.4.28: YLL DISTRIBUTION OF CEREBROVASCULAR DISEASE ........................................................................................... 111
TABLE 3.4.29: YLL DISTRIBUTION OF OTHER CARDIOVASCULAR DISEASES .................................................................................. 113
TABLE 3.4.30: YLL DISTRIBUTION OF RESPIRATORY DISEASES .................................................................................................. 114
TABLE 3.4.31: YLL DISTRIBUTION OF CHRONIC OBSTRUCTIVE PULMONARY DISEASE .................................................................... 116
TABLE 3.4.32: YLL DISTRIBUTION OF ASTHMA .................................................................................................................... 118
TABLE 3.4.33: YLL DISTRIBUTION OF OTHER RESPIRATORY DISEASES ........................................................................................ 119
TABLE 3.4.34: YLL DISTRIBUTION OF DIGESTIVE DISEASES ..................................................................................................... 121
TABLE 3.4.35: YLL DISTRIBUTION OF PEPTIC ULCER DISEASE ................................................................................................... 122
TABLE 3.4.36: YLL DISTRIBUTION OF CIRRHOSIS OF THE LIVER ................................................................................................ 124
TABLE 3.4.37: YLL DISTRIBUTION OF APPENDICITIS.............................................................................................................. 125
TABLE 3.4.38: YLL DISTRIBUTION OF OTHER DIGESTIVE DISEASES ........................................................................................... 126
TABLE 3.4.39: YLL DISTRIBUTION OF GENITO-URINARY DISEASES ........................................................................................... 127
TABLE 3.4.40: YLL DISTRIBUTION OF NEPHRITIS AND NEPHROSIS ............................................................................................ 129
TABLE 3.4.41: YLL DISTRIBUTION OF BENIGN PROSTATIC HYPERTROPHY ................................................................................... 130
TABLE 3.4.42: YLL DISTRIBUTION OF OTHER GENITOURINARY SYSTEM DISEASES ......................................................................... 131
TABLE 3.4.43: YLL DISTRIBUTION OF SKIN DISEASES ............................................................................................................. 133
TABLE 3.4.44: YLL DISTRIBUTION OF MUSCULOSKELETAL DISEASES ......................................................................................... 134
TABLE 3.4.45: YLL DISTRIBUTION OF RHEUMATOID ARTHRITIS ................................................................................................ 135
TABLE 3.4.46: YLL DISTRIBUTION OF LOW BACK PAIN ........................................................................................................... 136
TABLE 3.4.47: YLL DISTRIBUTION OF OTHER MUSCULOSKELETAL DISORDERS ............................................................................. 137
TABLE 3.4.48: YLL DISTRIBUTION OF CONGENITAL ANOMALIES .............................................................................................. 138

Assessment of Burden of Disease in Nepal
xiii
TABLE 3.5.1 : YLL DISTRIBUTION OF UNINTENTIONAL INJURIES ............................................................................................... 144
TABLE 3.5.2: YLL DISTRIBUTION OF INJURY CATEGORIES ........................................................................................................ 145
TABLE 3.5.3 : YLL DISTRIBUTION OF UNINTENTIONAL INJURIES ............................................................................................... 146
TABLE3.5.4: YLL DISTRIBUTION OF ROAD TRAFFIC ACCIDENTS ................................................................................................. 148
TABLE 3.5.5: YLL DISTRIBUTION OF POISONINGS ................................................................................................................. 149
TABLE 3.5.6: YLL DISTRIBUTION OF FALLS ........................................................................................................................... 151
TABLE 3.5.7: YLL DISTRIBUTION OF FIRES .......................................................................................................................... 152
TABLE 3.5.8: YLL DISTRIBUTION OF DROWNING................................................................................................................... 154
TABLE 3.5.9: YLL DISTRIBUTION OF OTHER UNINTENTIONAL INJURIES ...................................................................................... 155
TABLE 3.5.10: YLL DISTRIBUTION OF SNAKE BITE ................................................................................................... 157
TABLE 3.5.11 : YLL DISTRIBUTION OF INTENTIONAL INJURIES .................................................................................................. 158
TABLE 3.5.12: YLL DISTRIBUTION OF SELF INFLICTED INJURIES ................................................................................ 159
TABLE 3.5.13: YLL DISTRIBUTION OF VIOLENCE ....................................................................................................... 161
TABLE 3.5.14: YLL DISTRIBUTION OF WAR ......................................................................................................................... 162
TABLE 3.5.15: YLL DISTRIBUTION OF OTHER INTENTIONAL INJURIES ........................................................................................ 163

Assessment of Burden of Disease in Nepal
xiv
List of Figures FIGURE 2.1.1 MAP OF NEPAL REPRESENTING SELECTED DISTRICTS FOR BOD NEPAL .................................................... 7
FIGURE 3.1.1 REGION WISE DISTRIBUTION OF TOTAL YLL .......................................................................................... 14
FIGURE 3.3.1 REGION WISE DISTRIBUTION OF TOTAL YLL DUE GROUP I CATEGORY ................................................... 19
FIGURE 3.3.2 REGION WISE DISTRIBUTION OF TOTAL YLL DUE INFECTIOUS AND PARASITIC DISEASES ........................ 21
FIGURE 3.3.3 REGION WISE DISTRIBUTION OF TOTAL YLL DUE TUBERCULOSIS ........................................................... 22
FIGURE 3.3.4 REGION WISE DISTRIBUTION OF TOTAL YLL DUE HIV ............................................................................ 24
FIGURE 3.3.5 REGION WISE DISTRIBUTION OF TOTAL YLL DUE DIARRHOEAL DISEASES ............................................. 27
FIGURE 3.3.6 REGION WISE DISTRIBUTION OF TOTAL YLL DUE TO CHILDHOOD CLUSTER DISEASES ........................... 27
FIGURE 3.3.8 REGION WISE DISTRIBUTION OF TOTAL YLL DUE TO MEASLES............................................................... 29
FIGURE 3.3.9 REGION WISE DISTRIBUTION OF TOTAL YLL DUE TO TETANUS ............................................................... 32
FIGURE 3.3.10 REGION WISE DISTRIBUTION OF TOTAL YLL DUE TO MENINGITIS......................................................... 32
FIGURE 3.3.11 REGION WISE DISTRIBUTION OF TOTAL YLL DUE TO HEPATITIS ........................................................... 35
FIGURE 3.3.12 REGION WISE DISTRIBUTION OF TOTAL YLL DUE MALARIA ................................................................. 35
FIGURE 3.3.13 REGION WISE DISTRIBUTION OF TOTAL YLL DUE TO TROPICAL CLUSTER DISEASE ............................... 37
FIGURE 3.3.14 REGION WISE DISTRIBUTION OF TOTAL YLL DUE TO LEISMANIASIS ..................................................... 38
FIGURE 3.3.15 REGION WISE DISTRIBUTION OF TOTAL YLL DUE TO LYMPHATIC FILARIASIS ....................................... 40
FIGURE 3.3.16 REGION WISE DISTRIBUTION OF TOTAL YLL DUE TO RABIES ................................................................ 40
FIGURE 3.3.17 REGION WISE DISTRIBUTION OF TOTAL YLL DUE TO LEPROSY ............................................................. 43
FIGURE 3.3.18 REGION WISE DISTRIBUTION OF TOTAL YLL DUE TO JAPANESE ENCEPHALITIS ..................................... 43
FIGURE 3.3.19 REGION WISE DISTRIBUTION OF TOTAL YLL DUE TO OTHER INFECTIOUS DISEASES .............................. 46
FIGURE 3.3.20.REGION WISE DISTRIBUTION OF TOTAL YLL DUE TO RESPIRATORY INFECTION.................................... 46
FIGURE 3.3.21 REGION WISE DISTRIBUTION OF TOTAL YLL DUE TO LOWER RESPIRATORY INFECTION ....................... 47
FIGURE 3.3.22 REGION WISE DISTRIBUTION OF TOTAL YLL DUE TO UPPER RESPIRATORY INFECTION ........................ 50
FIGURE 3.3.23 REGION WISE DISTRIBUTION OF TOTAL YLL DUE TO OTITIS MEDIA ..................................................... 50
FIGURE 3.3.24.REGION WISE DISTRIBUTION OF TOTAL YLL DUE MATERNAL CONDITIONS.......................................... 52
FIGURE 3.3.25 REGION WISE DISTRIBUTION OF TOTAL YLL DUE MATERNAL HAEMORRHAGE .................................... 53
FIGURE 3.3.26 REGION WISE DISTRIBUTION OF TOTAL YLL DUE MATERNAL SEPSIS .................................................... 54
FIGURE 3.3.27 REGION WISE DISTRIBUTION OF TOTAL YLL DUE TO HYPERTENSIVE DISORDERS OF PREGNANCY ........ 55
FIGURE 3.3.28 REGION WISE DISTRIBUTION OF TOTAL YLL DUE TO OBSTRUCTED LABOUR ......................................... 56
FIGURE 3.3.29.REGION WISE DISTRIBUTION OF TOTAL YLL DUE TO ABORTION ........................................................... 57
FIGURE 3.3.30 REGION WISE DISTRIBUTION OF TOTAL YLL DUE TO OTHER MATERNAL CONDITIONS........................... 58
FIGURE 3.3.31 REGION WISE DISTRIBUTION OF TOTAL YLL DUE TO NEONATAL CONDITIONS ..................................... 59
FIGURE 3.3.32 REGION WISE DISTRIBUTION OF TOTAL YLL DUE TO LOW BIRTH WEIGHT ........................................... 60
FIGURE 3.3.33 REGION WISE DISTRIBUTION OF TOTAL YLL DUE TO BIRTH ASPHYXIA AND BIRTH TRAUMA ................ 61
FIGURE 3.3.34 REGION WISE DISTRIBUTION OF TOTAL YLL DUE TO OTHER PERINATAL CONDITIONS .......................... 62
FIGURE 3.3.35 REGION WISE DISTRIBUTION OF TOTAL YLL DUE TO NUTRITIONAL DEFICIENCIES ................................ 63
FIGURE 3.3.36 REGION WISE DISTRIBUTION OF TOTAL YLL DUE TO PROTEIN ENERGY MALNUTRITION ...................... 64
FIGURE 3.3.37 REGION WISE DISTRIBUTION OF TOTAL YLL DUE TO IRON-DEFICIENCY ANAEMIA ................................ 66
FIGURE: 3.4.1 PERCENTAGE YLL DISTRIBUTION DUE TO NON-COMMUNICABLE DISEASES .......................................... 69
FIGURE 3.4.2: PERCENTAGE YLL DISTRIBUTION DUE TO MALIGNANT NEOPLASM CATEGORIES .................................. 72
FIGURE 3.4.4: PERCENTAGE YLL DISTRIBUTION DUE TO STOMACH CANCER............................................................... 75
FIGURE 3.4.5: PERCENTAGE YLL DISTRIBUTION DUE TO COLON AND RECTUM CANCER ............................................. 77
FIGURE 3.4.6: PERCENTAGE YLL DISTRIBUTION DUE TO LIVER CANCER ..................................................................... 79

Assessment of Burden of Disease in Nepal
xv
FIGURE 3.4.7: PERCENTAGE YLL DISTRIBUTION DUE TO TRACHEA BRONCHUS AND LUNG CANCER ............................ 81
FIGURE 3.4.8: PERCENTAGE YLL DISTRIBUTION DUE TO BREAST CANCER .................................................................. 83
FIGURE 3.4.9: PERCENTAGE YLL DISTRIBUTION DUE TO CANCER OF CERVIX .............................................................. 84
FIGURE 3.4.10: PERCENTAGE YLL DISTRIBUTION DUE TO OTHER MALIGNANT NEOPLASMS ....................................... 86
FIGURE: 3.4.11 PERCENTAGE YLL DISTRIBUTION DUE TO OTHER NEOPLASMS ........................................................... 89
FIGURE 3.4.12: PERCENTAGE YLL DISTRIBUTION DUE TO DIABETES MELLITUS .......................................................... 90
FIGURE 3.4.13: PERCENTAGE YLL DISTRIBUTION DUE TO ENDOCRINE DISORDERS ..................................................... 92
FIGURE 3.4.14: PERCENTAGE YLL DISTRIBUTION DUE TO NEUROPSYCHIATRIC DISORDER .......................................... 93
FIGURE 3.4.15: PERCENTAGE YLL DISTRIBUTION DUE TO EPILEPSY ............................................................................ 95
FIGURE 3.4.16: PERCENTAGE YLL DISTRIBUTION DUE TO ALCOHOL USE DISORDERS .................................................. 97
FIGURE 3.4.17: PERCENTAGE YLL DISTRIBUTION DUE TO OTHER NEUROPSYCHIATRIC DISORDERS ........................... 100
FIGURE 3.4.18: PERCENTAGE YLL DISTRIBUTION DUE TO OTHER SENSE ORGAN DISORDERS ..................................... 102
FIGURE 3.4.19: PERCENTAGE YLL DISTRIBUTION DUE TO CARDIOVASCULAR DISEASES ........................................... 104
FIGURE 3.4.20: PERCENTAGE YLL DISTRIBUTION DUE TO RHEUMATIC HEART DISEASE ............................................ 105
FIGURE 3.4.21: PERCENTAGE YLL DISTRIBUTION DUE TO HYPERTENSIVE HEART DISEASE ....................................... 106
FIGURE 3.4.22: PERCENTAGE YLL DISTRIBUTION DUE TO ISCHAEMIC HEART DISEASE .............................................. 108
FIGURE 3.4.23: PERCENTAGE YLL DISTRIBUTION DUE TO CEREBROVASCULAR DISEASE ........................................... 110
FIGURE 3.4.24: PERCENTAGE YLL DISTRIBUTION DUE TO OTHER CARDIOVASCULAR DISEASE ................................. 112
FIGURE 3.4.25: PERCENTAGE YLL DISTRIBUTION DUE TO OTHER CARDIOVASCULAR DISEASE ................................. 114
FIGURE 3.4.26: PERCENTAGE YLL DISTRIBUTION DUE TO CHRONIC OBSTRUCTIVE PULMONARY DISEASES .............. 115
FIGURE 3.4.27: PERCENTAGE YLL DISTRIBUTION DUE TO ASTHMA ........................................................................... 117
FIGURE 3.4.28: PERCENTAGE YLL DISTRIBUTION DUE TO OTHER RESPIRATORY DISEASES ....................................... 119
FIGURE 3.4.29: PERCENTAGE YLL DISTRIBUTION DUE TO DIGESTIVE DISEASES ........................................................ 120
FIGURE 3.4.30: PERCENTAGE YLL DISTRIBUTION DUE TO PEPTIC ULCER DISEASE ..................................................... 121
FIGURE 3.4.31: PERCENTAGE YLL DISTRIBUTION DUE TO CIRRHOSIS OF THE LIVER .................................................. 123
FIGURE 3.4.32: PERCENTAGE YLL DISTRIBUTION DUE TO OTHER DIGESTIVE DISEASES ............................................. 125
FIGURE 3.4.33: PERCENTAGE YLL DISTRIBUTION DUE TO GENITO-URINARY DISEASES ............................................. 127
FIGURE 3.4.34: PERCENTAGE YLL DISTRIBUTION DUE TO NEPHRITIS AND NEPHROSIS .............................................. 128
FIGURE 3.4.35: PERCENTAGE YLL DISTRIBUTION DUE TO OTHER GENITOURINARY SYSTEM ..................................... 130
FIGURE 3.4.36: PERCENTAGE YLL DISTRIBUTION DUE TO SKIN DISEASES ................................................................. 132
FIGURE 3.4.37: PERCENTAGE YLL DISTRIBUTION DUE TO MUSCULOSKELETAL DISEASES ......................................... 134
FIGURE 3.4.38: PERCENTAGE YLL DISTRIBUTION DUE TO RHEUMATOID ARTHRITIS ................................................. 135
FIGURE 3.4.39: PERCENTAGE YLL DISTRIBUTION DUE TO OTHER MUSCULOSKELETAL DISEASES .............................. 136
FIGURE 3.4.40: PERCENTAGE YLL DISTRIBUTION DUE TO CONGENITAL ANOMALIES ................................................ 138
FIGURE 3.4.41: PERCENTAGE YLL DISTRIBUTION DUE TO UNCLASSIFIED CONGENITAL ANOMALIES ........................ 139
FIGURE 3.4.42: PERCENTAGE YLL DISTRIBUTION DUE TO ANORECTAL ATRESIA ...................................................... 140
FIGURE 3.4.43: PERCENTAGE YLL DISTRIBUTION DUE TO OTHER CONGENITAL ANOMALY ...................................... 141
FIGURE: 3.4.44: PERCENTAGE YLL DISTRIBUTION DUE TO BLOOD DISORDER ........................................................... 142
FIGURE 3.5.1 REGION WISE DISTRIBUTION OF TOTAL YLL DUE TO INJURIES .............................................................. 144
FIGURE 3.5.2 REGION WISE DISTRIBUTION OF TOTAL YLL DUE TO UNINTENTIONAL INJURIES .................................. 145
FIGURE 3.5.3. REGION WISE DISTRIBUTION OF TOTAL YLL DUE TO ROAD TRAFFIC ACCIDENTS ................................ 147
FIGURE 3.5.4.REGION WISE DISTRIBUTION OF TOTAL YLL DUE TO POISONINGS ........................................................ 150
FIGURE 3.5.5.REGION WISE DISTRIBUTION OF TOTAL YLL DUE TO FALLS ................................................................. 150
FIGURE 3.5.6.REGION WISE DISTRIBUTION OF TOTAL YLL DUE TO FIRES .................................................................. 153
FIGURE 3.5.7.REGION WISE DISTRIBUTION OF TOTAL YLL DUE TO DROWNING ......................................................... 153
FIGURE 3.5.8.REGION WISE DISTRIBUTION OF TOTAL YLL DUE TO OTHER UNINTENTIONAL INJURIES ........................ 156

Assessment of Burden of Disease in Nepal
xvi
FIGURE 3.5.9.REGION WISE DISTRIBUTION OF TOTAL YLL DUE TO SNAKE BITE ......................................................... 156
FIGURE 3.5.10.REGION WISE DISTRIBUTION OF TOTAL YLL DUE TO INTENTIONAL INJURIES ..................................... 158
FIGURE 3.5.11.REGION WISE DISTRIBUTION OF TOTAL YLL DUE TO SELF-INFLECTED INJURIES ................................. 160
FIGURE 3.5.12.REGION WISE DISTRIBUTION OF TOTAL YLL DUE TO VIOLENCE ......................................................... 160
FIGURE 3.5.13.REGION WISE DISTRIBUTION OF TOTAL YLL DUE TO WAR ................................................................. 161
FIGURE 3.5.14.REGION WISE DISTRIBUTION OF TOTAL YLL DUE TO OTHER INTENTIONAL INJURIES ......................... 164
FIGURE 3.6.1: PERCENTAGE YLL DISTRIBUTION DUE TO UNIDENTIFIED CASES ......................................................... 164

Assessment of Burden of Disease in Nepal
xvii
Abbreviations
ABDIS Assessment of Burden of Disease
AFP Acute Flaccid Paralysis
BCG Bacillus Calmette Guerin
BOD Burden of Disease
C Central Development Region
COPD Chronic Obstructive Pulmonary diseases
DALY Disability Adjusted Life Years
DHO District Health Office
DPHO District Public Health Office
E Eastern Development Region
FCHVs Female Community Health Volunteers
FW Far-Western Development Region
GBD Global Burden of Disease
GFD Group Focus Discussion
GTZ German Technical Co-operation
H Hill Region
HIV/AIDS Human Immunodeficiency Virus / Acquired Immune Deficiency Syndrome
HMIS Health Management Information System
ICD International Classification of Diseases
ICD -10 International Classification of Diseases, 10th revision
JE Japanese Encephalitis
LRIs Lower Respiratory Infections
M Mountain Region
MCHWs Maternal and Child Health Workers
MoH Ministry of Health
MoHP Ministry of Health and Population
Ms-Excel Microsoft Excel
MW Mid-Western Development Region

Assessment of Burden of Disease in Nepal
xviii
NCASC National Centre for AIDS & STD Control
NHRC Nepal Health Research Council
OAI Other Asia and Island
PEM Protein-Energy Malnutrition
RTA Road Traffic Accident
SPSS Statistical Package for Social Sciences
SQL Structured Query Language
T Terai Region
TB Tuberculosis
TBAs Traditional Birth Attendants
TT Tetanus Toxoid
UMN United Mission to Nepal
URIs Upper Respiratory Infections
VDC Village Development Committee
VHWs Village Health Workers
W Western Development Region
WB World Bank
WHO World Health Organization
YLL Years of life lost
Assessment of Burden of Disease in Nepal
xix
Key Findings
Total Mortality Burden
Premature mortality was responsible for more than 2.3 million Years of Life Lost (YLL).
Burden due to premature mortality (YLL) was almost similar in both sexes accounting for
1.25 million YLL in males and 1.04 million YLL in females.
Years of life lost of children (0-14 age group) was found to be about 900 thousand years
(40% of total YLL) while that of elderly population (60+) was 580 thousand YLL (25% of
total YLL).
Mortality burden was found to be highest in Central (26%) and lowest in Far-Western
Development Region (12%). Likewise, Terai region was estimated to have maximum
mortality burden (51%) followed by Hill (37%) and Mountain (12%).
Among the major three broad groups, Communicable, maternal, perinatal and nutritional
conditions (Group I) was the highest contributor in total YLL (45%) followed by non-
communicable diseases (36%) and injuries (12%).
Distribution of YLL among further disease and injuries categories showed that Chronic
Obstructive Pulmonary diseases (COPD), Lower respiratory infections (LRI) and
Tuberculosis constituted top three diseases accounting for about 26% of total YLL.
Group I burden (Communicable, maternal, perinatal and nutritional conditions)
Group I diseases and conditions were responsible for about 560 thousand life lost due to
premature mortality in men and 485 thousand in women. Highest burden was observed in
Central region (28%) and lowest in Mountain (13%). Likewise, Terai and Western regions
had almost similar burden of about 25% and lowest in Far-Western region (15%).
Among disease categories of group I, Infectious and parasitic diseases were observed to be
the leading causes of mortality (42%) followed by conditions arising during the neonatal
period (28%) and respiratory infections (21%).
Lower Respiratory Infections, Tuberculosis and Diarrhoeal diseases were the top three
specific diseases under group I which constituted 41 % of total YLL due to Group I.
Tuberculosis account for more than 120 thousand years of life lost in total with
approximately 58% of YLL in productive age group (15-59).
Assessment of Burden of Disease in Nepal
xx
More than 50 percent of burden due to HIV was found to be Hill region. Males of 30-59 age
group had the highest burden of HIV accounting more than 70% of total YLL due to HIV.
Diarrhoeal disease was responsible for almost a million years of life lost, majority of which
(65%) was seen in 0-14 age group.
Tetanus had the highest contribution (45%) in the total YLL due to Childhood cluster
diseases followed by Measles (41%). Burden of Measles was estimated to be very high in
western region (59%).
Hepatitis accounts for more than sixty thousand of YLL. Males had two times higher burden
than females.
Majority of burden due to Respiratory Infection was contributed by Lower Respiratory
Infection (98%). About 95% of burden due to Respiratory Infection observed in the below 14
age group.
Maternal haemorrhage was the highest contributor for mortality due to maternal conditions
accounting for 37% of total YLL.
More than 29 thousand of years of life was lost due to neonatal conditions responsible for
28% of total YLL due to Group I category. Birth asphyxia and birth trauma was the major
cause behind life lost due to neonatal conditions.
Protein-Energy malnutrition was the leading cause of YLL accounting for 92.7% of total
YLL due to nutritional deficiencies.
Group II burden (Non-Communicable Diseases)
Non-communicable diseases shared 830668 years of life lost (36.1%) nationally. The burden
was observed equally distributed among males (50.7 %) and females (49.3 %).
Approximately 50 percent of YLL was shared by terai region and least was observed in
mountain region (11 %). Likewise, Central and Western development region both shared
highest (27.4%) while far-western development region shared lowest percentage (9.4%) of
YLL.
Malignant neoplasms accounted 7.9 percent of YLL among the non-communicable diseases.
About 76 percent of YLL due to malignant neoplasms were observed in terai region.
Stomach cancer (23.8%), trachea bronchus and lung cancer (23.1%) and cervix cancer
(22.7%) were the top three causes of malignant neoplasm nationally.
More than half (51.1%) of YLL due to diabetes mellitus was observed among 30-59 years of
age group.
Assessment of Burden of Disease in Nepal
xxi
Neuropsychiatric disorders accounted 7.6 % among non-communicable diseases. Epilepsy
(32.9%) and Alcohol use disorder (23%) were observed ad the major causes of YLL among
neuropsychiatric disorders.
Cerebrovascular diseases were the leading cause of YLL among cardiovascular diseases. It
accounted 43.8 percent among this category. About 60 percent of burden due to
cerebrovascular diseases was observed in elderly age population (60+).
Respiratory diseases (32.5%), cardiovascular diseases (19.2%) and digestive diseases
(12.8%) collectively contributed more than sixty percent of YLL among non-communicable
diseases. Least was contributed by sense organ diseases (0.3%) and endocrine diseases
(0.2%).
Among the respiratory diseases COPD contributed 97.6 percent which was 11.4 percent of
the total YLL distribution nationally. Majority of COPD burden (73.6 %) was observed
among elderly age group.
Peptic ulcer accounted 14.9 percent of years of life lost among digestive diseases among
which 48.7 percent was observed in terai region. More than fifty percent of YLL due to
peptic ulcer was observed among 30-59 years of age group.
About 7.8 percent of YLL among genito-urinary diseases was observed due to nephritis and
nephrosis. The occurrence of YLL due to the problem was observed among 0-14 (97.5%) and
60+ (2.5%) age group only.
Skin diseases were observed highest in terai region among which maximum (66.1%) was
observed in 0-14 age group.
Musculoskeletal diseases contributed 0.8 % of YLL out of that more than half was observed
in terai region. Rheumatoid arthritis accounted one third percent of YLL due to
musculoskeletal diseases. All the YLL due to rheumatoid arthritis was observed in elderly
age group among which females accounted 53.8 percent of YLL.
Anorectal atresia was caused 9.9 percent of YLL among congenital anomalies out of which
53.3 percent of YLL was observed in males child.
Blood disorder was observed highest (78.4) among 0-14 years of age group and majority of
YLL was contributed by females (57.7%) group.
Group III burden (Injuries)
Total mortality burden due to injuries were estimated to be more than 270 thousand years of
life lost. Burden in males were twice the burden in females.

Assessment of Burden of Disease in Nepal
xxii
Injuries were distributed equally among all the development regions ranging from 21% to
23% except in Far-Western region (10%). Likewise, Terai and Hill regions were responsible
for almost equal share of about 40% while Mountain region has minimum share of 15% only.
Among disease categories of group III, more than 2/3rd
of total YLL was contributed by
unintentional injuries.
Road traffic accidents, Poisonings and Snake Bite were the top three specific diseases under
group III which constituted 56 % of total YLL due to Group III.
Among the specific conditions within unintentional injuries, majority of YLL (28%) was
contributed by fall which was followed by Road traffic Accidents (22.2%) and drowning
(20.3%).
Total burden due to Road traffic Accidents (RTA) was about 42 thousand YLL. Half of the
burden was concentrated in Hill region. Burden in males were almost 12 times higher than in
females. Majority of burden due to RTA (89%) was in productive age group (15-59).
More than 54 thousand of life lost was estimated due to Falls with more than half of the
burden in Hill region. Males were estimated to have higher burden of Falls.
Drowning was responsible for more than 38 thousand years of life lost with most of the
burden in under 14 age group.
Among the specific conditions within intentional injuries, majority of burden was due to self-
inflicted injuries (69.8%) followed by war (14%).

Assessment of Burden of Disease in Nepal
1
Chapter 1: Introduction
1.1. Background In the era when most of the countries are facing increasing demand of the health resources, either
due to increasing burden of diseases and injuries or due to the development in knowledge and
technology, strategic health planning has become very essential. Such health planning must take
into account the needs of the health system that is, the health planning should be evidence based.
Policy makers must be aware of the comparative burden of diseases and injuries and how this
burden is likely to change with the adoption of various policies and interventions. This requires
quantification of health status and health problems. Quantification sets boundaries on claims
made in health policy and, in some cases, can put new intervention options on the agenda.
In the past, mortality and its derivative, life expectancy, have been important indicators of health.
With the impressive increase in life expectancy at birth over the past decades, public health
attention has moved toward the quality of the life-years gained—that is, to morbidity and health-
related quality of life, in addition to mortality. This has led to the development of “composite
health measures,” in which health losses through mortality and morbidity are combined. One of
these is the disability-adjusted life-year (DALY) which was developed by The Harvard School of
Public Health in collaboration with The World Bank and World Health Organization in 1993 to
assess the Global Burden of Disease (GBD).i One DALY can be thought of as one lost year of
‘healthy’ life and the burden of disease as a measurement of the gap between current health
status and an ideal situation where everyone lives into old age free of disease and disability.ii
DALY for a disease or health condition are calculated as the sum of the years of life lost (YLL)
due to premature mortality in the population and the equivalent "healthy" years of life lost due to
disability (YLD) for incident cases of the health condition.
In 1993, when the GBD study got completed, several countries attempted to estimate national
BOD. Nepal also tried to estimate burden of disease in 1996 as a background study for
prioritizing health needs and as a participatory process to contribute in formulation of second

Assessment of Burden of Disease in Nepal
2
long term health plan (1997-2017). Though the study was used extensively in different policies
and plans at that time, Nepal Health Research Council (NHRC) felt the need to estimate burden
of disease from more representative data and decided to conduct National BOD study in Nepal.
However, NHRC had an aim to estimate the BOD as a whole but the associated technical and
financial problems made it had to shrink its idea just to calculate mortality burden of the country.
Hence, this study provides the overall mortality burden attributable by various diseases and
injuries in the country applying the methods developed by WHO and WB. The study
commenced in May 2007. This study has been carried out with the support of Ministry of Health
and Population (MoHP), Government of Nepal.
1.2. History of Burden of Disease Studies
Global Burden of Disease Study
Concept of BOD emerged in early 1990’s. In 1992, the WB commissioned the initial GBD study
to provide a comprehensive assessment of the disease burden in 1990. The study was undertaken
for the world as a whole. It further analyzed the global statistics into eight regions. In order to
recommend intervention packages for countries at different stages of development, the estimates
were combined with analyses of the cost effectiveness of interventions in different populations.
Earlier attempts to quantify global cause of death patterns were valuable initial contributions to
building the evidence base for policy, but they were largely restricted to broad cause of death
groups, for example, all infections and parasitic diseases were combined, and did not address
nonfatal health outcomes.
To prepare internally consistent estimates of incidence, prevalence, duration, and mortality for
almost 500 sequelae of the diseases and injuries under consideration, a mathematical model,
DisMod, was developed for the 1990 GBD study. This helped to convert partial, often
nonspecific, data on disease and injury occurrence into a consistent description of the basic
epidemiological parameters in each region by age group. To assess the burden of disease, the
1990 GBD study used a time-based metric that measures both premature mortality and disability.
The results of the 1990 GBD study confirmed what many health workers had suspected for
sometimes, that non-communicable diseases and injuries were a significant cause of health

Assessment of Burden of Disease in Nepal
3
burden in all regions and in some rapidly industrializing regions such as East Asia and Pacific
they were already by far the leading cause of death and disability i, iii
.
These estimates help in producing most comprehensive and consistent set of information of
mortality and morbidity by age, sex and region. The GBD 1990 study had assessed about 108
major diseases to quantify the burden of diseases which were categorized under three broad
groups. For further study and analysis the groups were again divided into several sub-groups.
Countries specific Burden of Disease study
Completion of the GBD study encouraged many countries to realize the necessity to estimate
national burden of disease. WHO and WB supported the member states in conducting BOD
studies to ensure better data for country level planning and performance. Many countries and
health development agencies have adopted the GBD approach as the standard for health
accounting and for guiding the determination of health research priorities.
Here are some countries who had already conducted the BOD study: Australia (1999) The
burden of disease and injury in Australia, Thailand (2002) Burden of Disease and Injuries in
Thailand, Malaysia (2000) Malaysian Burden of Disease and Injury Study, Himanchal Pradesh
state of India (2001-02) Himachal Burden of Disease - A Study, Andra Pradesh state of
India, Andhra Pradesh Burden of Disease Study, Mauritius (Vos and others 1995) Mauritius
Burden of Disease Study, Mexico (Lozano and others 1995), Turkey (2005) Turkey Burden of
disease study, The United States (2005), China (2001) Burden of Disease in China, Srilanka,
New-Zealand (2001) The Burden of Disease and Injury in New Zealand, Victoria (1996)
Victorian Burden of Disease Study, Korea (2002) Measuring the Burden of Disease in Korea
and South Africa (2003) Initial Burden of Disease Estimates for South Africa.
In Nepal, WB had conducted a study called "Nepal Operational Issues and Prioritization of
Resources in Health Sectors-1996" which estimated DALY using hospital based data through
indirect techniques. The current BOD study computes burden of more than 100 disease categories
identified to reflect the mortality pattern in Nepal. It applies the methods developed by WHO and
WB for the GBD study.

Assessment of Burden of Disease in Nepal
4
1.3. Rationale Addressing inequities in health around the world is one of the greatest challenges faced by public
health advocates globally. Developing nations are suffering from a double burden of disease. The
consequences of infections, malnutrition, and pregnancy and birth-related health problems, while
at the same time contending with heart disease, diabetes, cancer, and other non-communicable
diseases and injuries introduced with growing urbanization and globalization.
Health and provision of health facility is essential to every state and nation of this world. The
responsible authorities tend to prepare the short and long term health plans to obtain good health
for their citizens. The prerequisites for the formulation of plans and policies are the precise
information. Every country has its own information collection system. Various developing
countries still lack the efficient tools for information collection and sometimes important data are
missing. In Nepal though there is the provision of death registration, either record is not
maintained or is incomplete. The available information presents very dim situation of the
disease, but we cannot say the burden due to the specific disease. Lack of adequate information
may lead to inappropriate policies and misallocation of the scarce resources. Hence,
determination of the existing mortality burden of diseases is urgent, for enabling appropriate
policy formulation.
Development of second long term health plan (SLTHP-1997-2017) as a 20 years long term plan
was the turning point to decide on a package of affordable and most effective health service
package based on BOD analysis for the first time for the country. A study “Nepal Operational
Issues and Prioritization of Resources in Health Sectors 1996” was conducted by Health,
Nutrition and Population Unit, South Asia region with support from WHO, MoHP and GTZ to
identify the current and project demographic and burden of disease profile in Nepal helped in the
planning for SLTHP. The study used morbidity data from various sources like the Nepal Living
Standard Survey and the 1998 Human Development report which suggested a pattern of illness
that was consistent in both the sources, program based specific data were also used. Similarly,
the mortality data were obtained from the four hospitals of United Mission to Nepal (UMN)
located in Central, Western and Eastern region serving around 300,000 outpatients a year. In this
way the study calculated the burden of disease (DALY) in Nepal using various indirect

Assessment of Burden of Disease in Nepal
5
techniques. However, the previous team realized that the reliability of those national estimates
was reduced by the fact that they are based on data from hospitals in a catchment area in which
the population is healthier and better served than many. In reality health conditions are much
worse in other parts of the country which was least covered by the study. In Nepal, after “Nepal
Operational Issues and Prioritization of Resources in Health Sectors 1996” such study to
estimate the burden of disease has not been conducted. Hence, there is a great need to of
representative quantify the BOD.
The second long term health plan was formulated on the basis of detailed situation analysis of the
existing circumstances which was obtained through the various participatory processes. Among
the participatory processes the burden of disease estimation was one of the major studies which
contributed the formulation of the nation long term plan. As this long term plan is not a static,
immutable blue print for the future, it is dynamic rolling plan which allows for the development
of successive periodic and annual plans that would lead to improvement in the health status of
the population. Here, it emphasizes the burden of disease estimation to be beneficial in
development of the rational and the realistic strategies for the improvement of health status of the
nation continually.
The Annual Report, published by the Management Division, Ministry of Health and Population
(MoHP) at the end of every fiscal year, basically consists of health related information recorded
and reported by the various institutions under MoH. The health management information system
(HMIS) of Management Division is being strengthened time to time but there are yet some
limitations. For example mortality information is obtained from district hospital don't represent
the scenario of whole Nepal. Most of the deaths occur either in the community or on the way to
hospitals. Besides, there is need to cover mortality data from all the governmental,
nongovernmental, private hospital and various levels of health institutions. Therefore, there is
need to collected comprehensive information on mortality as well as morbidity to help actual
planning at the various levels.
For the purpose of GBD study the team divided globe into eight ecological regions. Among them
Nepal was categorized under the region of Other Asia and Island (OAI). The GBD study was
Assessment of Burden of Disease in Nepal
6
planned in order to quantify both years lost by premature death and years lived with disability in
a single measure using DALY. Through the indirect estimation methods overall DALY of the
world was estimated. The OAI region contributed 12.9 % of the total DALY of the world. iv
DALY is a unit measure which helps to identify the total burden of disease and can measure the
effectiveness of health interventions. It is beneficial for the comparisons of health status between
two populations or the same population over time. Essentially it facilitates the policy makers to
identify the trends of disease pattern and guides in setting priorities to utilize the scarce resources
to its optimum level. There is great need to estimate the national burden of disease to quantify
the burden of disease and injuries in Nepal to guide policy making procedures. As calculation of
DALY is a great challenge for Nepal due to lack of detailed information regarding mortality and
morbidity, this study attempts to quantify burden of disease due to premature mortality at this
stage.
1.4. Objective To quantify mortality burden of disease and injuries according to age, sex and region in
terms of Years of Life Lost (YLL) for the year 2006 in Nepal.

Assessment of Burden of Disease in Nepal
7
Chapter 2
2.1 Methodology
Nepalese burden of disease study aimed to estimate the disease burden in terms of years of life
lost. It required detailed information regarding mortality hence the study was designed to capture
all the age, sex and cause specific mortality from selected Village Development Committee
(VDCs) and Municipalities of the selected districts of Nepal. Cross sectional study design was
applied for the study.
2.2 Sampling technique
In the context of Nepalese BOD, cause specific death information was obtained from primary
source. Nepal is divided into five developmental and three ecological regions. Hence, regarding
the primary data collection for mortality estimates, 15 districts were selected randomly from each
eco-development region. Then the VDCs of selected districts were stratified on the basis of
health illakas. One VDC from each illaka were selected randomly. All the population of the
selected VDCs were included to collect the information.
North
Mountain Districts
Humla
Mugu
Sindhup
alchowk
Rolpa
Dolpa
Mustang
Manang
Jumla
Doti
Baitadi
Rukum
Kaski
Kavre
Tanahu
Palpa
Kanchanpu
r
Kailali
Kapilbastu
SelectedDistricts
Hill Districts
Terai Districts
Figure 2.1.1 Map of Nepal representing selected districts for BOD Nepal
In the districts having Municipality, in order to represent urban population, data was also
collected from the wards of Municipality. The number of selected wards of Municipality was

Assessment of Burden of Disease in Nepal
8
proportionate to the number of selected VDCs of respective districts. Primary data collection
aimed at quantifying total live births and total cause specific mortality of different diseases
among different sex and age group of the selected districts.
S.N. District Selected Total
VDCs
Selected
VDCs
Total
Municipalities
Selected
Municipalities
Selected
Wards of
Municipalities
Total
Selected
Wards
1 Sunsari 49 12 3 1 3 111
2 Illam 48 10 1 1 2 92
3 Solukhumbhu 34 11 0 0 0 99
4 Nuwakot 63 13 1 1 3 120
5 Sindhupalchowk 79 13 0 0 0 117
6 Mahottari 76 10 1 1 2 92
7 Manang 13 9 0 0 0 81
8 Kaplibastu 77 11 1 1 2 101
9 Palpa 65 12 1 1 3 111
10 Dang (14-1) 39 13 2 1 4 121
11 Humla 27 11 0 0 0 99
12 Rolpa 51 11 0 0 0 99
13 Bajhang 47 12 0 0 0 108
14 Kailali 42 13 2 1 3 120
15 Dadheldura 20 9 1 1 5 86
Total 730 170 13 9 27 1557
Altogether 170 VDCs and 9 Municipalities were selected from 15 districts. Due to some
practical problem one VDC from Dang i.e. Koilabas become inaccessible to collect information.
The study successfully captured 10,095 deaths from 1,085,207 population of 1557 wards of
selected districts of Nepal.
2.3 Population
Last census done in Nepal was in 2001. Projection of population figures have been made up to
2021 based on three scenarios: high, medium and low variants. The assumptions used in the
medium variant represent the most likely assumptions in future giving plausible estimates of the
population in future years.v Hence, this study used age and sex specific projected population of
2006 based on medium variant scenario.
2.4 Disease Categories
The GBD 2000 study defined mutually exclusive categories for more than 100 conditions and
400 disease sequelae using International Classification of Diseases (ICD). More in detail ICD-10
codes had classified disease and injury categories into a comprehensive list of three major
disease group, 22 categories of disease and injuries and 96 specific conditions following the
structure of GBD list of conditions. However, it was not possible for Nepalese BOD to include
all the categories of diseases. Hence, this study used only those diseases and specific conditions

Assessment of Burden of Disease in Nepal
9
of GBD 2000 cause categories that are relevant for Nepal. Total of three major groups, 21
categories of disease and injuries and 87 specific conditions were captured in this study.
2.5 Discounting and Age weights
There are three approaches of calculating YLL, i.e. a) with discounting and age weighting, b)
with discounting and no age weighting and c) without discounting and no age weighting. GBD
discounted YLL using 3% discount rate and applied age weights. Nepalese Burden of Disease
study had applied 3% discounting without age weights. This is mainly because, although age
weighting was intended to capture greater social responsibility in young and adult life for the
very young and old in the society, it is relatively controversial and does not essentially change
the overall burden estimates.
2.6 Life Expectancy
GBD uses standard life expectancy at birth (82.5 years for female and 80 years for male) to
calculate YLL. Even though estimated Nepalese life expectancy at birth is lower than that of
GBD (63.7 years for female and 62.9 years for male), use of standard life expectancy is required
for international comparison. Hence, this study used standard life table of reference year 2006 to
calculate YLL.
2.7 Years of Life Lost (YLL)
Years of Life Lost (YLL) is the mortality component of DALYs. YLL corresponds to the
number of deaths multiplied by the standard life expectancy at age at which the death occurs.
The basic formula for the calculation of YLL is:
The basic formula for the calculation of YLL is:
YLL=N*L where N is age and sex specific number of deaths and L is age and
sex specific mean life expectancy.
With discounting, the formula becomes:
YLL=N*(1-e-r
)/r where r = Discounting rate
2.8 Tools and Techniques
This study applied 'Motherhood Method' for data collection. In this method, information on birth,
death, health determinants and outcomes are collected in a geographic area as an unbiased census
would have but without visiting every household. It helps to measure and compare current
estimates of maternal, neonatal, infant and other mortality rates and ratios. Group Focus
Discussion is applied to conduct this method. Group Focus Discussion is a type of group
discussion in which 20-30 participants sit together and actively get involved in the discussion.
GFD is facilitated by a facilitator. In this type of discussion, questions are asked to the group and
are answered by the result of their discussion along this note taking is also done. GFD is
endorsed with the mothers as well as key informants (Maternal and Child Health Workers

Assessment of Burden of Disease in Nepal
10
(MCHWs), Village Health Workers (VHWs), Traditional Birth Attendants (TBAs) local leaders,
teachers, and Purohit (Priest) etc) to collect and verify the information collected with the help of
FCHVs.
Data collection tools were designed by the expert team. Formats to record live births and
mortality information were separate. Pretesting and field training was carried out at Chaimale
and Duwakot VDC of Kathmandu and Bhaktapur districts respectively. Those two VDCs were
selected for pretesting as resemble like many of the other rural and urban settings of Nepal.
Tools were revised on the basis of findings of pretesting.
2.9 Information collected
Information on births and deaths were recorded from the interaction with mothers group.
Live births occurred in the last one year (2063 Ashadh 1- 2064 Jestha 31)
Mortality occurred in the last two years (2062 Ashadh 1- 2064 Jestha 31)
2.10 Selection and training of enumerators
Selection: Candidates who have completed their Bachelors degree in Public health were selected
as Enumerators (Field supervisors) for the study.
Training: The enumerators were provided training with class-room orientation and practical
exposure in the VDCs that was not selected for study. Their queries regarding the study
procedure were answered and feedback to their performance was given during field training
2.11 Data collection process
Motherhood method consists of series of steps which can broadly be classified into three levels.
a) District level Orientation
b) VDC level Orientation
c) Community level Activities
2.11 a) District level Orientation
The initial step is to conduct a district level orientation with District Health Office (DHO) /
District Public Health Office (DPHO) and VDC Health facility in-charge.
i. Orientation program was organized to share objectives and expected help regarding the
study with DHO/DPHO staffs, VDC health facility in-charge.
ii. Micro level planning was carried with respective VDC health facility in-charge to conduct
data collection in the VDC/NP. Basic information about the study site (VDC/NP) like
staffing details of the health facility, population figures, geographic information etc were
collected.
iii. Appropriate time and venue for the VDC level orientation were consulted and set.
Assessment of Burden of Disease in Nepal
11
iv. As different registers (BCG, TT and Vitamin A) are required to prepare the list of mothers
who have given birth in the study period, VDC health facility incharge were also requested
to make the registers available at the time of meeting in their respective VDCs.
2.11 b) VDC level Orientation
In the selected VDCs, VDC level orientation was conducted. VDC health facility in-charge were
requested to invite Maternal and Child Health Workers (MCHWs), Village Health Workers
(VHWs), Female Community Health Volunteers (FCHVs) and Traditional Birth Attendants
(TBAs) at the health facility for VDC level meeting. Female Community Health Volunteers
(FCHVs) were the key persons who call the mothers of their respective area (ward).
i. Participants were explained about the objectives and steps of the Motherhood method.
ii. Detailed and stratified (according to 9 wards) information about VDC was collected from
the participants.
iii. The BCG record of the respective health facility was recorded ward wise in the formats
(Form no. 1) developed to collect live births during the study period.
iv. The T.T. record of the respective health facility was recorded ward wise in the formats
(Form no. 2) developed to collect details of mothers who gave live births during the study
period.
v. The list prepared was discussed, validated and augmented with the help of FCHVs of the
respective wards.
vi. After augmenting the list of mothers, details of deaths during the study period was
documented with the help of FCHVs.
vii. FCHVs were requested to call listed mothers and close relative (mother, mother-in-law or
husband) of recorded deceased person for GFD.
viii. Appropriate time and venue for the GFD was consulted with the FCHVs.
Time and venue for GFD was fixed in different wards and within the wards, on the basis of the
appropriateness of the route and time availability of the FCHVs and mothers.
2.11 c) Community Level Activities
Community level activities for data collection were mostly based upon the planning with FCHVs
during the VDC level meeting. Participants for GFD were called by FCHVs at the convenient
location. Mothers sharing community resources like water tap, exit road etc were called for the
common GFD. This increases accuracy of information as members know each other as well as
event happened in their neighborhood.
i. Enumerators were sent to each wards of the VDC. GFD was carried with the mothers,
FCHVs and key persons
ii. List of mothers who had given birth during the study period were verified and augmented
iii. List of deaths during the study period informed by FCHVs in VDC level orientation was
also verified and augmented
Assessment of Burden of Disease in Nepal
12
iv. Close relatives of the deceased were interviewed for sign/symptoms before death
including other details after GFD, if present, else done through home visit.
v. Information collected were finally verified and managed every evening.
Final set of data were brought to the center from all the selected sites.
Moreover, the basic steps that was followed by the enumerators while conducting Group Focus
discussion were
Participants called by FCHVs were warmly welcomed and rapport building was
done.
The participants were made clear about objective of field visit and the required
information.
Participants were encouraged to actively participate during the discussion.
Verification of the birth whether the mothers in the list had children born within the study
time frame.
Any additional births in their locality/ward during the study period were asked.
The deaths told by FCHVs were verified and any additional deaths were asked.
History of the deaths were probed carefully with close relative of the deceased and
noted.
Participants were thanked for their information and cooperation.
2.12 Data Coding
The information regarding cause of death was further coded by Medical doctors. Two Medical
doctors were assigned to code the cause of death separately. In case of differences in coding,
third Medical doctor was consulted and a final cause of death was assigned studying the whole
symptoms of death.
2.13 Data Quality
Data quality was the concern and challenge for this type of study. Information collected from one
source was triangulated and revalidated from other sources which helped to reduce recall bias to
great extent. For the case of birth it was first collected from the registers and FCHV's memory.
Later on during GFD, the mother of the child verified the date which was re-verified and
augmented by peer group. Similarly for the deaths, preliminary information of deaths in the ward
during the study period was obtained from FCHVs of the respective ward. Later in GFD, the
information was re-verified through consultation with close member of the deceased person and
group discussion along with some addition of missing cases and deletion of extra cases. Detailed
information on sign and symptoms were collected from close family member of deceased person
visiting their household with the help of FCHVs. In case of hospital death, medical evidences
provided by the health institution were also sought along with medical history.

Assessment of Burden of Disease in Nepal
13
2.14 Data Entry and Analysis
A special software 'Assessment of Burden of Disease (ABDIS) using SQL server and visual
basic was designed for entry of the information collected. All data entry forms were scrutinized
to detect errors and omissions each evening in the field site after the data collection. Data entry
work was carried by the team of public health graduates in the data entry format of ABDIS.
Double entry was done for accuracy of data. Data cleaning was done next as soon as data entry
was completed. Ms-Excel and Statistical Package for Social Sciences (SPSS) Version 11.5 was
further used for data processing and analysis.
2.15 Limitations of the Study
The study does not deal with the effect of co-morbidities on YLL estimates for individual
diseases.
The study does not estimate burden of disease due to various risk factors.
The study covers only those diseases whose information can be obtained.
Due to poverty and illiteracy many of respondents could not specify the exact date of
birth and death. Field Supervisors linked the dates with the seasonal calendar and
religious occasions and gave much effort to identify the dates.

Assessment of Burden of Disease in Nepal
14
Chapter 3: Results and findings
3.1 Overview
Lack of complete registration of deaths is a challenge for almost all the developing countries to
calculate burden of premature mortality and Nepal is not an exception. This chapter captures the
attempt of the study to calculate years of life lost (YLL) due to premature mortality. The
calculation of YLL is based on numbers of deaths attributed to each cause at each age. The
following section describes YLL due to different causes by age and sex given by GBD 2000 in
different categories.
It was estimated that more than 2.3 million years of life was lost due to premature mortality in
total due various categories of diseases among which about 1.25 million was observed in males
and about 1.05 million in females. The study attempts to provide detailed information regarding
years of life lost at eco-development region level also. Mortality burden was found to be highest
in Central (26%) and lowest in Far-Western Development Region (12%). Likewise, Terai region
was estimated to have maximum mortality burden (51%) followed by Hill (37%) and Mountain
(12%).
Eastern 20%
Central 26%
Western 24%
Mid-western
18%
Far-western
12% Hill 37%
Mountain 12%
Terai 51%
Figure 3.1.1 Region wise distribution of Total YLL
Ecological Region Development Region

Assessment of Burden of Disease in Nepal
15
COPD accounted highest mortality burden contributing around 263,734 years of life lost nationally.
Lower respiratory infections, tuberculosis, diarrhoeal diseases and birth asphyxia and birth trauma were
the top following causes of YLL in the country respectively. Self inflicted injuries, falls, road traffic
accidents and drowning are the various categories of injuries which were observed among the top 20
causes of YLL accounting approximately 9 percent of total YLL in the country.
Table 3.1.1: Top 20 causes of Years of Life lost, Nepal
Rank Disease category YLL Percent
1 COPD 263734 11.447
2 Lower respiratory infections 216819 9.411
3 Tuberculosis 121815 5.287
4 Diarrhoeal diseases 92080 3.997
5 Birth asphyxia and birth trauma 82532 3.582
6 Cerebrovascular disease 69750 3.027
7 Hepatitis 61594 2.673
8 Self-inflicted injuries 59449 2.580
9 Falls 54179 2.352
10 Road traffic accidents 42613 1.850
11 Drownings 38920 1.689
12 Protein-energy malnutrition 33602 1.458
13 Ischaemic heart disease 31028 1.347
14 Hypertensive heart disease 27133 1.178
15 Diabetes mellitus 23308 1.012
16 Maternal haemorrhage 22800 0.990
17 Epilepsy 20790 0.902
18 Snake Bite 17769 0.771
19 Peptic ulcer disease 15913 0.691
20 Stomach cancer 15574 0.676
Similar to the national distribution COPD and Lower respiratory infections were the top two leading
causes of YLL among males and females (Table: 3.1.2) nationally. COPD was observed to contribute
more percent of YLL among females (13.7 % in females and 9.5% in males) than the males. Tuberculosis
was observed at third rank contributing 6.8 percent of the total YLL among males while it was in fourth
rank contributing about 3.3 percent among females. Diarrhoeal diseases accounted 4.4 percent out of total
in the third rank among females while it was in the fifth position contributing 3.6 percent out of total
among males.
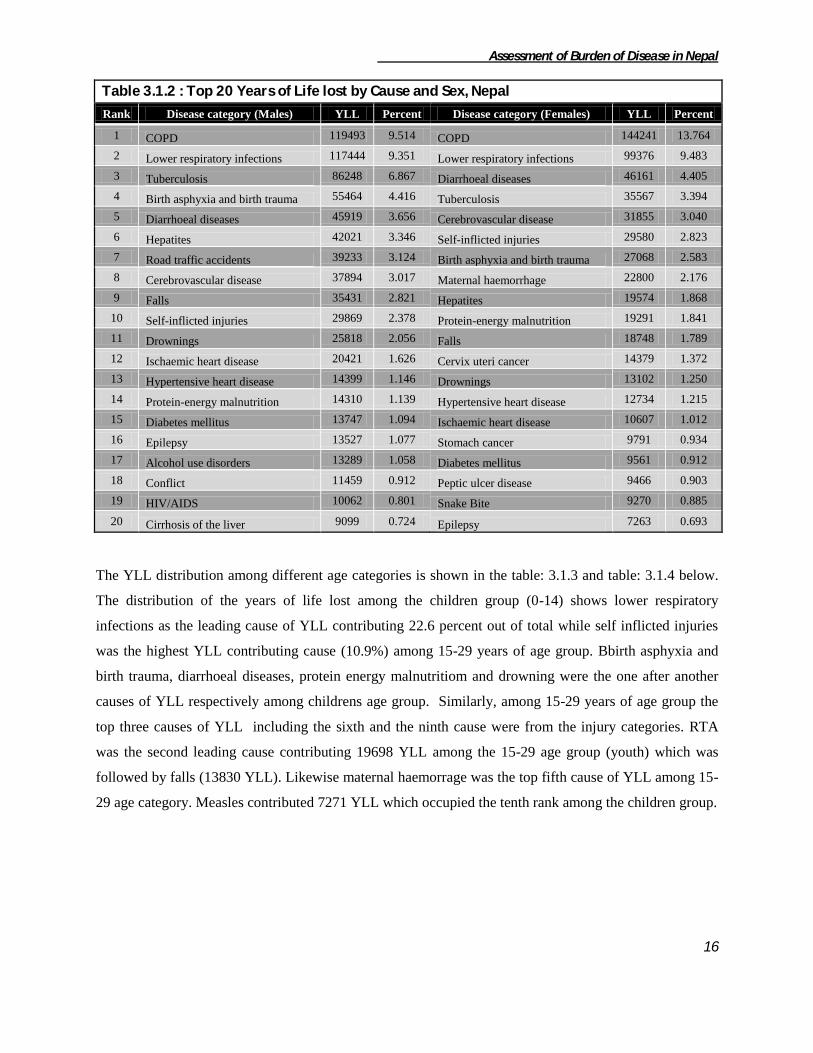
Assessment of Burden of Disease in Nepal
16
Table 3.1.2 : Top 20 Years of Life lost by Cause and Sex, Nepal
Rank Disease category (Males) YLL Percent Disease category (Females) YLL Percent
1 COPD 119493 9.514 COPD 144241 13.764
2 Lower respiratory infections 117444 9.351 Lower respiratory infections 99376 9.483
3 Tuberculosis 86248 6.867 Diarrhoeal diseases 46161 4.405
4 Birth asphyxia and birth trauma 55464 4.416 Tuberculosis 35567 3.394
5 Diarrhoeal diseases 45919 3.656 Cerebrovascular disease 31855 3.040
6 Hepatites 42021 3.346 Self-inflicted injuries 29580 2.823
7 Road traffic accidents 39233 3.124 Birth asphyxia and birth trauma 27068 2.583
8 Cerebrovascular disease 37894 3.017 Maternal haemorrhage 22800 2.176
9 Falls 35431 2.821 Hepatites 19574 1.868
10 Self-inflicted injuries 29869 2.378 Protein-energy malnutrition 19291 1.841
11 Drownings 25818 2.056 Falls 18748 1.789
12 Ischaemic heart disease 20421 1.626 Cervix uteri cancer 14379 1.372
13 Hypertensive heart disease 14399 1.146 Drownings 13102 1.250
14 Protein-energy malnutrition 14310 1.139 Hypertensive heart disease 12734 1.215
15 Diabetes mellitus 13747 1.094 Ischaemic heart disease 10607 1.012
16 Epilepsy 13527 1.077 Stomach cancer 9791 0.934
17 Alcohol use disorders 13289 1.058 Diabetes mellitus 9561 0.912
18 Conflict 11459 0.912 Peptic ulcer disease 9466 0.903
19 HIV/AIDS 10062 0.801 Snake Bite 9270 0.885
20 Cirrhosis of the liver 9099 0.724 Epilepsy 7263 0.693
The YLL distribution among different age categories is shown in the table: 3.1.3 and table: 3.1.4 below.
The distribution of the years of life lost among the children group (0-14) shows lower respiratory
infections as the leading cause of YLL contributing 22.6 percent out of total while self inflicted injuries
was the highest YLL contributing cause (10.9%) among 15-29 years of age group. Bbirth asphyxia and
birth trauma, diarrhoeal diseases, protein energy malnutritiom and drowning were the one after another
causes of YLL respectively among childrens age group. Similarly, among 15-29 years of age group the
top three causes of YLL including the sixth and the ninth cause were from the injury categories. RTA
was the second leading cause contributing 19698 YLL among the 15-29 age group (youth) which was
followed by falls (13830 YLL). Likewise maternal haemorrage was the top fifth cause of YLL among 15-
29 age category. Measles contributed 7271 YLL which occupied the tenth rank among the children group.

Assessment of Burden of Disease in Nepal
17
Table 3.1.3: Top 10 Years of life lost in 0-14 and 15-29 years of age group, Nepal
Rank Disease category (0-14) YLL Percent Disease category(15-29) YLL Percent
1 Lower respiratory infections 206013 22.677 Self-inflicted injuries 26018 10.935
2 Birth asphyxia and birth trauma 82532 9.085 Road traffic accidents 19698 8.279
3 Diarrhoeal diseases 59583 6.558 Falls 13830 5.813
4 Protein-energy malnutrition 33095 3.643 Hepatites 11923 5.011
5 Drownings 24306 2.675 Maternal haemorrhage 11355 4.772
6 Low birth weight 14265 1.570 Conflict 9951 4.183
7 Hepatites 12337 1.358 Tuberculosis 8946 3.760
8 Falls 12049 1.326 Epilepsy 7527 3.164
9 Snake Bite 11775 1.296 Drownings 6218 2.613
10 Measles 7271 0.800 Cerebrovascular disease 6119 2.572
Likewise, COPD and tuberculosis were observed as the top two causes of YLL among both 30-59 and the
elderly (60+) age groups. The percentage distribution shows COPD to contribute three times more YLL
among elderly age group than in 30-59 age group. Self inflicted injuries were on the third rank among 30-
59 years of age group. In the elderly age group YLL due to diarrhoeal diseases was observed in the fourth
position contributing 17345 YLL. Non-communicable diseases like cardiovascular diseases were also
observed as cause of YLL among elderly. Diabetes mellitus was observed in the tenth rank among both
the age groups.
Table 3.1.4: Top 10 Years of life lost in 30-59 and 60+ years of age group
Rank Disease category (30-59) YLL Percent Disease category (60+) YLL Percent
1 COPD 64321 11.157 COPD 194181 33.419
2 Tuberculosis 61587 10.683 Tuberculosis 45087 7.760
3 Self-inflicted injuries 28600 4.961 Cerebrovascular disease 41126 7.078
4 Hepatites 27809 4.824 Diarrhoeal diseases 17345 2.985
5 Cerebrovascular disease 21194 3.676 Hypertensive heart disease 14659 2.523
6 Road traffic accidents 18078 3.136 Ischaemic heart disease 13990 2.408
7 Falls 17669 3.065 Falls 10631 1.830
8 Ischaemic heart disease 14615 2.535 Hepatites 9525 1.639
9 Hypertensive heart disease 12210 2.118 Stomach cancer 7415 1.276
10 Diabetes mellitus 11908 2.066 Diabetes mellitus 7353 1.265

Assessment of Burden of Disease in Nepal
18
3.2 Broad Group wise YLL
Three broad categories of diseases given in GBD were used in to classify years of life lost due to
premature mortality. As the causes of deaths are ascertained through verbal autopsy, there were
some unidentified cases which are also categorized as a broad group.
Table 3.2.1: YLL distribution of broad disease categories
Background Characteristics
GROUP
Total Total YLL I II III IV
Development Region
Eastern 38.2 41.0 14.3 6.5 100 451178
Central 44.9 38.0 10.3 6.8 100 598694
Western 46.8 35.0 10.6 7.6 100 549450
Mid-western 45.1 34.8 15.4 4.6 100 423719
Far-western 56.6 27.8 9.7 5.9 100 280922
Ecological Region
Mountain 48.8 32.5 14.8 4.0 100 281914
Hill 42.0 39.1 13.4 5.5 100 842251
Terai 47.2 34.7 10.4 7.7 100 1179799
National 45.5 36.1 12.0 6.4 100 2303963
Note:
Group I Communicable, maternal, perinatal and nutritional conditions
Group II Non-communicable diseases
Group III Injuries
Group IV Unidentified
The YLL burden was estimated to be highest (45%) in communicable, maternal, perinatal and
nutritional conditions followed by non-communicable diseases (36%) and injuries (12%) in total.
Similar pattern was observed in broad group wise distribution among development and
ecological region except in case of eastern region where group II was the highest contributor
(41%) of total mortality burden rather than group I (38%). Similarly, about 6% of YLL was
attributed to group IV (unidentified).
3.3 Group I: Communicable, Maternal, Perinatal and Nutritional Diseases Total YLL due to group I category was estimated to be more than 1 million years responsible for
45 percent of total YLL. Total YLL distribution in males was 563,044 (54%) and that in female
was 485,805 (46%). YLL distribution of group I category also shows highest burden in Central

Assessment of Burden of Disease in Nepal
19
(28%) and Terai region (53%) similar to total YLL distribution. Table 3.3.1 shows the YLL
distribution due to the major sub groups in Group I. Infectious and parasitic diseases were
observed to be the leading causes of mortality constituting 42 percent of total YLL followed by
conditions arising during the neonatal period which constitutes 28 percent of total YLL due to group I
category. Least YLL contribution was observed to be of nutritional deficiencies.
,
Likewise, cause specific distribution of YLL of development regions is similar to that of national except
in case of Far western development region where YLL due to nutritional deficiencies (5.6%) exceeds that
due to maternal conditions (4%). Likewise, disease specific YLL distribution of ecological regions also
shows similar pattern as that of national except in case of Mountain region in which Respiratory Infection
is second leading cause of YLL (29.7%) rather than neonatal conditions (23%).
Table 3.3.1. YLL distribution of communicable, maternal, perinatal and nutritional diseases
Disease Categories
Development Region Eco-Region
National E C W MW FW M H T
Infectious and
parasitic diseases 36.9 45.5 42.9 45.1 34.9 34.2 44.8 41.7 41.8
Respiratory infection 27.9 18.0 16.7 22.9 24.3 29.7 20.0 19.7 21.1
Maternal conditions 5.7 6.8 6.5 5.3 4.0 5.5 7.2 5.1 5.8
Conditions arising
during the neonatal
period 27.1 26.8 30.6 23.0 31.3 23.3 24.5 30.9 27.8
Nutritional
deficiencies 2.4 2.9 3.3 3.7 5.6 7.3 3.4 2.5 3.5
Total 100 100 100 100 100 100 100 100 100
Total YLL 1723
75 268988 257294 191308 158885 137511 354130 557209 1048850
Note: E Eastern Developmental Region
C Central
W Western
MW Mid-Western
FW Far Western
0.0 10.0 20.0 30.0 40.0 50.0 60.0
East
ern
Cen
tral
Wes
tern
Mid
-wes
tern
Far-
wes
tern
Mo
un
tain
Hill
Tera
i
Dev-region Eco-region
16.4 25.6 24.5 18.2 15.1 13.1 33.8
53.1
M Mountain
H Hill
T Terai
Figure 3.3.1 Region wise distribution of total YLL due Group I category

Assessment of Burden of Disease in Nepal
20
Lower respiratory infections (LRI) were the major cause contributing one fifth percentage of total YLL
among group I category. Tuberculosis followed LRI contributing 11.6 percentage of total YLL in this
group. Diarrhoeal diseases were ranked at third position accounting 8.7 percent. Likewise HIV/AIDS
was observed to hold ninth position among the group I category. Maternal haemorrhage (2.1%),
obstructed labour (0.5%), hypertensive disorders of pregnancy (0.5%) and maternal sepsis (0.2%) causes
of maternal deaths was observed in the seventh, fifteenth, sixteenth and nineteenth position among the top
20 causes of YLL in group I.
Table 3.3.2: Top 20 causes of YLL due to Communicable, maternal, perinatal and
nutritional diseases
Rank Disease category YLL Percent
1 Lower respiratory infections 216819 20.672
2 Tuberculosis 121815 11.614
3 Diarrhoeal diseases 92080 8.779
4 Birth asphyxia and birth trauma 82532 7.869
5 Hepatites 61594 5.873
6 Protein-energy malnutrition 33602 3.204
7 Maternal haemorrhage 22800 2.174
8 Low birth weight 14265 1.360
9 HIV/AIDS 13056 1.245
10 Meningitis 10480 0.999
11 Tetanus 8187 0.781
12 Measles 7391 0.705
13 Leishmaniasis 6712 0.640
14 Japanese encephalitis 6337 0.604
15 Obstructed labour 5466 0.521
16 Hypertensive disorders of pregnancy 5275 0.503
17 Upper respiratory infections 4299 0.410
18 Leprosy 3587 0.342
19 Maternal sepsis 2847 0.271
20 Rabies 2512 0.240
I-A Infectious and Parasitic Diseases
Many developing countries like Nepal are still suffering from the burden of communicable
diseases. Communicable diseases like infectious and parasitic diseases could be prevented by
small medical and educational effort but unfortunately, these diseases solely contributed more
than four hundred thousand years of life lost which was 42 percent of total premature mortality
in Group I category. Region wise distribution showed that Central region was the highest
contributor (28%) of total YLL due to infectious and parasitic diseases followed by western
(25%). Likewise, among the ecological regions, Terai region was responsible for maximum YLL
(53%) followed by Hill (36%) and Mountain (11%).
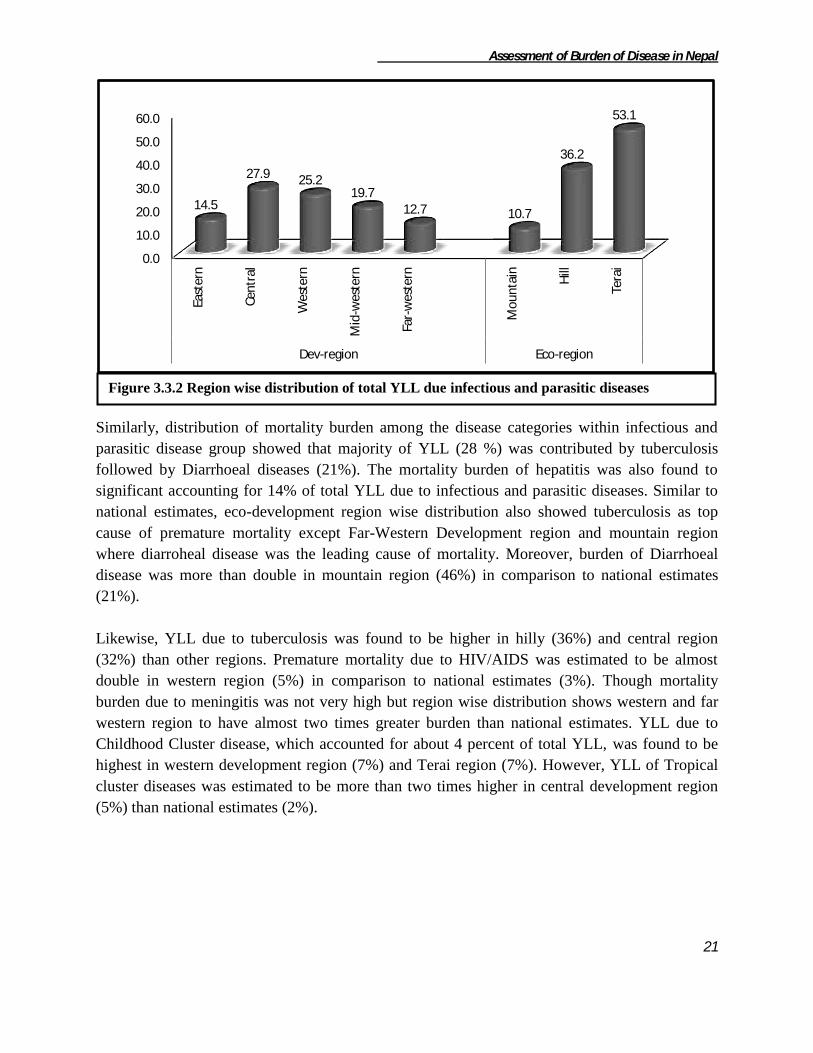
Assessment of Burden of Disease in Nepal
21
Similarly, distribution of mortality burden among the disease categories within infectious and
parasitic disease group showed that majority of YLL (28 %) was contributed by tuberculosis
followed by Diarrhoeal diseases (21%). The mortality burden of hepatitis was also found to
significant accounting for 14% of total YLL due to infectious and parasitic diseases. Similar to
national estimates, eco-development region wise distribution also showed tuberculosis as top
cause of premature mortality except Far-Western Development region and mountain region
where diarroheal disease was the leading cause of mortality. Moreover, burden of Diarrhoeal
disease was more than double in mountain region (46%) in comparison to national estimates
(21%).
Likewise, YLL due to tuberculosis was found to be higher in hilly (36%) and central region
(32%) than other regions. Premature mortality due to HIV/AIDS was estimated to be almost
double in western region (5%) in comparison to national estimates (3%). Though mortality
burden due to meningitis was not very high but region wise distribution shows western and far
western region to have almost two times greater burden than national estimates. YLL due to
Childhood Cluster disease, which accounted for about 4 percent of total YLL, was found to be
highest in western development region (7%) and Terai region (7%). However, YLL of Tropical
cluster diseases was estimated to be more than two times higher in central development region
(5%) than national estimates (2%).
0.0
10.0
20.0
30.0
40.0
50.0
60.0
East
ern
Cen
tral
Wes
tern
Mid
-wes
tern
Far-
wes
tern
Mo
un
tain
Hill
Tera
i
Dev-region Eco-region
14.5
27.9 25.2 19.7
12.7 10.7
36.2
53.1
Figure 3.3.2 Region wise distribution of total YLL due infectious and parasitic diseases
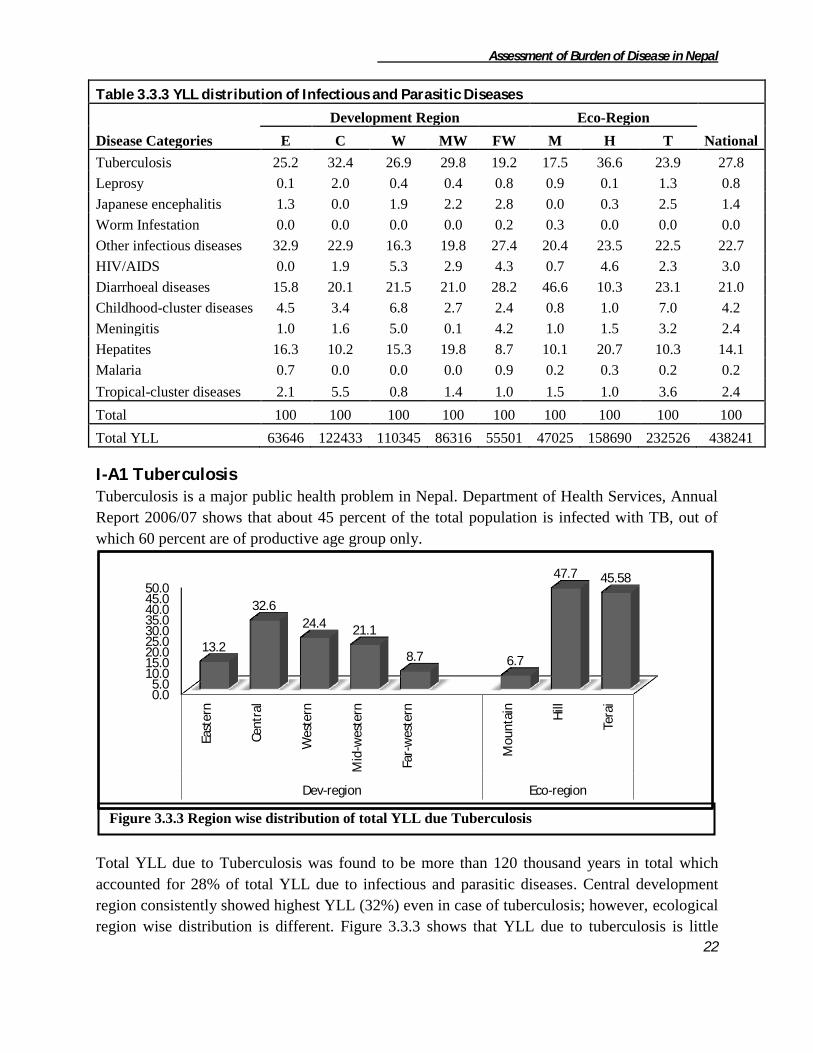
Assessment of Burden of Disease in Nepal
22
Table 3.3.3 YLL distribution of Infectious and Parasitic Diseases
Disease Categories
Development Region Eco-Region
National E C W MW FW M H T
Tuberculosis 25.2 32.4 26.9 29.8 19.2 17.5 36.6 23.9 27.8
Leprosy 0.1 2.0 0.4 0.4 0.8 0.9 0.1 1.3 0.8
Japanese encephalitis 1.3 0.0 1.9 2.2 2.8 0.0 0.3 2.5 1.4
Worm Infestation 0.0 0.0 0.0 0.0 0.2 0.3 0.0 0.0 0.0
Other infectious diseases 32.9 22.9 16.3 19.8 27.4 20.4 23.5 22.5 22.7
HIV/AIDS 0.0 1.9 5.3 2.9 4.3 0.7 4.6 2.3 3.0
Diarrhoeal diseases 15.8 20.1 21.5 21.0 28.2 46.6 10.3 23.1 21.0
Childhood-cluster diseases 4.5 3.4 6.8 2.7 2.4 0.8 1.0 7.0 4.2
Meningitis 1.0 1.6 5.0 0.1 4.2 1.0 1.5 3.2 2.4
Hepatites 16.3 10.2 15.3 19.8 8.7 10.1 20.7 10.3 14.1
Malaria 0.7 0.0 0.0 0.0 0.9 0.2 0.3 0.2 0.2
Tropical-cluster diseases 2.1 5.5 0.8 1.4 1.0 1.5 1.0 3.6 2.4
Total 100 100 100 100 100 100 100 100 100
Total YLL 63646 122433 110345 86316 55501 47025 158690 232526 438241
I-A1 Tuberculosis Tuberculosis is a major public health problem in Nepal. Department of Health Services, Annual
Report 2006/07 shows that about 45 percent of the total population is infected with TB, out of
which 60 percent are of productive age group only.
Total YLL due to Tuberculosis was found to be more than 120 thousand years in total which
accounted for 28% of total YLL due to infectious and parasitic diseases. Central development
region consistently showed highest YLL (32%) even in case of tuberculosis; however, ecological
region wise distribution is different. Figure 3.3.3 shows that YLL due to tuberculosis is little
0.0 5.0
10.0 15.0 20.0 25.0 30.0 35.0 40.0 45.0 50.0
East
ern
Cen
tral
Wes
tern
Mid
-wes
tern
Far-
wes
tern
Mo
un
tain
Hill
Tera
i
Dev-region Eco-region
13.2
32.6
24.4 21.1
8.7 6.7
47.7 45.58
Figure 3.3.3 Region wise distribution of total YLL due Tuberculosis

Assessment of Burden of Disease in Nepal
23
higher (48%) in hilly region than in Terai (45%) unlike total YLL distribution in which Terai
region had highest YLL.
Table 3.3.4 YLL distribution of Tuberculosis
Background Characteristics
Age Group
Total YLL 0-14 15-29 30-59 60+
Development Region
Eastern
Male 0.0 9.2 55.2 35.5 100 12686
Female 19.4 4.5 23.0 53.1 100 3383
Total 4.1 8.3 48.4 39.2 100 16069
Central
Male 0.8 0.0 62.6 36.6 100 21866
Female 7.0 6.7 60.6 25.7 100 17835
Total 3.6 3.0 61.7 31.7 100 39701
Western
Male 5.0 8.3 44.3 42.3 100 22694
Female 11.1 21.6 25.3 42.0 100 6988
Total 6.5 11.4 39.9 42.2 100 29682
Mid-Western
Male 4.9 6.2 47.8 41.2 100 21387
Female 21.0 2.8 14.5 61.7 100 4321
Total 7.6 5.6 42.2 44.6 100 25708
Far-Western
Male 1.6 12.1 67.0 19.3 100 7613
Female 4.1 21.5 50.4 24.0 100 3040
Total 2.3 14.8 62.2 20.6 100 10655
Ecological Region
Mountain
Male 4.7 10.9 57.4 27.0 100 6341
Female 16.1 33.1 33.5 17.4 100 1871
Total 7.3 16.0 51.9 24.8 100 8212
Hill
Male 3.4 5.1 51.2 40.3 100 45687
Female 12.6 10.4 30.2 46.9 100 12400
Total 5.4 6.3 46.7 41.7 100 58085
Terai
Male 1.8 6.6 55.7 35.8 100 34222
Female 8.7 8.1 52.3 30.9 100 21296
Total 4.5 7.2 54.4 33.9 100 55518
National
Male 2.9 6.2 53.4 37.5 100 86248
Female 10.4 10.2 43.6 35.7 100 35567
Total 5.1 7.3 50.6 37.0 100 121815
Likewise, Table 3.3.4 shows that about 58 % of total YLL due to tuberculosis is estimated to be
in productive age group (15-59). Age wise distribution in region is similar to that of national
except in case of western and mid-western development region where burden above 60 years age
group is higher than in productive age group. Age wise distribution in ecological region is also
same like that of national estimates. Sex wise distribution of national YLL shows almost three

Assessment of Burden of Disease in Nepal
24
times higher YLL in male than in female. There is a vast difference in sex wise distribution
among the regions. Mid-Western region has the highest difference i.e. 5 times higher YLL in
male than in females whereas Central region has the minimum sex wise difference. Sex wise
distribution in remaining regions is 3-4 times higher YLL in males than in females.
I-A3 Human Immunodeficiency Virus (HIV) HIV epidemic in Nepal has evolved from low prevalence to concentrated epidemic. HIV
infection accounted for more than 13 thousand years of life lost responsible for 3 percent of total
years of life lost due to infectious and parasitic diseases. Figure 3.3.5 shows that central region,
which has been the highest contributor of total YLL, shared least percentage (18%) of total YLL
due to HIV. Instead of central region, western region has the highest (45%) YLL due to HIV
followed by Mid and Far Western region. Similarly, ecological distribution of YLL is similar
that of TB showing maximum percent in Hilly region (56%) followed by Terai (41%).
According to the age and sex wise distribution of years of life lost, YLL was observed high
(76%) among 30-59 age group and males were estimated to have almost three times higher
burden of premature mortality due to HIV than females. Similar pattern of high burden of
mortality is reported in age group 30-59 in all regions. Particularly in central development
region, total mortality was observed only in age group 30-59 in both sexes. Sex wise distribution
in ecological regions showed similar pattern of 3 times higher burden in males than in females;
however, the sex wise YLL distribution in development regions was much higher than national.
Highest difference was observed in mid-western region (18 times) followed by western (7 times)
while in central region the difference was negligible.
Table 3.3.5. YLL distribution of HIV/AIDS
Background Characteristics
Age Group
Total YLL 0-14 15-29 30-59 60+
0
10
20
30
40
50
60
East
ern
Cen
tral
Wes
tern
Mid
-wes
tern
Far-
wes
tern
Mo
un
tain
Hill
Tera
i Dev-region Eco-region
0
17.9
44.6
19.3 18.2
2.5
56.5
41.0
Figure 3.3.4 Region wise distribution of total YLL due HIV

Assessment of Burden of Disease in Nepal
25
Development region
Central
Male 0.0 0.0 100.0 0.0 100.0 767
Female 0.0 0.0 100.0 0.0 100.0 1565
Total 0.0 0.0 100.0 0.0 100.0 2332
Western
Male 0.0 20.4 79.6 0.0 100.0 5123
Female 0.0 52.4 47.6 0.0 100.0 696
Total 0.0 24.2 75.8 0.0 100.0 5819
Mid-Western
Male 5.4 5.1 86.6 2.9 100.0 2393
Female 100.0 0.0 0.0 0.0 100.0 130
Total 10.3 4.8 82.2 2.7 100.0 2523
Far-Western
Male 0.0 35.9 53.4 10.7 100.0 1778
Female 35.7 36.2 28.2 0.0 100.0 603
Total 9.0 36.0 47.0 8.0 100.0 2381
Ecological Region
Mountain
Male 0.0 0.0 79.6 20.4 100.0 329
Female 0.0 0.0 0.0 0.0 0.0 0
Total 0.0 0.0 79.6 20.4 100.0 329
Hill
Male 0.0 7.9 89.9 2.2 100.0 5589
Female 0.0 12.2 87.8 0.0 100.0 1783
Total 0.0 9.0 89.4 1.7 100.0 7372
Terai
Male 3.1 32.9 62.3 1.7 100.0 4144
Female 28.4 30.2 41.4 0.0 100.0 1210
Total 8.9 32.3 57.6 1.3 100.0 5354
National
Male 1.3 17.9 78.2 2.6 100.0 10062
Female 11.5 19.5 69.0 0.0 100.0 2993
Total 3.6 18.3 76.1 2.0 100.0 13055
I-A4 Diarrhoeal Diseases Diarrhoeal disease is one of the major killer diseases of under five years children, however, it is
not only limited to the specific age group. Diarrhoeal disease provokes epidemic regularly taking
life of hundreds of people. Diarrhoeal disease is responsible for almost a million years of life lost
in Nepal. According to Table 3.3.5, major burden of premature mortality due to diarrhoeal
disease (65%) was seen in 0-14 age group followed by age group 60+. Age wise distribution
among the regions was almost similar to that of national distribution, showing highest burden in
0-14 age group. Likewise, both sexes have almost similar burden at national level while
development region wise distribution shows higher burden in females in mid-western and far-
western development region and just opposite in remaining regions. Ecologically, females have
higher burden of Diarrohea in Hilly region only.
Table 3.3.6. YLL distribution of Diarrhoeal diseases

Assessment of Burden of Disease in Nepal
26
Region wise percentage distribution of Diarrhoea showed highest burden (27%) in central region
and lowest in Eastern region (11%). Similarly, Terai region had highest (58%) and hill region
had lowest (18%) burden of the disease.
Background Characteristics
Age Group
Total YLL 0-14 15-29 30-59 60+
Development region
Eastern
Male 71.6 11.5 5.1 11.8 100 5849
Female 49.5 0.0 21.4 29.1 100 4204
Total 62.4 6.7 11.9 19.0 100 10053
Central
Male 45.2 8.2 17.9 28.7 100 12586
Female 50.5 7.1 17.4 25.0 100 11984
Total 47.8 7.7 17.6 26.9 100 24573
Western
Male 70.7 6.0 4.5 18.8 100 12494
Female 69.0 3.4 9.8 17.8 100 11181
Total 69.9 4.8 7.0 18.3 100 23675
Mid-Western
Male 82.9 0.0 4.0 13.1 100 7986
Female 74.6 0.0 11.4 14.0 100 10127
Total 78.3 0.0 8.2 13.6 100 18113
Far-Western
Male 67.2 6.5 15.3 11.0 100 7005
Female 71.0 2.3 12.2 14.5 100 8663
Total 69.3 4.2 13.6 12.9 100 15668
Ecological Region
Mountain
Male 88.2 1.3 2.9 7.6 100 9228
Female 78.1
11.8 10.1 100 12708
Total 82.3 0.5 8.1 9.1 100 21936
Hill
Male 54.8 2.8 22.3 20.0 100 8201
Female 48.2 10.5 8.5 32.8 100 8114
Total 51.5 6.6 15.4 26.4 100 16317
Terai
Male 61.1 9.0 8.4 21.5 100 28490
Female 62.0 2.3 16.2 19.4 100 25339
Total 61.5 5.8 12.1 20.5 100 53829
National
Male 65.4 6.3 9.8 18.4 100 45920
Female 64.0 3.1 13.7 19.2 100 46162
Total 64.7 4.7 11.7 18.8 100 92082

Assessment of Burden of Disease in Nepal
27
I-A5 Childhood cluster diseases According to the GBD 2000 cause categories, childhood cluster disease includes five major
diseases viz Pertusis, Poliomyelitis, Diptheria, Mealses and Tetanus. The study captured all the
diseases except Pertusis. Total YLL due to childhood cluster diseases was estimated to be 18
thousand years which was responsible for 4% of total YLL due to infectious and parasitic
diseases.
Burden of this category of disease was found to be highest (41%) in western region and lowest
(7%) in Far-western region. Likewise, burden was highest in Terai region (89%). The
contributions of mountain and hill region were only 2% and 8.5% respectively.
Disease specific YLL distribution shows that Tetanus has the highest contribution (45%) in the
total YLL due to Childhood cluster diseases followed by Measles (41%) and Acute Flaccid
Paralysis (14%). Likewise, development region wise distribution shows the similar distribution
0.0 10.0 20.0 30.0 40.0 50.0 60.0
East
ern
Cen
tral
Wes
tern
Mid
-wes
tern
Far-
wes
tern
Mo
un
tain
Hill
Tera
i
Dev-region Eco-region
10.9
26.7 25.7 19.7 17.0
23.8 17.7
58.5
0.0 10.0 20.0 30.0 40.0 50.0 60.0 70.0 80.0 90.0
East
ern
Cen
tral
Wes
tern
Mid
-wes
tern
Far-
wes
tern
Mo
un
tain
Hill
Tera
i
Dev-region Eco-region
15.8 23.1
40.9
12.9 7.2 2.1 8.5
89.4
Figure 3.3.5 Region wise distribution of total YLL due Diarrhoeal Diseases
Figure 3.3.6 Region wise distribution of total YLL due to Childhood Cluster Diseases
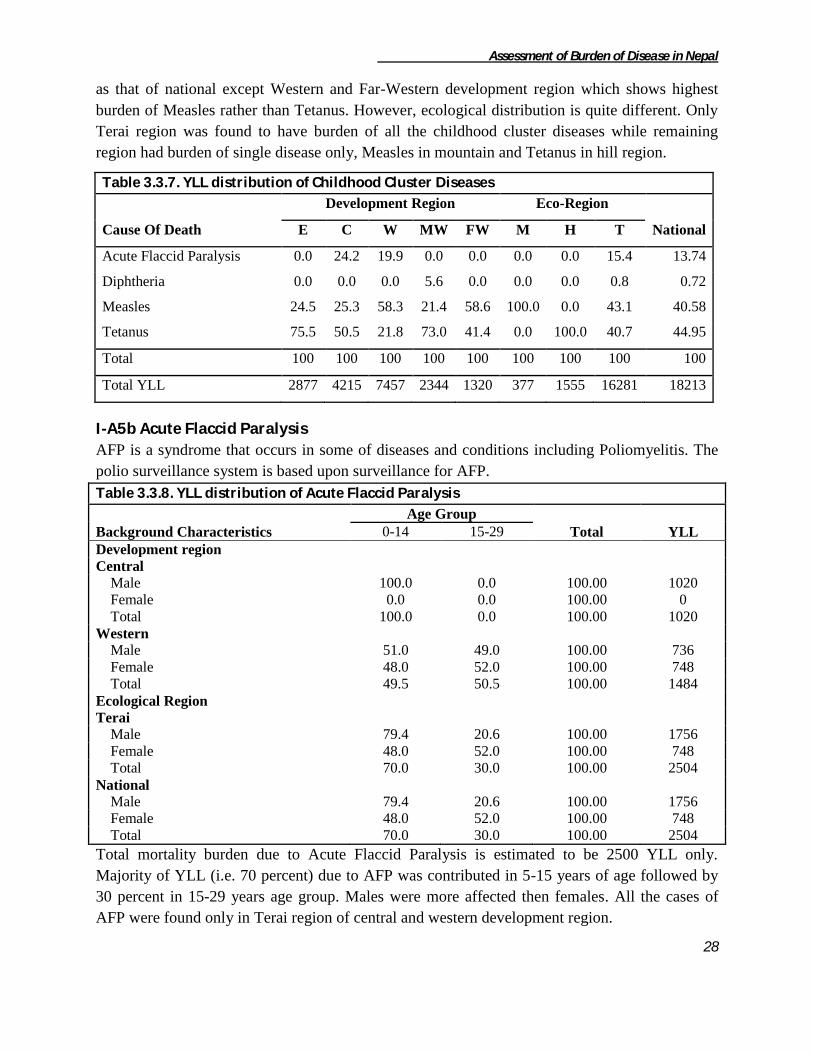
Assessment of Burden of Disease in Nepal
28
as that of national except Western and Far-Western development region which shows highest
burden of Measles rather than Tetanus. However, ecological distribution is quite different. Only
Terai region was found to have burden of all the childhood cluster diseases while remaining
region had burden of single disease only, Measles in mountain and Tetanus in hill region.
Table 3.3.7. YLL distribution of Childhood Cluster Diseases
Cause Of Death
Development Region Eco-Region
National E C W MW FW M H T
Acute Flaccid Paralysis 0.0 24.2 19.9 0.0 0.0 0.0 0.0 15.4 13.74
Diphtheria 0.0 0.0 0.0 5.6 0.0 0.0 0.0 0.8 0.72
Measles 24.5 25.3 58.3 21.4 58.6 100.0 0.0 43.1 40.58
Tetanus 75.5 50.5 21.8 73.0 41.4 0.0 100.0 40.7 44.95
Total 100 100 100 100 100 100 100 100 100
Total YLL 2877 4215 7457 2344 1320 377 1555 16281 18213
I-A5b Acute Flaccid Paralysis
AFP is a syndrome that occurs in some of diseases and conditions including Poliomyelitis. The
polio surveillance system is based upon surveillance for AFP.
Table 3.3.8. YLL distribution of Acute Flaccid Paralysis
Background Characteristics
Age Group
Total YLL 0-14 15-29
Development region
Central
Male 100.0 0.0 100.00 1020
Female 0.0 0.0 100.00 0
Total 100.0 0.0 100.00 1020
Western
Male 51.0 49.0 100.00 736
Female 48.0 52.0 100.00 748
Total 49.5 50.5 100.00 1484
Ecological Region
Terai
Male 79.4 20.6 100.00 1756
Female 48.0 52.0 100.00 748
Total 70.0 30.0 100.00 2504
National
Male 79.4 20.6 100.00 1756
Female 48.0 52.0 100.00 748
Total 70.0 30.0 100.00 2504
Total mortality burden due to Acute Flaccid Paralysis is estimated to be 2500 YLL only.
Majority of YLL (i.e. 70 percent) due to AFP was contributed in 5-15 years of age followed by
30 percent in 15-29 years age group. Males were more affected then females. All the cases of
AFP were found only in Terai region of central and western development region.

Assessment of Burden of Disease in Nepal
29
I-A5c Diphtheria
Total Years of Life Lost due to diphtheria is only 132 years. Total burden due to diphtheria
recorded in the study was found in female of 0-14 age group of mid-western Terai.
I-A5d Measles Targeted vaccination campaigns have had a major impact on reducing measles deaths, yet it
remains one of the leading causes of death among young children globally. Total mortality
burden of measles is estimated to be about 7300 YLL responsible for 41 percent of total YLL
due to Childhood cluster diseases. Burden of Measles was estimated to be very high in western
region (59%) in comparison to other development regions where the percentage share was in the
range of 6% to 15%. Similarly, most of the burden of measles (95%) was in Terai region and
remaining 5 percent burden was in mountain. No mortality due to measles was found in hill
region.
Likewise, Age wise distribution of total YLL shows that about 98 percent of burden was
observed in 0-14 age group and remaining in age group 15-29. Only Mid-Western and Terai
region had some burden in age group 15-29 while total burden in remaining regions was in only
0-14 age group. Burden of measles was found to be equally distributed among both sexes not
only in national estimates but also in all regions except Mid and Far Western development region
where males had almost three times higher burden than females.
0.0 10.0 20.0 30.0 40.0 50.0 60.0 70.0 80.0 90.0
100.0
East
ern
Cen
tral
Wes
tern
Mid
-wes
tern
Far-
wes
tern
Mo
un
tain
Hill
Tera
i Dev-region Eco-region
9.5 14.4
58.8
6.8 10.5 5.1 0.0
94.9
Figure 3.3.8 Region wise distribution of total YLL due to Measles

Assessment of Burden of Disease in Nepal
30
Table 3.3.9. YLL distribution of Measles
Background Characteristics
Age Group
Total YLL 0-14 15-29
Development region
Eastern
Male 100.0 0.0 100 354
Female 100.0 0.0 100 350
Total 100.0 0.0 100 704
Central
Male 100.0 0.0 100 1065
Female 0.0 0.0 100 0
Total 100.0 0.0 100 1065
Western
Male 100.0 0.0 100 1456
Female 100.0 0.0 100 2891
Total 100.0 0.0 100 4347
Mid-Western
Male 100.0 0.0 100 381
Female 0.0 100.0 100 120
Total 76.0 24.0 100 501
Far-Western
Male 100.0 0.0 100 559
Female 100.0 0.0 100 215
Total 100.0 0.0 100 774
Ecological Region
Mountain
Male 100.0 0.0 100 377
Female 0.0 0.0 100 0
Total 100.0 0.0 100 377
Terai
Male 100.0 0.0 100 3438
Female 96.6 3.4 100 3576
Total 98.3 1.7 100 7014
National
Male 100.0 0.0 100 3815
Female 96.6 3.4 100 3576
Total 98.4 1.6 100 7391
I-A5e Tetanus Tetanus is an infectious disease caused by contamination of wounds from its causative bacteria
that live in the soil. Difficulties of diagnosis and management of Tetanus in the resource-
challenged health care setting of developing countries like Nepal is a major reason behind its
high burden. Tetanus is the leading cause of YLL due to childhood cluster diseases accounting
for 81 thousand years of life lost which is 45 percent of total mortality burden due to childhood
cluster disease.
According to age wise distribution, age group 0-14 was estimated to have highest burden of
Tetanus in national level as well as regional level except in hilly region where burden was

Assessment of Burden of Disease in Nepal
31
highest in age group 30-59. Likewise, Males were found to be three times more affected by
Tetanus than females. Sex wise distribution of all development regions showed lower male
female ratio than national while that in ecological region was found to be similar in Terai (3
times) and higher (5 times) in Hill region.
Table 3.3.10. YLL distribution of Tetanus
Background Characteristics
Age Group
Total YLL 0-14 15-29 30-59 60+
Development region
Eastern
Male 96.1 0.0 0.0 3.9 100 1473
Female 100.0 0.0 0.0 0.0 100 701
Total 97.3 0.0 0.0 2.7 100 2174
Central
Male 100.0 0.0 0.0 0.0 100 2130
Total 100.0 0.0 0.0 0.0 100 2130
Western
Male 40.2 0.0 59.8 0.0 100 906
Female 100.0 0.0 0.0 0.0 100 721
Total 66.7 0.0 33.3 0.0 100 1627
Mid-Western
Male 57.6 8.2 34.3 0.0 100 1581
Female 100.0 0.0 0.0 0.0 100 130
Total 60.8 7.5 31.7 0.0 100 1711
Far-Western
Male 75.1 0.0 24.9 0.0 100 301
Female 100.0 0.0 0.0 0.0 100 246
Total 86.3 0.0 13.7 0.0 100 545
Ecological Region
Hill
Male 17.3 0.0 82.7 0.0 100 1310
Female 100.0 0.0 0.0 0.0 100 246
Total 30.3 0.0 69.7 0.0 100 1556
Terai
Male 94.8 2.5 1.5 1.1 100 5080
Female 100.0 0.0 0.0 0.0 100 1552
Total 96.0 1.9 1.1 0.9 100 6631
National
Male 78.9 2.0 18.1 0.9 100 6390
Female 100.0 0.0 0.0 0.0 100 1797
Total 83.6 1.6 14.2 0.7 100 8187
Not much difference was found in burden of Tetanus among the development regions. Eastern
and Central region had similar burden (26%) followed by Western and Mid-western region
(20%). Conversely, majority of burden was observed in Terai (81%) and remaining 19% in
Mountain. There was no any mortality recorded in hilly region.

Assessment of Burden of Disease in Nepal
32
I-A6 Meningitis Total contribution of Meningitis is about 2.3 percent in total mortality burden due to infectious
and parasitic diseases. Total mortality burden due to Meningitis was more than 10 thousand
YLL. Unlike region wise distribution of infectious and parasitic diseases, Meningitis had highest
burden in western region (53%) and lowest in Mid-western region. However, ecological region
wise distribution was almost similar to distribution of infectious and parasitic diseases with
majority of burden in Terai (72%) followed by Hill (23%) and Mountain (5%).
Burden of Meningitis was found to be highest (66%) in age group 0-14. Burden in males was
estimated to be two times higher than in females. There was no much difference in age wise
distribution in regions from the national distribution. Both Terai and Hill region had two times
higher burden in males than females while development regions had almost equal distribution of
0.0 10.0 20.0 30.0 40.0 50.0 60.0 70.0 80.0
East
ern
Cen
tral
Wes
tern
Mid
-wes
tern
Far-
wes
tern
Mo
un
tain
Hill
Tera
i
Dev-region Eco-region
5.9
18.5
52.9
0.4
22.3
4.7
23.3
72.1
Figure 3.3.9 Region wise distribution of total YLL due to Tetanus
Figure 3.3.10 Region wise distribution of total YLL due to Meningitis
0.0 20.0 40.0 60.0 80.0
100.0
East
ern
Cen
tral
Wes
tern
Mid
-wes
tern
Far-
wes
tern
Mo
un
tain
Hill
Tera
i
Dev-region Eco-region
26.6 26.0 19.9 20.9 6.7
19.0 0.0
81.0

Assessment of Burden of Disease in Nepal
33
burden among both sexes except in Western development region where burden in male was four
times higher than in female.
Table 3.3.11.YLL distribution of Meningitis
Background Characteristics
Age Group
Total YLL 0-14 15-29 30-59 60+
Development region
Eastern
Male 0.0 0.0 0.0 100.0 100 120
Female 68.7 0.0 0.0 31.3 100 502
Total 55.5 0.0 0.0 44.5 100 622
Central
Male 100.0 0.0 0.0 0.0 100 789
Female 91.3 0.0 0.0 8.7 100 1147
Total 94.8 0.0 0.0 5.2 100 1936
Western
Male 74.5 7.4 6.5 11.6 100 4400
Female 65.9 34.1 0.0 0.0 100 1141
Total 72.8 12.9 5.1 9.2 100 5541
Mid-Western
Male 0.0 0.0 0.0 100.0 100 48
Total 0.0 0.0 0.0 100.0 100 48
Far-Western
Male 9.7 0.0 80.6 9.7 100 1083
Female 53.1 17.9 13.8 15.2 100 1250
Total 33.0 9.6 44.8 12.6 100 2333
Ecological Region
Mountain
Male 0.0 0.0 0.0 100.0 100 187
Female 41.5 0.0 0.0 58.5 100 303
Total 25.6 0.0 0.0 74.4 100 490
Hill
Male 53.4 0.0 43.9 2.6 100 1477
Female 35.9 23.3 17.9 22.9 100 961
Total 46.5 9.2 33.7 10.6 100 2438
Terai
Male 70.9 6.8 10.6 11.7 100 4775
Female 84.2 14.0 0.0 1.8 100 2777
Total 75.8 9.5 6.7 8.0 100 7552
National
Male 64.8 5.0 18.0 12.2 100 6440
Female 69.5 15.2 4.3 11.0 100 4040
Total 66.6 9.0 12.7 11.7 100 10480
I-A7 Hepatitis Hepatitis is an inflammation of the liver, most commonly caused by a viral infection. Hepatitis is
the fourth largest contributor of mortality burden due to infectious and parasitic diseases
responsible for 14 % (61594 YLL) of total YLL. At national level, distribution of total YLL was
found to be two times more in males than in females. Likewise, burden was estimated to be
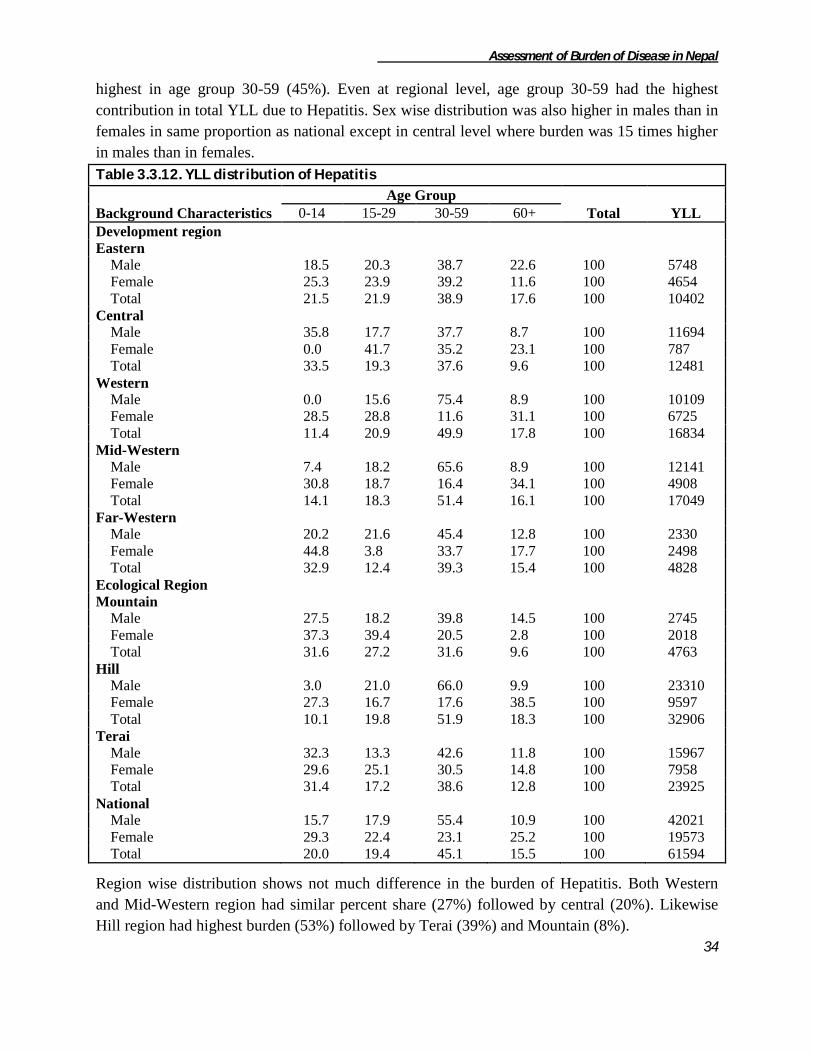
Assessment of Burden of Disease in Nepal
34
highest in age group 30-59 (45%). Even at regional level, age group 30-59 had the highest
contribution in total YLL due to Hepatitis. Sex wise distribution was also higher in males than in
females in same proportion as national except in central level where burden was 15 times higher
in males than in females.
Table 3.3.12. YLL distribution of Hepatitis
Background Characteristics
Age Group
Total YLL 0-14 15-29 30-59 60+
Development region
Eastern
Male 18.5 20.3 38.7 22.6 100 5748
Female 25.3 23.9 39.2 11.6 100 4654
Total 21.5 21.9 38.9 17.6 100 10402
Central
Male 35.8 17.7 37.7 8.7 100 11694
Female 0.0 41.7 35.2 23.1 100 787
Total 33.5 19.3 37.6 9.6 100 12481
Western
Male 0.0 15.6 75.4 8.9 100 10109
Female 28.5 28.8 11.6 31.1 100 6725
Total 11.4 20.9 49.9 17.8 100 16834
Mid-Western
Male 7.4 18.2 65.6 8.9 100 12141
Female 30.8 18.7 16.4 34.1 100 4908
Total 14.1 18.3 51.4 16.1 100 17049
Far-Western
Male 20.2 21.6 45.4 12.8 100 2330
Female 44.8 3.8 33.7 17.7 100 2498
Total 32.9 12.4 39.3 15.4 100 4828
Ecological Region
Mountain
Male 27.5 18.2 39.8 14.5 100 2745
Female 37.3 39.4 20.5 2.8 100 2018
Total 31.6 27.2 31.6 9.6 100 4763
Hill
Male 3.0 21.0 66.0 9.9 100 23310
Female 27.3 16.7 17.6 38.5 100 9597
Total 10.1 19.8 51.9 18.3 100 32906
Terai
Male 32.3 13.3 42.6 11.8 100 15967
Female 29.6 25.1 30.5 14.8 100 7958
Total 31.4 17.2 38.6 12.8 100 23925
National
Male 15.7 17.9 55.4 10.9 100 42021
Female 29.3 22.4 23.1 25.2 100 19573
Total 20.0 19.4 45.1 15.5 100 61594
Region wise distribution shows not much difference in the burden of Hepatitis. Both Western
and Mid-Western region had similar percent share (27%) followed by central (20%). Likewise
Hill region had highest burden (53%) followed by Terai (39%) and Mountain (8%).

Assessment of Burden of Disease in Nepal
35
I-A8 Malaria
Malaria is the most important parasitic infection endemic in 65 districts of Nepal. Since the
initiation of malaria control program in 1954, several control programs have been implemented
for the control of malaria. Total mortality burden shared by malaria among the total infectious
and parasitic disease was found to be very less accounting for about 1% of total YLL. The region
wise distribution of mortality burden due to malaria shows that Hill region comprises the highest
among the ecological region of the total figure (50.5%) followed by Terai (37.7%) and Mountain
(11.8%). However, mortality burden due to malaria was observed in Eastern and Far-western
development region only.
According to the table the total YLL lost due to malaria is 929 years. The mortality is found to be
more or less similiar between male and female group i.e. 469 and 460 years of life lost
respectively. Likwise, highest YLL was observed in above 60 age group(29%). Sex wise
distribution in Eastern region shows higher burden in males than females while Far-western
0.0 10.0 20.0 30.0 40.0 50.0 60.0
East
ern
Cen
tral
Wes
tern
Mid
-wes
tern
Far-
wes
tern
Mo
un
tain
Hill
Tera
i
Dev-region Eco-region
16.9 20.3 27.3 27.7
7.8 7.7
53.4
38.8
0.0
10.0
20.0
30.0
40.0
50.0
60.0
Mountain Hill Terai
11.8
50.5
37.7
Ecological Region
Figure 3.3.11 Region wise distribution of total YLL due to Hepatitis
Figure 3.3.12 Region wise distribution of total YLL due Malaria

Assessment of Burden of Disease in Nepal
36
region had just opposite distribution. All ecological regions had burden in single sex only; males
in hill region and females in Mountain and Terai region.
Table 3.3.13. YLL distribution of Malaria
Background Characteristics
Age Group
Total YLL 0-14 15-29 30-59 60+
Development region
Eastern
Male 0.0 100.0 0.0 0.0 100 244
Female 0.0 0.0 0.0 100.0 100 211
Total 0.0 53.6 0.0 46.3 100 455
Far-Western
Male 100.0 0.0 0.0 0.0 100 225
Female 0.0 0.0 76.3 23.6 100 249
Total 47.4 0.0 40.0 12.4 100 474
Ecological Region
Mountain
Female 0.0 0.0 100.0 0.0 100 110
Total 0.0 0.0 100.0 0.0 100 110
Hill
Male 47.9 52.0 0.0 0.0 100 469
Total 47.9 52.0 0.0 0.0 100 469
Terai
Female 0.0 0.0 22.8 77.1 100 350
Total 0.0 0.0 22.8 77.1 100 350
National
Male 47.9 52.0 0.0 0.0 100 469
Female 0.0 0.0 41.3 58.7 100 460
Total 24.2 26.2 20.4 29.0 100 929
I-A9 Tropical Cluster Disease It accounts for more than 2 percent of total YLL due to Infectious and Parasitic diseases.
Different diseases like Trypanosomiasis, Chagas disease, Schistosomiasis, Leismaniasis,
Lymphatic Filariasis and Onchocerciasis are kept under Tropical Cluster disease by GBD 2000.
The region wise distribution of mortality burden due to tropical cluster disease shows that
Central development region is the highest contributor (63.2%) of the total YLL whereas Far-
western development region comprises the lowest percentage of the total figure (5%). Similarly
distribution of ecological region, terai area accounts the highest mortality burden (78.9%) and
the lowest percentage was found in mountain region (6.6%).

Assessment of Burden of Disease in Nepal
37
Mortality due to only two of the diseases i.e. Leishmaniasis and Lymphatic Filariasis were only
observed in the study. Besides, mortality due to Rabies was also included in this category as
given in table 3.3.13. Leishmaniasis was found to the highest contributor accounting for 63
percent of total YLL due to Tropical Cluster disease followed by Rabies (24 %). Western and
Far-western development region had highest mortality burden due to Rabies while the remaining
regions had leishmaniasis like national estimates. However, mortality burden was quite different
in ecological region. Terai region had burden of the entire three disease category, highest due to
Leishmaniasis (63 %) while Mountain region had burden due to Lymphatic filariasis and Rabies
only. Entire burden of 1559 YLL in Hilly region was due to Rabies only.
Table 3.3.14. YLL distribution of Tropical Cluster Diseases
Cause Of Death Development Region Eco-Region
National E C W MW FW M H T
Leishmaniasis 52.2 88.5 0.0 3.8 0.0 0.0 0.0 79.6 62.8
Lymphatic filariasis 21.6 10.5 9.0 28.3 6.9 91.7 0.0 9.7 13.6
Rabies 26.0 0.8 91.0 67.8 93.0 8.2 100.0 10.6 23.5
Total 100 100 100 100 100 100 100 100 100
Total YLL 1307 6751 856 1236 532 700 1559 8425 10684
I-A9d Leismaniasis
Leishmaniasis is one of the major infectious diseases affecting the poorest regions of the world.
Leismaniasis is the leading cause of mortality due to Tropical cluster disease accounting for 63
percent of total YLL. The region wise distribution of mortality burden due to leishmaniasis
shows that Central region comprises the highest among the developmental region of the total
figure (89.1%) and the lowest percentage was found in Mid-western region (0.7%). Mortality
0.0 10.0 20.0 30.0 40.0 50.0 60.0 70.0 80.0
East
ern
Cen
tral
Wes
tern
Mid
-wes
tern
Far-
wes
tern
Mo
un
tain
Hill
Tera
i
Developmental Region Ecological Region
12.2
63.2
8.0 11.6 5.0 6.6
14.6
78.9
Figure 3.3.13 Region wise distribution of total YLL due to Tropical cluster disease

Assessment of Burden of Disease in Nepal
38
due to leismaniasis was not found in Western and Far-western development region as well as in
hilly and mountain region.
According to the age and sex distribution of the mortality, it was observed more among the
males of age group 30-59. Age and sex wise distribution in the regions was similar to that of
national distribution except Eastern region where highest burden was observed in age group 0-14
(48%) instead of age group 30-59 (43%).
Table 3.3.15. YLL distribution of Leishmaniasis
Background Characteristics
Age Group
Total YLL 0-14 15-29 30-59 60+
Development region
Eastern
Male 0.0 0.0 83.6 16.3 100 355
Female 100.0 0.0 0.0 0.0 100 329
Total 48.1 0.0 43.4 8.4 100 684
Central
Male 0.0 28.5 56.9 14.5 100 3513
Female 0.0 0.0 84.6 15.3 100 2468
Total 0.0 16.7 68.3 14.8 100 5981
Mid-Western
Male 0.0 0.0 0.0 100.0 100 47
Total 0.0 0.0 0.0 100.0 100 47
Ecological Region
Terai
Male 0.0 25.5 58.7 15.7 100 3915
Female 11.7 0.0 74.6 13.5 100 2797
Total 4.9 14.9 65.3 14.8 100 6712
National
Male 0.00 25.5 58.7 15.7 100 3915
Female 11.7 0.0 74.6 13.5 100 2797
Total 4.9 14.9 65.3 14.8 100 6712
0.0
20.0
40.0
60.0
80.0
100.0
Eastern Central Mid-Western
10.2
89.1
0.7
Developmental Region
Figure 3.3.14 Region wise distribution of total YLL due to Leismaniasis

Assessment of Burden of Disease in Nepal
39
I-A9e Lymphatic filariasis
Lymphatic filariasis is one of the most disfiguring diseases and a major cause of clinical
morbidity. Years of life lost shared by lymphatic filariasis among the total infectious and
parasitic disease was found to be negligible accounting for less than 1% of total YLL. According
to the age and sex distribution of the mortality it was observed more among the males of age
group 30-59 at national level. Both Mountain and Terai region had similar age and sex wise
distribution while development regions had quite different pattern. Only Mid-Western region had
burden distributed in both sexes while remaining regions had total burden in single sex; females
in western region and males in remaining three development regions.
Table 3.3.16. YLL distribution of Lymphatic Filariasis
Background Characteristics
Age Group
Total YLL 15-29 30-59 60+
Development region
Eastern
Male 0.0 100.0 0.0 100 283
Total 0.0 100.0 0.0 100 283
Central
Male 0.0 100.0 0.0 100 712
Total 0.0 100.0 0.0 100 712
Western
Female 0.0 0.0 100.0 100 77
Total 0.0 0.0 100.0 100 77
Mid-Western
Male 0.0 100.0 0.0 100 94
Female 100.0 0.0 0.0 100 255
Total 73.0 26.9 0.0 100 349
Far-Western
Male 0.0 0.0 100.0 100 37
Total 0.0 0.0 100.0 100 37
Ecological Region
Mountain
Male 0.0 100.0 0.0 100 387
Female 100.0 0.0 0.0 100 255
Total 39.7 60.2 0.0 100 642
Terai
Male 0.0 94.9 5.0 100 739
Female 0.0 0.0 100.0 100 77
Total 0.0 86.0 13.9 100 816
National
Male 0.0 96.7 3.2 100 1126
Female 76.8 0.0 23.1 100 332
Total 17.4 74.6 7.8 100 1458
Similarly, region wise distribution of total mortality burden due to lymphatic filariasis shows that
Central development region is the highest contributor (48.8%) of the total YLL whereas Far-
western development region comprises the lowest percentage of the total figure (2.5%). Similarly

Assessment of Burden of Disease in Nepal
40
distribution of ecological region, terai area accounts the highest mortality burden (56%) and the
lowest percentage was found in mountain region (44%).
I-A9g Rabies
Rabies is a major zoonotic disease of public health importance in Nepal. Years of life lost shared
by rabies among the total infectious and parasitic disease was found to be negligible accounting
for less than 1% of total YLL. The total YLL lost due to rabies is 2513 years. The region wise
distribution of mortality burden due to lymphatic filariasis shows that Mid-western development
region is the highest contributor (33.4%) of the total YLL whereas Central development region
comprises the lowest percentage of the total figure (2.3%). Similarly distribution of ecological
region, Mountain region accounts the highest mortality burden (62%) and the lowest percentage
was found in Hill region (2.3%).
0.0
10.0
20.0
30.0
40.0
50.0
60.0
East
ern
Cen
tral
Wes
tern
Mid
-Wes
tern
Far-
Wes
tern
Mo
un
tain
Tera
i
Development region Ecological Region
19.4
48.8
5.3
23.9
2.5
44.0
56.0
0.0 10.0 20.0 30.0 40.0 50.0 60.0 70.0
East
ern
Cen
tral
Wes
tern
Mid
-Wes
tern
Far-
Wes
tern
Mo
un
tain
Hill
Tera
i
Development region Ecological Region
13.6 2.3
31.0 33.4
19.7
62.0
2.3
35.7
Figure 3.3.15 Region wise distribution of total YLL due to Lymphatic filariasis
Figure 3.3.16 Region wise distribution of total YLL due to Rabies
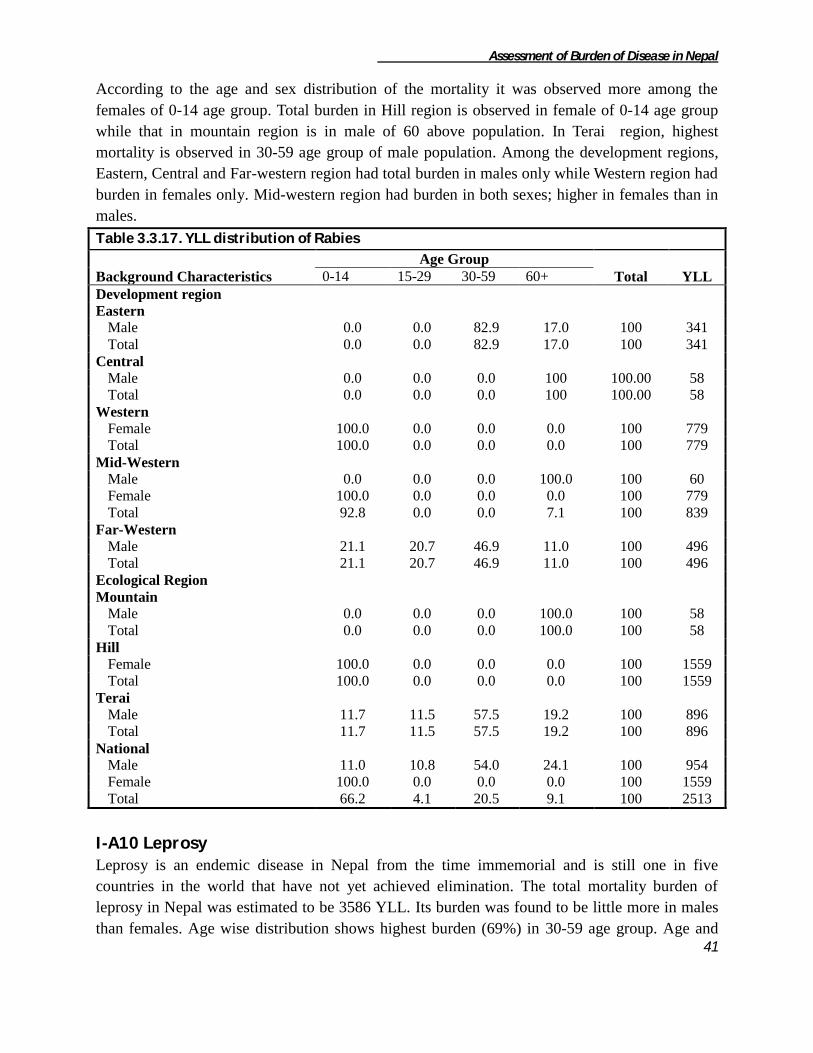
Assessment of Burden of Disease in Nepal
41
According to the age and sex distribution of the mortality it was observed more among the
females of 0-14 age group. Total burden in Hill region is observed in female of 0-14 age group
while that in mountain region is in male of 60 above population. In Terai region, highest
mortality is observed in 30-59 age group of male population. Among the development regions,
Eastern, Central and Far-western region had total burden in males only while Western region had
burden in females only. Mid-western region had burden in both sexes; higher in females than in
males.
Table 3.3.17. YLL distribution of Rabies
Background Characteristics
Age Group
Total YLL 0-14 15-29 30-59 60+
Development region
Eastern
Male 0.0 0.0 82.9 17.0 100 341
Total 0.0 0.0 82.9 17.0 100 341
Central
Male 0.0 0.0 0.0 100 100.00 58
Total 0.0 0.0 0.0 100 100.00 58
Western
Female 100.0 0.0 0.0 0.0 100 779
Total 100.0 0.0 0.0 0.0 100 779
Mid-Western
Male 0.0 0.0 0.0 100.0 100 60
Female 100.0 0.0 0.0 0.0 100 779
Total 92.8 0.0 0.0 7.1 100 839
Far-Western
Male 21.1 20.7 46.9 11.0 100 496
Total 21.1 20.7 46.9 11.0 100 496
Ecological Region
Mountain
Male 0.0 0.0 0.0 100.0 100 58
Total 0.0 0.0 0.0 100.0 100 58
Hill
Female 100.0 0.0 0.0 0.0 100 1559
Total 100.0 0.0 0.0 0.0 100 1559
Terai
Male 11.7 11.5 57.5 19.2 100 896
Total 11.7 11.5 57.5 19.2 100 896
National
Male 11.0 10.8 54.0 24.1 100 954
Female 100.0 0.0 0.0 0.0 100 1559
Total 66.2 4.1 20.5 9.1 100 2513
I-A10 Leprosy Leprosy is an endemic disease in Nepal from the time immemorial and is still one in five
countries in the world that have not yet achieved elimination. The total mortality burden of
leprosy in Nepal was estimated to be 3586 YLL. Its burden was found to be little more in males
than females. Age wise distribution shows highest burden (69%) in 30-59 age group. Age and
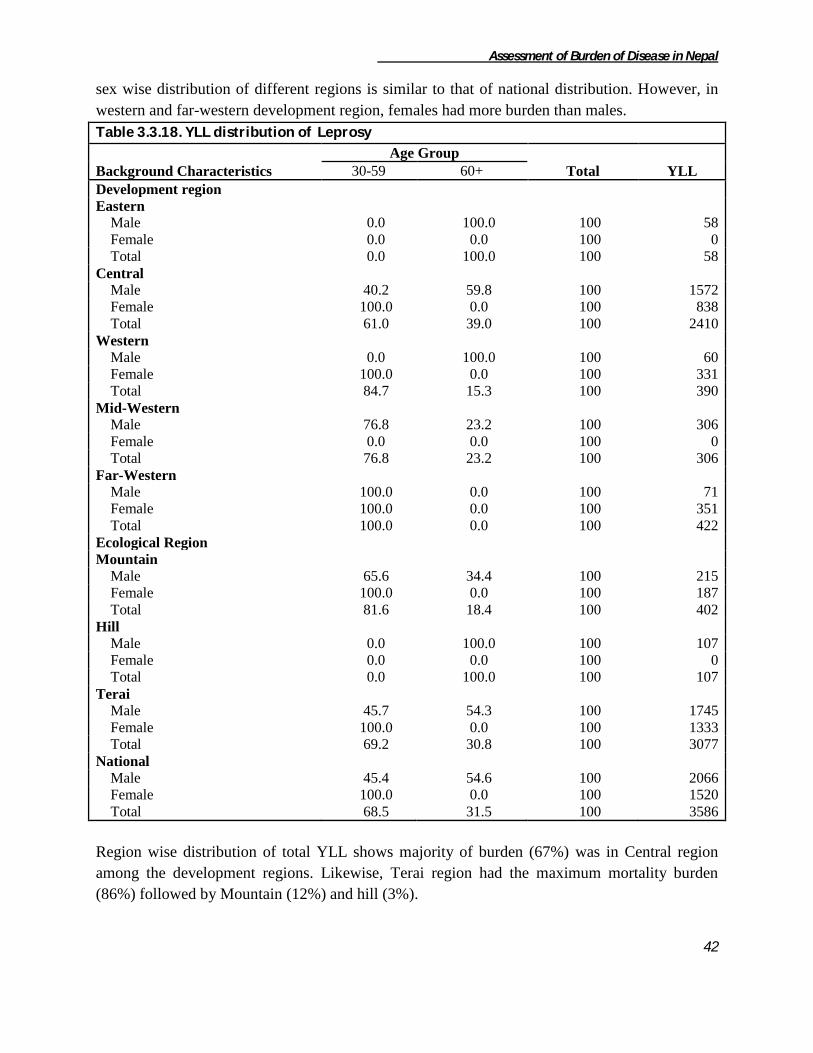
Assessment of Burden of Disease in Nepal
42
sex wise distribution of different regions is similar to that of national distribution. However, in
western and far-western development region, females had more burden than males.
Table 3.3.18. YLL distribution of Leprosy
Background Characteristics
Age Group
Total YLL 30-59 60+
Development region
Eastern
Male 0.0 100.0 100 58
Female 0.0 0.0 100 0
Total 0.0 100.0 100 58
Central
Male 40.2 59.8 100 1572
Female 100.0 0.0 100 838
Total 61.0 39.0 100 2410
Western
Male 0.0 100.0 100 60
Female 100.0 0.0 100 331
Total 84.7 15.3 100 390
Mid-Western
Male 76.8 23.2 100 306
Female 0.0 0.0 100 0
Total 76.8 23.2 100 306
Far-Western
Male 100.0 0.0 100 71
Female 100.0 0.0 100 351
Total 100.0 0.0 100 422
Ecological Region Mountain
Male 65.6 34.4 100 215
Female 100.0 0.0 100 187
Total 81.6 18.4 100 402
Hill
Male 0.0 100.0 100 107
Female 0.0 0.0 100 0
Total 0.0 100.0 100 107
Terai
Male 45.7 54.3 100 1745
Female 100.0 0.0 100 1333
Total 69.2 30.8 100 3077
National
Male 45.4 54.6 100 2066
Female 100.0 0.0 100 1520
Total 68.5 31.5 100 3586
Region wise distribution of total YLL shows majority of burden (67%) was in Central region
among the development regions. Likewise, Terai region had the maximum mortality burden
(86%) followed by Mountain (12%) and hill (3%).

Assessment of Burden of Disease in Nepal
43
I-A12 Japanese Encephalitis Total mortality burden of Japanese Encephalitis (JE) is about 6000 YLL. It accounts for 1.5% of
total mortality due to group I category. There was no much difference in burden distribution
among development regions; however, maximum YLL was observed in Western (33%) and
minimum in Eastern (13%). Likewise, more than 90% YLL was observed in Terai region. No
any burden was found in Central and mountain region.
Burden due to JE was found to higher in age group 0-14 (45%) followed by age group 30-59
(30%). Likewise, males were more prone to mortality due to JE in comparison to females.
Eastern development region showed different pattern of age and sex wise distribution to that of
national estimate. In this region, females had higher burden than males and highest contributing
0.0 10.0 20.0 30.0 40.0 50.0 60.0 70.0 80.0 90.0
East
ern
Cen
tral
Wes
tern
Mid
-wes
tern
Far-
wes
tern
Mo
un
tain
Hill
Tera
i
Dev-region Eco-region
1.6
67.2
10.9 8.5 11.8 11.2 3.0
85.8
0.0 10.0 20.0 30.0 40.0 50.0 60.0 70.0 80.0 90.0
100.0
East
ern
Cen
tral
Wes
tern
Mid
-wes
tern
Far-
wes
tern
Mo
un
tain
Hill
Tera
i
Dev-region Eco-region
13.4 0.0
32.9 29.3 24.4
0.0 8.6
91.4
Figure 3.3.17 Region wise distribution of total YLL due to Leprosy
Figure 3.3.18 Region wise distribution of total YLL due to Japanese encephalitis
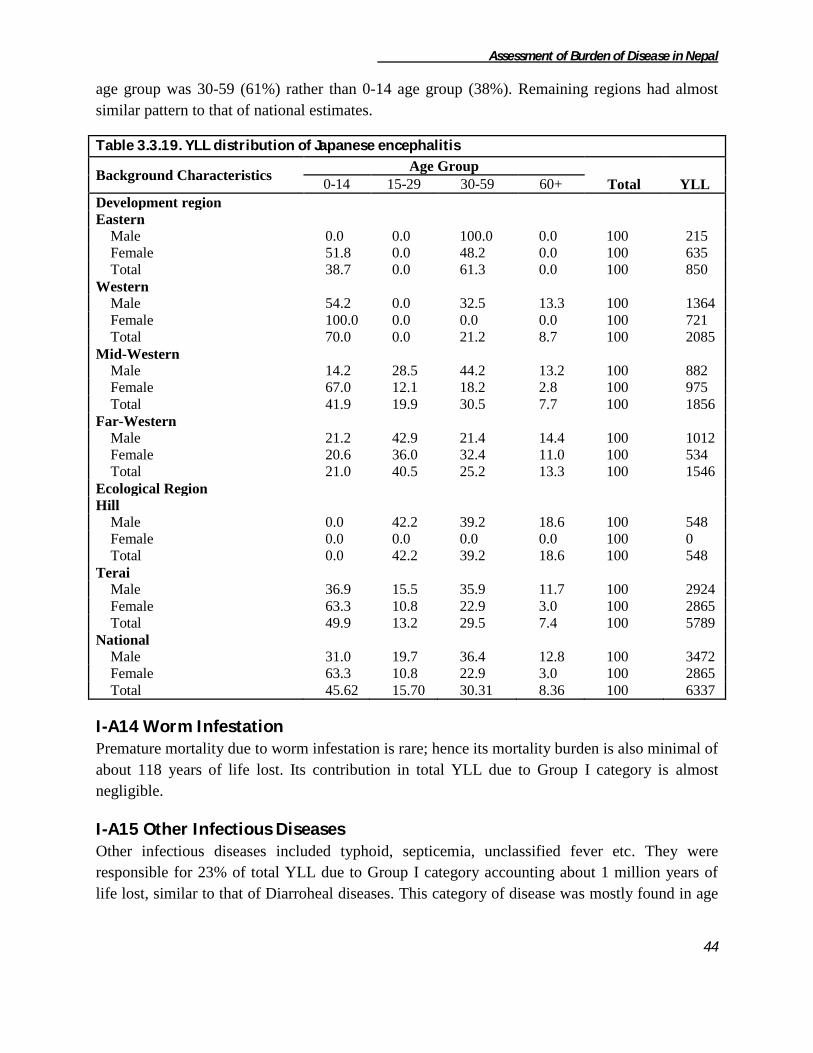
Assessment of Burden of Disease in Nepal
44
age group was 30-59 (61%) rather than 0-14 age group (38%). Remaining regions had almost
similar pattern to that of national estimates.
Table 3.3.19. YLL distribution of Japanese encephalitis
Background Characteristics Age Group
Total YLL 0-14 15-29 30-59 60+
Development region
Eastern
Male 0.0 0.0 100.0 0.0 100 215
Female 51.8 0.0 48.2 0.0 100 635
Total 38.7 0.0 61.3 0.0 100 850
Western
Male 54.2 0.0 32.5 13.3 100 1364
Female 100.0 0.0 0.0 0.0 100 721
Total 70.0 0.0 21.2 8.7 100 2085
Mid-Western
Male 14.2 28.5 44.2 13.2 100 882
Female 67.0 12.1 18.2 2.8 100 975
Total 41.9 19.9 30.5 7.7 100 1856
Far-Western
Male 21.2 42.9 21.4 14.4 100 1012
Female 20.6 36.0 32.4 11.0 100 534
Total 21.0 40.5 25.2 13.3 100 1546
Ecological Region
Hill
Male 0.0 42.2 39.2 18.6 100 548
Female 0.0 0.0 0.0 0.0 100 0
Total 0.0 42.2 39.2 18.6 100 548
Terai
Male 36.9 15.5 35.9 11.7 100 2924
Female 63.3 10.8 22.9 3.0 100 2865
Total 49.9 13.2 29.5 7.4 100 5789
National
Male 31.0 19.7 36.4 12.8 100 3472
Female 63.3 10.8 22.9 3.0 100 2865
Total 45.62 15.70 30.31 8.36 100 6337
I-A14 Worm Infestation Premature mortality due to worm infestation is rare; hence its mortality burden is also minimal of
about 118 years of life lost. Its contribution in total YLL due to Group I category is almost
negligible.
I-A15 Other Infectious Diseases Other infectious diseases included typhoid, septicemia, unclassified fever etc. They were
responsible for 23% of total YLL due to Group I category accounting about 1 million years of
life lost, similar to that of Diarroheal diseases. This category of disease was mostly found in age

Assessment of Burden of Disease in Nepal
45
group 0-14, more in females than in males. Age and sex wise distribution is similar to that of
national estimates.
Table 3.3.20. YLL distribution of Other infectious diseases
Background Characteristics Age Group
Total YLL 0-14 15-29 30-59 60+
Development region
Eastern
Male 58.95 10.88 8.41 21.76 100.00 9663
Female 45.37 7.98 13.67 32.98 100.00 11288
Total 51.63 9.32 11.25 27.81 100.00 20951
Central
Male 40.71 10.08 26.99 22.22 100.00 11248
Female 61.37 6.74 9.37 22.53 100.00 16791
Total 53.08 8.08 16.44 22.40 100.00 28039
Western
Male 54.32 9.98 11.66 24.04 100.00 8269
Female 44.46 7.89 18.43 29.23 100.00 9731
Total 48.99 8.85 15.32 26.84 100.00 18000
Mid-Western
Male 41.69 17.44 10.94 29.93 100.00 6882
Female 40.47 8.65 19.35 31.53 100.00 10253
Total 40.96 12.18 15.97 30.89 100.00 17135
Far-Western
Male 46.36 2.86 24.85 25.93 100.00 6929
Female 37.35 5.41 31.37 25.86 100.00 8297
Total 41.45 4.25 28.41 25.90 100.00 15226
Ecological Region
Mountain
Male 36.11 10.24 27.93 25.72 100.00 4716
Female 39.33 4.86 11.14 44.67 100.00 4874
Total 37.75 7.51 19.40 35.35 100.00 9590
Hill
Male 40.87 16.99 17.34 24.80 100.00 14022
Female 38.43 8.66 19.95 32.96 100.00 23313
Total 39.35 11.79 18.97 29.90 100.00 37335
Terai
Male 55.31 6.36 14.60 23.74 100.00 24251
Female 57.22 6.68 15.27 20.83 100.00 28174
Total 56.34 6.53 14.96 22.17 100.00 52425
National
Male 48.49 10.25 16.95 24.30 100.00 42990
Female 47.90 7.34 16.85 27.91 100.00 56360
Total 48.16 8.60 16.89 26.35 100.00 99350
Distribution of YLL among the regions is similar to that of category I-A (Infectious and parasitic
diseases). Central region has the highest burden (28%) among the development regions.
Likewise, Terai region has the maximum burden (53%) followed by Hill (38%) and Terai (10%).

Assessment of Burden of Disease in Nepal
46
I-B Respiratory Infections
Respiratory Infections are the third highest contributor for years of life lost due to Group I
category sharing 21 percent of total YLL. Altogether 221730 YLL had been lost due to
respiratory infections. Burden of Respiratory infection was almost equally distributed in all
development regions ranging from 21% to 17%. However, ecological region wise distribution
was highest in Terai region (50%) followed by Hill region (32%) and Mountain region (18%).
The YLL distribution due to Lower respiratory infections, Upper Respiratory infections and
Otitis media is shown in the Table 3.3.21. Majority of burden due to Respiratory Infection at
national level was contributed by Lower Respiratory Infection (98%) while Upper Respiratory
Infection and Otitis Media constituted remaining 2 percent. Region wise distribution was also
similar to that of national distribution.
0.0
10.0
20.0
30.0
40.0
50.0
60.0
East
ern
Cen
tral
Wes
tern
Mid
-wes
tern
Far-
wes
tern
Mo
un
tain
Hill
Tera
i
Dev-region Eco-region
21.1 28.2
18.1 17.2 15.3 9.7
37.6
52.8
0.0 5.0
10.0 15.0 20.0 25.0 30.0 35.0 40.0 45.0 50.0
East
ern
Cen
tral
Wes
tern
Mid
-wes
tern
Far-
wes
tern
Mo
un
tain
Hill
Tera
i
Dev-region Eco-region
21.7 21.8 19.4 19.7 17.4 18.4
32.0
49.6
Figure 3.3.20.Region wise distribution of total YLL due to Respiratory Infection
Figure 3.3.19 Region wise distribution of total YLL due to Other infectious diseases

Assessment of Burden of Disease in Nepal
47
Table 3.3.21. YLL distribution of Respiratory Infection
Respiratory
Infection
Development Region Eco-Region
National E C W MW FW M H T
Lower respiratory
infections 100.0 97.6 97.6 94.6 99.0 97.1 97.4 98.3 97.8
Upper respiratory
infections 0.0 2.4 2.1 4.6 0.7 2.3 2.6 1.4 1.9
Otitis media 0.0 0.0 0.3 0.9 0.3 0.6 0.0 0.3 0.3
Total 100 100 100 100 100 100 100 100 100
Total YLL 48025 48409 42970 43779 38546 40819 70993 109918 221730
I-B1 Lower Respiratory Infections
Lower Respiratory Infections (LRIs) were the major cause of mortality among the total
Respiratory Infections comprising approximately 98 percent of total YLL (216818). Region wise
distribution of LRIs was similar to distribution of Respiratory Infections showing almost equal
distribution in all development regions and similar pattern in ecological regions highest in Terai
(50%) followed by Hill (32%) and Mountain (18%).
According to Table 3.3.22, highest YLL was observed in the below 14 age group (95%). Sex
wise distribution showed little higher mortality burden in males than in females. Region wise
distribution was similar to that of the national showing higher mortality burden in 0-14 age
group. Likewise, YLL was also estimated to be little higher in males in all eco-development
regions.
0.0
10.0
20.0
30.0
40.0
50.0
East
ern
Cen
tral
Wes
tern
Mid
-wes
tern
Far-
wes
tern
Mo
un
tain
Hill
Tera
i
Dev-region Eco-region
22.1 21.8 19.4 19.1 17.6 18.3
31.9
49.8
Figure 3.3.21 Region wise distribution of total YLL due to Lower Respiratory Infection

Assessment of Burden of Disease in Nepal
48
Table 3.3.22. YLL distribution of Lower respiratory infections
Background
Characteristics
Age Group
Total YLL 0-14 15-29 30-59 60+
Development region
Eastern
Male 90.0 1.2 4.1 4.6 100 27448
Female 84.3 2.3 9.3 4.0 100 20576
Total 87.6 1.7 6.4 4.4 100 48024
Central
Male 94.9 0.0 2.9 2.2 100 21364
Female 95.3 0.7 0.5 3.5 100 25906
Total 95.2 0.4 1.5 2.9 100 47270
Western
Male 99.1 0.0 0.0 0.9 100 23355
Female 99.5 0.0 0.0 0.5 100 18600
Total 99.3 0.0 0.0 0.7 100 41955
Mid-Western
Male 96.8 0.0 1.6 1.6 100 23630
Female 96.0 0.0 1.9 2.1 100 17770
Total 96.4 0.0 1.7 1.8 100 41400
Far-Western
Male 97.7 0.0 0.3 2.0 100 21646
Female 98.2 0.0 0.0 1.8 100 16524
Total 97.9 0.0 0.2 1.9 100 38170
Ecological Region
Mountain
Male
100 23591
Female 93.4 0.0 2.3 4.4 100 16028
Total 89.4 2.1 3.3 5.2 100 39619
Hill 91.8 0.8 2.7 4.7
Male
100 41458
Female 95.7 0.0 2.5 1.8 100 27713
Total 95.1 0.0 2.7 2.1 100 69171
Terai 95.5 0.0 2.6 1.9
Male
100 52393
Female 96.3 0.6 1.2 1.9 100 55634
Total 95.5 0.6 2.0 1.9 100 108027
95.9 0.6 1.6 1.9
National
Male
100 117443
Female 95.5 0.3 1.9 2.3 100 99375
Total 94.4 0.7 2.4 2.5 100 216818
I-B2 Upper Respiratory Infections
Upper Respiratory Infections (URIs) constituted about 2 percent (4300 YLL) of total Respiratory
Infections. Age wise distribution shows that mortality due to Upper Respiratory Infections was
observed highest in age group 60+ and lowest in 0-14 age group. Sex wise distribution was not
much different showing almost similar pattern in both male and female. Age wise distribution in

Assessment of Burden of Disease in Nepal
49
all the regions was similar to that of national estimates except in case of central development
region where the burden was found to be higher in 30-59 age group rather than in 60+ age group.
Regarding the regional sex wise distribution, the burden was found to be higher in females in
except in central development region. In contrast, ecological sex wise distribution showed higher
burden in females in only hilly region.
Table 3.3.23. YLL distribution of Upper respiratory infections
Background Characteristics
Age Group
Total YLL 0-14 30-59 60+
Development Region
Central
Male 0.0 87.9 12.1 100 692
Female 0.0 0.0 100.0 100 446
Total 0.0 53.4 46.6 100 1138
Western
Male 0.0 0.0 100.0 100 280
Female 0.0 0.0 100.0 100 611
Total 0.0 0.0 100.0 100 891
Mid-Western
Male 27.0 0.0 73.0 100 935
Female 0.0 12.3 87.7 100 1062
Total 12.6 6.6 80.8 100 1997
Far-Western
Male 0.0 0.0 100.0 100 112
Female 0.0 56.2 43.8 100 162
Total 0.0 33.2 66.8 100 274
Eco-Region
Mountain
Male 42.2 0.0 57.8 100 597
Female 0.0 37.3 62.7 100 351
Total 26.6 13.8 59.6 100 948
Hill
Male 0.0 0.0 100.0 100 599
Female 0.0 0.0 100.0 100 1222
Total 0.0 0.0 100.0 100 1821
Terai
Male 0.0 73.9 26.1 100 823
Female 0.0 12.9 87.1 100 708
Total 0.0 45.7 54.3 100 1531
National
Male 12.5 30.1 57.4 100 2019
Female 0.0 9.7 90.3 100 2281
Total 5.9 19.3 74.8 100 4300
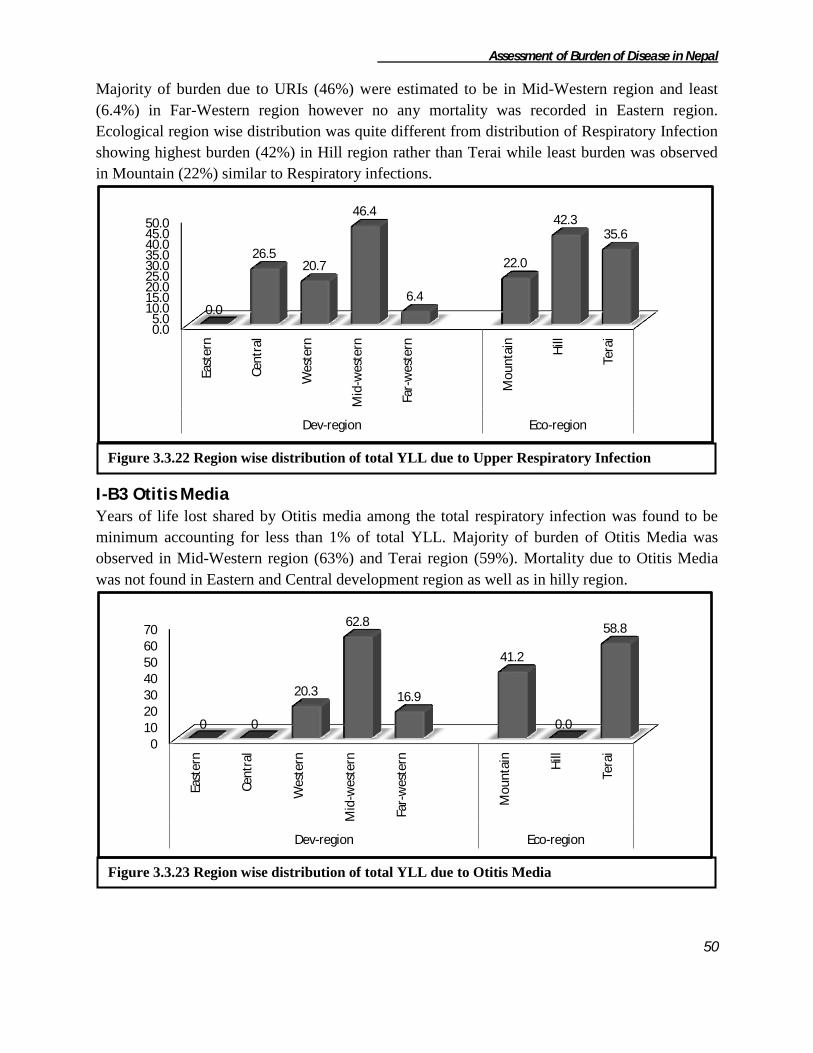
Assessment of Burden of Disease in Nepal
50
Majority of burden due to URIs (46%) were estimated to be in Mid-Western region and least
(6.4%) in Far-Western region however no any mortality was recorded in Eastern region.
Ecological region wise distribution was quite different from distribution of Respiratory Infection
showing highest burden (42%) in Hill region rather than Terai while least burden was observed
in Mountain (22%) similar to Respiratory infections.
I-B3 Otitis Media Years of life lost shared by Otitis media among the total respiratory infection was found to be
minimum accounting for less than 1% of total YLL. Majority of burden of Otitis Media was
observed in Mid-Western region (63%) and Terai region (59%). Mortality due to Otitis Media
was not found in Eastern and Central development region as well as in hilly region.
0.0 5.0
10.0 15.0 20.0 25.0 30.0 35.0 40.0 45.0 50.0
East
ern
Cen
tral
Wes
tern
Mid
-wes
tern
Far-
wes
tern
Mo
un
tain
Hill
Tera
i
Dev-region Eco-region
0.0
26.5 20.7
46.4
6.4
22.0
42.3 35.6
0 10 20 30 40 50 60 70
East
ern
Cen
tral
Wes
tern
Mid
-wes
tern
Far-
wes
tern
Mo
un
tain
Hill
Tera
i
Dev-region Eco-region
0 0
20.3
62.8
16.9
41.2
0.0
58.8
Figure 3.3.22 Region wise distribution of total YLL due to Upper Respiratory Infection
Figure 3.3.23 Region wise distribution of total YLL due to Otitis Media

Assessment of Burden of Disease in Nepal
51
According to the age and sex distribution, burden was observed four times more among the
males than females. Likewise, the burden was highest (63%) in 0-14 age group.
Table 3.3.24. YLL distribution of Otitis media
Background Characteristics
Age group
Total YLL 0-14 15-29 60+
Development Region
Western
Male 0.0 0.0 100.0 100 124
Female 0.0 0.0 0.0 0 0
Total 0.0 0.0 100.0 100 124
Mid-Western
Male 100.0 0.0 0.0 100 384
Female 0.0 0.0 0.0 0 0
Total 100.0 0.0 0.0 100 384
Far-Western
Male 0.0 0.0 0.0 0 0
Female 0.0 100.0 0.0 100 103
Total 0.0 100.0 0.0 100 103
Ecological region
Mountain
Male 100.0 0.0 0.0 100 252
Female 0.0 0.0 0.0 0 0
Total 100.0 0.0 0.0 100 252
Terai
Male 51.6 0.0 48.4 100 256
Female 0.0 100.0 0.0 100 103
Total 36.8 28.7 34.5 100 359
National
Male 75.6 0.0 24.4 100 508
Female 0.0 100.0 0.0 100 103
Total 62.8 16.9 20.3 100 611
I.C. Maternal Conditions
Maternal mortality, which is a current issue of concern on the international health agenda,
remains one of the most important public health problems in developing countries. Nepal has
long suffered from one of the world’s worst levels of maternal mortality. Even though deaths due
to maternal conditions have decreased a lot, maternal mortality ratio is still high in Nepal.
Altogether 61296 YLL had been lost due to maternal conditions. The region wise distribution of
mortality burden due to maternal conditions shows that Central development region is the
highest contributor (29.8%) of the total YLL whereas Far-western development region comprises
the lowest percentage (10.3%) of the total figure. Similarly distribution of ecological region,
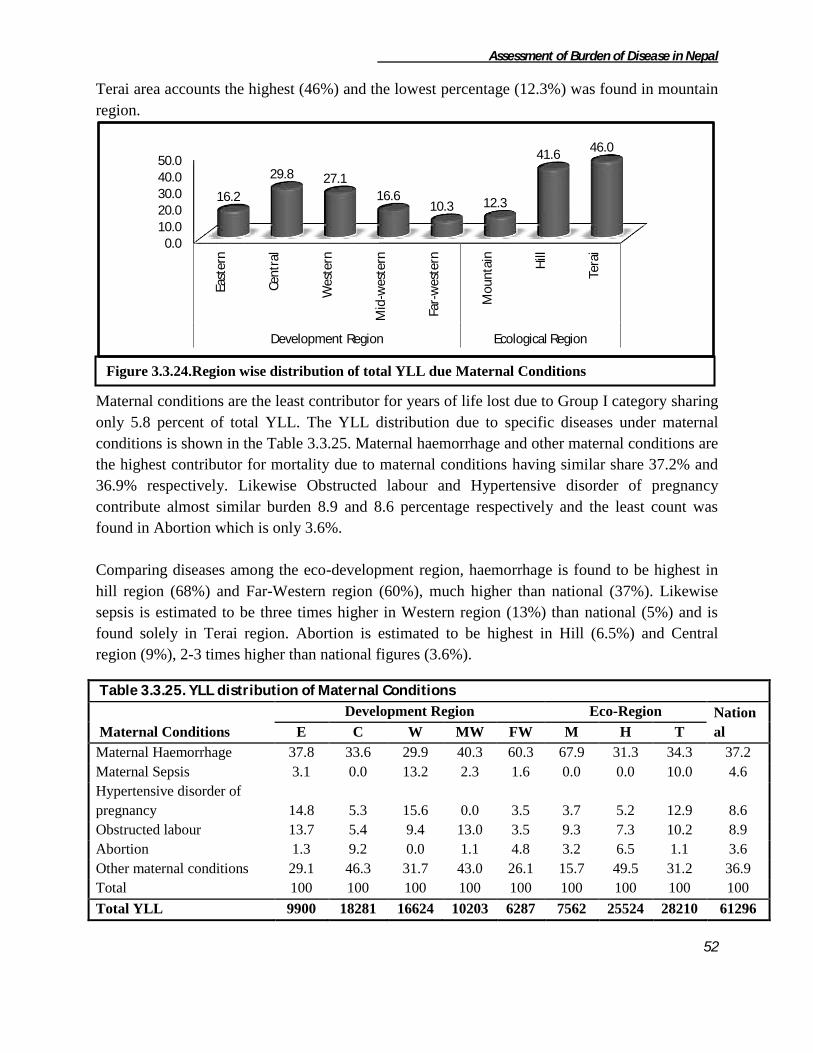
Assessment of Burden of Disease in Nepal
52
Terai area accounts the highest (46%) and the lowest percentage (12.3%) was found in mountain
region.
Maternal conditions are the least contributor for years of life lost due to Group I category sharing
only 5.8 percent of total YLL. The YLL distribution due to specific diseases under maternal
conditions is shown in the Table 3.3.25. Maternal haemorrhage and other maternal conditions are
the highest contributor for mortality due to maternal conditions having similar share 37.2% and
36.9% respectively. Likewise Obstructed labour and Hypertensive disorder of pregnancy
contribute almost similar burden 8.9 and 8.6 percentage respectively and the least count was
found in Abortion which is only 3.6%.
Comparing diseases among the eco-development region, haemorrhage is found to be highest in
hill region (68%) and Far-Western region (60%), much higher than national (37%). Likewise
sepsis is estimated to be three times higher in Western region (13%) than national (5%) and is
found solely in Terai region. Abortion is estimated to be highest in Hill (6.5%) and Central
region (9%), 2-3 times higher than national figures (3.6%).
Table 3.3.25. YLL distribution of Maternal Conditions
Maternal Conditions
Development Region Eco-Region Nation
al E C W MW FW M H T
Maternal Haemorrhage 37.8 33.6 29.9 40.3 60.3 67.9 31.3 34.3 37.2
Maternal Sepsis 3.1 0.0 13.2 2.3 1.6 0.0 0.0 10.0 4.6
Hypertensive disorder of
pregnancy 14.8 5.3 15.6 0.0 3.5 3.7 5.2 12.9 8.6
Obstructed labour 13.7 5.4 9.4 13.0 3.5 9.3 7.3 10.2 8.9
Abortion 1.3 9.2 0.0 1.1 4.8 3.2 6.5 1.1 3.6
Other maternal conditions 29.1 46.3 31.7 43.0 26.1 15.7 49.5 31.2 36.9
Total 100 100 100 100 100 100 100 100 100
Total YLL 9900 18281 16624 10203 6287 7562 25524 28210 61296
0.0 10.0
20.0 30.0 40.0 50.0
East
ern
Cen
tral
Wes
tern
Mid
-wes
tern
Far-
wes
tern
Mo
un
tain
Hill
Tera
i
Development Region Ecological Region
16.2
29.8 27.1
16.6 10.3 12.3
41.6 46.0
Figure 3.3.24.Region wise distribution of total YLL due Maternal Conditions

Assessment of Burden of Disease in Nepal
53
I-C1 Maternal Haemorrhage Maternal haemorrhage constituted about 37 percent of total YLL loss due to maternal conditions
which is the highest among the entire category. Maternal haemorrhage is significant causes of
morbidity and mortality among Nepalese women and remains a major public health problem in
developing countries with its very high prevalence. The total YLL lost due to maternal
haemorrhage is 22801 years. Region wise distribution shows that Central region is the highest
contributor (27%) of total YLL due to maternal haemorrhage followed by western (21.9%).
Likewise, among the ecological region, Terai region is responsible for maximum YLL (42.4%)
followed by Hill (35%) and Mountain (22.5%).
The mortality is found to be more or less similar to the both age group i.e. 49% and 50%
respectively. The age wise distribution of mortality shows that 15-29 age group holds highest
mortality than 30-59 age group for Mountain and Hilly region but Terai area shows 30-59 age
group contribute higher mortality than 15-29 age group. Likewise, Central and Western
development region holds almost double burden in 30-59 age group than 15-29 age group. The
pattern is reserved in case of Mid-western and Far-western region.
Table 3.3.26. YLL distribution of Maternal haemorrhage
Background Characteristics
Age Group
Total YLL 15-29 30-59
Development Region
Eastern 53.2 46.7 100 3742
Central 38.8 61.1 100 6159
Western 37.7 62.2 100 4984
Mid-Western 61.7 38.2 100 4121
Far-Western 67.0 32.9 100 3794
Ecological region
Mountain 54.6 45.3 100 5136
Hill 56.2 43.7 100 7989
Terai 41.9 58.1 100 9675
National 49.8 50.2 100 22801
0.0 5.0
10.0 15.0 20.0 25.0 30.0 35.0 40.0 45.0
East
ern
Cen
tral
Wes
tern
Mid
-wes
tern
Far-
wes
tern
Mo
un
tain
Hill
Tera
i
Development Region Ecological Region
16.4
27.0 21.9
18.1 16.6 22.5
35.0 42.4
Figure 3.3.25 Region wise distribution of total YLL due Maternal Haemorrhage
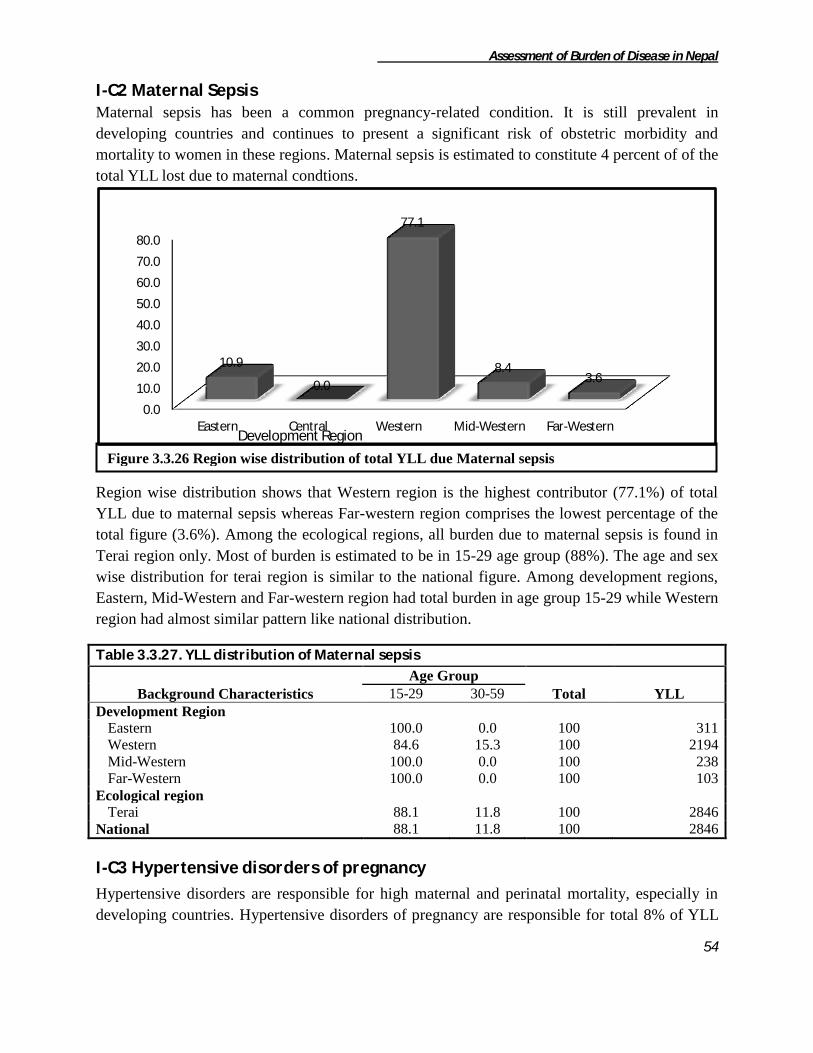
Assessment of Burden of Disease in Nepal
54
I-C2 Maternal Sepsis Maternal sepsis has been a common pregnancy-related condition. It is still prevalent in
developing countries and continues to present a significant risk of obstetric morbidity and
mortality to women in these regions. Maternal sepsis is estimated to constitute 4 percent of of the
total YLL lost due to maternal condtions.
Region wise distribution shows that Western region is the highest contributor (77.1%) of total
YLL due to maternal sepsis whereas Far-western region comprises the lowest percentage of the
total figure (3.6%). Among the ecological regions, all burden due to maternal sepsis is found in
Terai region only. Most of burden is estimated to be in 15-29 age group (88%). The age and sex
wise distribution for terai region is similar to the national figure. Among development regions,
Eastern, Mid-Western and Far-western region had total burden in age group 15-29 while Western
region had almost similar pattern like national distribution.
Table 3.3.27. YLL distribution of Maternal sepsis
Background Characteristics
Age Group
Total YLL 15-29 30-59
Development Region
Eastern 100.0 0.0 100 311
Western 84.6 15.3 100 2194
Mid-Western 100.0 0.0 100 238
Far-Western 100.0 0.0 100 103
Ecological region
Terai 88.1 11.8 100 2846
National 88.1 11.8 100 2846
I-C3 Hypertensive disorders of pregnancy
Hypertensive disorders are responsible for high maternal and perinatal mortality, especially in
developing countries. Hypertensive disorders of pregnancy are responsible for total 8% of YLL
0.0
10.0
20.0
30.0
40.0
50.0
60.0
70.0
80.0
Eastern Central Western Mid-Western Far-Western
10.9
0.0
77.1
8.4 3.6
Development Region
Figure 3.3.26 Region wise distribution of total YLL due Maternal sepsis
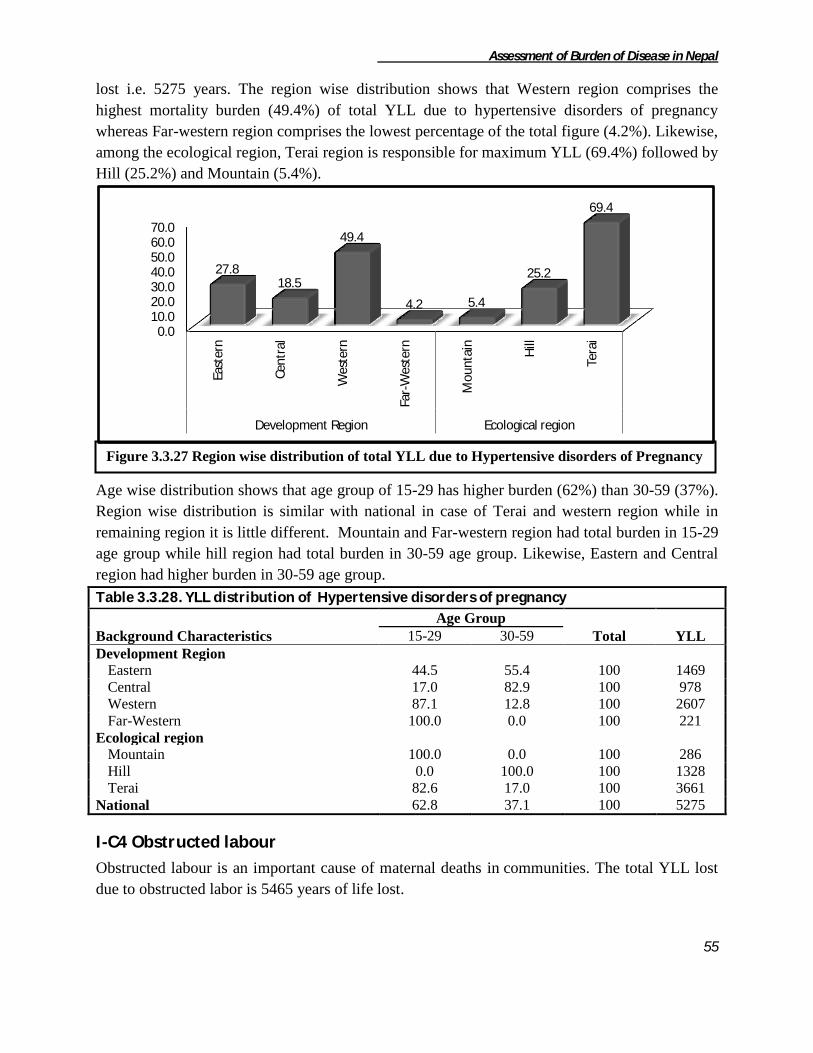
Assessment of Burden of Disease in Nepal
55
lost i.e. 5275 years. The region wise distribution shows that Western region comprises the
highest mortality burden (49.4%) of total YLL due to hypertensive disorders of pregnancy
whereas Far-western region comprises the lowest percentage of the total figure (4.2%). Likewise,
among the ecological region, Terai region is responsible for maximum YLL (69.4%) followed by
Hill (25.2%) and Mountain (5.4%).
Age wise distribution shows that age group of 15-29 has higher burden (62%) than 30-59 (37%).
Region wise distribution is similar with national in case of Terai and western region while in
remaining region it is little different. Mountain and Far-western region had total burden in 15-29
age group while hill region had total burden in 30-59 age group. Likewise, Eastern and Central
region had higher burden in 30-59 age group.
Table 3.3.28. YLL distribution of Hypertensive disorders of pregnancy
Background Characteristics
Age Group
Total YLL 15-29 30-59
Development Region
Eastern 44.5 55.4 100 1469
Central 17.0 82.9 100 978
Western 87.1 12.8 100 2607
Far-Western 100.0 0.0 100 221
Ecological region
Mountain 100.0 0.0 100 286
Hill 0.0 100.0 100 1328
Terai 82.6 17.0 100 3661
National 62.8 37.1 100 5275
I-C4 Obstructed labour
Obstructed labour is an important cause of maternal deaths in communities. The total YLL lost
due to obstructed labor is 5465 years of life lost.
0.0 10.0 20.0 30.0 40.0 50.0 60.0 70.0
East
ern
Cen
tral
Wes
tern
Far-
Wes
tern
Mo
un
tain
Hill
Tera
i
Development Region Ecological region
27.8 18.5
49.4
4.2 5.4
25.2
69.4
Figure 3.3.27 Region wise distribution of total YLL due to Hypertensive disorders of Pregnancy
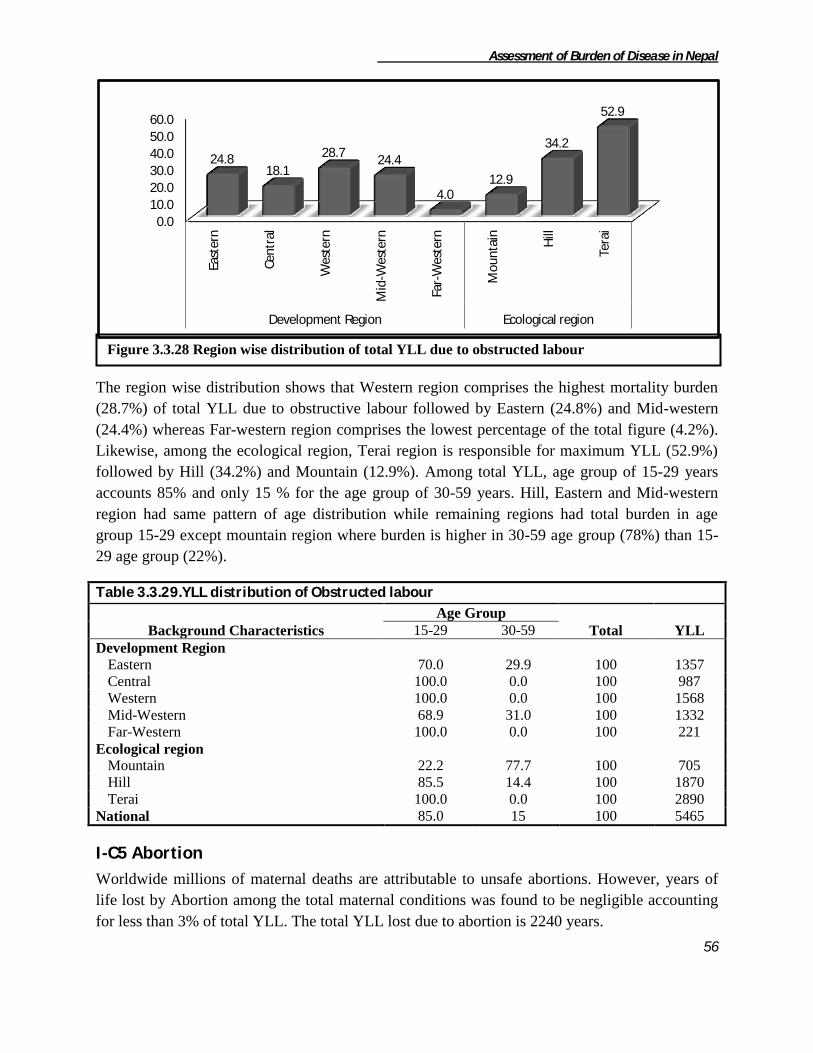
Assessment of Burden of Disease in Nepal
56
The region wise distribution shows that Western region comprises the highest mortality burden
(28.7%) of total YLL due to obstructive labour followed by Eastern (24.8%) and Mid-western
(24.4%) whereas Far-western region comprises the lowest percentage of the total figure (4.2%).
Likewise, among the ecological region, Terai region is responsible for maximum YLL (52.9%)
followed by Hill (34.2%) and Mountain (12.9%). Among total YLL, age group of 15-29 years
accounts 85% and only 15 % for the age group of 30-59 years. Hill, Eastern and Mid-western
region had same pattern of age distribution while remaining regions had total burden in age
group 15-29 except mountain region where burden is higher in 30-59 age group (78%) than 15-
29 age group (22%).
Table 3.3.29.YLL distribution of Obstructed labour
Background Characteristics
Age Group
Total YLL 15-29 30-59
Development Region
Eastern 70.0 29.9 100 1357
Central 100.0 0.0 100 987
Western 100.0 0.0 100 1568
Mid-Western 68.9 31.0 100 1332
Far-Western 100.0 0.0 100 221
Ecological region
Mountain 22.2 77.7 100 705
Hill 85.5 14.4 100 1870
Terai 100.0 0.0 100 2890
National 85.0 15 100 5465
I-C5 Abortion
Worldwide millions of maternal deaths are attributable to unsafe abortions. However, years of
life lost by Abortion among the total maternal conditions was found to be negligible accounting
for less than 3% of total YLL. The total YLL lost due to abortion is 2240 years.
0.0
10.0
20.0
30.0
40.0
50.0
60.0
East
ern
Cen
tral
Wes
tern
Mid
-Wes
tern
Far-
Wes
tern
Mo
un
tain
Hill
Tera
i
Development Region Ecological region
24.8 18.1
28.7 24.4
4.0 12.9
34.2
52.9
Figure 3.3.28 Region wise distribution of total YLL due to obstructed labour

Assessment of Burden of Disease in Nepal
57
The region wise distribution shows that Central region covers the highest mortality burden (75%)
of total YLL due to Abortion whereas Mid-western region comprises the lowest percentage of
the total figure (5.3%). Likewise, among the ecological region, Hill region is responsible for
maximum YLL (75%) followed by Terai (14%) and Mountain (10.9%). The mortality burden
was found to be more or less similar to the both age group i.e.58% and 41% respectively. Region
wise distribution shows similar age distribution like that of national in Hill, Central and Far-
Western region while total burden in Terai and Mid-Western region was in 15-29 age group and
that in Eastern and Mountain region was just opposite.
Table 3.3.30. YLL distribution of Abortion
Background Characteristics
Age Group
Total YLL 15-29 30-59
Development Region
Eastern 0.0 100.0 100 134
Central 59.7 40.2 100 1681
Mid-Western 100.0 0.0 100 119
Far-Western 64.0 35.9 100 306
Eco-Region
Mountain 0.0 100.0 100 244
Hill 59.7 40.2 100 1681
Terai 100.0 0.0 100 314
National 58.8 41.1 100 2240
I-C6 Other Maternal Conditions Maternal mortality rate in Nepal is getting more alarming every year. Here the total YLL
responsible for other maternal conditions is 22668 years of life lostwhich is about 36% of the
total YLL lost due to maternal conditions.
0.0 10.0 20.0 30.0 40.0 50.0 60.0 70.0 80.0
East
ern
Cen
tral
Wes
tern
Mid
-Wes
tern
Far-
Wes
tern
Mo
un
tain
Hill
Tera
i
Development Region Ecological Region
6.0
75.0
0.0 5.3
13.7 10.9
75.0
14.0
Figure 3.3.29.Region wise distribution of total YLL due to Abortion

Assessment of Burden of Disease in Nepal
58
The region wise distribution shows that Central region holds the highest mortality burden
(37.4%) of total YLL due to other maternal conditions whereas Far-western region comprises the
lowest percentage of the total figure (7.2%). Likewise, among the ecological region, Hill region
is responsible for maximum YLL (55.8%) followed by Terai (38.9%) and Mountain (5.2%). Age
wise distribution shows higher burden in age group 15-29 (60.5%) than 30-59 (39.5%). Similar
pattern is observed in all regions higher in age group 15-29 than 30-59.
Table 3.3.31. YLL distribution of Other maternal conditions
Background Characteristics Age Group
Total YLL 15-29 30-59
Development Region
Eastern 59.9 40.0 100 2888
Central 57.1 42.8 100 8475
Western 65.7 34.2 100 5269
Mid-Western 61.9 38.1 100 4394
Far-Western 58.1 41.9 100 1642
Ecological region
Mountain 86.8 13.1 100 1190
Hill 57.8 42.1 100 12657
Terai 60.7 39.2 100 8822
National 60.5 39.4 100 22668
I-D Neonatal Conditions
Altogether 291336 YLL had been lost due to neonatal conditions which are responsible for 28%
of total YLL due to Group I category. The region wise distribution of mortality burden due to
Nutritional deficiencies shows that Far-western development region is the highest contributor
(24.5%) of the total YLL whereas Eastern development region comprises the lowest percentage
of the total figure (11.4%). Similarly distribution of ecological region, Terai area accounts the
highest (39.1%) and the lowest percentage was found in mountain region (27.7%).
0.0
10.0
20.0
30.0
40.0
50.0
60.0
East
ern
Cen
tral
Wes
tern
Mid
-Wes
tern
Far-
Wes
tern
Mo
un
tain
Hill
Tera
i
Development Region Ecological region
12.7
37.4
23.2 19.4
7.2 5.2
55.8
38.9
Figure 3.3.30 Region wise distribution of total YLL due to other maternal conditions

Assessment of Burden of Disease in Nepal
59
The YLL distribution due to Low birth weight, Birth asphyxia and birth trauma, and Other
perinatal conditions is shown in the Table 3.3.32. As shown in the table Low birth weight
comprises the least count for the mortality burden due to neonatal conditions which is only 4.9%.
Likewise birth asphyxia and birth trauma comprises 28.3% and the highest count was of other
perinatal conditions which is 66.7%. Region wise distribution of YLL among the diseases under
Neonatal conditions is also similar to national, however percentage share is little different. Share
of other perinatal conditions in mountain region (59.9%) is lower than national share (66.7%)
while remaining ecological regions has similar share. Likewise share of other perinatal
conditions among the development regions is higher in Far-Western (71%) and Eastern (79%)
than national. However, its share is lower in Western and similar in remaining two regions.
Table 3.3.32. YLL distribution of Neonatal Conditions
Neonatal Conditions Development Region Eco-Region
National E C W MW FW M H T
Low birth weight 1.1 2.1 5.6 7.0 9.3 7.9 7.9 2.7 4.9
Birth asphyxia and birth
trauma 19.9 32.9 36.9 24.4 19.3 32.0 24.5 29.5 28.3
Other perinatal
conditions 78.9 64.9 57.3 68.4 71.4 59.9 67.5 67.6 66.7
Total 100 100 100 100 100 100 100 100 100
Total YLL 46658 72152 78855 44012 49658 32079 86872 172385 291336
I-D1 Low Birth Weight
Birth weight is closely associated with the health and survival of infants in the developing world.
Deficiencies in micronutrients are common in women in developing countries and have been
associated with low birth weight and preterm delivery. Years of life lost shared by Low birth
weight among the total neonatal conditions was found to be only 4% of total YLL i.e. 14264
0.0
10.0
20.0
30.0
40.0
50.0
60.0
East
ern
Cen
tral
Wes
tern
Mid
-wes
tern
Far-
wes
tern
Mo
un
tain
Hill
Tera
i
Development Region Ecological Region
16.0 24.8 27.1
15.1 17.0 11.0
29.8
59.2
Figure 3.3.31 Region wise distribution of total YLL due to Neonatal Conditions

Assessment of Burden of Disease in Nepal
60
YLL. The region wise distribution shows that Far-western region comprises the highest mortality
burden (32.4%) of total YLL due to Low birth weight followed by Western region (31.3%) and
Eastern region accounts the lowest percentage of the total figure (3.7%). Likewise, among the
ecological region, Hill region is responsible for maximum YLL (48.3%) followed by Terai
(33.7%) and Mountain (18%).
The mortality is found to be more or less similar between male and female group i.e. 52 and 47%
of total years of life lost respectively. In hilly region, male population holds twice mortality
burden than female population while this pattern is just reversed in Mountain region. In Terai
region male contributes 40% and female 59% of mortality burden. All the development regions
had similar burden as that of national except Eastern region in which burden is higher in female
(76%) than in male (23%).
Table 3.3.33. YLL distribution of Low birth weight
Background characteristics
Sex
Total YLL Male Female
Development Region
Eastern 23.5 76.4 100 521
Central 59.5 40.5 100 1543
Western 58.5 41.5 100 4471
Mid-Western 56.2 43.8 100 3113
Far-Western 52.1 47.8 100 4616
Ecological Region
Mountain 33.7 66.2 100 2561
Hill 66.8 33.2 100 6894
Terai 40.9 59.0 100 4809
National 52.1 47.8 100 14264
0.0
20.0
40.0
60.0 Ea
ster
n
Cen
tral
Wes
tern
Mid
-Wes
tern
Far-
Wes
tern
Mo
un
tain
Hill
Tera
i
Development Region Ecological Region
3.7 10.8
31.3 21.8
32.4
18.0
48.3
33.7
Figure 3.3.32 Region wise distribution of total YLL due to Low Birth Weight

Assessment of Burden of Disease in Nepal
61
I-D2 Birth asphyxia and birth trauma
Birth asphyxia is recognized as an important cause of neonatal morbidity and mortality. Birth
asphyxia and birth trauma are responsible for 28% of total YLL due to neonatal conditions i.e.
82531 years of life lost, among which the mortality for male population is found to be double of
female population.
The region wise distribution shows that Western region comprises the highest mortality burden
(35.3%) of total YLL due to Birth asphyxia and birth trauma whereas Eastern region accounts
the lowest percentage of the total figure (11.2%). Likewise, among the ecological region, Terai
region is responsible for maximum YLL (61.7%) whereas Mountain region holds the lowest of
the total figure (12.5%).
The region wise sex distribution for YLL shows that male population is responsible for double
mortality burden than female population. Distributing total years of life lost among ecological
0.0 10.0 20.0 30.0 40.0 50.0 60.0 70.0
East
ern
Cen
tral
Wes
tern
Mid
-Wes
tern
Far-
Wes
tern
Mo
un
tain
Hill
Tera
i
Development Region Ecological Region
11.2
28.8 35.3
13.0 11.6 12.5
25.8
61.7
Table 3.3.34. YLL distribution of Birth asphyxia and birth trauma
Background characteristics
Sex
Total YLL Male Female
Development Region
Eastern 76.8 23.1 100 9283
Central 80.0 19.9 100 23757
Western 57.1 42.8 100 29145
Mid-Western 57.8 42.1 100 10760
Far-Western 66.9 33.0 100 9586
Ecological Region
Mountain 64.9 35.0 100 10279
Hill 75.4 24.5 100 21319
Terai 64.1 35.8 100 50933
National 67.2 32.8 100 82531
Figure 3.3.33 Region wise distribution of total YLL due to Birth asphyxia and birth trauma
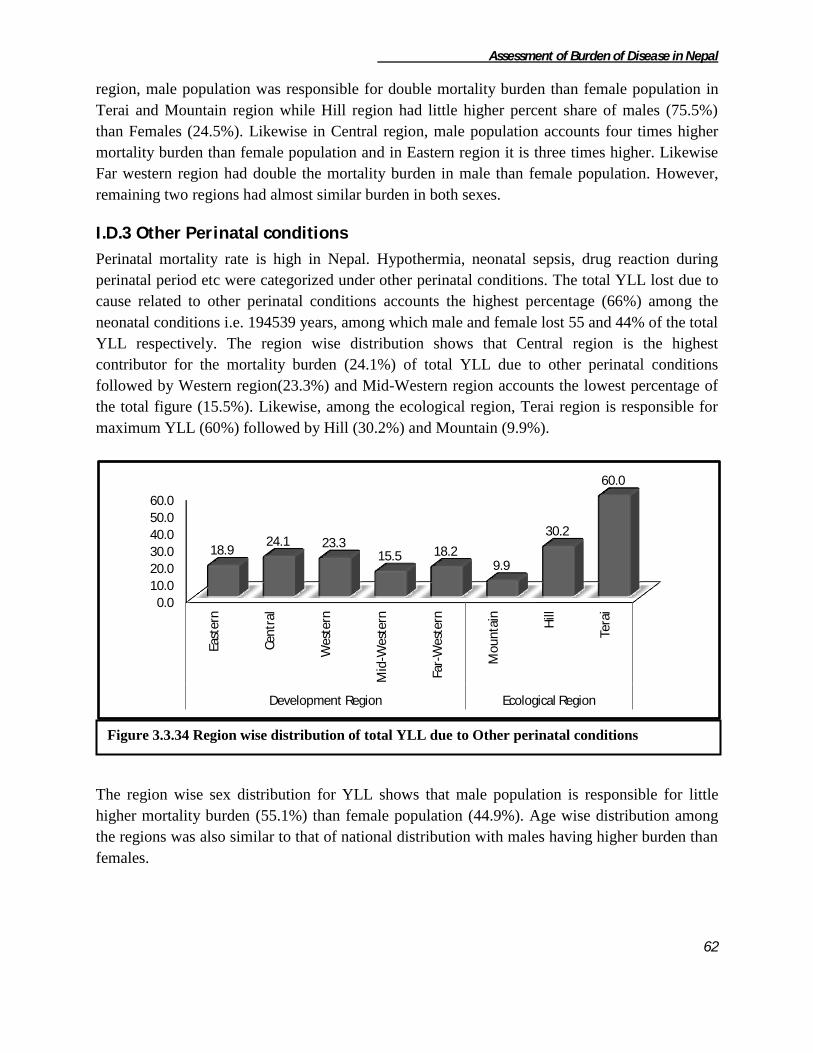
Assessment of Burden of Disease in Nepal
62
region, male population was responsible for double mortality burden than female population in
Terai and Mountain region while Hill region had little higher percent share of males (75.5%)
than Females (24.5%). Likewise in Central region, male population accounts four times higher
mortality burden than female population and in Eastern region it is three times higher. Likewise
Far western region had double the mortality burden in male than female population. However,
remaining two regions had almost similar burden in both sexes.
I.D.3 Other Perinatal conditions
Perinatal mortality rate is high in Nepal. Hypothermia, neonatal sepsis, drug reaction during
perinatal period etc were categorized under other perinatal conditions. The total YLL lost due to
cause related to other perinatal conditions accounts the highest percentage (66%) among the
neonatal conditions i.e. 194539 years, among which male and female lost 55 and 44% of the total
YLL respectively. The region wise distribution shows that Central region is the highest
contributor for the mortality burden (24.1%) of total YLL due to other perinatal conditions
followed by Western region(23.3%) and Mid-Western region accounts the lowest percentage of
the total figure (15.5%). Likewise, among the ecological region, Terai region is responsible for
maximum YLL (60%) followed by Hill (30.2%) and Mountain (9.9%).
The region wise sex distribution for YLL shows that male population is responsible for little
higher mortality burden (55.1%) than female population (44.9%). Age wise distribution among
the regions was also similar to that of national distribution with males having higher burden than
females.
0.0
10.0
20.0
30.0
40.0
50.0
60.0
East
ern
Cen
tral
Wes
tern
Mid
-Wes
tern
Far-
Wes
tern
Mo
un
tain
Hill
Tera
i
Development Region Ecological Region
18.9 24.1 23.3
15.5 18.2 9.9
30.2
60.0
Figure 3.3.34 Region wise distribution of total YLL due to Other perinatal conditions

Assessment of Burden of Disease in Nepal
63
Table 3.3.35. YLL distribution of Other perinatal conditions
Background characteristics Sex
Total YLL Male Female
Development Region
Eastern 63.5 36.4 100 36854
Central 52.8 47.2 100 46853
Western 50.4 49.5 100 45238
Mid-Western 50.5 49.4 100 30139
Far-Western 59.3 40.6 100 35455
Ecological Region
Mountain 60.1 39.8 100 19238
Hill 57.3 42.6 100 58659
Terai 53.2 46.7 100 116642
National 55.1 44.8 100 194539
I.E. Nutritional Deficiencies
Altogether 36248 YLL had been lost due to neonatal conditions which accounts for 28% of total
YLL due to Group I category. The region wise distribution of mortality burden due to Nutritional
deficiencies shows that Far-western development region is the highest contributor (24.5%) of the
total YLL whereas Eastern development region comprises the lowest percentage of the total
figure (11.4%). Similarly distribution of ecological region, Terai area accounts the highest
(39.1%) and the lowest percentage was found in mountain region (27.7%).
The YLL distribution due to Protein-Energy malnutrition (PEM), Iron-deficiency anaemia (IDA)
and other nutritional disorders is shown in the Table 3.3.36. As given in the table below PEM is
the highest contributor for the mortality burden due to nutritional deficiencies i.e. 92.7%
followed by IDA which holds 6.9% and the least count were found for the category of other
0.0 5.0
10.0 15.0 20.0 25.0 30.0 35.0 40.0
East
ern
Cen
tral
Wes
tern
Mid
-wes
tern
Far-
wes
tern
Mo
un
tain
Hill
Tera
i
Development Region Ecological Region
11.4
21.3 23.5 19.3
24.5 27.7
33.2 39.1
Figure 3.3.35 Region wise distribution of total YLL due to Nutritional deficiencies

Assessment of Burden of Disease in Nepal
64
nutritional disorders which lists only 0.3%. Region wise distribution of YLL among the disease
categories is almost similar to national however percent share is little different across the
regions. Among the regions, burden of PEM was found to be much higher in Mountain region
(99.2%) and Far-Western region (97.9%) than national (92.7%) while Terai and Mid-Western
region had similar share (93%) as that of national. Likewise, Hill, Central and Western region
had little lower share (86%) of PEM than national. Particularly in Eastern region, total burden
due to nutritional deficiencies was contributed by PEM. Burden of IDA was found to be two
times higher in Hill, Central and Western region than national (6.9%).
Table 3.3.36. YLL distribution of Nutritional Deficiencies
Nutritional Deficiencies Development Region Eco-Region
National E C W MW FW M H T
Protein-energy malnutrition 100.0 87.10 87.7 93.9 97.9 99.2 86.1 93.6 92.7
Iron-deficiency anaemia 0.0 12.9 12.2 5.3 1.0 0.7 13.8 5.3 6.9
Other nutritional disorders 0.0 0.0 0.0 0.7 1.0 0.0 0.0 1.0 0.3
Total 100 100 100 100 100 100 100 100 100
Total YLL 4143 7714 8501 7000 8890 10027 12051 14170 36248
I-E1 Protein-Energy Malnutrition Malnutrition in Nepal is one of the major problems that people have been facing since a long
time. Nepal has made large strides in reducing other nutritional deficiencies; however PEM
remains at a high prevalence. PEM was the major cause of mortality among the total nutritional
deficiencies comprising approximately 92 percent (33603 YLL) of total YLL.
The region wise distribution of mortality burden due to PEM shows that Far-western
development region was the highest contributor (25.9%) of the total YLL whereas Eastern region
comprised the lowest percentage of the total figure (12.3%). Similarly distribution of ecological
0.0 5.0
10.0 15.0 20.0 25.0 30.0 35.0 40.0
East
ern
Cen
tral
Wes
tern
Mid
-Wes
tern
Far-
Wes
tern
Mo
un
tain
Hill
Tera
i
Development Region Ecological Region
12.3
20.0 22.2 19.6 25.9
29.6 30.9
39.5
Figure 3.3.36 Region wise distribution of total YLL due to Protein Energy Malnutrition

Assessment of Burden of Disease in Nepal
65
region, Terai area accounted the highest (39.5%) followed by Hill (30.9%) and Mountain
(29.6%).
Table 3.3.37. YLL distribution of Protein-energy malnutrition
Background Characteristics
Age Group
Total YLL 0-14 30-59 60+
Development Region
Eastern
Male 100.0 0.0 0.0 100 2540
Female 100.0 0.0 0.0 100 1603
Total 100.0 0.0 0.0 100 4143
Central
Male 100.0 0.0 0.0 100 1793
Female 96.8 3.1 0.0 100 4927
Total 97.7 2.2 0.0 100 6720
Western
Male 100.0 0.0 0.0 100 3389
Female 100.0 0.0 0.0 100 4069
Total 100.0 0.0 0.0 100 7458
Mid-Western
Male 99.3 0.0 0.6 100 3500
Female 100.0 0.0 100 3073
Total 99.6 0.0 0.3 100 6573
Far-Western
Male 95.1 0.0 4.8 100 3089
Female 96.8 0.0 3.1 100 5621
Total 96.2 0.0 3.7 100 8710
Ecological region
Mountain
Male 100.0 0.0 0.0 100 5125
Female 96.8 3.1 0.0 100 4829
Total 98.4 1.5 0.0 100 9954
Hill
Male 100.0 0.0 0.00 100 5154
Female 97.7 0.0 2.3 100 5225
Total 98.8 0.0 1.1 100 10379
Terai
Male 95.6 0.0 4.3 100 4033
Female 99.3 0.0 0.6 100 9238
Total 98.2 0.0 1.7 100 13271
National
Male 98.7 0.0 1.2 100 14311
Female 98.2 0.8 0.9 100 19292
Total 98.4 0.4 1.0 100 33603
According to the table 3.3.37, most of the total YLL lost due to PEM was estimated to be in age
group of 0-14 age group (98%). The mortality burden in female population (19292 YLL) was
greater than male (14311 YLL). Age wise distribution of YLL among all the regions was similar
to national distribution. Particularly in Eastern and Western region, total burden was in age group
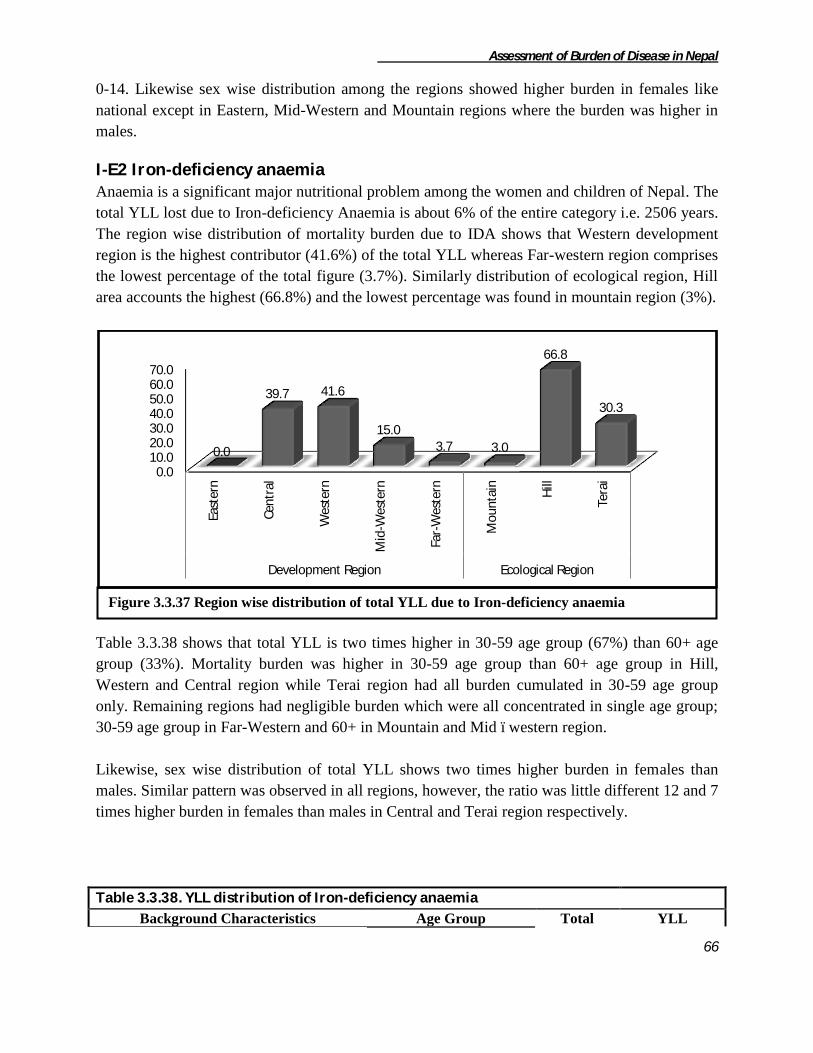
Assessment of Burden of Disease in Nepal
66
0-14. Likewise sex wise distribution among the regions showed higher burden in females like
national except in Eastern, Mid-Western and Mountain regions where the burden was higher in
males.
I-E2 Iron-deficiency anaemia Anaemia is a significant major nutritional problem among the women and children of Nepal. The
total YLL lost due to Iron-deficiency Anaemia is about 6% of the entire category i.e. 2506 years.
The region wise distribution of mortality burden due to IDA shows that Western development
region is the highest contributor (41.6%) of the total YLL whereas Far-western region comprises
the lowest percentage of the total figure (3.7%). Similarly distribution of ecological region, Hill
area accounts the highest (66.8%) and the lowest percentage was found in mountain region (3%).
Table 3.3.38 shows that total YLL is two times higher in 30-59 age group (67%) than 60+ age
group (33%). Mortality burden was higher in 30-59 age group than 60+ age group in Hill,
Western and Central region while Terai region had all burden cumulated in 30-59 age group
only. Remaining regions had negligible burden which were all concentrated in single age group;
30-59 age group in Far-Western and 60+ in Mountain and Mid –western region.
Likewise, sex wise distribution of total YLL shows two times higher burden in females than
males. Similar pattern was observed in all regions, however, the ratio was little different 12 and 7
times higher burden in females than males in Central and Terai region respectively.
Table 3.3.38. YLL distribution of Iron-deficiency anaemia
Background Characteristics Age Group Total YLL
0.0 10.0 20.0 30.0 40.0 50.0 60.0 70.0
East
ern
Cen
tral
Wes
tern
Mid
-Wes
tern
Far-
Wes
tern
Mo
un
tain
Hill
Tera
i
Development Region Ecological Region
0.0
39.7 41.6
15.0 3.7 3.0
66.8
30.3
Figure 3.3.37 Region wise distribution of total YLL due to Iron-deficiency anaemia
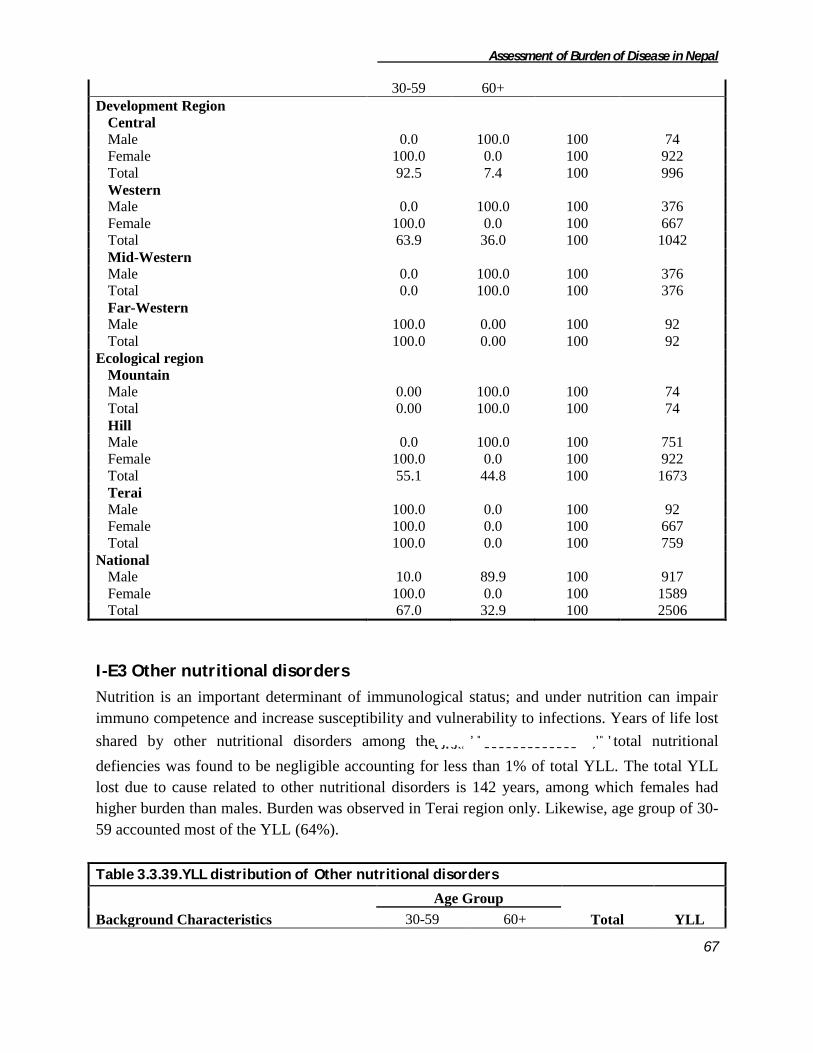
Assessment of Burden of Disease in Nepal
67
30-59 60+
Development Region
Central
Male 0.0 100.0 100 74
Female 100.0 0.0 100 922
Total 92.5 7.4 100 996
Western
Male 0.0 100.0 100 376
Female 100.0 0.0 100 667
Total 63.9 36.0 100 1042
Mid-Western
Male 0.0 100.0 100 376
Total 0.0 100.0 100 376
Far-Western
Male 100.0 0.00 100 92
Total 100.0 0.00 100 92
Ecological region
Mountain
Male 0.00 100.0 100 74
Total 0.00 100.0 100 74
Hill
Male 0.0 100.0 100 751
Female 100.0 0.0 100 922
Total 55.1 44.8 100 1673
Terai
Male 100.0 0.0 100 92
Female 100.0 0.0 100 667
Total 100.0 0.0 100 759
National
Male 10.0 89.9 100 917
Female 100.0 0.0 100 1589
Total 67.0 32.9 100 2506
I-E3 Other nutritional disorders
Nutrition is an important determinant of immunological status; and under nutrition can impair
immuno competence and increase susceptibility and vulnerability to infections. Years of life lost
shared by other nutritional disorders among theutritionasssssssssssss jfaftotal nutritional
defiencies was found to be negligible accounting for less than 1% of total YLL. The total YLL
lost due to cause related to other nutritional disorders is 142 years, among which females had
higher burden than males. Burden was observed in Terai region only. Likewise, age group of 30-
59 accounted most of the YLL (64%).
Table 3.3.39.YLL distribution of Other nutritional disorders
Background Characteristics
Age Group
Total YLL 30-59 60+

Assessment of Burden of Disease in Nepal
68
Development Region
Mid-Western
Male 0.0 100.0 100 24
Female 0.0 100.0 100 27
Total 0.0 100.0 100 51
Far-Western
Female 100.0 0.0 100 91
Total 100.0 0.0 100 91
Ecological region
Terai
Male 0.0 100.0 100. 24
Female 77.1 22.8 100 118
Total 64.0 35.9 100 142
National
Male 0.0 100.0 100 24
Female 77.1 22.8 100 118
Total 64.0 35.9 100 142

Assessment of Burden of Disease in Nepal
69
3.4 Group II: Non-Communicable Diseases
Most of the developing countries like Nepal are suffering gravely from double burden of disease
i.e. of communicable as well as non-communicable diseases. The group-II, non-communicable
diseases share significant portion of mortality burden in Nepal. It was the second largest group
accounting 36.1 percent (830668 years of life lost) of total burden of mortality throughout the
country. The group-II YLL distribution was observed highest (49.4%) in terai and lowest (11%)
in mountain region of Nepal. The development region wise distribution of YLL showed highest
by central and western development region contributing 27.4 percent each and lowest by far-
western development region of Nepal.
The National Burden of Disease Manual 2000 classifies non-communicable disease into 14 sub
groups. Mortality due to all sub-groups is present in this study except the "oral conditions".
Table 3.4.1 shows the YLL distribution of non-communicable diseases according to its
subgroups. More than 60 percent of mortality burden in this category were accounted by
cardiovascular, respiratory and digestives diseases only. Respiratory disease was the leading
cause to contribute 32.5 percent of total years of life lost of this group and least (0.2 percent) was
contributed by endocrine disorders nationally. Similar to the national, ecological distribution also
shows respiratory disease to contribute highest share 39.2, 35, 29.1 percent in mountain, hill and
terai respectively and endocrine disorders contributed lowest percent in mountain and terai
region sharing 0.3 percent each. In hill region lowest contribution was observed due to skin
diseases (0.1 percent) while endocrine disorders and sense organ diseases did not accounted any
percent among non-communicable diseases. The ecological region wise distribution also shows
Figure: 3.4.1 Percentage YLL distribution due to Non-Communicable diseases

Assessment of Burden of Disease in Nepal
70
the similar sharing highest was contributed by respiratory diseases and endocrine disorders
contributed lowest percent in mid (0.2%) and far western (0.1%) development region. In
western and central development region skin diseases contributed least 0.3 percent and 0.1
percent respectively while in eastern development region sense organ diseases shared least
percent i.e. 0.3 percent among the non communicable diseases.
E C W MW FW M H T
1 Malignant neoplasms 8.7 8.4 7.5 7.1 6.7 5.5 8.7 7.8 7.9
2 Other neoplasms 5.9 5.4 2.8 4.2 3.6 2.4 3.6 5.7 4.5
3 Diabetes mellitus 2.9 3.0 3.5 2.6 0.8 0.5 2.8 3.3 2.8
4 Endocrine disorders 0.0 0.4 0.0 0.2 0.1 0.3 0.0 0.3 0.2
5 Neuropsychiatric disorders 11.0 5.9 8.1 6.0 6.3 5.1 7.2 8.5 7.6
6 Sense organ diseases 0.3 0.4 0.0 0.0 0.8 0.7 0.0 0.4 0.3
7 Cardiovascular diseases 19.9 21.6 17.7 18.4 15.3 18.4 20.0 18.6 19.2
8 Respiratory diseases 27.9 31.5 34.9 37.2 31.8 39.2 35.0 29.1 32.5
9 Digestive diseases 12.3 10.7 15.0 11.1 18.5 12.5 10.9 14.4 12.8
10 Genito-urinary diseases 6.8 10.6 7.0 9.4 10.0 10.8 8.8 8.1 8.6
11 Skin diseases 0.7 0.1 0.3 0.3 0.8 0.7 0.1 0.5 0.4
12 Musculoskeletal diseases 0.3 1.0 0.9 0.9 0.4 0.5 0.8 0.8 0.8
13 Congenital anomalies 1.9 1.0 1.9 1.8 4.9 3.0 1.5 2.1 1.9
14 Blood Disorder 1.4 0.0 0.4 0.8 0.0 0.4 0.6 0.5 0.6
Total 100 100 100 100 100 100 100 100 100
Total YLL 184881 227460 192535 147647 78145 91619 329099 409950 830668
Development Region Eco-RegionS.N.
Non-Communicable
DiseasesNational
Table 3.4.1: Percentage YLL distribution of Non Communicable diseases

Assessment of Burden of Disease in Nepal
71
Among the non-communicable diseases COPD was the leading cause of YLL contributing 31.7
percent nationally. Cerbrovascular diseases followed it by sharing 8.3 percent out of total.
Ischemic heart disease, hypertensive heart disease were the following cause of YLL contributing
3.7 and 3.2 percent respectively. Similarly Diabetes mellitus was observed at the top fifth rank
sharing 2.8 percent of YLL among the non communicable diseases. Colon and rectum cancer
was at the twentieth position among of this category contributing only 0.3 percent of YLL.
Table 3.4.2: Top 20 causes of YLL due to sub categories of Non-communicable diseases
Rank Disease category YLL Percent
1 COPD 263734 31.750
2 Cerebrovascular disease 69750 8.397
3 Ischaemic heart disease 31028 3.735
4 Hypertensive heart disease 27133 3.266
5 Diabetes mellitus 23308 2.806
6 Epilepsy 20790 2.503
7 Peptic ulcer disease 15913 1.916
8 Stomach cancer 15574 1.875
9 Trachea, bronchus and lung cancers 15099 1.818
10 Cervix uteri cancer 14849 1.788
11 Alcohol use disorders 14525 1.749
12 Cirrhosis of the liver 13200 1.589
13 Mouth and oropharynx cancers 10348 1.246
14 Unclassified Congenital Anomalies 6332 0.762
15 Nephritis and nephrosis 5599 0.674
16 Blood disorder 4621 0.556
17 Liver cancer 3321 0.400
18 Skin diseases 3097 0.373
19 Asthma 3085 0.371
20 Colon and rectum cancers 2794 0.336
II-A Malignant neoplasms
Cancer is a worldwide public health problem and it accounts for an increasing proportion of all
premature deaths. Malignant diseases are the second most frequent cause of death in developed
countries after cardiovascular disease while in developing countries, it accounts significant
portion of premature mortality. This study revealed that malignant neoplasm holds fifth rank
among causes of deaths due to non-communicable diseases. Altogether 65370 years of life lost
had been reported by malignant neoplasms. The YLL contribution due to malignant neoplasm
was observed highest (76 %) in Terai region of Nepal. Both mountain and hill region contributed
equal percentage (12 %) of remaining YLL due to malignant neoplasms. Similarly, the

Assessment of Burden of Disease in Nepal
72
development wise distribution showed majority of YLL (46 %) shared by central development
region and the least YLL (13%) was observed in far-western development region.
Among the malignant neoplasms, more than 20 percent of YLL was contributed by stomach
cancer, trachea, bronchus and lung cancer and cancer of cervix. Least percent was shared by
leukemia among malignant neoplasms category. The ecological distribution shows, stomach
cancer to contribute highest share (30.4 %) and lowest share (2.8 percent) by bladder cancer in
mountain region. In hill trachea, bronchus and lung cancer (36.3 %) was the leading cause of
YLL and lowest share was contributed by oesophagus cancer.
Similarly in terai region cervix cancer was the leading cause (31.9 percent) of YLL and least
E C W MW FW M H T
1 Mouth and oropharynx cancers 21.5 15.0 12.2 13.1 16.8 19.0 17.5 13.8 15.8
2 Cervix cancer 18.3 25.6 27.9 17.8 21.7 8.3 15.0 31.9 22.7
3 Bladder cancer 0.0 2.1 0.0 0.0 1.3 2.8 0.0 1.0 0.7
4 Leukaemia 0.0 0.0 2.3 0.0 0.0 0.0 0.0 1.0 0.5
5 Other malignant neoplasms 2.2 0.0 0.0 2.0 3.6 4.1 0.0 1.7 1.1
6 Oesophagus cancer 1.0 0.0 0.0 0.0 4.7 0.0 0.9 0.5 0.6
7 Stomach cancer 23.1 26.9 22.6 22.1 21.9 30.4 20.7 25.6 23.8
8 Colon and rectum cancers 3.8 4.0 1.9 4.1 13.6 17.3 2.0 4.2 4.3
9 Liver cancer 9.7 4.2 3.9 1.7 4.3 0.0 7.6 3.6 5.1
10 Trachea, bronchus and lung cancers 17.7 18.9 27.4 39.3 10.7 10.0 36.3 13.3 23.1
11 Breast cancer 2.7 3.4 1.9 0.0 1.5 8.0 0.0 3.2 2.2
Total 100 100 100 100 100 100 100 100 100
Total YLL 16049 19161 14348 10545 5266 5042 28479 31849 65370
Development Region Eco-RegionMalignant neoplasms CategoriesS.N. National
Table 3.4.3: Percentage YLL distribution due to Malignant neoplasm categories
Figure 3.4.2: Percentage YLL distribution due to Malignant neoplasm categories

Assessment of Burden of Disease in Nepal
73
percent was contributed by oesophagus cancer (0.5 percent). Stomach cancer was found
contributing higher share of YLL in each development region except in western development
region where cervix cancer was observed to be the leading cause of YLL. Bladder cancer
contributed least percent in far-western and central development region, Colon and rectum and
breast cancer shared equal 1.9 % in western region. least contribution was observed by liver
cancer (1.7%) and oesophagus cancer (1%) in mid-western and eastern development region
respectively.
II-A1 Mouth and oropharynx
Mouth and oropharynx cancer is a common public health problem in Nepal. Altogether 10348
years of life lost had been contributed due to mouth and oropharynx cancer. The ecological
distribution of mouth and oropharynx cancer was observed highest in hill (48.2 percent) and
lowest in mountain (9.3 percent). Similarly the development wise distribution shows highest
(33.4%) in eastern development and lowest (8.6%) in far-western development region.
The sex wise distribution of mouth and oropharynx cancer shows YLL shared by males is 1.5
times more than the females and highest YLL was contributed by elderly (60+) age group i.e.
52.3 percent nationally. Although about 7.7 percent of males of very young age i.e. 0-14 years
were also observed to be affected by mouth and oropharynx cancer. Ecological distribution of
mouth and oropharynx cancer was observed 3 times more in males than females in terai, 1.5
times more than females in mountain but found almost equal in hill region of Nepal. Similarly,
the development region wise distribution shows male YLL to be more in all the development
regions except in western and mid western development regions where females YLL was
observed to be more than males. At the same time around half of the years of life lost in western
region were contributed by the age group 0-14 years.
Figure 3.4.3: Percentage YLL distribution of Mouth and Oropharynx Cancer
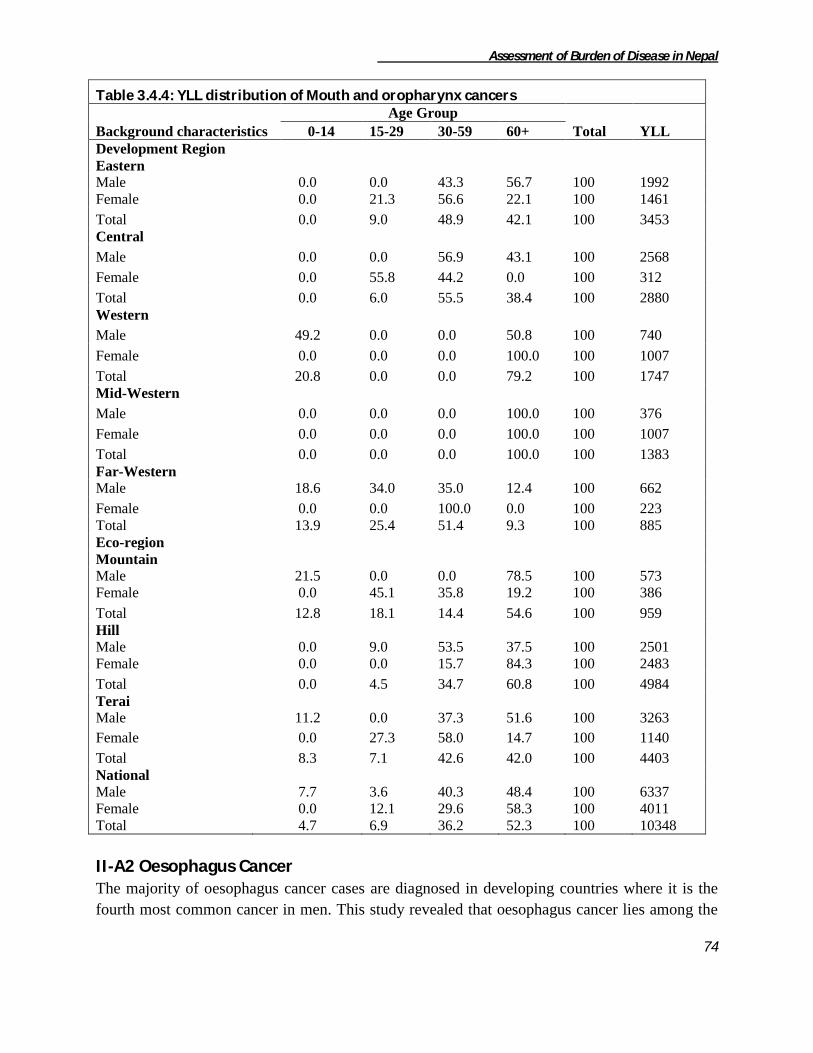
Assessment of Burden of Disease in Nepal
74
Table 3.4.4: YLL distribution of Mouth and oropharynx cancers
Background characteristics
Age Group
Total YLL 0-14 15-29 30-59 60+
Development Region
Eastern
Male 0.0 0.0 43.3 56.7 100 1992
Female 0.0 21.3 56.6 22.1 100 1461
Total 0.0 9.0 48.9 42.1 100 3453
Central
Male 0.0 0.0 56.9 43.1 100 2568
Female 0.0 55.8 44.2 0.0 100 312
Total 0.0 6.0 55.5 38.4 100 2880
Western
Male 49.2 0.0 0.0 50.8 100 740
Female 0.0 0.0 0.0 100.0 100 1007
Total 20.8 0.0 0.0 79.2 100 1747
Mid-Western
Male 0.0 0.0 0.0 100.0 100 376
Female 0.0 0.0 0.0 100.0 100 1007
Total 0.0 0.0 0.0 100.0 100 1383
Far-Western
Male 18.6 34.0 35.0 12.4 100 662
Female 0.0 0.0 100.0 0.0 100 223
Total 13.9 25.4 51.4 9.3 100 885
Eco-region
Mountain
Male 21.5 0.0 0.0 78.5 100 573
Female 0.0 45.1 35.8 19.2 100 386
Total 12.8 18.1 14.4 54.6 100 959
Hill
Male 0.0 9.0 53.5 37.5 100 2501
Female 0.0 0.0 15.7 84.3 100 2483
Total 0.0 4.5 34.7 60.8 100 4984
Terai
Male 11.2 0.0 37.3 51.6 100 3263
Female 0.0 27.3 58.0 14.7 100 1140
Total 8.3 7.1 42.6 42.0 100 4403
National
Male 7.7 3.6 40.3 48.4 100 6337
Female 0.0 12.1 29.6 58.3 100 4011
Total 4.7 6.9 36.2 52.3 100 10348
II-A2 Oesophagus Cancer The majority of oesophagus cancer cases are diagnosed in developing countries where it is the
fourth most common cancer in men. This study revealed that oesophagus cancer lies among the

Assessment of Burden of Disease in Nepal
75
top ten malignant cancers in Nepal. Oesophagus cancer was observed contributing 413 years of
life lost which was 0.6 percent among the malignant cancers. The cancer was observed only in
hill and terai region of Nepal and among which highest was accounted by hill region (59.3%)
Similarly development region-wise distribution also showed the YLL contribution from only two
regions i.e. eastern and far-western development regions and among them highest percent
(59.3%) of oesophagus cancer was observed in far-western development region.
Table 3.4.5: YLL distribution of Oesophagus cancer
Background characteristics Sex
Total YLL Male Female
Development Region
Eastern 0.0 100.0 100 168
Far-Western 51.0 49.0 100 245
Eco-region
Hill 51.0 49.0 100 245
Terai 0.0 100.0 100 168
National 30.3 69.7 100 413
The following table 3.4.4 shows the age-sex wise YLL distribution of oesophagus cancer. The
cancer was entirely reported from the elderly males and females group. Majority of the cancer
was observed among elderly female group. YLL due to oesophagus cancer in Eastern
development and terai region was receorded among females group only.
II-A3 Stomach Cancer Stomach cancer is one of the common types of cancer among males in the developing countries.
Usually lung cancer is the most frequent and is followed by stomach cancer. This study showed
stomach cancer as the leading cause of years of life lost contributing 23.8 percent among
malignant neoplasms which was about 15573 years of life lost in a whole. This cancer was
distributed in all development as well as ecological regions of Nepal.
Figure 3.4.4: Percentage YLL distribution due to Stomach Cancer

Assessment of Burden of Disease in Nepal
76
The ecological distribution of stomach cancer was observed highest in terai (52.3) and lowest in
mountain (9.9%). Similarly the development wise distribution shows highest (33.1%) in central
development and lowest (7.4%) in far-western development region.
Table 3.4.6: YLL distribution of Stomach cancer
Background characteristics
Age Group
Total YLL 15-29 30-59 60+
Development Region
Eastern
Male 0.0 52.8 47.2 100 1034
Female 0.0 57.6 42.4 100 2669
Total 0.0 56.3 43.7 100 3703
Central
Male 0.0 60.1 39.9 100 1672
Female 0.0 78.7 21.3 100 3478
Total 0.0 72.7 27.3 100 5150
Western
Male 0.0 22.1 77.9 100 1247
Female 0.0 44.0 56.0 100 1994
Total 0.0 35.6 64.4 100 3241
Mid-Western
Male 0.0 20.2 79.8 100 1279
Female 0.0 8.2 91.8 100 1047
Total 0.0 14.8 85.2 100 2326
Far-Western
Male 0.0 60.2 39.8 100 550
Female 31.7 51.6 16.7 100 605
Total 16.6 55.7 27.7 100 1155
Eco-region
Mountain
Male 0.0 26.1 73.9 100 1037
Female 0.0 71.0 29.0 100 497
Total 0.0 40.7 59.3 100 1534
Hill
Male 0.0 7.4 92.6 100 2190
Female 0.0 33.2 66.8 100 3706
Total 0.0 23.6 76.4 100 5896
Terai
Male 0.0 77.7 22.3 100 2556
Female 3.4 71.0 25.6 100 5588
Total 2.4 73.1 24.5 100 8144
National
Male 0.0 41.8 58.2 100 5783
Female 2.0 56.7 41.4 100 9790
Total 1.2 51.2 47.6 100 15573

Assessment of Burden of Disease in Nepal
77
The following table 3.4.5 shows total years of life lost distribution due to stomach cancer.
Altogether 15573 YLL was lost due to stomach cancer. The sex wise distribution shows females
reporting two times more years of life lost burden than males nationally. In all eco-development
regions females group accounted more YLL than males except in mid-western and mountain
region of Nepal. The YLL distribution was observed only after the age of 15 years and only in
terai and far western regions it was observed in the age group 15-29. About more than 90 percent
of years of life lost was recorded in the age group above thirty years.
II-A4 Colon and rectum Cancer Colon and rectal cancer is sixth leading cause contributing 4.3 percent of total years of life lost
due to malignant neoplasms.
Occurrence of colon and rectal cancer was distributed in all development and ecological regions.
The ecological distribution of colon and rectum cancer was observed highest in terai (27.3%) and
lowest in hill (20.6%) regions of Nepal. Similarly the development wise distribution shows
highest (33.1%) in central and lowest (9.6%) in western development region.
Majority of colon and rectal cancer was observed in elderly population (45.3%) which was
followed by 30-59 years of age group accounting 31.6 percent. Similarly, 0-14 years and 15-29
years of age group contributed 11.8 and 11.3 percent YLL respectively. In all the eco-
development regions males were observed to contribute higher YLL except in mid-western
development region where entire burden was contributed by females group.
Figure 3.4.5: Percentage YLL distribution due to Colon and rectum Cancer
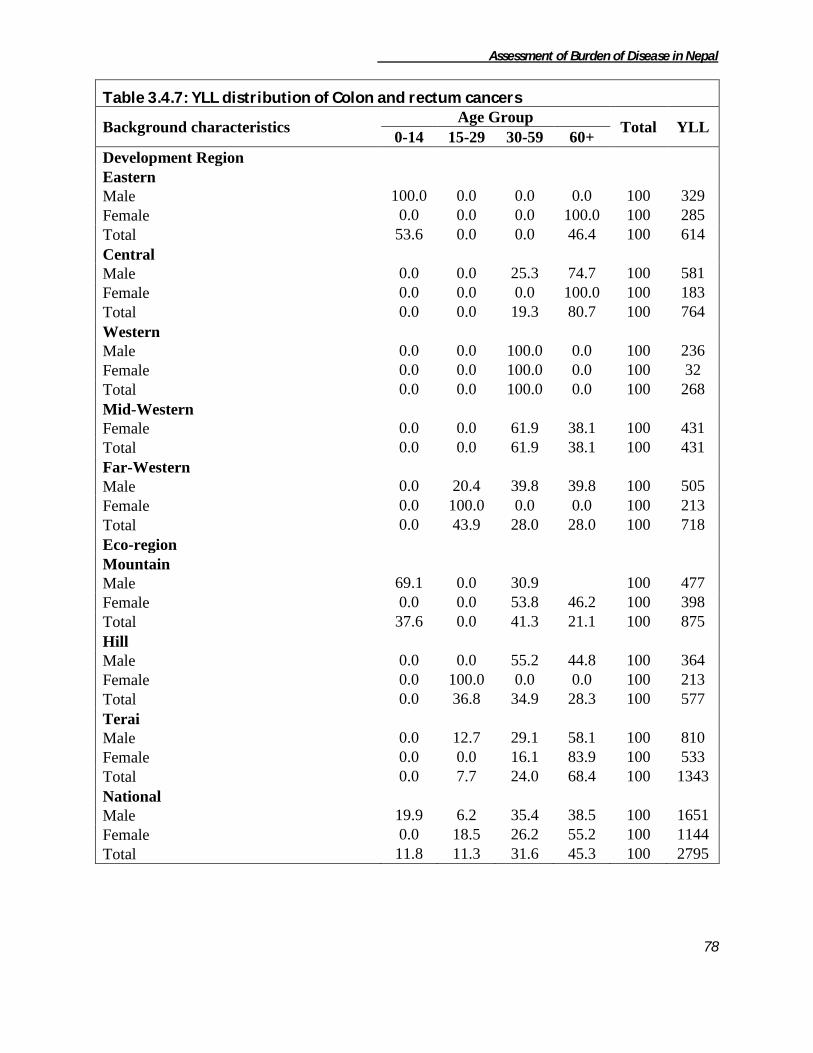
Assessment of Burden of Disease in Nepal
78
Table 3.4.7: YLL distribution of Colon and rectum cancers
Background characteristics Age Group
Total YLL 0-14 15-29 30-59 60+
Development Region
Eastern
Male 100.0 0.0 0.0 0.0 100 329
Female 0.0 0.0 0.0 100.0 100 285
Total 53.6 0.0 0.0 46.4 100 614
Central
Male 0.0 0.0 25.3 74.7 100 581
Female 0.0 0.0 0.0 100.0 100 183
Total 0.0 0.0 19.3 80.7 100 764
Western
Male 0.0 0.0 100.0 0.0 100 236
Female 0.0 0.0 100.0 0.0 100 32
Total 0.0 0.0 100.0 0.0 100 268
Mid-Western
Female 0.0 0.0 61.9 38.1 100 431
Total 0.0 0.0 61.9 38.1 100 431
Far-Western
Male 0.0 20.4 39.8 39.8 100 505
Female 0.0 100.0 0.0 0.0 100 213
Total 0.0 43.9 28.0 28.0 100 718
Eco-region
Mountain
Male 69.1 0.0 30.9 100 477
Female 0.0 0.0 53.8 46.2 100 398
Total 37.6 0.0 41.3 21.1 100 875
Hill
Male 0.0 0.0 55.2 44.8 100 364
Female 0.0 100.0 0.0 0.0 100 213
Total 0.0 36.8 34.9 28.3 100 577
Terai
Male 0.0 12.7 29.1 58.1 100 810
Female 0.0 0.0 16.1 83.9 100 533
Total 0.0 7.7 24.0 68.4 100 1343
National
Male 19.9 6.2 35.4 38.5 100 1651
Female 0.0 18.5 26.2 55.2 100 1144
Total 11.8 11.3 31.6 45.3 100 2795

Assessment of Burden of Disease in Nepal
79
II-A5 Liver Cancer Liver cancer, also called hepatocellular carcinoma is said to be fifth most common cancer in the
world. This study also revealed liver cancer to be the fifth leading cause contributing 5.1 percent
of years of life lost due to malignant neoplasms. Altogether 3322 years of life lost was accounted
due to liver cancer. Distribution of liver cancer was observed to be highest (65.2%) in hill region
which was followed by 34.8 percent in terai region while no cases were reported from mountain
region. Similarly, the development region wise distribution shows highest (46.7%) in eastern and
lowest (5.3%) in mid-western development region.
The age-wise distribution of liver cancer shows the contribution of YLL in the age group above
30 years only. More than half of YLL was accounted by 30-59 years of age group. Female
accounted three times more YLL than the males nationally. It was only observed in hill and terai
region of Nepal. Similarly, majority of YLL was contributed from Eastern region of Nepal which
was 46.7 percent. All the YLL was recorded in the population above 15 years of age. In all
Figure 3.4.6: Percentage YLL distribution due to Liver cancer
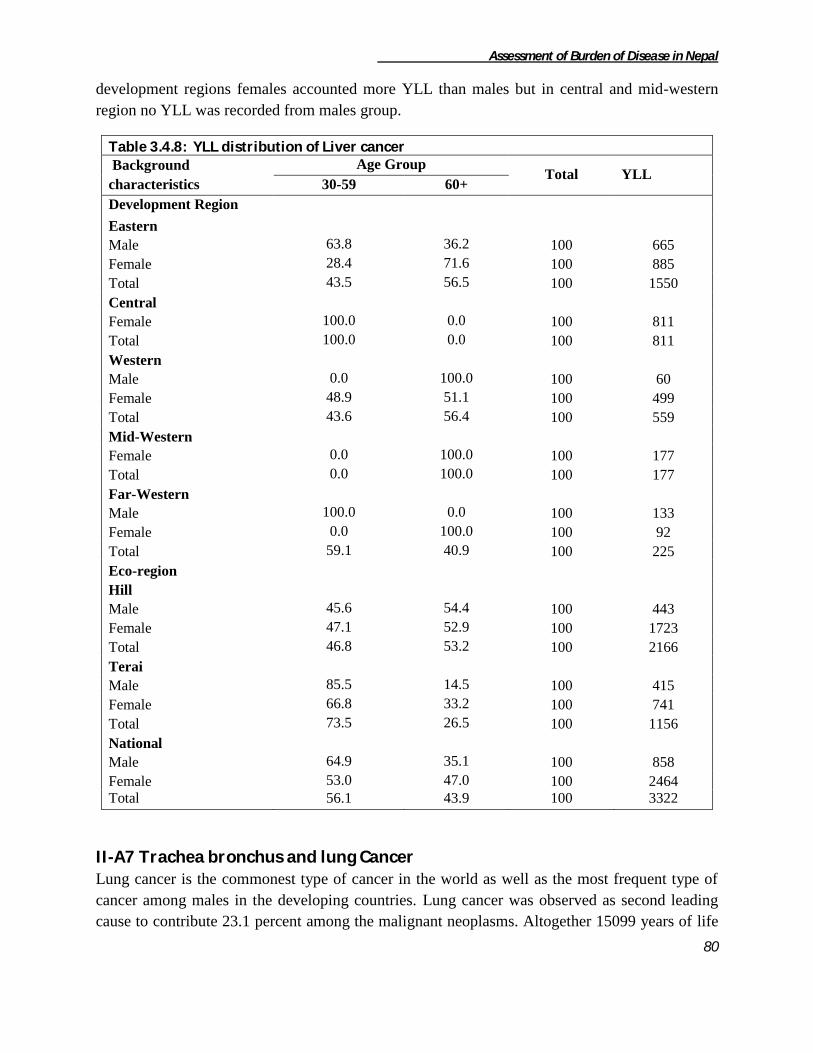
Assessment of Burden of Disease in Nepal
80
development regions females accounted more YLL than males but in central and mid-western
region no YLL was recorded from males group.
Table 3.4.8: YLL distribution of Liver cancer
Background
characteristics
Age Group Total YLL
30-59 60+
Development Region
Eastern
Male 63.8 36.2 100 665
Female 28.4 71.6 100 885
Total 43.5 56.5 100 1550
Central
Female 100.0 0.0 100 811
Total 100.0 0.0 100 811
Western
Male 0.0 100.0 100 60
Female 48.9 51.1 100 499
Total 43.6 56.4 100 559
Mid-Western
Female 0.0 100.0 100 177
Total 0.0 100.0 100 177
Far-Western
Male 100.0 0.0 100 133
Female 0.0 100.0 100 92
Total 59.1 40.9 100 225
Eco-region
Hill
Male 45.6 54.4 100 443
Female 47.1 52.9 100 1723
Total 46.8 53.2 100 2166
Terai
Male 85.5 14.5 100 415
Female 66.8 33.2 100 741
Total 73.5 26.5 100 1156
National
Male 64.9 35.1 100 858
Female 53.0 47.0 100 2464
Total 56.1 43.9 100 3322
II-A7 Trachea bronchus and lung Cancer Lung cancer is the commonest type of cancer in the world as well as the most frequent type of
cancer among males in the developing countries. Lung cancer was observed as second leading
cause to contribute 23.1 percent among the malignant neoplasms. Altogether 15099 years of life

Assessment of Burden of Disease in Nepal
81
lost was contributed due to trachea bronchus and lung cancer. The distribution of this cancer was
observed around all over the country. The ecological distribution of trachea bronchus and lung
cancer was observed highest in hill (68.6%) and lowest in mountain (3.3%). Similarly the
development wise distribution shows highest (27.5%) in mid-western and lowest (3.7%) in far-
western development region.
The following table no. 3.4.8 shows YLL distribution due to trachea bronchus and lung cancer.
Majority i.e. 8495 years of life lost (56.3%) was contributed by male's population nationally.
Males reported five times more YLL than the females in terai region while twice more than the
females in mountain but female constituted 1.2 times more YLL than the males in hill region.
The development region wise sex distribution shows males reporting more YLL than female in
eastern, central and far-western development regions. More than half of the YLL was recorded
from 30-59 years of age group which was followed by 43.9 perecent in elderly population. No
YLL was reported below 15 years of age group due to trachea bronchus and lung cancer.
Figure 3.4.7: Percentage YLL distribution due to Trachea bronchus and lung Cancer

Assessment of Burden of Disease in Nepal
82
Table 3.4.9: YLL distribution of Trachea, bronchus and lung cancers
Background characteristics Age Group
Total YLL 15-29 30-59 60+
Development Region
Eastern
Male 17.3 37.9 44.8 100 1938
Female 0.0 54.9 45.1 100 905
Total 11.8 43.3 44.9 100 2843
Central
Male 0.0 79.8 20.2 100 2801
Female 0.0 79.3 20.7 100 811
Total 0.0 79.7 20.3 100 3612
Western
Male 0.0 31.4 68.6 100 1724
Female 0.0 55.1 44.9 100 2210
Total 0.0 44.7 55.3 100 3934
Mid-Western
Male 0.0 37.8 62.2 100 1681
Female 4.9 52.9 42.3 100 2466
Total 2.9 46.8 50.3 100 4147
Far-Western
Male 0.0 0.0 100.0 100 351
Female 100.0 0.0 100 212
Total 37.7 0.0 62.3 100 563
Eco-region
Mountain
Male 0.0 30.9 69.1 100 337
Female 0.0 100.0 100 168
Total 0.0 20.6 79.4 100 505
Hill
Male 0.0 28.1 71.9 100 4577
Female 3.7 57.6 38.7 100 5775
Total 2.0 44.6 53.4 100 10352
Terai
Male 9.4 77.0 13.6 100 3580
Female 18.1 50.9 31.0 100 662
Total 10.7 73.0 16.3 100 4242
National
Male 3.9 48.8 47.2 100 8495
Female 5.0 55.5 39.5 100 6604
Total 4.4 51.7 43.9 100 15099
II-A9 Breast Cancer Breast cancer is the leading cause of cancer deaths among women in the world and is the second
leading cause of cancer deaths among women in developing cancer.Breast cancer is rare among
males. This study revealed no YLL burden among males due to breast cancer. Breast cancer
contributed seventh rank among the malignant neoplasms. It contributed 1436 years of life lost in
a whole.
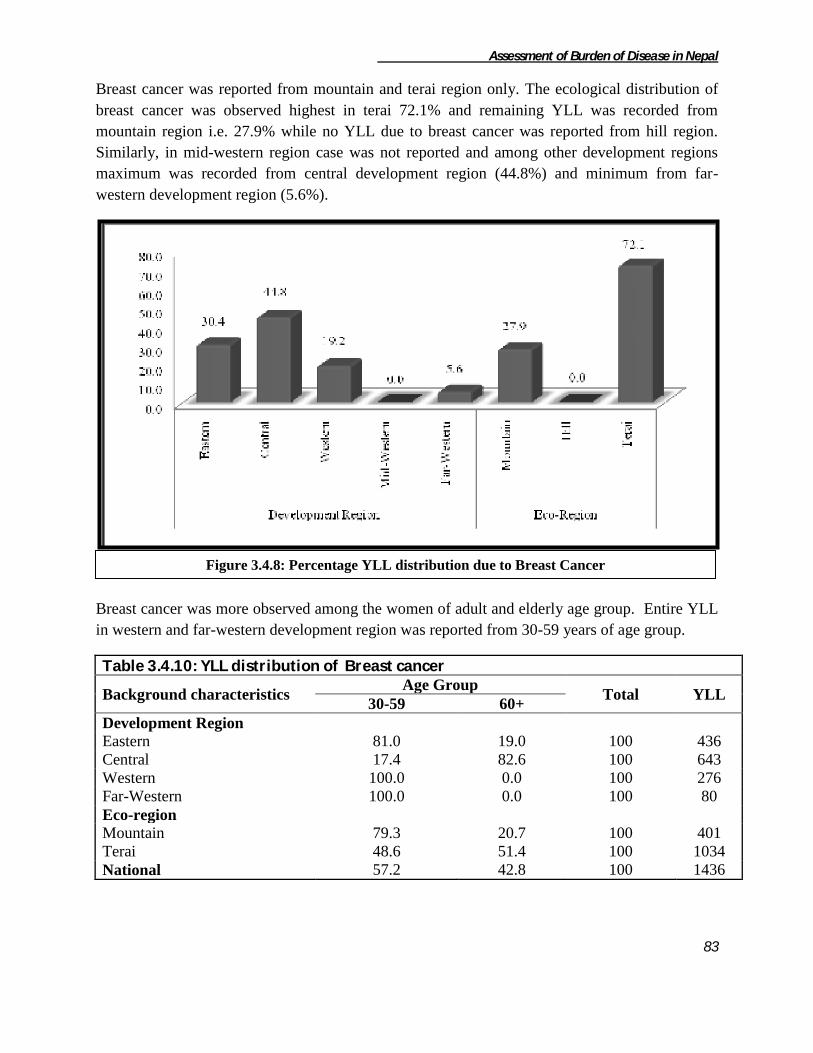
Assessment of Burden of Disease in Nepal
83
Breast cancer was reported from mountain and terai region only. The ecological distribution of
breast cancer was observed highest in terai 72.1% and remaining YLL was recorded from
mountain region i.e. 27.9% while no YLL due to breast cancer was reported from hill region.
Similarly, in mid-western region case was not reported and among other development regions
maximum was recorded from central development region (44.8%) and minimum from far-
western development region (5.6%).
Breast cancer was more observed among the women of adult and elderly age group. Entire YLL
in western and far-western development region was reported from 30-59 years of age group.
Table 3.4.10: YLL distribution of Breast cancer
Background characteristics Age Group
Total YLL 30-59 60+
Development Region
Eastern 81.0 19.0 100 436
Central 17.4 82.6 100 643
Western 100.0 0.0 100 276
Far-Western 100.0 0.0 100 80
Eco-region
Mountain 79.3 20.7 100 401
Terai 48.6 51.4 100 1034
National 57.2 42.8 100 1436
Figure 3.4.8: Percentage YLL distribution due to Breast Cancer

Assessment of Burden of Disease in Nepal
84
II-A10 Cancer of cervix Cancer of the cervix is having a devastating impact on women’s health around the world,
especially in developing countries, where it is the most common cancer and the leading cause of
death from cancer in women. Although cervical cancer is a preventable disease of women group
it was observed to take third position causing YLL due to malignant neoplasms and it still
remains a major burden on public health area of Nepal.
A total of 14849 years of life lost was recorded due to cancer of cervix. Its distribution was
found in all development as well as ecological region. The ecological distribution of cancer of
cervix was observed to be highest in terai (68.5%) and lowest in mountain (2.8%) region.
Similarly, the development wise distribution shows highest (33.0%) in central while lowest
(7.7%) in far- western development region. The distribution due to cancer of cervix was
observed to be similar to the distribution of malignant neoplasms nationally.
The following table no 3.4.10 shows the age and sex-wise YLL distribution due to cancer of
cervix. Majority i.e. 67.9 percent of YLL were contributed by 30-59 years of women group.
Similarly, only 2.8 percent of YLL was recorded from the 15-29 years of female group. It was
observed that females of terai region were more affected by contributing 10168 years of life lost.
In hill region elderly women were observed more to be affected by this type of cancer while in
mountain 71.1 percent of YLL were contributed by women's of 30-59 age group. In eastern,
central and far-western development region majority of YLL was contributed by 30-59 years of
women group.
Figure 3.4.9: Percentage YLL distribution due to Cancer of cervix

Assessment of Burden of Disease in Nepal
85
Table 3.4.11 : YLL distribution of Cervix uteri cancer
Background characteristics Age Group
Total YLL 15-29 30-59 60+
Development region
Eastern 10.6 62.7 26.7 100 2933
Central 0.0 98.0 2.0 100 4902
Western 0.0 44.5 55.5 100 3998
Mid-Western 0.0 40.3 59.7 100 1874
Far-Western 8.4 79.5 12.1 100 1142
Ecological region
Mountain 0.0 71.1 28.9 100 422
Hill 0.0 41.6 58.4 100 4259
Terai 4.0 78.8 17.2 100 10168
National 2.8 67.9 29.4 100 14849
II-A14 Bladder Cancer Bladder cancer contributed 465 years of life lost nationally. All the YLL due to bladder cancer
was observed only among the elderly aged (60+) population. Similarly, majority i.e. 69.9 percent
of years of life lost was observed in terai and it was followed by 30.1 percent of YLL in
mountain region. No YLL due to bladder cancer was recorded from hill region. YLL distribution
according to development region was observed in central and far-western regions only. Majority
i.e. 85.8 percent of years of life lost was observed in central development region. Nationally
males accounted six times more YLL than that of females due to bladder cancer.
Table 3.4.12: YLL distribution of Other congenital anomalies
Background characteristics Sex
Total YLL Male Female
Development Region
Central 100.0 0.0 100 399
Far-Western 0.0 100.0 100 66
Eco-region
Mountain 52.9 47.1 100 140
Terai 100.0 0.0 100 325
National 85.8 14.2 100 465
II-A16 Leukemia Leukemia is one of the frequently occurring cancers in all races or ethnicities and is a prominent
cause of premature mortality due to cancer worldwide. It can be observed in any age and sex of
Nepalese population. However, in this study it was totally observed among the 15-29 males
population. Altogether 325 years of life lost (i.e. 100 percent) was accounted by 15-29 years of
age group in western-terai region of country.
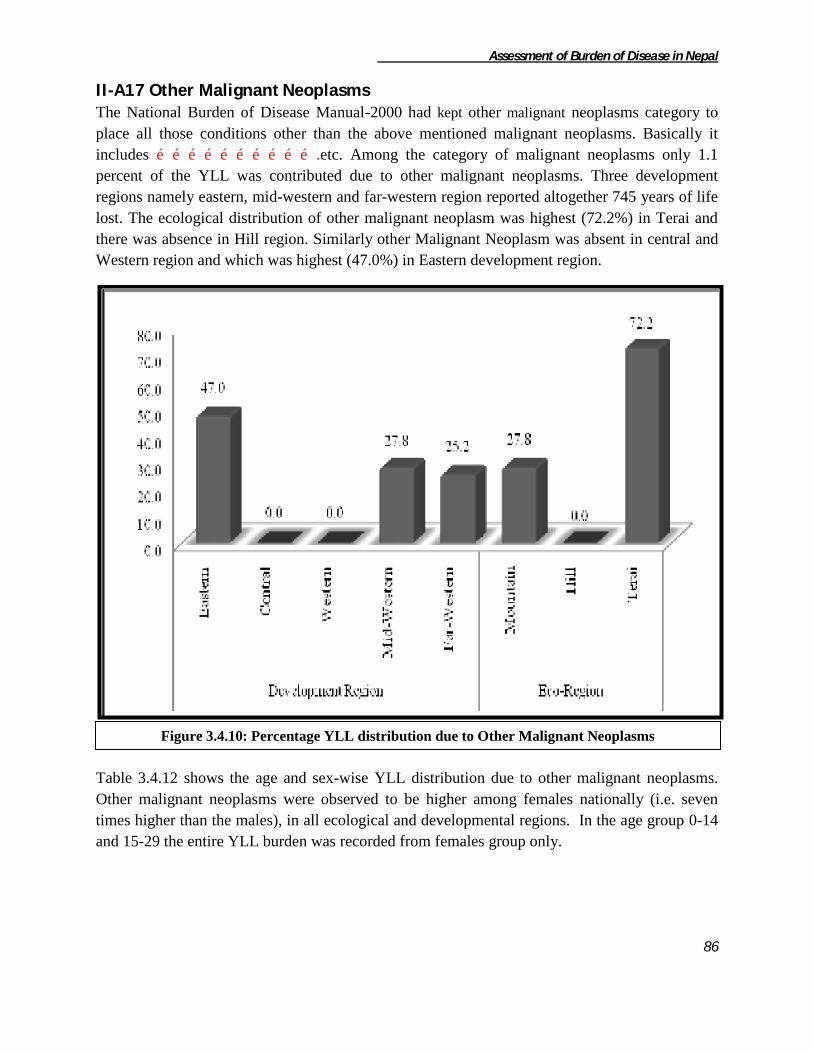
Assessment of Burden of Disease in Nepal
86
II-A17 Other Malignant Neoplasms The National Burden of Disease Manual-2000 had kept other malignant neoplasms category to
place all those conditions other than the above mentioned malignant neoplasms. Basically it
includes ………………………….etc. Among the category of malignant neoplasms only 1.1
percent of the YLL was contributed due to other malignant neoplasms. Three development
regions namely eastern, mid-western and far-western region reported altogether 745 years of life
lost. The ecological distribution of other malignant neoplasm was highest (72.2%) in Terai and
there was absence in Hill region. Similarly other Malignant Neoplasm was absent in central and
Western region and which was highest (47.0%) in Eastern development region.
Table 3.4.12 shows the age and sex-wise YLL distribution due to other malignant neoplasms.
Other malignant neoplasms were observed to be higher among females nationally (i.e. seven
times higher than the males), in all ecological and developmental regions. In the age group 0-14
and 15-29 the entire YLL burden was recorded from females group only.
Figure 3.4.10: Percentage YLL distribution due to Other Malignant Neoplasms
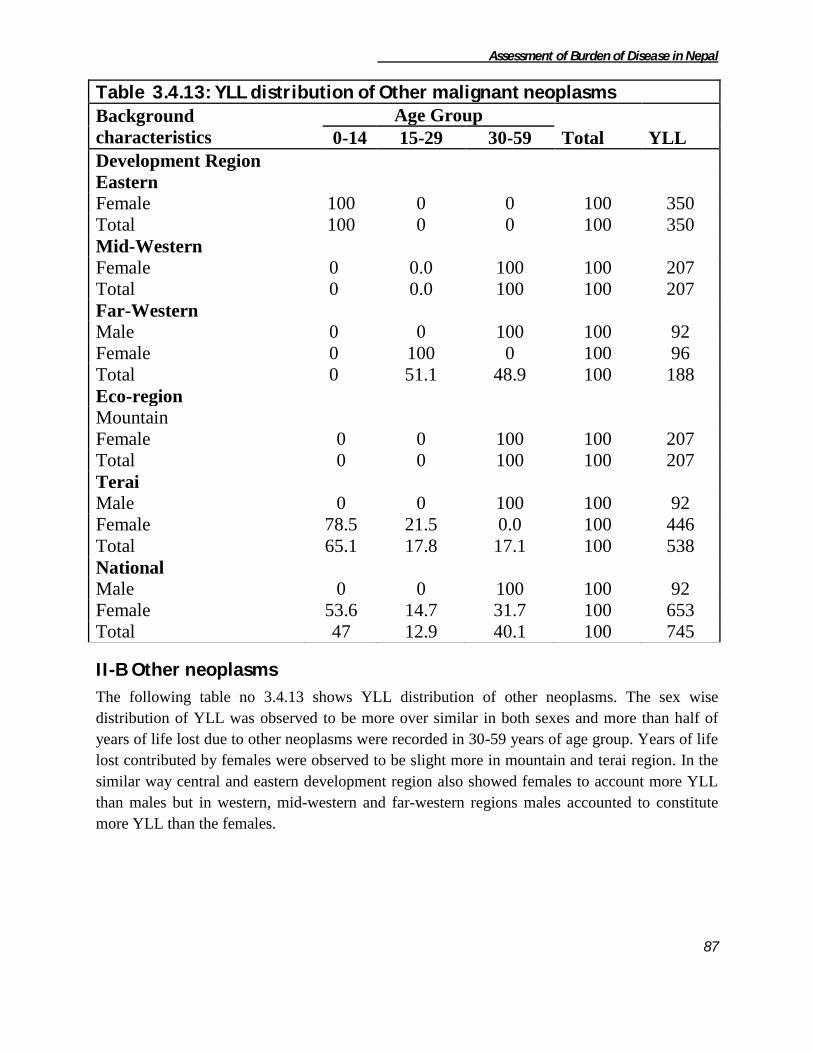
Assessment of Burden of Disease in Nepal
87
Table 3.4.13: YLL distribution of Other malignant neoplasms
Background
characteristics
Age Group
Total YLL 0-14 15-29 30-59
Development Region
Eastern
Female 100 0 0 100 350
Total 100 0 0 100 350
Mid-Western
Female 0 0.0 100 100 207
Total 0 0.0 100 100 207
Far-Western
Male 0 0 100 100 92
Female 0 100 0 100 96
Total 0 51.1 48.9 100 188
Eco-region
Mountain
Female 0 0 100 100 207
Total 0 0 100 100 207
Terai
Male 0 0 100 100 92
Female 78.5 21.5 0.0 100 446
Total 65.1 17.8 17.1 100 538
National
Male 0 0 100 100 92
Female 53.6 14.7 31.7 100 653
Total 47 12.9 40.1 100 745
II-B Other neoplasms
The following table no 3.4.13 shows YLL distribution of other neoplasms. The sex wise
distribution of YLL was observed to be more over similar in both sexes and more than half of
years of life lost due to other neoplasms were recorded in 30-59 years of age group. Years of life
lost contributed by females were observed to be slight more in mountain and terai region. In the
similar way central and eastern development region also showed females to account more YLL
than males but in western, mid-western and far-western regions males accounted to constitute
more YLL than the females.

Assessment of Burden of Disease in Nepal
88
Table 3.4.14 : YLL distribution of Other neoplasms
Background characteristics Age Group
Total YLL 0-14 15-29 30-59 60+
Development Region
Eastern
Male 24.0 7.4 29.6 39.0 100 4355
Female 18.2 13.0 47.3 21.5 100 6465
Total 20.5 10.8 40.1 28.5 100 10820
Central
Male 26.1 21.1 18.0 34.9 100 4756
Female 14.2 2.2 75.4 8.2 100 7481
Total 18.9 9.5 53.1 18.6 100 12237
Western
Male 0.0 0.0 85.3 14.7 100 3374
Female 39.7 0.0 27.6 32.7 100 2039
Total 15.0 0.0 63.6 21.5 100 5413
Mid-Western
Male 11.8 5.5 65.1 17.6 100 4449
Female 47.6 0.0 43.7 8.7 100 1702
Total 21.7 4.0 59.2 15.1 100 6151
Far-Western
Male 26.3 12.6 32.9 28.2 100 1607
Female 0.0 17.0 61.4 21.6 100 1168
Total 15.2 14.5 44.9 25.4 100 2775
Eco-region
Mountain
Male 16.2 0.0 29.7 54.1 100 1091
Female 15.2 14.3 49.5 20.9 100 1121
Total 15.7 7.3 39.7 37.3 100 2212
Hill
Male 9.8 0.0 68.8 21.4 100 7204
Female 34.1 17.7 34.3 13.9 100 4748
Total 19.5 7.0 55.1 18.4 100 11952
Terai
Male 22.9 17.3 30.9 28.9 100 10249
Female 16.0 1.5 65.7 16.8 100 12983
Total 19.0 8.5 50.4 22.1 100 23232
National
Male 17.4 9.6 45.6 27.5 100 18542
Female 20.5 6.4 56.9 16.3 100 18854
Total 19.0 8.0 51.3 21.8 100 37396
Other neoplasms contributed 4.5 percent of YLL among non communicable diseases. Altogether
37396 years of life lost had been contributed by other neoplasms. Distribution of other
neoplasms was observed in all development and ecological regions. Ecological distribution
shows highest share of YLL in terai region (62.1%) and lowest in mountain region (5.9%).
Development region wise distribution shows central region to contribute highest share (32.7%)
and far-western development region to contribute lowest share (7.4%).

Assessment of Burden of Disease in Nepal
89
II-C Diabetes mellitus
The World Health Organization (WHO) recent reports says that the estimates that the number of
people living with diabetes have been increased significantly. Among the mortality due to
diabetes majority of deaths occur in low and middle-income countries. Almost half of diabetes
deaths occur in people under the age of 70 years, 55 percent of diabetes deaths are in women.
WHO projects that diabetes death will increase by more than 50 percent in the next 10 years
without urgent action. This study revealed that 2.8 percent i.e. 23309 years of life lost of total
due to non-communicable diseases were contributed by diabetes mellitus in Nepal.
Its distribution was observed in all development as well as ecological regions of Nepal. The
distribution shown by diabetes mellitus was more over similar to the distribution of non-
Figure: 3.4.11 Percentage YLL distribution due to Other Neoplasms

Assessment of Burden of Disease in Nepal
90
communicable diseases in the whole. Maximum percent (58.9%) of YLL was observed in terai
while minimum (1.9%) was recorded from mountain region of Nepal. Similarly, more than 20
percent was accounted by eastern, central and western development regions while least percent
(2.8%) was shared by far-western development region of Nepal.
Table no 3.4.14 shows the age and sex-wise distribution of diabetes mellitus according to
different region. It was observed that 58.9 percent (1.4 times more than that of females) of YLL
was accounted by males group nationally. YLL due to males was observed to be higher in all
eco- development region of Nepal. Around 82.6 percent of YLL due to diabetes mellitus was
recorded in above 30 years of age. Male showed highest (66.4%) years of life lost in national in
the age group (30-59).
Table 3.4.15: YLL distribution of Diabetes mellitus
Background characteristics Age Group
Total YLL 0-14 15-29 30-59 60+
Figure 3.4.12: Percentage YLL distribution due to Diabetes Mellitus
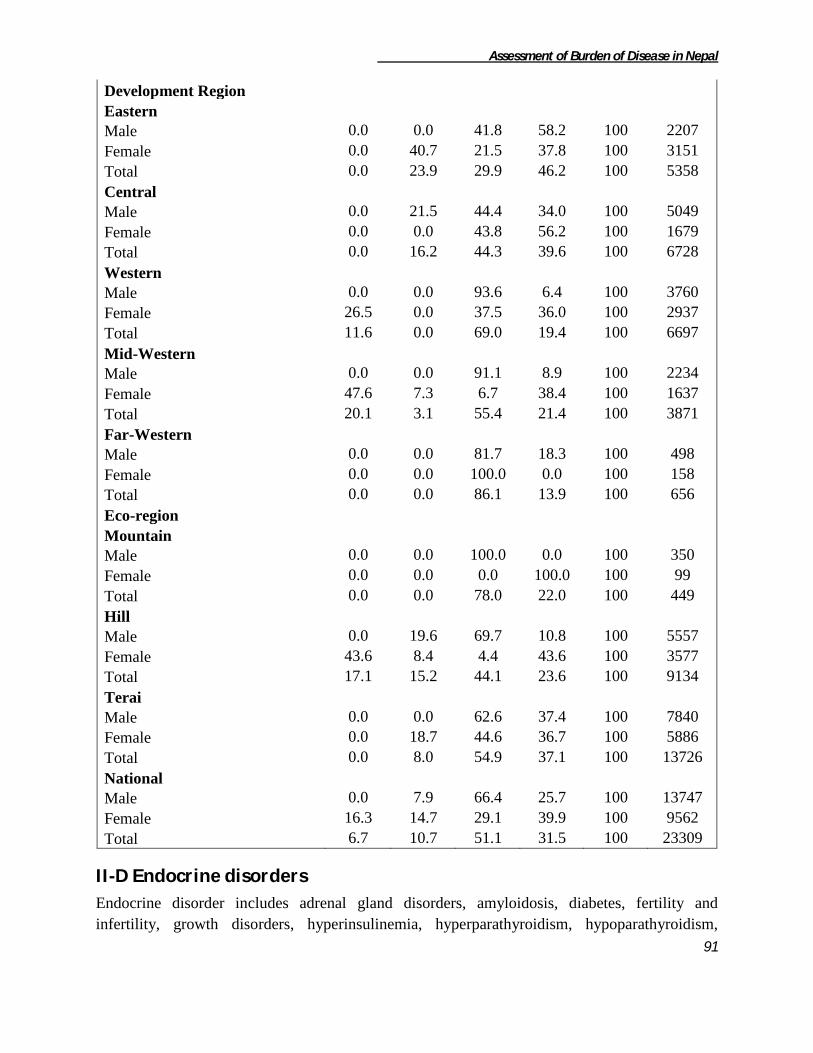
Assessment of Burden of Disease in Nepal
91
Development Region
Eastern
Male 0.0 0.0 41.8 58.2 100 2207
Female 0.0 40.7 21.5 37.8 100 3151
Total 0.0 23.9 29.9 46.2 100 5358
Central
Male 0.0 21.5 44.4 34.0 100 5049
Female 0.0 0.0 43.8 56.2 100 1679
Total 0.0 16.2 44.3 39.6 100 6728
Western
Male 0.0 0.0 93.6 6.4 100 3760
Female 26.5 0.0 37.5 36.0 100 2937
Total 11.6 0.0 69.0 19.4 100 6697
Mid-Western
Male 0.0 0.0 91.1 8.9 100 2234
Female 47.6 7.3 6.7 38.4 100 1637
Total 20.1 3.1 55.4 21.4 100 3871
Far-Western
Male 0.0 0.0 81.7 18.3 100 498
Female 0.0 0.0 100.0 0.0 100 158
Total 0.0 0.0 86.1 13.9 100 656
Eco-region
Mountain
Male 0.0 0.0 100.0 0.0 100 350
Female 0.0 0.0 0.0 100.0 100 99
Total 0.0 0.0 78.0 22.0 100 449
Hill
Male 0.0 19.6 69.7 10.8 100 5557
Female 43.6 8.4 4.4 43.6 100 3577
Total 17.1 15.2 44.1 23.6 100 9134
Terai
Male 0.0 0.0 62.6 37.4 100 7840
Female 0.0 18.7 44.6 36.7 100 5886
Total 0.0 8.0 54.9 37.1 100 13726
National
Male 0.0 7.9 66.4 25.7 100 13747
Female 16.3 14.7 29.1 39.9 100 9562
Total 6.7 10.7 51.1 31.5 100 23309
II-D Endocrine disorders
Endocrine disorder includes adrenal gland disorders, amyloidosis, diabetes, fertility and
infertility, growth disorders, hyperinsulinemia, hyperparathyroidism, hypoparathyroidism,

Assessment of Burden of Disease in Nepal
92
hypopituitarism, menstruation problems, metabolic syndrome, multiple endocrine neoplasia,
osteoporosis, pancreatic cancer, pancreatitis, pituitary gland disorders, thyroid diseases etc.
Here, endocrine disorders excluding diabetes mellitus constituted only 0.2 percent i.e. 1368 years
of life lost among non-communicable diseases. Terai region accounted majority i.e. 78.4 percent
of total years of life lost due to endocrine causes which was followed by mountain region
(21.6%). No YLL was reported from hill region. Similarly 72.1 percent YLL was recorded from
central development region. Least percent (5.9%) of YLL was shared by far-western
development region. No YLL was reported from eastern and western development region.
Endocrine disorders were observed only among age group above 15 years and majority of YLL
(72.1%) was recorded in 15-29 years of age group. Similarly, female group contributed majority
of YLL in all the ecological as well as developmental regions. Nationally females contributed ten
times more YLL than the males due to endocrine disorders.
Figure 3.4.13: Percentage YLL distribution due to Endocrine Disorders

Assessment of Burden of Disease in Nepal
93
Table 3.4.16: YLL distribution of Endocrine disorders
Background characteristics Age Group
Total YLL 15-29 30-59 60+
Development Region
Central
Female 100.0 0.0 0.0 100 987
Total 100.0 0.0 0.0 100 987
Mid-Western
Male 0.0 100.0 0.0 100 116
Female 0.0 46.5 53.5 100 185
Total 0.0 67.1 32.9 100 301
Far-Western
Female 0.0 100.0 0.0 100 80
Total 0.0 100.0 0.0 100 80
Eco-region
Mountain
Male 0.0 100.0 0.0 100 116
Female 0.0 44.7 55.3 100 179
Total 0.0 66.4 33.6 100 295
Terai
Female 92.0 8.0 0.0 100 1073
Total 92.0 8.0 0.0 100 1073
National
Male 0.0 100.0 0.0 100 116
Female 78.8 13.3 7.9 100 1252
Total 72.1 20.6 7.2 100 1368
I-E Neuropsychiatric disorders
Neuropsychiatric disorder is distributed into seven sub category viz. unipolar depressive
disorders, migraine, mental retardation attributable to lead exposure, other neuropsychiatry
disorders, bipolar affective disorder, epilepsy, and alcohol use disorders.
Figure 3.4.14: Percentage YLL distribution due to Neuropsychiatric disorder
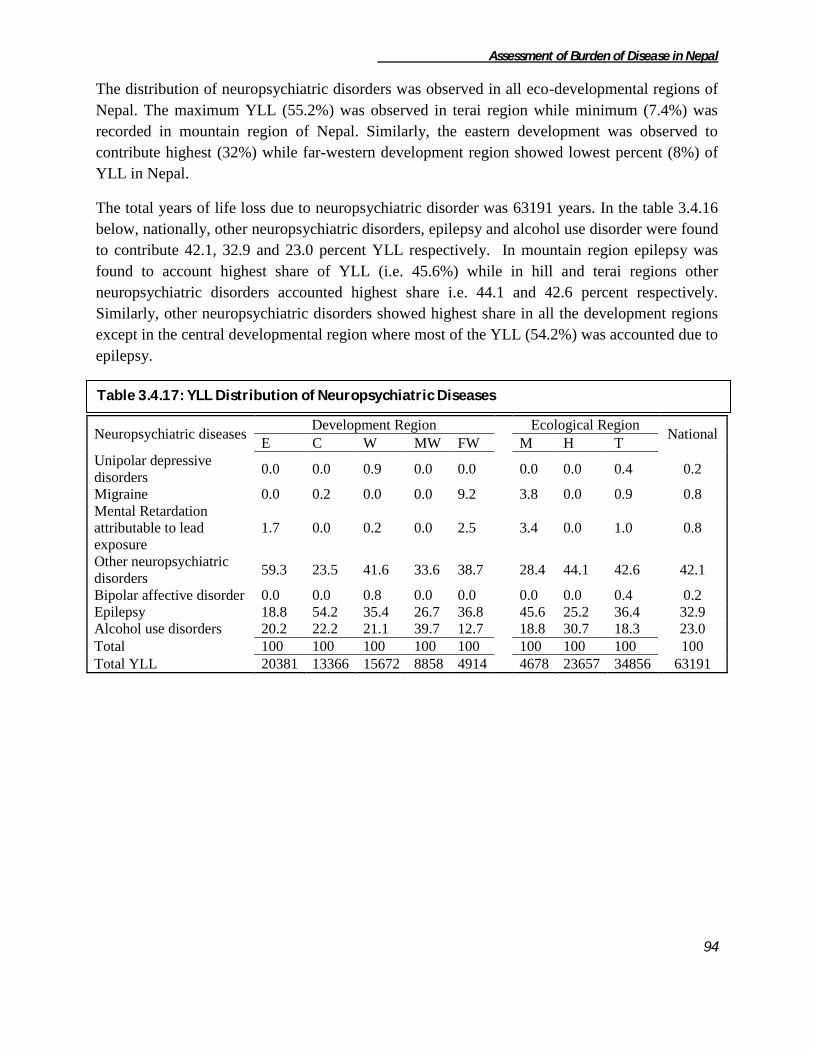
Assessment of Burden of Disease in Nepal
94
The distribution of neuropsychiatric disorders was observed in all eco-developmental regions of
Nepal. The maximum YLL (55.2%) was observed in terai region while minimum (7.4%) was
recorded in mountain region of Nepal. Similarly, the eastern development was observed to
contribute highest (32%) while far-western development region showed lowest percent (8%) of
YLL in Nepal.
The total years of life loss due to neuropsychiatric disorder was 63191 years. In the table 3.4.16
below, nationally, other neuropsychiatric disorders, epilepsy and alcohol use disorder were found
to contribute 42.1, 32.9 and 23.0 percent YLL respectively. In mountain region epilepsy was
found to account highest share of YLL (i.e. 45.6%) while in hill and terai regions other
neuropsychiatric disorders accounted highest share i.e. 44.1 and 42.6 percent respectively.
Similarly, other neuropsychiatric disorders showed highest share in all the development regions
except in the central developmental region where most of the YLL (54.2%) was accounted due to
epilepsy.
Neuropsychiatric diseases Development Region Ecological Region
National E C W MW FW M H T
Unipolar depressive
disorders 0.0 0.0 0.9 0.0 0.0 0.0 0.0 0.4 0.2
Migraine 0.0 0.2 0.0 0.0 9.2 3.8 0.0 0.9 0.8
Mental Retardation
attributable to lead
exposure
1.7 0.0 0.2 0.0 2.5 3.4 0.0 1.0 0.8
Other neuropsychiatric
disorders 59.3 23.5 41.6 33.6 38.7 28.4 44.1 42.6 42.1
Bipolar affective disorder 0.0 0.0 0.8 0.0 0.0 0.0 0.0 0.4 0.2
Epilepsy 18.8 54.2 35.4 26.7 36.8 45.6 25.2 36.4 32.9
Alcohol use disorders 20.2 22.2 21.1 39.7 12.7 18.8 30.7 18.3 23.0
Total 100 100 100 100 100 100 100 100 100
Total YLL 20381 13366 15672 8858 4914 4678 23657 34856 63191
Table 3.4.17: YLL Distribution of Neuropsychiatric Diseases
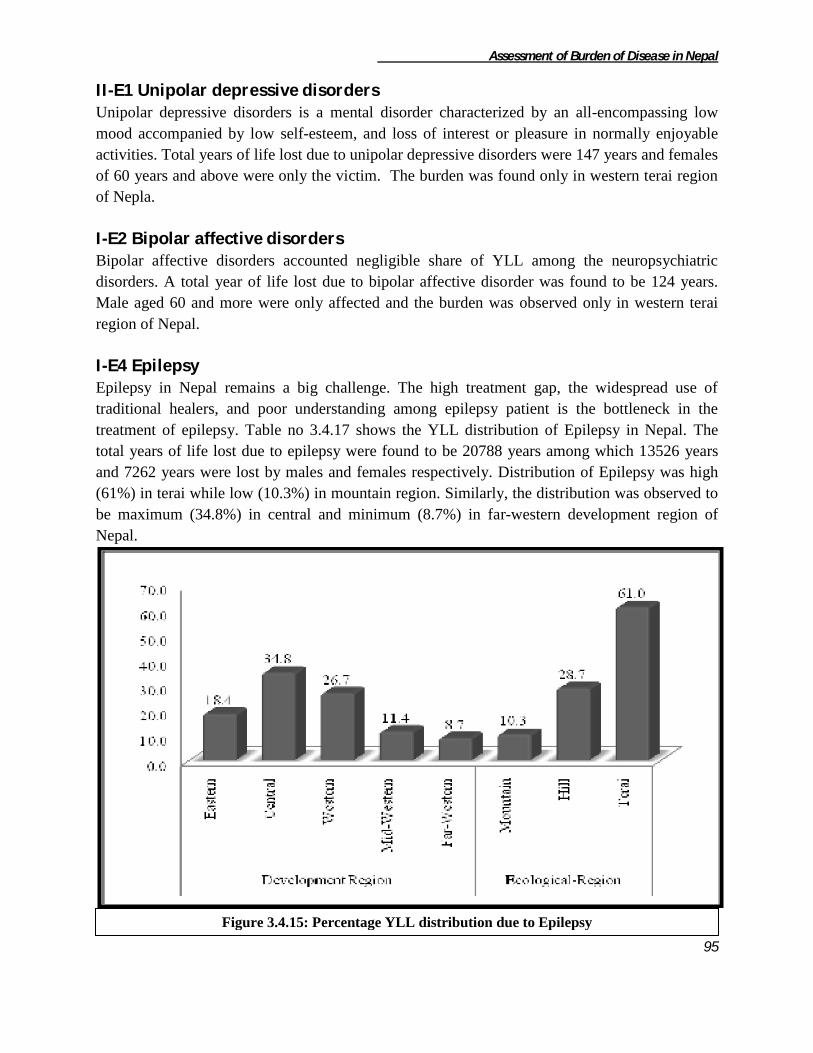
Assessment of Burden of Disease in Nepal
95
II-E1 Unipolar depressive disorders Unipolar depressive disorders is a mental disorder characterized by an all-encompassing low
mood accompanied by low self-esteem, and loss of interest or pleasure in normally enjoyable
activities. Total years of life lost due to unipolar depressive disorders were 147 years and females
of 60 years and above were only the victim. The burden was found only in western terai region
of Nepla.
I-E2 Bipolar affective disorders
Bipolar affective disorders accounted negligible share of YLL among the neuropsychiatric
disorders. A total year of life lost due to bipolar affective disorder was found to be 124 years.
Male aged 60 and more were only affected and the burden was observed only in western terai
region of Nepal.
I-E4 Epilepsy Epilepsy in Nepal remains a big challenge. The high treatment gap, the widespread use of
traditional healers, and poor understanding among epilepsy patient is the bottleneck in the
treatment of epilepsy. Table no 3.4.17 shows the YLL distribution of Epilepsy in Nepal. The
total years of life lost due to epilepsy were found to be 20788 years among which 13526 years
and 7262 years were lost by males and females respectively. Distribution of Epilepsy was high
(61%) in terai while low (10.3%) in mountain region. Similarly, the distribution was observed to
be maximum (34.8%) in central and minimum (8.7%) in far-western development region of
Nepal.
Figure 3.4.15: Percentage YLL distribution due to Epilepsy
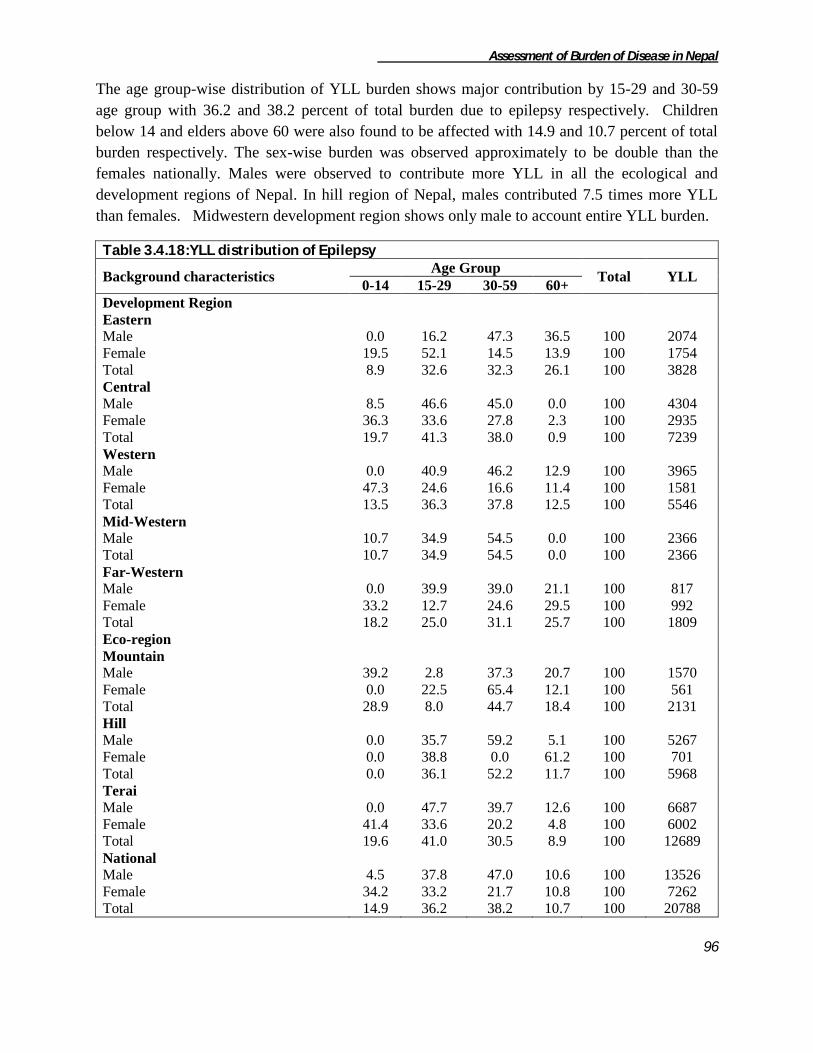
Assessment of Burden of Disease in Nepal
96
The age group-wise distribution of YLL burden shows major contribution by 15-29 and 30-59
age group with 36.2 and 38.2 percent of total burden due to epilepsy respectively. Children
below 14 and elders above 60 were also found to be affected with 14.9 and 10.7 percent of total
burden respectively. The sex-wise burden was observed approximately to be double than the
females nationally. Males were observed to contribute more YLL in all the ecological and
development regions of Nepal. In hill region of Nepal, males contributed 7.5 times more YLL
than females. Midwestern development region shows only male to account entire YLL burden.
Table 3.4.18:YLL distribution of Epilepsy
Background characteristics Age Group
Total YLL 0-14 15-29 30-59 60+
Development Region
Eastern
Male 0.0 16.2 47.3 36.5 100 2074
Female 19.5 52.1 14.5 13.9 100 1754
Total 8.9 32.6 32.3 26.1 100 3828
Central
Male 8.5 46.6 45.0 0.0 100 4304
Female 36.3 33.6 27.8 2.3 100 2935
Total 19.7 41.3 38.0 0.9 100 7239
Western
Male 0.0 40.9 46.2 12.9 100 3965
Female 47.3 24.6 16.6 11.4 100 1581
Total 13.5 36.3 37.8 12.5 100 5546
Mid-Western
Male 10.7 34.9 54.5 0.0 100 2366
Total 10.7 34.9 54.5 0.0 100 2366
Far-Western
Male 0.0 39.9 39.0 21.1 100 817
Female 33.2 12.7 24.6 29.5 100 992
Total 18.2 25.0 31.1 25.7 100 1809
Eco-region
Mountain
Male 39.2 2.8 37.3 20.7 100 1570
Female 0.0 22.5 65.4 12.1 100 561
Total 28.9 8.0 44.7 18.4 100 2131
Hill
Male 0.0 35.7 59.2 5.1 100 5267
Female 0.0 38.8 0.0 61.2 100 701
Total 0.0 36.1 52.2 11.7 100 5968
Terai
Male 0.0 47.7 39.7 12.6 100 6687
Female 41.4 33.6 20.2 4.8 100 6002
Total 19.6 41.0 30.5 8.9 100 12689
National
Male 4.5 37.8 47.0 10.6 100 13526
Female 34.2 33.2 21.7 10.8 100 7262
Total 14.9 36.2 38.2 10.7 100 20788

Assessment of Burden of Disease in Nepal
97
I-E5 Alcohol use disorders Alcohol use remains major public health problem in Nepal. Many ethnic groups are allowed to
drink from their childhood as their cultural practice, similarly most social gathering also includes
alcohol use and a way of enjoyment, and hence the culture of alcohol use is increasing day by
day. Total years of life lost due to alcohol use disorders were 14525 years among which 13289
and 1236 YLL was accounted by males and females respectively. The ecological distribution
shows half of the YLL contribution by hill region of Nepal. The least (6%) was observed in
mountain region of Nepal. Similarly maximum (28.4%) in eastern and minimum (4.3%) YLL in
far-western development region was observed.
The following table 3.4.18 shows the age and sex-wise YLL distribution due to alcohol use
disorders. Majority of YLL i.e.63.9 percent was accounted by age group 30-59 which was
followed by 24.7 percent by elderly age group nationally. The sex-wise burden of YLL was
found to be ten times more in males than females in Nepal. In terai region of Nepal the
distribution of YLL was observed to be more in males and among females entire YLL burden
was recorded in 30-59 years of age group. In eastern and far-western development regions the
whole YLL burden was contributed by males group only and in all the remaining development
regions males accounted more YLL.
Figure 3.4.16: Percentage YLL distribution due to Alcohol use disorders

Assessment of Burden of Disease in Nepal
98
Table 3.4.19: YLL distribution of Alcohol use disorders
Background
characteristics
Age Group Total YLL
15-29 30-59 60+
Development Region
Eastern
Male 9.3 56.1 34.6 100 3611
Female 0.0 100.0 0.0 100 507
Total 8.1 61.5 30.4 100 4118
Central
Male 42.0 44.0 14.1 100 2311
Female 0.0 100.0 0.0 100 650
Total 32.8 56.3 11.0 100 2961
Western
Male 10.9 64.5 24.6 100 3301
Total 10.9 64.5 24.6 100 3301
Mid-Western
Male 0.0 71.6 28.4 100 3439
Female 0.0 100.0 0.0 100 79
Total 0.0 72.3 27.7 100 3518
Far-Western
Male 0.0 64.9 35.1 100 627
Total 0.0 64.9 35.1 100 627
Eco-region
Mountain
Male 0.0 100.0 0.0 100 878
Total 0.0 100.0 0.0 100 878
Hill
Male 0.0 71.7 28.3 100 7033
Female 0.0 100.0 0.0 100 232
Total 0.0 72.6 27.4 100 7265
Terai
Male 31.0 39.4 29.6 100 5378
Female 0.0 100.0 0.0 100 1004
Total 26.1 48.9 25.0 100 6382
National
Male 12.5 60.5 27.0 100 13289
Female 0.0 100.0 0.0 100 1236
Total 11.5 63.9 24.7 100 14525
I-E14 Migraine Total years of life lost due to migraine were found to be 478 years among which 245 years and
233 years of life were lost by male and female respectively. The ecological distribution of the
YLL due to migraine was observed in mountain (37.7%) and terai (62.3%) region only. Similarly
the development wise distribution was observed in central (5.6%) and far-western (94.4%)
development region of Nepal. The age group wise distribution was observed to be highest i.e.
71.3 percent in 30-59 years age group and remaining 28.7 percent in elderly age group. Sex
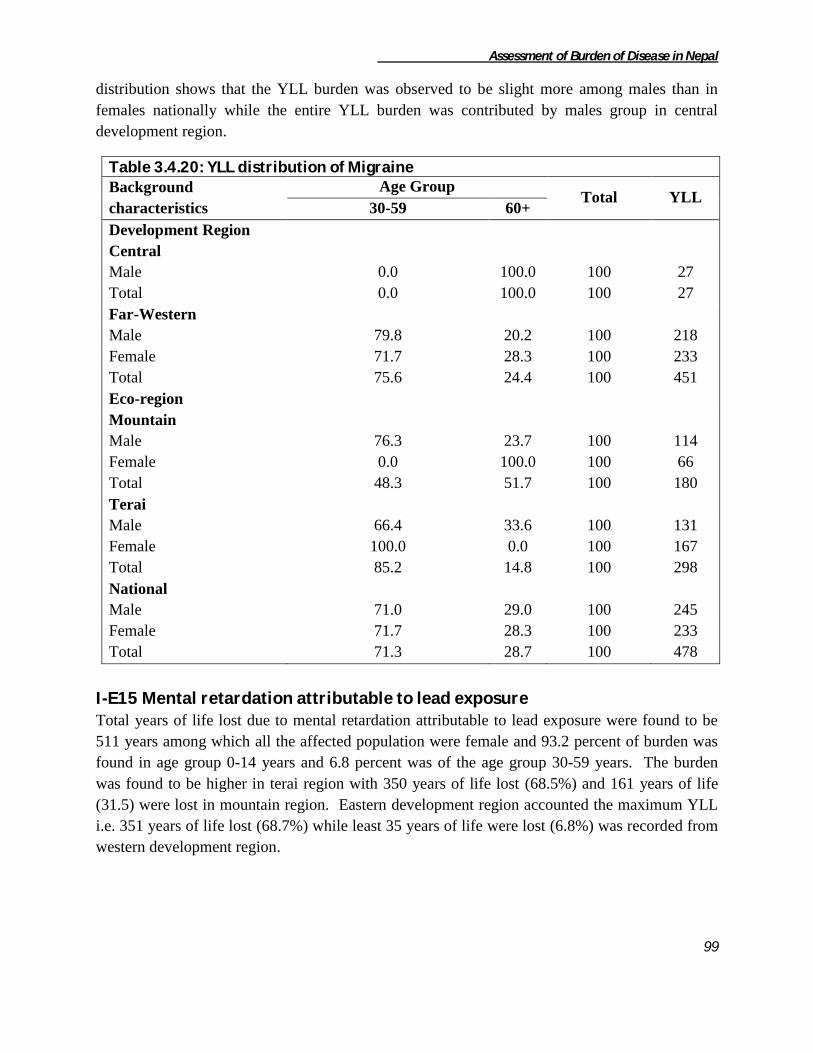
Assessment of Burden of Disease in Nepal
99
distribution shows that the YLL burden was observed to be slight more among males than in
females nationally while the entire YLL burden was contributed by males group in central
development region.
Table 3.4.20: YLL distribution of Migraine
Background
characteristics
Age Group Total YLL
30-59 60+
Development Region
Central
Male 0.0 100.0 100 27
Total 0.0 100.0 100 27
Far-Western
Male 79.8 20.2 100 218
Female 71.7 28.3 100 233
Total 75.6 24.4 100 451
Eco-region
Mountain
Male 76.3 23.7 100 114
Female 0.0 100.0 100 66
Total 48.3 51.7 100 180
Terai
Male 66.4 33.6 100 131
Female 100.0 0.0 100 167
Total 85.2 14.8 100 298
National
Male 71.0 29.0 100 245
Female 71.7 28.3 100 233
Total 71.3 28.7 100 478
I-E15 Mental retardation attributable to lead exposure Total years of life lost due to mental retardation attributable to lead exposure were found to be
511 years among which all the affected population were female and 93.2 percent of burden was
found in age group 0-14 years and 6.8 percent was of the age group 30-59 years. The burden
was found to be higher in terai region with 350 years of life lost (68.5%) and 161 years of life
(31.5) were lost in mountain region. Eastern development region accounted the maximum YLL
i.e. 351 years of life lost (68.7%) while least 35 years of life were lost (6.8%) was recorded from
western development region.

Assessment of Burden of Disease in Nepal
100
Table 3.4.21: YLL distribution of Mental Retardation attributable to lead exposure
Background
characteristics
Age Group Total YLL
0-14 30-59
Development Region
Eastern 100.0 0.0 100 351
Western 0.0 100.0 100 35
Far-Western 100.0 0.0 100 125
Ecological-region
Mountain 78.1 21.9 100 161
Terai 100.0 0.0 100 350
National 93.2 6.8 100 511
I-E16 Other neuropsychiatric disorders Other neuropsychiatric disorders were responsible to account 26616 years of life lost nationally.
The distribution of other neuropsychiatric disorders was observed maximum in terai region
(55.8%) while least was found in mountain region (5%). Similarly, highest YLL was recorded in
eastern (45.4%) and lowest share was contributed by far-western (7.1%) development region of
Nepal.
The age and sex-wise distribution of YLL due to other neuropsychiatric disorders is shown in the
table 3.4.21 below. The sex-wise distribution shows males reporting slight more YLL than the
females. Half the burden was found in age group above 60 years and least (7.3%) was observed
to be in the 0-14 years of age group. The YLL burden was found to be high among males in all
the ecological regions except in hill region. Similarly, the burden accounted by males was
observed to be higher among males than in females in all the development regions except in
eastern and central development regions of Nepal.
Figure 3.4.17: Percentage YLL distribution due to other neuropsychiatric disorders

Assessment of Burden of Disease in Nepal
101
Table 3.4.22: YLL distribution of Other neuropsychiatric disorders
Background characteristics
Age Group Total YLL
0-14 15-29 30-59 60+
Development Region
Eastern
Male 0.0 10.2 37.1 52.7 100 5888
Female 0.0 4.4 25.2 70.4 100 6196
Total 0.0 7.2 31.0 61.8 100 12084
Central
Male 0.0 0.0 48.2 51.8 100 976
Female 0.0 8.1 56.4 35.6 100 2161
Total 0.0 5.5 53.8 40.6 100 3137
Western
Male 26.5 32.5 0.0 41.0 100 4114
Female 30.0 0.0 23.9 46.1 100 2405
Total 27.8 20.5 8.8 42.9 100 6519
Mid-Western
Male 8.2 7.9 6.1 77.8 100 1532
Female 0.0 0.0 47.4 52.6 100 1442
Total 4.2 4.1 26.1 65.6 100 2974
Far-Western
Male 0.0 40.5 33.4 26.2 100 959
Female 0.0 34.0 57.2 8.8 100 943
Total 0.0 37.3 45.2 17.6 100 1902
Eco-region
Mountain
Male 0.0 0.0 45.9 54.1 100 679
Female 0.0 45.0 32.1 22.9 100 651
Total 0.0 22.0 39.2 38.8 100 1330
Hill
Male 0.0 6.5 22.3 71.3 100 4600
Female 0.0 4.7 42.6 52.8 100 5823
Total 0.0 5.5 33.6 60.9 100 10423
Terai
Male 14.9 26.2 21.1 37.8 100 8190
Female 10.8 3.0 28.3 57.9 100 6673
Total 13.0 15.8 24.4 46.8 100 14863
National
Male 9.0 18.2 22.8 50.0 100 13469
Female 5.5 5.8 34.8 53.9 100 13147
Total 7.3 12.1 28.7 51.9 100 26616
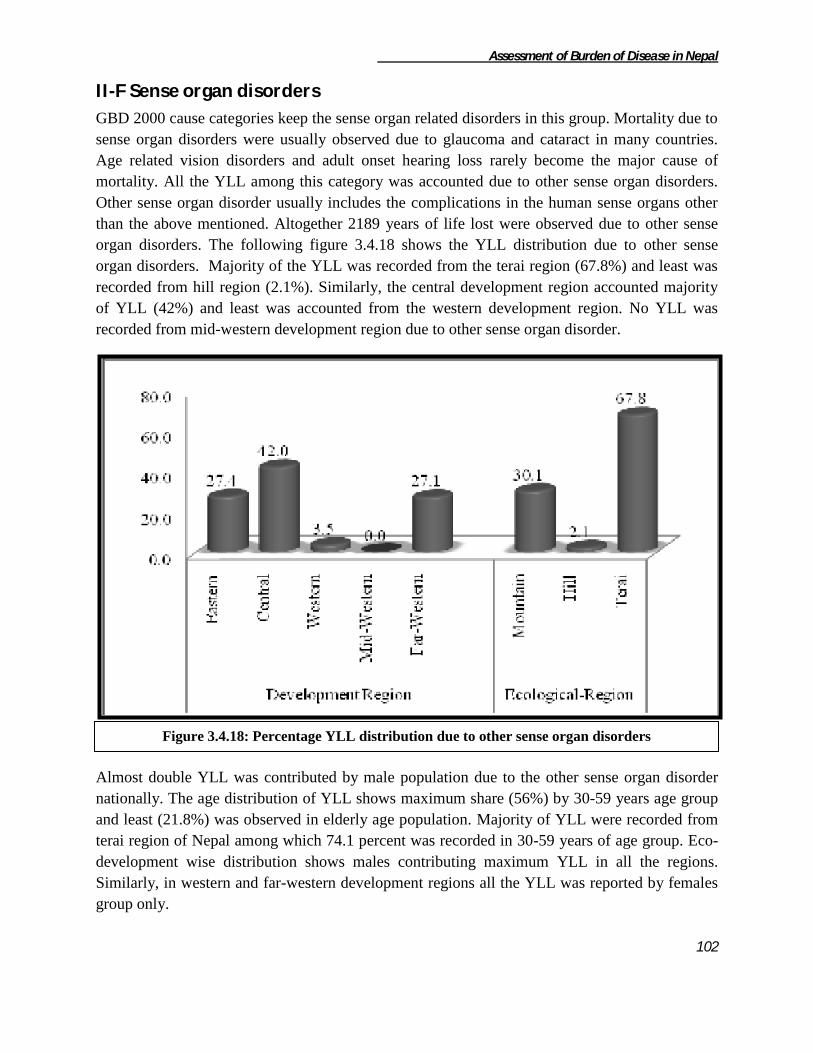
Assessment of Burden of Disease in Nepal
102
II-F Sense organ disorders
GBD 2000 cause categories keep the sense organ related disorders in this group. Mortality due to
sense organ disorders were usually observed due to glaucoma and cataract in many countries.
Age related vision disorders and adult onset hearing loss rarely become the major cause of
mortality. All the YLL among this category was accounted due to other sense organ disorders.
Other sense organ disorder usually includes the complications in the human sense organs other
than the above mentioned. Altogether 2189 years of life lost were observed due to other sense
organ disorders. The following figure 3.4.18 shows the YLL distribution due to other sense
organ disorders. Majority of the YLL was recorded from the terai region (67.8%) and least was
recorded from hill region (2.1%). Similarly, the central development region accounted majority
of YLL (42%) and least was accounted from the western development region. No YLL was
recorded from mid-western development region due to other sense organ disorder.
Almost double YLL was contributed by male population due to the other sense organ disorder
nationally. The age distribution of YLL shows maximum share (56%) by 30-59 years age group
and least (21.8%) was observed in elderly age population. Majority of YLL were recorded from
terai region of Nepal among which 74.1 percent was recorded in 30-59 years of age group. Eco-
development wise distribution shows males contributing maximum YLL in all the regions.
Similarly, in western and far-western development regions all the YLL was reported by females
group only.
Figure 3.4.18: Percentage YLL distribution due to other sense organ disorders

Assessment of Burden of Disease in Nepal
103
Table 3.4.23: YLL distribution of Other sense organ disorders
Background characteristics
Age Group Total YLL
0-14 30-59 60+
Development Region
Eastern
Male 0.0 0.0 100.0 100 198
Female 0.0 100.0 0.0 100 401
Total 0.0 66.9 33.1 100 599
Central
Male 0.0 89.5 10.5 100 851
Female 0.0 0.0 100.0 100 68
Total 0.0 82.9 17.1 100 919
Western
Female 0.0 0.0 100.0 100 77
Total 0.0 0.0 100.0 100 77
Far-Western
Male 85.8 14.2 0.0 100 438
Female 70.5 0.0 29.5 100 156
Total 81.8 10.4 7.7 100 594
Eco-region
Mountain
Male 80.9 0.0 19.1 100 465
Female 0.0 64.9 35.1 100 194
Total 57.1 19.1 23.8 100 659
Hill
Female 0.0 0.0 100.0 100 46
Total 0.0 0.0 100.0 100 46
Terai
Male 0.0 80.6 19.4 100 1022
Female 23.8 59.5 16.7 100 462
Total 7.4 74.1 18.5 100 1484
National
Male 25.3 55.4 19.3 100 1487
Female 15.7 57.1 27.2 100 702
Total 22.2 56.0 21.8 100 2189
II-G Cardiovascular diseases
Cardiovascular diseases comprises of rheumatic heart disease, hypertensive heart disease,
Ischaemic heart disease, cerebrovascular disease and other cardiovascular diseases. Altogether
159102 years of life lost have been accounted by cardiovascular diseases. Terai region accounted
48 percent of total YLL in this category while least was recorded in the mountain region
contributing only 11 percent. Similarly, the development region wise YLL was observed to be
highest in central (31%) and lowest in the far-western (8%) development region of Nepal.

Assessment of Burden of Disease in Nepal
104
Similarly, the following table no 3.4.23 shows the age and sex-wise distribution of
cardiovascular diseases. Among the cardiovascular diseases 43.8 percent of burden was
contributed by cerebro-vascular disease and only 1.6 percent of YLL was contributed by
rheumatic heart disease. The ecological distribution shows similar pattern of distribution of
cardiovascular diseases in hill and terai but in mountain region highest share was accounted by
cerebro-vascular diseases but no YLL was recorded due to rheumatic heart diseases. Likewise
the development wise distribution also shows the same pattern of the YLL except in eastern and
far-western development regions where no YLL was recorded due to rheumatic heart disease.
E C W MW FW M H T
1 Rheumatic heart disease 0.0 1.3 4.5 1.6 0.0 0.0 2.3 1.5 1.6
2 Hypertensive heart disease 30.4 13.0 15.9 14.2 2.4 11.8 16.8 18.4 17.1
3 Ischaemic heart disease 15.5 24.1 15.7 21.9 18.3 29.1 16.4 20.0 19.5
4 Cerebrovascular disease 22.2 42.5 57.8 53.0 54.9 32.9 50.3 40.6 43.8
5 Other cardiovascular diseases 31.9 19.1 6.0 9.2 24.4 26.3 14.1 19.4 18.0
Total 100.0 100.0 100.0 100.0 100.0 100.0 100.0 100.0 100.0
Total YLL 36761 49208 34078 27098 11957 16876 65969 76257 159102
Development Region Eco-RegionNational Cardiovascular diseasesS.N.
Table 3.4.24: YLL Distribution of Cardiovascular Diseases
Figure 3.4.19: Percentage YLL distribution due to Cardiovascular Diseases
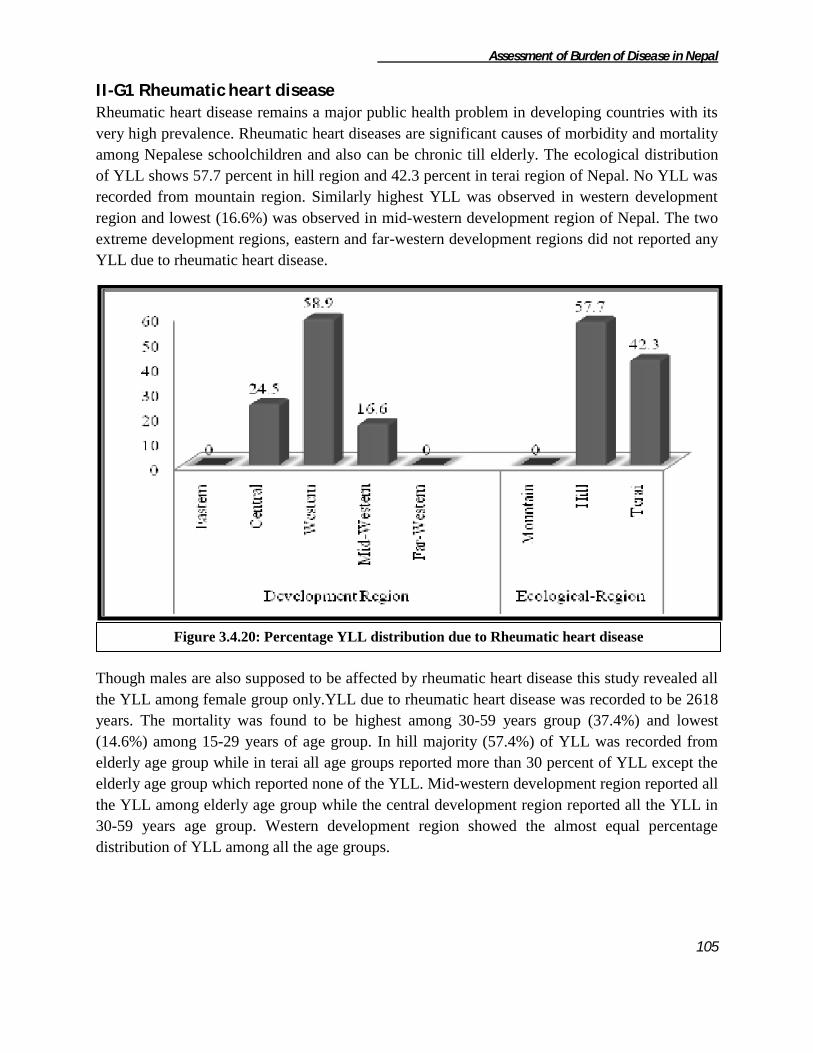
Assessment of Burden of Disease in Nepal
105
II-G1 Rheumatic heart disease Rheumatic heart disease remains a major public health problem in developing countries with its
very high prevalence. Rheumatic heart diseases are significant causes of morbidity and mortality
among Nepalese schoolchildren and also can be chronic till elderly. The ecological distribution
of YLL shows 57.7 percent in hill region and 42.3 percent in terai region of Nepal. No YLL was
recorded from mountain region. Similarly highest YLL was observed in western development
region and lowest (16.6%) was observed in mid-western development region of Nepal. The two
extreme development regions, eastern and far-western development regions did not reported any
YLL due to rheumatic heart disease.
Though males are also supposed to be affected by rheumatic heart disease this study revealed all
the YLL among female group only.YLL due to rheumatic heart disease was recorded to be 2618
years. The mortality was found to be highest among 30-59 years group (37.4%) and lowest
(14.6%) among 15-29 years of age group. In hill majority (57.4%) of YLL was recorded from
elderly age group while in terai all age groups reported more than 30 percent of YLL except the
elderly age group which reported none of the YLL. Mid-western development region reported all
the YLL among elderly age group while the central development region reported all the YLL in
30-59 years age group. Western development region showed the almost equal percentage
distribution of YLL among all the age groups.
Figure 3.4.20: Percentage YLL distribution due to Rheumatic heart disease
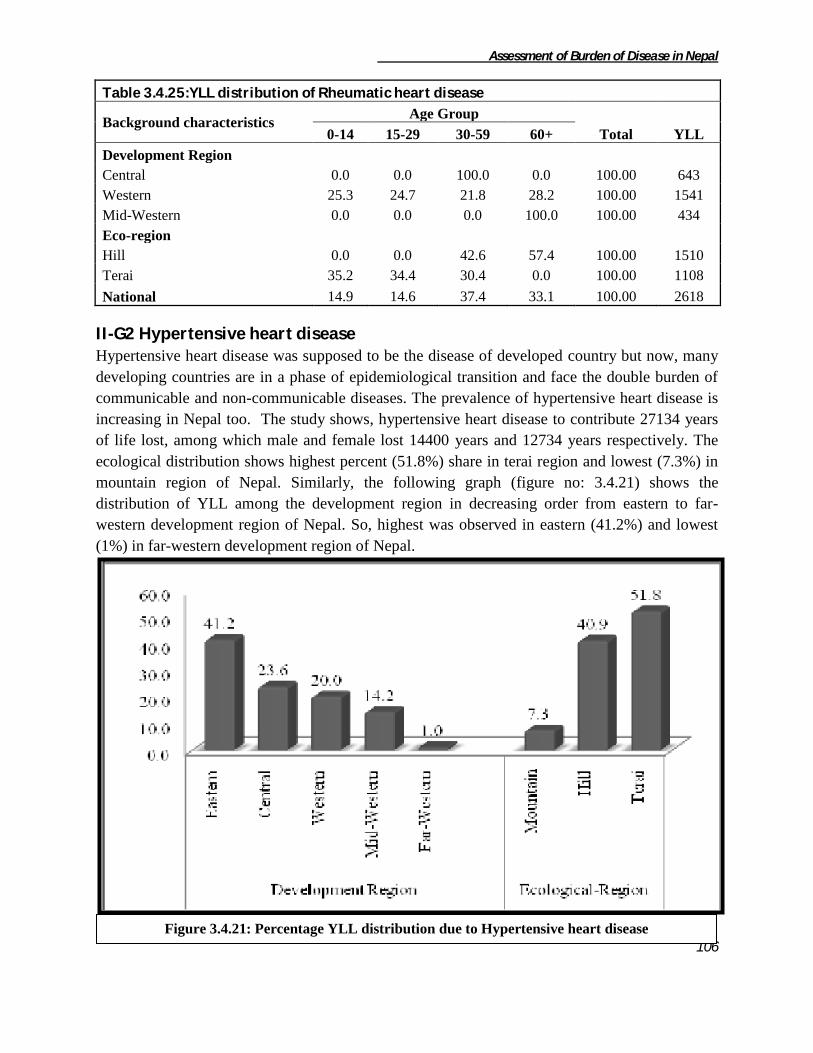
Assessment of Burden of Disease in Nepal
106
Table 3.4.25:YLL distribution of Rheumatic heart disease
Background characteristics Age Group
Total YLL 0-14 15-29 30-59 60+
Development Region
Central 0.0 0.0 100.0 0.0 100.00 643
Western 25.3 24.7 21.8 28.2 100.00 1541
Mid-Western 0.0 0.0 0.0 100.0 100.00 434
Eco-region
Hill 0.0 0.0 42.6 57.4 100.00 1510
Terai 35.2 34.4 30.4 0.0 100.00 1108
National 14.9 14.6 37.4 33.1 100.00 2618
II-G2 Hypertensive heart disease Hypertensive heart disease was supposed to be the disease of developed country but now, many
developing countries are in a phase of epidemiological transition and face the double burden of
communicable and non-communicable diseases. The prevalence of hypertensive heart disease is
increasing in Nepal too. The study shows, hypertensive heart disease to contribute 27134 years
of life lost, among which male and female lost 14400 years and 12734 years respectively. The
ecological distribution shows highest percent (51.8%) share in terai region and lowest (7.3%) in
mountain region of Nepal. Similarly, the following graph (figure no: 3.4.21) shows the
distribution of YLL among the development region in decreasing order from eastern to far-
western development region of Nepal. So, highest was observed in eastern (41.2%) and lowest
(1%) in far-western development region of Nepal.
Figure 3.4.21: Percentage YLL distribution due to Hypertensive heart disease
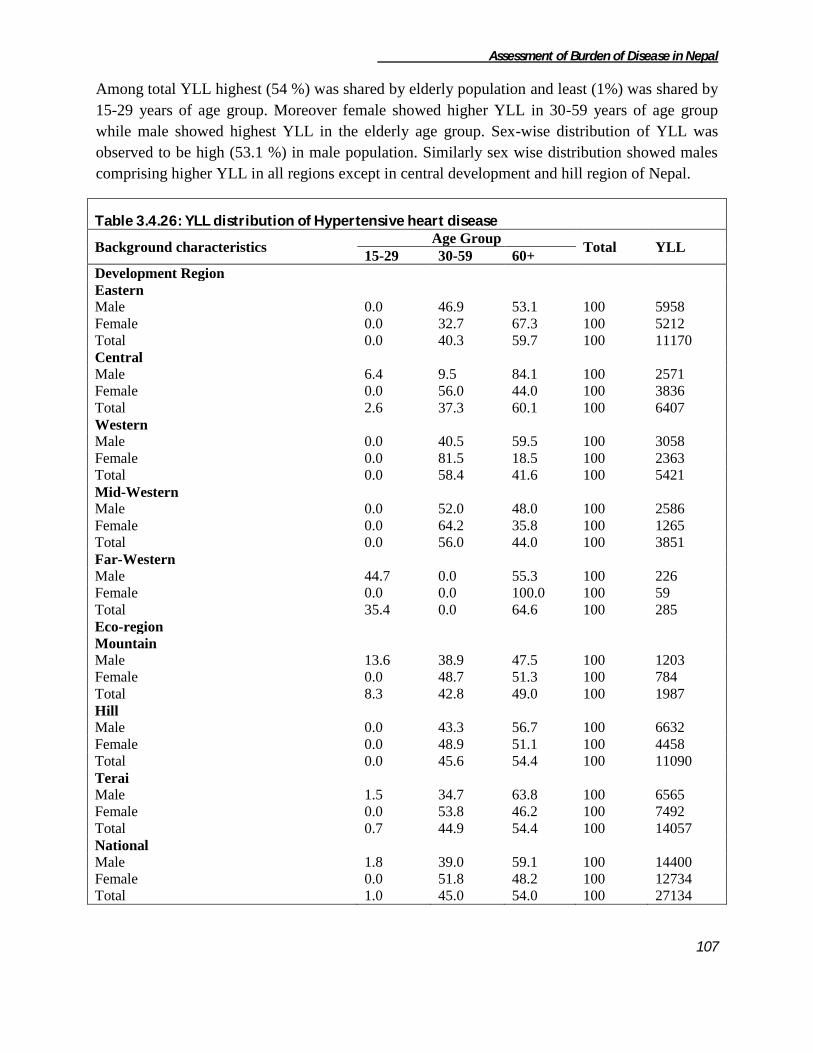
Assessment of Burden of Disease in Nepal
107
Among total YLL highest (54 %) was shared by elderly population and least (1%) was shared by
15-29 years of age group. Moreover female showed higher YLL in 30-59 years of age group
while male showed highest YLL in the elderly age group. Sex-wise distribution of YLL was
observed to be high (53.1 %) in male population. Similarly sex wise distribution showed males
comprising higher YLL in all regions except in central development and hill region of Nepal.
Table 3.4.26: YLL distribution of Hypertensive heart disease
Background characteristics Age Group
Total YLL 15-29 30-59 60+
Development Region
Eastern
Male 0.0 46.9 53.1 100 5958
Female 0.0 32.7 67.3 100 5212
Total 0.0 40.3 59.7 100 11170
Central
Male 6.4 9.5 84.1 100 2571
Female 0.0 56.0 44.0 100 3836
Total 2.6 37.3 60.1 100 6407
Western
Male 0.0 40.5 59.5 100 3058
Female 0.0 81.5 18.5 100 2363
Total 0.0 58.4 41.6 100 5421
Mid-Western
Male 0.0 52.0 48.0 100 2586
Female 0.0 64.2 35.8 100 1265
Total 0.0 56.0 44.0 100 3851
Far-Western
Male 44.7 0.0 55.3 100 226
Female 0.0 0.0 100.0 100 59
Total 35.4 0.0 64.6 100 285
Eco-region
Mountain
Male 13.6 38.9 47.5 100 1203
Female 0.0 48.7 51.3 100 784
Total 8.3 42.8 49.0 100 1987
Hill
Male 0.0 43.3 56.7 100 6632
Female 0.0 48.9 51.1 100 4458
Total 0.0 45.6 54.4 100 11090
Terai
Male 1.5 34.7 63.8 100 6565
Female 0.0 53.8 46.2 100 7492
Total 0.7 44.9 54.4 100 14057
National
Male 1.8 39.0 59.1 100 14400
Female 0.0 51.8 48.2 100 12734
Total 1.0 45.0 54.0 100 27134

Assessment of Burden of Disease in Nepal
108
II-G3 Ischaemic heart disease The behavioral and lifestyle transition of developing countries is resulting to increase in burden
of ischaemic heart disease and Nepal is also showing the similar trend. Ischaemic heart disease is
responsible for 31028 years of life lost among which male and female lost 20421 years and
10607 years respectively. The highest YLL according to ecological regions was observed in the
terai (49.3%) and lowest (15.8%) was observed in the mountain region of Nepal. Similarly, the
development region-wise YLL distribution showed highest (38.2%) in the central and lowest
(7%) in the far-western development region.
Among all the age group, 30-59 years were observed to be affected mostly (47%) and only 0.3
percent of YLL was observed among the 0-14 years of age group due to Ischaemic heart disease.
The burden was almost double among males than the females. Males were found to contribute
more YLL in all the ecological and developmental region except in the central developmental
region where males contributed slight less YLL than the females.
Figure 3.4.22: Percentage YLL distribution due to Ischaemic heart disease

Assessment of Burden of Disease in Nepal
109
Table 3.4.27: YLL distribution of Ischaemic heart disease
Background
characteristics
Age Group
Total YLL 0-14 15-29 30-59 60+
Development Region
Eastern
Male 0.0 0.0 45.2 54.8 100 3789
Female 0.0 14.3 50.6 35.1 100 1897
Total 0.0 4.8 47.0 48.2 100 5686
Central
Male 0.0 18.5 53.2 28.3 100 5888
Female 0.0 0.0 41.5 58.5 100 5966
Total 0.0 9.2 47.3 43.5 100 11854
Western
Male 0.0 0.0 50.2 49.8 100 4229
Female 0.0 0.0 50.8 49.2 100 1135
Total 0.0 0.0 50.4 49.6 100 5364
Mid-Western
Male 0.0 10.6 50.8 38.7 100 4918
Female 0.0 11.8 32.2 56.1 100 1020
Total 0.0 10.8 47.6 41.7 100 5938
Far-Western
Male 6.5 20.0 34.7 38.7 100 1598
Female 0.0 0.0 42.9 57.1 100 588
Total 4.8 14.6 36.9 43.7 100 2186
Eco-region
Mountain
Male 0.0 7.2 45.4 47.4 100 3732
Female 0.0 0.0 52.2 47.8 100 1171
Total 5.5 47.1 47.5 100 4903
Hill
Male 0.0 15.2 44.4 40.4 100 8646
Female 0.0 12.4 7.8 79.8 100 2193
Total 0.0 14.6 37.0 48.4 100 10839
Terai
Male 1.3 4.3 55.8 38.6 100 8043
Female 0.0 1.7 52.5 45.8 100 7243
Total 0.7 3.0 54.3 42.0 100 15286
National
Male 0.5 9.4 49.1 41.0 100 20421
Female 0.0 3.7 43.3 53.0 100 10607
Total 0.3 7.5 47.1 45.1 100 31028
II-G4 Cerebrovascular disease Years of life lost due to cerebrovascular diseases was observed to be 69759 years among which
37895 years and 31855 years were lost by male and female respectively. The ecological

Assessment of Burden of Disease in Nepal
110
distribution showed majority (47.6%) of YLL recorded from hill and least (8%) was recorded
from mountain region of Nepal. The development region wise distribution shows the highest
YLL contributed by central development region and lowest by far-western development region.
The following table no 3.4.27 shows the YLL distribution of the cerebrovascular diseases.
Majority (59%) of YLL burden was observed in the elderly age group and least (1.9%) was
observed in the 0-14 years age group. Around 54 percent of burden was accountable by males
population only. Males population accounted higher YLL in each ecological and developmental
region. Similarly, the age distribution shows highest in YLL contributed by the elderly
population group except, moreover equal contribution was observed among 30-59 and elderly
age group population.
Figure 3.4.23: Percentage YLL distribution due to Cerebrovascular disease
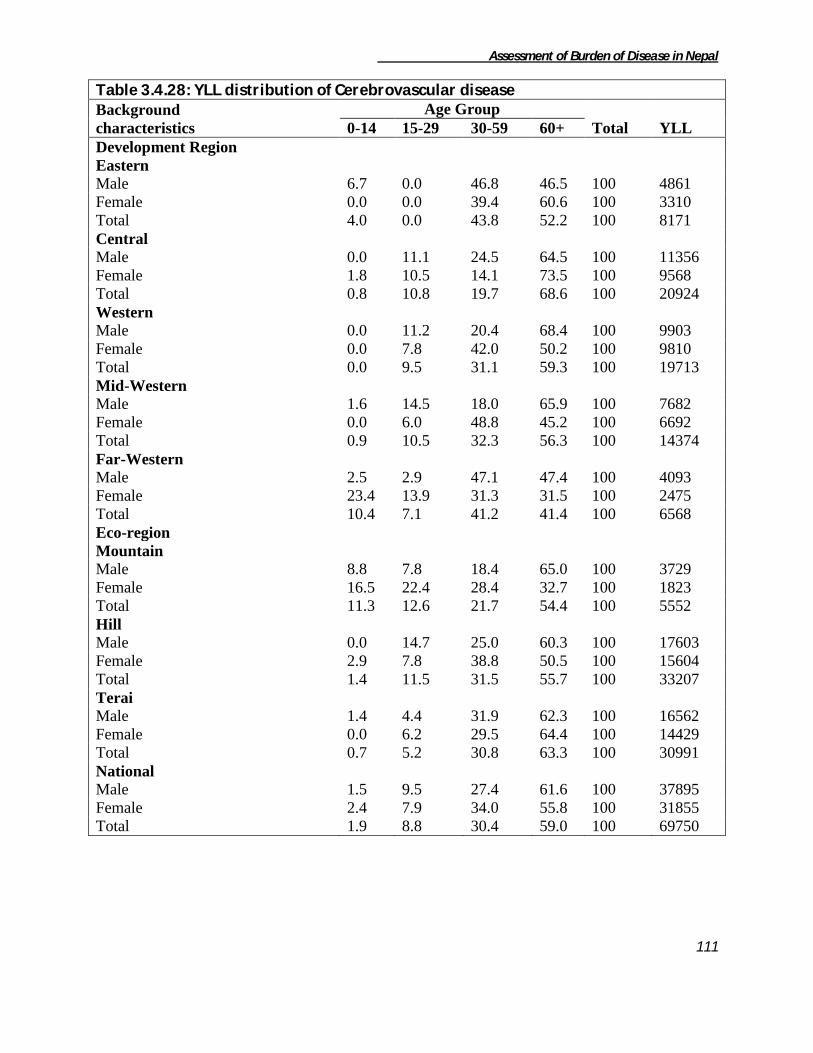
Assessment of Burden of Disease in Nepal
111
Table 3.4.28: YLL distribution of Cerebrovascular disease
Background
characteristics
Age Group
Total YLL 0-14 15-29 30-59 60+
Development Region
Eastern
Male 6.7 0.0 46.8 46.5 100 4861
Female 0.0 0.0 39.4 60.6 100 3310
Total 4.0 0.0 43.8 52.2 100 8171
Central
Male 0.0 11.1 24.5 64.5 100 11356
Female 1.8 10.5 14.1 73.5 100 9568
Total 0.8 10.8 19.7 68.6 100 20924
Western
Male 0.0 11.2 20.4 68.4 100 9903
Female 0.0 7.8 42.0 50.2 100 9810
Total 0.0 9.5 31.1 59.3 100 19713
Mid-Western
Male 1.6 14.5 18.0 65.9 100 7682
Female 0.0 6.0 48.8 45.2 100 6692
Total 0.9 10.5 32.3 56.3 100 14374
Far-Western
Male 2.5 2.9 47.1 47.4 100 4093
Female 23.4 13.9 31.3 31.5 100 2475
Total 10.4 7.1 41.2 41.4 100 6568
Eco-region
Mountain
Male 8.8 7.8 18.4 65.0 100 3729
Female 16.5 22.4 28.4 32.7 100 1823
Total 11.3 12.6 21.7 54.4 100 5552
Hill
Male 0.0 14.7 25.0 60.3 100 17603
Female 2.9 7.8 38.8 50.5 100 15604
Total 1.4 11.5 31.5 55.7 100 33207
Terai
Male 1.4 4.4 31.9 62.3 100 16562
Female 0.0 6.2 29.5 64.4 100 14429
Total 0.7 5.2 30.8 63.3 100 30991
National
Male 1.5 9.5 27.4 61.6 100 37895
Female 2.4 7.9 34.0 55.8 100 31855
Total 1.9 8.8 30.4 59.0 100 69750

Assessment of Burden of Disease in Nepal
112
II-G5 Other Cardiovascular disease Years of life lost due to other cardiovascular diseases were 28573 years. Among the ecological
region terai showed the highest share (51.9%) and mountain region showed the lowest
percentage share (15.5%). Likewise, the eastern development region showed the highest (41.1%)
and western development region showed the lowest (7.1%) percentage share.
Altogether 12804 (44.8%) years of life lost was covered by male and 15769 years (55.2%) was
covered by female. The burden was found to be highest (38%) among population above 60 years
of age and lowest (14.1%) in the 15-29 years of age group. Males and females population
showed higher percentage share of YLL in the elderly age group. Sex-wise distribution shows
females to account more YLL than the males nationally. In all the eco-development regions of
Nepal female's share of YLL was observed to be higher except in the western, far-western and
mountain region of Nepal.
Figure 3.4.24: Percentage YLL distribution due to Other Cardiovascular disease

Assessment of Burden of Disease in Nepal
113
Table 3.4.29: YLL distribution of Other cardiovascular diseases
Background
characteristics
Age Group
Total YLL 0-14 15-29 30-59 60+
Development Region
Eastern
Male 18.3 6.1 51.9 23.7 100 5333
Female 5.1 16.5 34.7 43.7 100 6400
Total 11.1 11.8 42.5 34.6 100 11733
Central
Male 27.1 34.1 6.3 32.5 100 3936
Female 22.5 44.7 32.8 100 5442
Total 24.4 14.3 28.6 32.7 100 9378
Western
Male 0.0 36.1 22.6 41.3 100 1041
Female 0.0 0.0 30.1 69.9 100 999
Total 0.0 18.4 26.3 55.3 100 2040
Mid-Western
Male 0.0 26.2 7.6 66.2 100 987
Female 17.3 7.9 18.7 56.1 100 1514
Total 10.5 15.1 14.3 60.1 100 2501
Far-Western
Male 15.1 29.4 9.3 46.2 100 1504
Female 16.3 8.3 47.0 28.4 100 1417
Total 15.7 19.2 27.6 37.6 100 2921
Eco-region
Mountain
Male 5.1 32.9 48.8 13.2 100 2414
Female 8.7 13.6 51.3 26.3 100 2018
Total 6.7 24.1 49.9 19.2 100 4432
Hill
Male 31.2 7.1 12.9 48.8 100 3131
Female 9.0 4.4 36.3 50.4 100 6192
Total 16.5 5.3 28.4 49.8 100 9323
Terai
Male 16.1 23.9 26.0 34.1 100 7259
Female 17.3 9.9 34.6 38.1 100 7560
Total 16.7 16.7 30.4 36.1 100 14819
National
Male 17.7 21.5 27.1 33.7 100 12804
Female 12.9 8.2 37.4 41.4 100 15769
Total 15.1 14.1 32.8 38.0 100 28573

Assessment of Burden of Disease in Nepal
114
II-H Respiratory diseases
Respiratory diseases include chronic obstructive pulmonary disease, asthma and other respiratory
diseases. Highest YLL due to respiratory diseases was observed in the terai region (44%) and
lowest was observed in mountain region (13%). In the similar way, YLL share was observed
highest (27%) in the central development region and lowest in the far-western development
region (9%) of Nepal.
Among respiratory diseases, burden of COPD was found to be highest i.e. 97.6 percent while the
burden of asthma and other respiratory diseases was 1.1 percent and 1.3 percent respectively.
COPD was found higher in all development regions with 95.7, 97.1, 99.2, 97.1 and 99.5 percent
of burden among respiratory diseases in eastern, central, western, mid-western and far-western
development region respectively. Similarly, COPD was higher in all 3 ecological regions with
94.6, 97.7 and 98.4 percent of burden among respiratory diseases in mountain, hill and terai
region respectively.
E C W MW FW M H T
1 Chronic obstructive pulmonary disease 95.7 97.1 99.2 97.1 99.5 94.6 97.7 98.4 97.6
2 Asthma 0.1 2.4 0.2 2.1 0.1 1.0 1.3 1.0 1.1
3 Other respiratory diseases 4.2 0.5 0.7 0.8 0.5 4.4 1.0 0.6 1.3
Total 100.0 100.0 100.0 100.0 100.0 100.0 100.0 100.0 100.0
Total YLL 51562 71689 67194 54962 24881 35919 115260 119109 270288
Development Region Eco-RegionRespiratory diseasesS.N. National
Table 3.4.30: YLL distribution of respiratory diseases
Figure 3.4.25: Percentage YLL distribution due to Other Cardiovascular disease

Assessment of Burden of Disease in Nepal
115
II-H1 Chronic Obstructive Pulmonary diseases Chronic obstructive pulmonary disease (COPD) is a major cause of chronic morbidity and
mortality and represents a substantial economic and social burden throughout the world. It is one
of the leading cause of death worldwide and further increase in its prevalence and mortality are
expected in the coming decades. Years of life lost due to COPD were found to be 263734 years.
Terai shared maximum (44.4%) and mountain shared minimum (12.9%) years of life lost due to
COPD. Similarly central development region contributed highest (26.4%) and far-western
development region contributed lowest (9.4%) from the development regions of Nepal.
The sex distribution of YLL was observed higher among female 144241 (54.7%) while males
were responsible to contribute only 119493 (45.3%). Burden of COPD was found to be highest
among elderly population group (73.6%) and lowest among 15-29 years age group (0.8%). In all
the eco-development regions elderly age group population were observed to contribute majority
of YLL. Distributing ecologically, females were observed to contribute more YLL in terai and
hill region while males accounted more YLL in mountain region of Nepal. The YLL burden was
found to be accounted more by females in central, western and mid-western regions except in
eastern and far-western development region where males accounted more YLL due to COPD.
Figure 3.4.26: Percentage YLL distribution due to Chronic Obstructive Pulmonary diseases

Assessment of Burden of Disease in Nepal
116
Table 3.4.31: YLL distribution of Chronic obstructive pulmonary disease
Background
characteristics
Age Group
Total YLL 0-14 15-29 30-59 60+
Development Region
Eastern
Male 0.0 0.0 29.9 70.1 100 25655
Female 0.0 0.0 22.2 77.8 100 23677
Total 0.0 0.0 26.2 73.8 100 49332
Central
Male 6.3 0.6 24.4 68.7 100 28796
Female 2.5 2.4 30.5 64.6 100 40839
Total 4.1 1.7 28.0 66.3 100 69635
Western
Male 1.3 1.1 18.3 79.3 100 29098
Female 0.0 0.0 18.4 81.6 100 37535
Total 0.6 0.5 18.3 80.6 100 66633
Mid-Western
Male 0.0 0.0 17.9 82.1 100 21903
Female 0.0 0.0 23.0 77.0 100 31482
Total 0.0 0.0 20.9 79.1 100 53385
Far-Western
Male 0.0 0.7 31.7 67.6 100 14040
Female 0.0 4.0 38.1 57.9 100 10709
Total 0.0 2.1 34.4 63.4 100 24749
Eco-region
Mountain
Male 0.0 0.9 34.5 64.6 100 19680
Female 0.0 0.0 32.0 68.0 100 14319
Total 0.0 0.5 33.4 66.0 100 33999
Hill
Male 1.6 0.0 12.8 85.5 100 48364
Female 0.0 0.7 16.3 83.0 100 64225
Total 0.7 0.4 14.8 84.1 100 112589
Terai
Male 2.7 0.8 29.9 66.5 100 51450
Female 1.6 1.5 31.8 65.2 100 65696
Total 2.1 1.2 31.0 65.8 100 117146
National
Male 1.8 0.5 23.8 73.9 100 119493
Female 0.7 1.0 24.9 73.4 100 144241
Total 1.2 0.8 24.4 73.6 100 263734

Assessment of Burden of Disease in Nepal
117
II-H2 Asthma Asthma is one of the common health problems in Nepal. Years of life lost due to asthma was
found to be 3086. The ecological distribution shows the highest (48.7%) YLL contributed by hill
and lowest (11.7%) by mountain region of Nepal. Central contributed more than 50 percent
(highest) YLL and least was contributed by far-western development region of Nepal.
The following table 3.4.31 shows the age and sex-wise YLL distribution of asthma. The sex
distribution shows males and females contributing almost equal YLL due to asthma. Similarly,
the age wise distribution shows the YLL recorded in the age group above 30 years of age and
majority (69.7%) of YLL was heaped in the elderly age group and remaining was recorded in
30-59 years age group. Ecologically distributing the mortality, hill region reported majority of
YLL among which females reported 1.6 times more YLL than males. In Eastern development
region all the YLL was accounted by elderly female population while far-western development
region entire YLL was reported by elderly male population.
Figure 3.4.27: Percentage YLL distribution due to Asthma

Assessment of Burden of Disease in Nepal
118
Table 3.4.32: YLL distribution of Asthma
Background characteristics Age Group
Total YLL 30-59 60+
Development Region
Eastern
Female 0 100 100 74
Total 0 100 100 74
Central
Male 13.7 86.3 100 758
Female 52.8 47.2 100 971
Total 35.7 64.3 100 1729
Western
Male 0.0 100.0 100 124
Total 0.0 100.0 100 124
Mid-Western
Male 11.3 88.7 100 665
Female 51.3 48.7 100 474
Total 27.9 72.1 100 1139
Far-Western
Male 0.0 100.0 100 20
Total 0.0 100.0 100 20
Eco-region
Mountain
Male 53.9 46.1 100 194
Female 0.0 100.0 100 167
Total 29.0 71.0 100 361
Hill
Male 0.0 100.0 100 565
Female 54.7 45.3 100 938
Total 34.1 65.9 100 1503
Terai
Male 9.3 90.7 100 807
Female 58.6 41.4 100 415
Total 26.0 74.0 100 1222
National
Male 11.4 88.6 100 1565
Female 49.8 50.2 100 1521
Total 30.3 69.7 100 3086
II-H4 Other respiratory diseases Total years of life lost due to other respiratory diseases were found to be 3470 years.
Ecologically the majority of other respiratory diseases was observed highest in mountain (45%)
and lowest in the terai region (21.3%). The development region-wise distribution shows a
different pattern more than sixty (62.1%) percent of YLL was solely observed in the eastern
development region while least (3.3%) was reported by far-western development region.

Assessment of Burden of Disease in Nepal
119
The following table shows that the distribution of other respiratory diseases among which 2765
(79.7%) years of life lost was observed to be accounted by male and 705 (20.3%) was observed
to be accounted by female and respectively.
Table 3.4.33: YLL distribution of Other respiratory diseases
Background characteristics
Age Group
Total YLL 15-29 30-59 60+
Development Region
Eastern
Male 19.3 65.7 15.0 100.0 1692
Female 33.8 0.0 66.2 100.0 464
Total 22.4 51.6 26.0 100.0 2156
Central
Male 0 0.0 100.0 100.0 84
Female 0 100.0 0.0 100.0 241
Total 0 74.2 25.8 100.0 325
Western
Male 0 0 100 100 437
Total 0 0 100 100 437
Mid-Western
Male 0 0 100 100 437
Total 0 0 100 100 437
Far-Western
Male 0 100 0 100 115
Total 0 100 0 100 115
Eco-region
Mountain
Male 30.0 62.3 7.7 100.0 1092
Female 33.3 51.1 15.7 100.0 472
Total 31.0 58.9 10.1 100.0 1564
Hill
Male 0 0 100 100 935
Female 0 0 100 100 233
Total 0 0 100 100 1168
Terai
Male 0 74.0 26.02 100 738
Total 0 74.0 26.02 100 738
National
Male 11.8 44.4 43.8 100 2765
Female 22.3 34.2 43.5 100 705
Total 13.9 42.3 43.7 100 3470
Figure 3.4.28: Percentage YLL distribution due to Other respiratory diseases
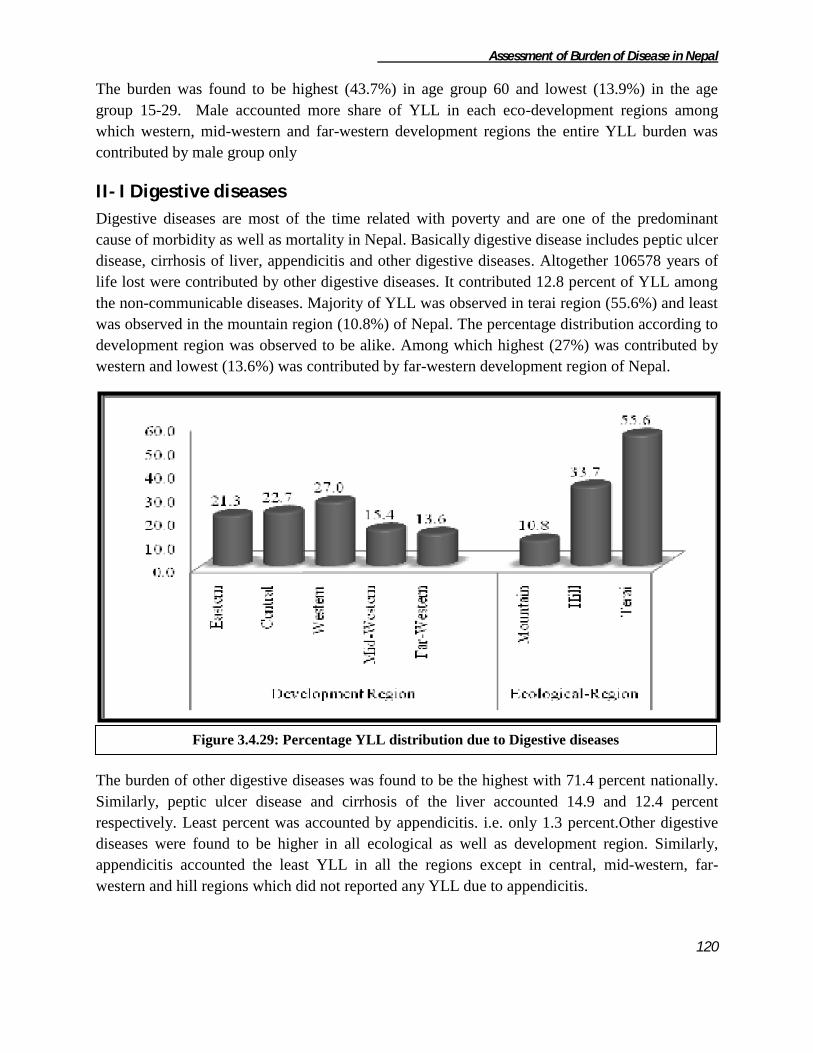
Assessment of Burden of Disease in Nepal
120
The burden was found to be highest (43.7%) in age group 60 and lowest (13.9%) in the age
group 15-29. Male accounted more share of YLL in each eco-development regions among
which western, mid-western and far-western development regions the entire YLL burden was
contributed by male group only
II- I Digestive diseases
Digestive diseases are most of the time related with poverty and are one of the predominant
cause of morbidity as well as mortality in Nepal. Basically digestive disease includes peptic ulcer
disease, cirrhosis of liver, appendicitis and other digestive diseases. Altogether 106578 years of
life lost were contributed by other digestive diseases. It contributed 12.8 percent of YLL among
the non-communicable diseases. Majority of YLL was observed in terai region (55.6%) and least
was observed in the mountain region (10.8%) of Nepal. The percentage distribution according to
development region was observed to be alike. Among which highest (27%) was contributed by
western and lowest (13.6%) was contributed by far-western development region of Nepal.
The burden of other digestive diseases was found to be the highest with 71.4 percent nationally.
Similarly, peptic ulcer disease and cirrhosis of the liver accounted 14.9 and 12.4 percent
respectively. Least percent was accounted by appendicitis. i.e. only 1.3 percent.Other digestive
diseases were found to be higher in all ecological as well as development region. Similarly,
appendicitis accounted the least YLL in all the regions except in central, mid-western, far-
western and hill regions which did not reported any YLL due to appendicitis.
Figure 3.4.29: Percentage YLL distribution due to Digestive diseases

Assessment of Burden of Disease in Nepal
121
II-I1 Peptic ulcer disease Peptic ulcer is a common type of digestive problem in Nepal. Among the digestive diseases it
ranked top second position accounting altogether 14.9 percent i.e. 15914 years of life lost. The
distribution of YLL burden was observed highest in the terai (48.7%) region and lowest in the
mountain (15.1%) region. The development wise distribution shows majority of share
contributed by western (32.2%) development and least was shared by eastern (7.1%)
development region of Nepal.
The table 3.4.33 shows the age and sex-wise distribution of YLL due to peptic ulcer. Majority of
YLL was accounted by female contributing 9466 YLL i.e. 59.5 percent nationally. Similarly, the
age distribution of YLL shows maximum (92.8%) reported by above 30 years of age and
E C W MW FW M H T
1 Peptic ulcer disease 5.0 19.8 17.8 16.9 14.6 20.9 16.1 13.1 14.9
2 Cirrhosis of the liver 5.4 17.4 17.7 15.8 0.5 11.9 14.7 11.1 12.4
3 Appendicitis 1.5 0.0 3.7 0.0 0.0 0.5 0.0 2.3 1.3
4 Other digestive diseases 88.1 62.8 60.8 67.3 84.9 66.7 69.2 73.6 71.4
Total 100 100 100 100 100 100 100 100 100
Total YLL 22676 24227 28820 16375 14480 11475 35889 59214 106578
Development Region Eco-RegionS.N. Digestive diseases National
Table 3.4.34: YLL Distribution of digestive diseases
Figure 3.4.30: Percentage YLL distribution due to Peptic ulcer disease
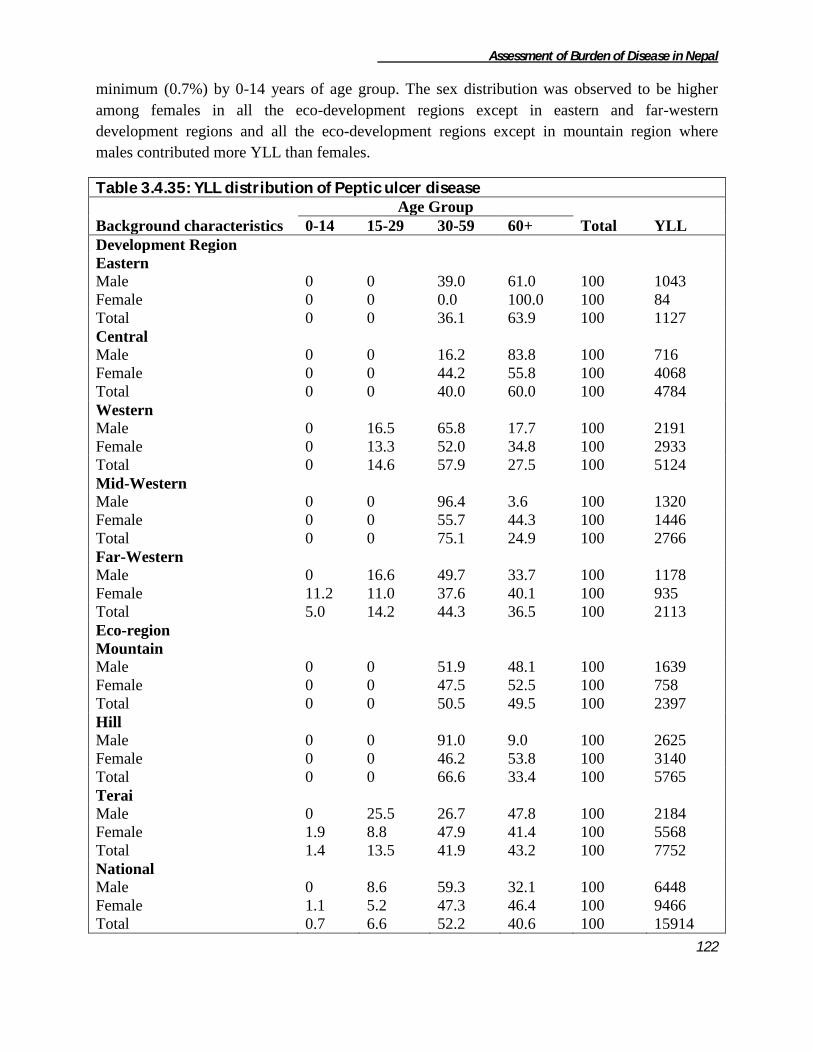
Assessment of Burden of Disease in Nepal
122
minimum (0.7%) by 0-14 years of age group. The sex distribution was observed to be higher
among females in all the eco-development regions except in eastern and far-western
development regions and all the eco-development regions except in mountain region where
males contributed more YLL than females.
Table 3.4.35: YLL distribution of Peptic ulcer disease
Background characteristics
Age Group
Total YLL 0-14 15-29 30-59 60+
Development Region
Eastern
Male 0 0 39.0 61.0 100 1043
Female 0 0 0.0 100.0 100 84
Total 0 0 36.1 63.9 100 1127
Central
Male 0 0 16.2 83.8 100 716
Female 0 0 44.2 55.8 100 4068
Total 0 0 40.0 60.0 100 4784
Western
Male 0 16.5 65.8 17.7 100 2191
Female 0 13.3 52.0 34.8 100 2933
Total 0 14.6 57.9 27.5 100 5124
Mid-Western
Male 0 0 96.4 3.6 100 1320
Female 0 0 55.7 44.3 100 1446
Total 0 0 75.1 24.9 100 2766
Far-Western
Male 0 16.6 49.7 33.7 100 1178
Female 11.2 11.0 37.6 40.1 100 935
Total 5.0 14.2 44.3 36.5 100 2113
Eco-region
Mountain
Male 0 0 51.9 48.1 100 1639
Female 0 0 47.5 52.5 100 758
Total 0 0 50.5 49.5 100 2397
Hill
Male 0 0 91.0 9.0 100 2625
Female 0 0 46.2 53.8 100 3140
Total 0 0 66.6 33.4 100 5765
Terai
Male 0 25.5 26.7 47.8 100 2184
Female 1.9 8.8 47.9 41.4 100 5568
Total 1.4 13.5 41.9 43.2 100 7752
National
Male 0 8.6 59.3 32.1 100 6448
Female 1.1 5.2 47.3 46.4 100 9466
Total 0.7 6.6 52.2 40.6 100 15914

Assessment of Burden of Disease in Nepal
123
II-I2 Cirrhosis of the liver Years of life lost due to cirrhosis of liver was found to be 13201 years which was 12.4 percent
among the digestive diseases. The eco-development wise distribution shows majority of YLL
accounted by terai (49.6%) and western development (38.6%) region and least was accounted by
the mountain (10.4%) and far-western (0.6%) development region of Nepal.
The sex-wise distribution shows that males accounted 9099 (68.9%) and female accounted 4102
(31.1%) YLL out of the total. Majority of YLL was contributed by the elderly (48.9%) age group
while least YLL was recorded in the 0-14 years of age group. In all the ecological regions males
contributed more YLL than females. Development region wise also more YLL was observed in
males group except in central development region where females accounted more YLL than
males. The entire YLL was reported by males in the far-western development region.
Figure 3.4.31: Percentage YLL distribution due to Cirrhosis of the liver

Assessment of Burden of Disease in Nepal
124
Table 3.4.36: YLL distribution of Cirrhosis of the liver
Background characteristics Age Group
Total YLL 0-14 15-29 30-59 60+
Development Region
Eastern
Male 0 0 63.6 36.4 100 960
Female 0 0 0.0 100.0 100 268
Total 0 0 49.8 50.2 100 1228
Central
Male 0 0 79.1 20.9 100 1985
Female 0 47.8 31.5 20.8 100 2236
Total 0 25.3 53.9 20.8 100 4221
Western
Male 0 0 41.8 58.2 100 4022
Female 0 0 50.8 49.2 100 1070
Total 0 0 43.7 56.3 100 5092
Mid-Western
Male 12.3 5.9 5.6 76.2 100 2055
Female 0.0 0.0 0.0 100.0 100 526
Total 9.8 4.7 4.5 81.1 100 2581
Far-Western
Male 0 0 100 0 100 79
Total 0 0 100 0 100 79
Eco-region
Mountain
Male 18.9 0.0 52.9 28.2 100 1334
Female 0.0 0.0 0.0 100.0 100 36
Total 18.4 0.0 51.5 30.1 100 1370
Hill
Male 0 0 25.9 74.1 100 3999
Female 0 0 0.0 100.0 100 1285
Total 0 0 19.6 80.4 100 5284
Terai
Male 0 3.2 61.5 35.3 100 3766
Female 0 38.4 44.9 16.7 100 2781
Total 0 18.2 54.4 27.4 100 6547
National
Male 2.8 1.3 44.6 51.3 100 9099
Female 0.0 26.0 30.4 43.5 100 4102
Total 1.9 9.0 40.2 48.9 100 13201
II-I3 Appendicitis Appendicitis is not the serious public health problem in Nepal although this study shows
appendicitis to account 1419 years of life lost. Among the total YLL due to appendicitis males
shared 743 and females shared 676 years. The YLL was observed ecologically only in mountain
(4.2%) and terai (95.8%) region and developmental region wise only in eastern (24.5%) and
western (75.5%) development region. The sex-wise distribution showed males contributing more
(52.4%) YLL than the females. No YLL burden was observed below 15 years and the highest
share of YLL was contributed by the age group 15 to 29 years. The least was found in the elderly
age group.

Assessment of Burden of Disease in Nepal
125
Table 3.4.37: YLL distribution of Appendicitis
Background characteristics Age Group
Total YLL 15-29 30-59 60+
Development Region
Eastern
Male 0 0 100 100 60
Female 0 100 0 100 287
Total 0 82.7 17.3 100.0 347
Western
Male 52.9 47.1 0 100 683
Female 100.0 0.0 0 100 389
Total 70.0 30.0 0 100 1072
Eco-region
Mountain
Male 0 0 100 100 60
Total 0 0 100 100 60
Terai
Male 52.9 47.1 0.0 100 683
Female 57.5 42.5 0.0 100 676
Total 55.2 44.8 0.0 100 1359
National
Male 48.6 43.3 8.1 100 743
Female 57.5 42.5 0.0 100 676
Total 52.9 42.9 4.2 100 1419
II-I4 Other digestive diseases Gastro-intestinal bleeding, abdominal pain cholilithiasis (gall stone), swollen abdomen etc were
kept under the category of other digestive diseases. Years of life lost due to other digestive
diseases were found to be 76046 years. The ecological distribution revealed that majority
(57.3%) of YLL was observed in the terai while least (10.1%) was observed in the mountain
region. Similarly eastern development region showed highest (26.2%) share of YLL and least
was observed in the mid-western development region of Nepal.
Figure 3.4.32: Percentage YLL distribution due to Other digestive diseases

Assessment of Burden of Disease in Nepal
126
The sex-wise distribution shows the majority (51.2%) i.e. 38998 YLL contributed by males. The
burden was found to be more in age group 30-59 (46.2%) nationally which was observed in all
the eco-development regions and all sex groups except in the central development where in the
females group elderly women showed the highest (50.3%) share of YLL. Sex-wise distribution
showed that in all the ecological region males accounted more YLL than females except in the
terai region. Similarly, only in the eastern, western and far-western development regions males
accounted more YLL than the females.
Table 3.4.38: YLL distribution of Other digestive diseases
Background characteristics Age Group
Total YLL 0-14 15-29 30-59 60+
Development Region
Eastern
Male 11.9 13.1 38.9 36.1 100 8822
Female 10.6 8.3 48.3 32.9 100 11154
Total 11.1 10.4 44.1 34.3 100 19976
Central
Male 17.8 1.8 47.4 33.0 100 9035
Female 16.9 2.7 30.1 50.3 100 6188
Total 17.4 2.2 40.4 40.0 100 15223
Western
Male 9.3 9.0 52.1 29.6 100 7828
Female 11.2 11.6 53.1 24.1 100 9702
Total 10.4 10.4 52.7 26.5 100 17530
Mid-Western
Male 15.0 0.0 54.4 30.6 100 5151
Female 6.9 11.2 52.8 29.2 100 5877
Total 10.7 6.0 53.5 29.8 100 11028
Far-Western
Male 23.0 8.1 44.0 24.8 100 8162
Female 31.7 5.3 35.6 27.4 100 4127
Total 25.9 7.2 41.2 25.7 100 12289
Eco-region
Mountain
Male 31.5 9.0 39.4 20.2 100 4501
Female 25.8 26.1 30.9 17.1 100 3149
Total 29.2 16.0 35.9 18.9 100 7650
Hill
Male 5.3 3.5 50.2 40.9 100 13395
Female 6.3 2.4 57.4 33.9 100 11444
Total 5.8 3.0 53.5 37.7 100 24839
Terai
Male 18.5 8.6 46.0 27.0 100 21102
Female 15.6 8.9 42.0 33.6 100 22455
Total 17.0 8.7 43.9 30.4 100 43557
National
Male 15.5 6.9 46.7 31.0 100 38998
Female 13.6 8.4 45.8 32.3 100 37048
Total 14.5 7.6 46.2 31.6 100 76046

Assessment of Burden of Disease in Nepal
127
II-J Genito-urinary diseases
Genito-urinary diseases are divided into nephritis and nephrosis, benign prostatic hypertrophy,
and other genitourinary system diseases. Altogether 8.6% of YLL was contributed by
genitourinary diseases among non-communicable diseases. It was observed that terai accounted
majority of YLL (46.1%) and least aws contributed by mountain (13.7%) region. Similarly the
central development region accounted highest YLL and far-western development region sahred
the least YLL (10.9%) due to genitor-urinary diseases.
The following table 3.4.37 shows that the YLL burden of other genitourinary system disease to
be highest with 92 percent and similarly, benign prostatic hypertrophy was found to contribute
least YLL (0.2%) nationally. The trend was observed similar in all the ecological and
development regions of Nepal, highest was other genitourinary system disease and lowest was
contributed by benign prostatic hypertrophy.
E C W MW FW M H T
1 Nephritis and nephrosis 14.9 1.3 14.0 7.4 6.3 16.2 6.8 6.2 7.8
2 Benign prostatic hypertrophy 0.0 0.0 0.9 0.0 0.3 0.2 0.0 0.4 0.2
3 Other genitourinary system diseases 85.1 98.7 85.1 92.6 93.3 83.6 93.2 93.4 92.0
Total 100 100 100 100 100 100 100 100 100
Total YLL 12525 24081 13398 13951 7816 9870 28817 33082 71770
Development Region Eco-RegionS.N. Genito-urinary diseases National
Table 3.4.39: YLL Distribution of Genito-urinary Diseases
Figure 3.4.33: Percentage YLL distribution due to Genito-urinary diseases

Assessment of Burden of Disease in Nepal
128
II-J1 Nephritis and nephrosis Years of life lost due to Nephritis and Nephrosis was found to be 5598 years which was 7.8
percent out of the total genitor-urinary diseases. Terai region accounted majority of YLL
comprising 36.5 percent and mountain accounted least comprising only 28.5 percent of YLL in
this category. Similarly, eastern and western development regions accounted almost equal
number of percentage (i.e. 33.4 and 33.5 percent respectively) of YLL in this category and least
was accounted by central development region (5.8%).
The 0-14 years of age group was found to be most affected (97.5 percent) among the whole
burden in this cagtegory. The burden was distributed through all ecological regions with loss of
2044 years, 1957 years and 1558 years of life in Terai, Hill and Mountain respectively. Eastern
and western development region was found mostly affected than other development region with
1869 years and 1873 years of life lost. Similarly, 1037 years of life was lost at Midwestern
development region.
Figure 3.4.34: Percentage YLL distribution due to Nephritis and nephrosis

Assessment of Burden of Disease in Nepal
129
Table 3.4.40: YLL distribution of Nephritis and nephrosis
Background characteristics Age Group
Total YLL 0-14 60+
Development Region
Eastern
Male 100 0 100 1347
Female 100 0 100 521
Total 100 0 100 1868
Central
Female 56.2 43.8 100 324
Total 56.2 43.8 100 324
Western
Male 100 0 100 1149
Female 100 0 100 724
Total 100 0 100 1873
Mid-Western
Male 100 0 100 785
Female 100 0 100 252
Total 100 0 100 1037
Far-Western
Female 100 0 100 496
Total 100 0 100 496
Eco-region
Mountain
Male 100 0 100 994
Female 100 0 100 603
Total 100 0 100 1597
Hill
Male 100 0 100 1569
Female 63.4 36.6 100 388
Total 92.7 7.3 100 1957
Terai
Male 100 0 100 718
Female 100 0 100 1326
Total 100 0 100 2044
National
Male 100 0 100 3281
Female 93.9 6.1 100 2317
Total 97.5 2.5 100 5598
II-J2 Benign prostatic hypertrophy Being a disease of males benign prostatic hypertrophy was found to account 147 years of life lost
which was 0.2 percent among the genitourinary system diseases nationally. It was only observed
among the elderly (60+) population. The burden was more in terai with 123 YLL (83.7%) and
only 24 YLL (16.3%) in mountain region. Similarly, the development region wise distribution
showed 124 years of life (83.7%) in western and only 24 YLL (16.3%) in far-western
development region of Nepal. Other regions did not report any YLL due to benign prostatic
hypertrophy.

Assessment of Burden of Disease in Nepal
130
Table 3.4.41: YLL distribution of Benign prostatic hypertrophy
Background characteristics Total YLL
Development Region
Western 100 123
Far-Western 100 24
Eco-Region
Mountain 100 24
Terai 100 123
National 100 147
II-J3 Other genitourinary system The other genitourinary system diseases were found to account 66023 years of life lost which
covered majority i.e. 92 percent of YLL among the genitor-urinary diseases. The ecological
distribution shows the majority of YLL contributed by the terai region (46.8%) and least was
contributed by the mountain region (12.5%). Likewise the distribution of YLL according to
development region shows majority of YLL contributed by central development region and
minimum was contributed by far-western development region of Nepal.
The following table shows the YLL distribution due to other genito-urinary diseases. Males were
found contributing 38428 years of life lost (58.2%) and females were responsible to account
27595 years of life (41.8%). Distribution according to the age group shows majority of YLL
contributed by elderly age group (42.1%) and least was observed in the 0-14 years of age group
Figure 3.4.35: Percentage YLL distribution due to Other genitourinary system

Assessment of Burden of Disease in Nepal
131
(8.7%) nationally. The sex distribution of YLL in all the eco-development regions was observed
higher among males except in mountain region where it was observed to be slight more among
females.
Table 3.4.42: YLL distribution of Other genitourinary system diseases
Background characteristics
Age Group
Total YLL 0-14 15-29 30-59 60+
Development Region
Eastern
Male 20.4 8.6 43.9 27.1 100 6648
Female 0.0 17.3 44.0 38.7 100 4008
Total 12.7 11.9 44.0 31.4 100 10656
Central
Male 9.3 23.2 30.7 36.8 100 12950
Female 0.0 1.5 54.6 43.8 100 10807
Total 5.1 13.4 41.6 40.0 100 23757
Western
Male 15.6 15.6 21.6 47.2 100 7423
Female 0.0 9.2 25.8 65.0 100 3977
Total 10.2 13.4 23.1 53.4 100 11400
Mid-Western
Male 10.1 17.2 29.3 43.4 100 7755
Female 11.3 2.3 36.1 50.3 100 5160
Total 10.6 11.3 32.0 46.2 100 12915
Far-Western
Male 18.9 3.2 36.7 41.1 100 3652
Female 0.0 2.6 59.2 38.1 100 3643
Total 9.5 2.9 48.0 39.6 100 7295
Eco-Region
Mountain
Male 27.1 11.0 42.1 19.9 100 4062
Female 13.9 7.6 41.7 36.9 100 4187
Total 20.4 9.3 41.9 28.5 100 8249
Hill
Male 9.9 12.1 24.8 53.2 100 15812
Female 0.0 4.9 33.2 61.9 100 11048
Total 5.8 9.1 28.2 56.8 100 26860
Terai
Male 13.6 20.7 34.9 30.8 100 18554
Female 0.0 4.7 59.1 36.2 100 12360
Total 8.2 14.3 44.6 33.0 100 30914
National
Male 13.5 16.1 31.5 38.9 100 38428
Female 2.1 5.2 46.1 46.6 100 27595
Total 8.7 11.6 37.6 42.1 100 66023
II-K Skin diseases
Skin diseases have been the disease with high morbidity in Nepal however its mortality is low.
Total years of life lost due to skin disease were found to be 3097 years. More than two third

Assessment of Burden of Disease in Nepal
132
(66%) was observed in the terai region while least (13.6%) was observed in the hill region of
Nepal. Similarly, according to the development regions, the highest YLL was observed in the
eastern region (42.1%) and the least was observed in the central development (6.7%) region of
Nepal.
The age and sex-wise distribution is presented in the table 3.4.41 below. The burden according to
the sex was observed higher among the females i.e. 1818 years of life lost and 1279 years of life
lost among males. The mortality burden was observed higher among females in all the eco-
development regions except in the far-western development and hill region of Nepal where
males accounted more YLL than the females. Similarly, the age distribution was found to be
more in the age group 0-14 (66%) and least was observed in the age group 30-59 (16.3%). No
YLL due to skin diseases was observed in the 15-29 years of age group. The age distribution was
observed dissimilar in all the regions like in hill and central development region all the YLL was
concentrated in the elderly group.
Figure 3.4.36: Percentage YLL distribution due to Skin diseases
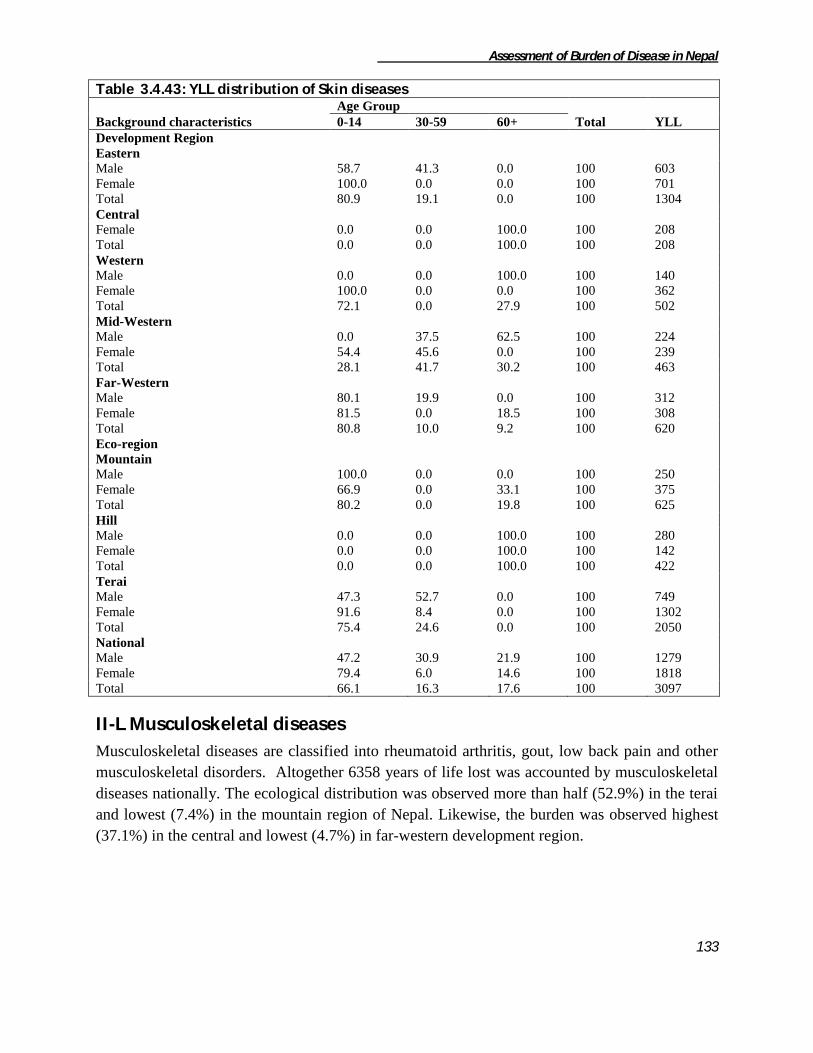
Assessment of Burden of Disease in Nepal
133
Table 3.4.43: YLL distribution of Skin diseases
Background characteristics
Age Group
Total YLL 0-14 30-59 60+
Development Region
Eastern
Male 58.7 41.3 0.0 100 603
Female 100.0 0.0 0.0 100 701
Total 80.9 19.1 0.0 100 1304
Central
Female 0.0 0.0 100.0 100 208
Total 0.0 0.0 100.0 100 208
Western
Male 0.0 0.0 100.0 100 140
Female 100.0 0.0 0.0 100 362
Total 72.1 0.0 27.9 100 502
Mid-Western
Male 0.0 37.5 62.5 100 224
Female 54.4 45.6 0.0 100 239
Total 28.1 41.7 30.2 100 463
Far-Western
Male 80.1 19.9 0.0 100 312
Female 81.5 0.0 18.5 100 308
Total 80.8 10.0 9.2 100 620
Eco-region
Mountain
Male 100.0 0.0 0.0 100 250
Female 66.9 0.0 33.1 100 375
Total 80.2 0.0 19.8 100 625
Hill
Male 0.0 0.0 100.0 100 280
Female 0.0 0.0 100.0 100 142
Total 0.0 0.0 100.0 100 422
Terai
Male 47.3 52.7 0.0 100 749
Female 91.6 8.4 0.0 100 1302
Total 75.4 24.6 0.0 100 2050
National
Male 47.2 30.9 21.9 100 1279
Female 79.4 6.0 14.6 100 1818
Total 66.1 16.3 17.6 100 3097
II-L Musculoskeletal diseases
Musculoskeletal diseases are classified into rheumatoid arthritis, gout, low back pain and other
musculoskeletal disorders. Altogether 6358 years of life lost was accounted by musculoskeletal
diseases nationally. The ecological distribution was observed more than half (52.9%) in the terai
and lowest (7.4%) in the mountain region of Nepal. Likewise, the burden was observed highest
(37.1%) in the central and lowest (4.7%) in far-western development region.
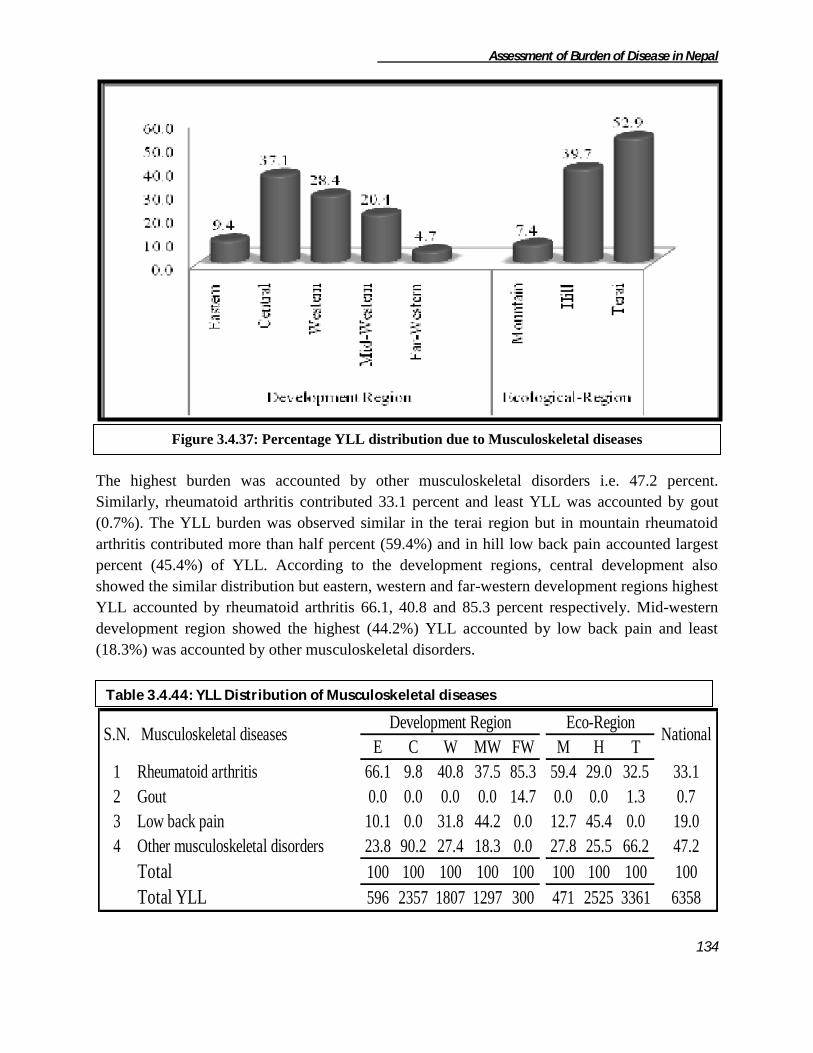
Assessment of Burden of Disease in Nepal
134
The highest burden was accounted by other musculoskeletal disorders i.e. 47.2 percent.
Similarly, rheumatoid arthritis contributed 33.1 percent and least YLL was accounted by gout
(0.7%). The YLL burden was observed similar in the terai region but in mountain rheumatoid
arthritis contributed more than half percent (59.4%) and in hill low back pain accounted largest
percent (45.4%) of YLL. According to the development regions, central development also
showed the similar distribution but eastern, western and far-western development regions highest
YLL accounted by rheumatoid arthritis 66.1, 40.8 and 85.3 percent respectively. Mid-western
development region showed the highest (44.2%) YLL accounted by low back pain and least
(18.3%) was accounted by other musculoskeletal disorders.
E C W MW FW M H T
1 Rheumatoid arthritis 66.1 9.8 40.8 37.5 85.3 59.4 29.0 32.5 33.1
2 Gout 0.0 0.0 0.0 0.0 14.7 0.0 0.0 1.3 0.7
3 Low back pain 10.1 0.0 31.8 44.2 0.0 12.7 45.4 0.0 19.0
4 Other musculoskeletal disorders 23.8 90.2 27.4 18.3 0.0 27.8 25.5 66.2 47.2
Total 100 100 100 100 100 100 100 100 100
Total YLL 596 2357 1807 1297 300 471 2525 3361 6358
Development Region Eco-RegionS.N. Musculoskeletal diseases National
Table 3.4.44: YLL Distribution of Musculoskeletal diseases
Figure 3.4.37: Percentage YLL distribution due to Musculoskeletal diseases

Assessment of Burden of Disease in Nepal
135
II-L1 Rheumatoid arthritis
Rheumatoid arthritis is a long-term disease that leads to inflammation of the joints and
surrounding tissues. It can also affect other organs. It can occur at any age and women get more
infected. Years of life lost due to rheumatoid arthritis was found to be 2106 years which was
33.1 percent of musculoskeletal diseases. Terai region showed the highest YLL (51.9%) and the
least was accounted by mountain region (13.3%). The development wise distribution showed that
western region accounted highest YLL (35%) and least was accounted by central development
region (11%).
The study revealed that females contributed more YLL (53%) nationally. Almost all the YLL
was observed among the elderly population. The proportion of YLL was observed five times
more among the females in eastern development region. The burden was found to be more
among females in all regions except in central, western and terai regions where males accounted
more YLL than the females.
Table 3.4.45: YLL distribution of Rheumatoid arthritis
Background characteristics Sex
Total YLL Male Female
Development Region
Eastern 15.7 84.3 100 394
Central 71.4 28.6 100 231
Western 76.0 24.0 100 738
Mid-Western 23.8 76.2 100 487
Far-Western 26.6 73.4 100 256
Eco-region
Mountain 33.6 66.4 100 280
Hill 23.1 76.9 100 733
Terai 64.8 35.2 100 1093
National 46.2 53.8 100 2106
Figure 3.4.38: Percentage YLL distribution due to Rheumatoid arthritis

Assessment of Burden of Disease in Nepal
136
II-L3 Gout Gout was observed to contribute negligible amount i.e. only 44 (0.7%) YLL among the
musculoskeletal diseases. Age distribution showed occurrence of gout among elderly population
only and was observed in the far-western terai region of Nepal.
II-L4 Low back pain Low back pain was responsible to lose 1207 years of life among which 340 years and 867 years
of life was lost by male and female respectively. The entire affected were of age 60 and above.
The burden was found to be more in hill region with 1147 years of life lost while only 60 years
of life were lost at mountain region. Western and Midwestern development region equally
accounts 574 years of life lost while 60 years of life were lost in eastern development region.
Table 3.4.46: YLL distribution of Low back pain
Background characteristics Sex Total YLL Male Female
Development region
Eastern 100 0 100 60
Western 24.4 75.6 100 573
Mid-Western 24.4 75.6 100 574
Ecological region
Mountain 100 0 100 60
Hill 24.4 75.6 100 1147
National 28.2 71.8 100 1207
II-L5 Other musculoskeletal diseases Years of life lost due to other musculoskeletal disorders was found to be 2999 years. About three
fourth (74.1%) of YLL was observed in the terai region and least was observed in the mountain
region (4.4%). Similarly, central development region accounted largest (70.9%) YLL while
lowest was observed in the eastern development region. Far-western development region did not
account any of the YLL.
Figure 3.4.39: Percentage YLL distribution due to Other musculoskeletal diseases
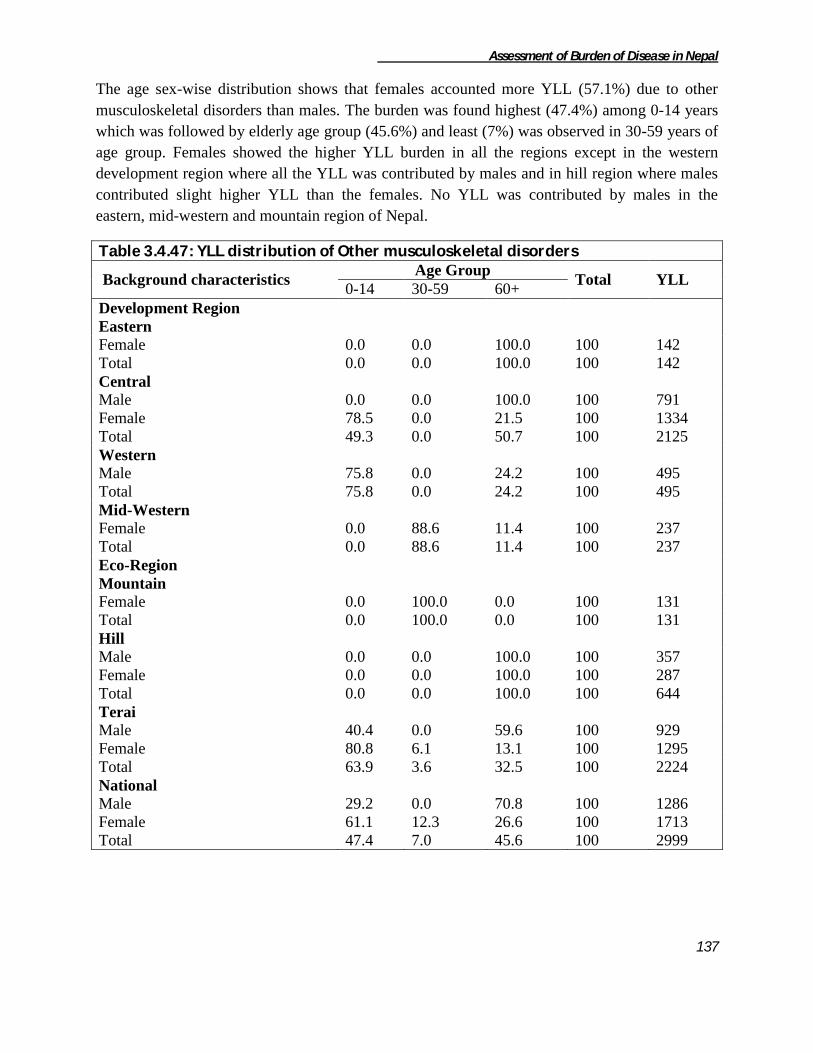
Assessment of Burden of Disease in Nepal
137
The age sex-wise distribution shows that females accounted more YLL (57.1%) due to other
musculoskeletal disorders than males. The burden was found highest (47.4%) among 0-14 years
which was followed by elderly age group (45.6%) and least (7%) was observed in 30-59 years of
age group. Females showed the higher YLL burden in all the regions except in the western
development region where all the YLL was contributed by males and in hill region where males
contributed slight higher YLL than the females. No YLL was contributed by males in the
eastern, mid-western and mountain region of Nepal.
Table 3.4.47: YLL distribution of Other musculoskeletal disorders
Background characteristics Age Group
Total YLL 0-14 30-59 60+
Development Region
Eastern
Female 0.0 0.0 100.0 100 142
Total 0.0 0.0 100.0 100 142
Central
Male 0.0 0.0 100.0 100 791
Female 78.5 0.0 21.5 100 1334
Total 49.3 0.0 50.7 100 2125
Western
Male 75.8 0.0 24.2 100 495
Total 75.8 0.0 24.2 100 495
Mid-Western
Female 0.0 88.6 11.4 100 237
Total 0.0 88.6 11.4 100 237
Eco-Region
Mountain
Female 0.0 100.0 0.0 100 131
Total 0.0 100.0 0.0 100 131
Hill
Male 0.0 0.0 100.0 100 357
Female 0.0 0.0 100.0 100 287
Total 0.0 0.0 100.0 100 644
Terai
Male 40.4 0.0 59.6 100 929
Female 80.8 6.1 13.1 100 1295
Total 63.9 3.6 32.5 100 2224
National
Male 29.2 0.0 70.8 100 1286
Female 61.1 12.3 26.6 100 1713
Total 47.4 7.0 45.6 100 2999

Assessment of Burden of Disease in Nepal
138
II-M Congenital anomalies
Congenital anomalies include spina bifida, anencephaly, anorectal atresia, cleft lip, cleft palate,
renal agenesis, congenital heart anomalies, unidentified congenital anomaly and other congenital
anomalies. Terai region was observed to contribute highest (52.8%) YLL while mountain region
showed the least (16.9%). Likewise, the YLL distribution was observed more over similar in all
the development regions. More than 20 percent of YLL was accounted by eastern, mid-western
and far-western development regions each while least (14.3%) was accounted by central
development region.
Among the mentioned categories of congenital anomalies, majority of YLL was contributed by
unidentified congenital anomalies (39.5%) and least was contributed by spina bifida,
anencephaly and renal agenesis contributing 2.8 percent each nationally. The distribution was
observed similar in all the regions except in central development and mountain region of Nepal
where cleft lip and other congenital anomalies contributed highest YLL respectively.
S.N. Congenital anomalies Development Region Eco-Region
National E C W MW FW
M H T
1 Unclassified Congenital anomalies 51.4 7.9 31.6 70.8 33.5
6.7 72.0 31.3 39.5
2 Spina bifida 0.0 0.0 9.8 0.0 0.0
0.0 0.0 4.3 2.3
3 Other Congenital anomalies 38.9 0.0 29.3 24.2 6.5
56.3 12.9 14.4 21.0
4 Anencephaly 0.0 0.0 9.8 0.0 0.0
0.0 0.0 4.3 2.3
5 Anorectal atresia 0.0 0.0 9.7 5.0 28.6
23.2 5.0 8.4 9.9
6 Cleft lip 0.0 46.4 0.0 0.0 2.9
0.0 0.0 13.9 7.3
7 Cleft palate 9.7 45.6 0.0 0.0 0.0
0.0 0.0 16.5 8.7
8 Renal agenesis 0.0 0.0 0.0 0.0 9.9
13.8 0.0 0.0 2.3
9 Congenital heart anomalies 0.0 0.0 9.8 0.0 18.6
0.0 10.1 6.9 6.7
Total 100 100 100 100 100
100 100 100 100
Total YLL 3604 2294 3718 2612 3805 2708 4858 8467 16033
Table 3.4.48: YLL distribution of Congenital Anomalies
Figure 3.4.40: Percentage YLL distribution due to Congenital anomalies

Assessment of Burden of Disease in Nepal
139
II-M1 Unclassified Congenital anomalies The highest percentage (39.5%) of YLL due to congenital anomalies remained unclassified.
Among the YLL more than half (55.2%) was observed in the hill region and least (2.9%) was
recorded in mountain region of Nepal. The development-wise distribution shows majority of
percentage (29.2%) in eastern and mid-western development regions each and least (2.9%) was
observed in central development region.
The age and sex-wise distribution of YLL due to unclassified congenital anomalies shows most
of the YLL (98.4%) was recorded in 0-14 years age group and least (1.6%) was observed in 15-
29 years age group. Likewise 54.4 percent of YLL was contributed by males nationally. The age
distribution of the unclassified congenital anomalies was concentrated in the 0-14 age group in
all the regions. All the YLL was contributed by females in mountain and central development
region. The YLL share was higher among males in all the regions except in western, mid-
western, and hill region of Nepal.
II-M2 Anencephaly Years of life lost due to anencephaly were found to be 364 years which was only 2.3 percent of
all congenital anomalies. The entire burden was found to be concentrated in western terai region
of Nepal.
Figure 3.4.41: Percentage YLL distribution due to Unclassified Congenital anomalies

Assessment of Burden of Disease in Nepal
140
II-M3 Anorectal Atresia
Anorectal atresia is a type of birth defect which becomes fatal sometimes. Years of life lost due
to anorectal atresia were observed to be 1583 years which was 9.9 percent among the total YLL
due to congenital anomalies. Terai contributed highest YLL (45%) and mountain contributed
lowest YLL (15.4%). Far-western development region contributed majority of YLL (68.9%) and
least was observed in mid-western development region. No YLL was recorded from eastern and
central development regions due to anorectael atresia.
Being a birth defect YLL due to anorectael atresia was totally observed among the 0-14 years of
age group only. The sex distribution shows males to contribute 844 years (53.3%) and remaining
was observed among female group i.e. 739 years of life were lost. In mid-western and hill
regions all the YLL was contributed by males only while in the western development region all
the YLL was contributed by females. Similarly, the eastern and central development did not
report any YLL due to anorectael atresia.
II-M4 Cleft Lip Years of life lost due to cleft lip were found to be 1175 which was 7.3 percent among the
congenital anomalies category. Total YLL was observed among males group only. Similarly, the
entire burden was found in terai region. Development region-wise it was observed in Central
region (1065 YLL) and in far-western development region (110 YLL) of Nepal.
II-M5 Cleft palate Years of life lost due to cleft palate was found to be 1398 which was 8.7 percent among the
congenital anomalies category. This study revealed all the YLL accounted by females group
only. Similarly, the entire burden was found in terai region. Development region-wise it was
observed in central region (1048 YLL) and in far-western development region (350 YLL) of
Nepal.
Figure 3.4.42: Percentage YLL distribution due to Anorectal Atresia
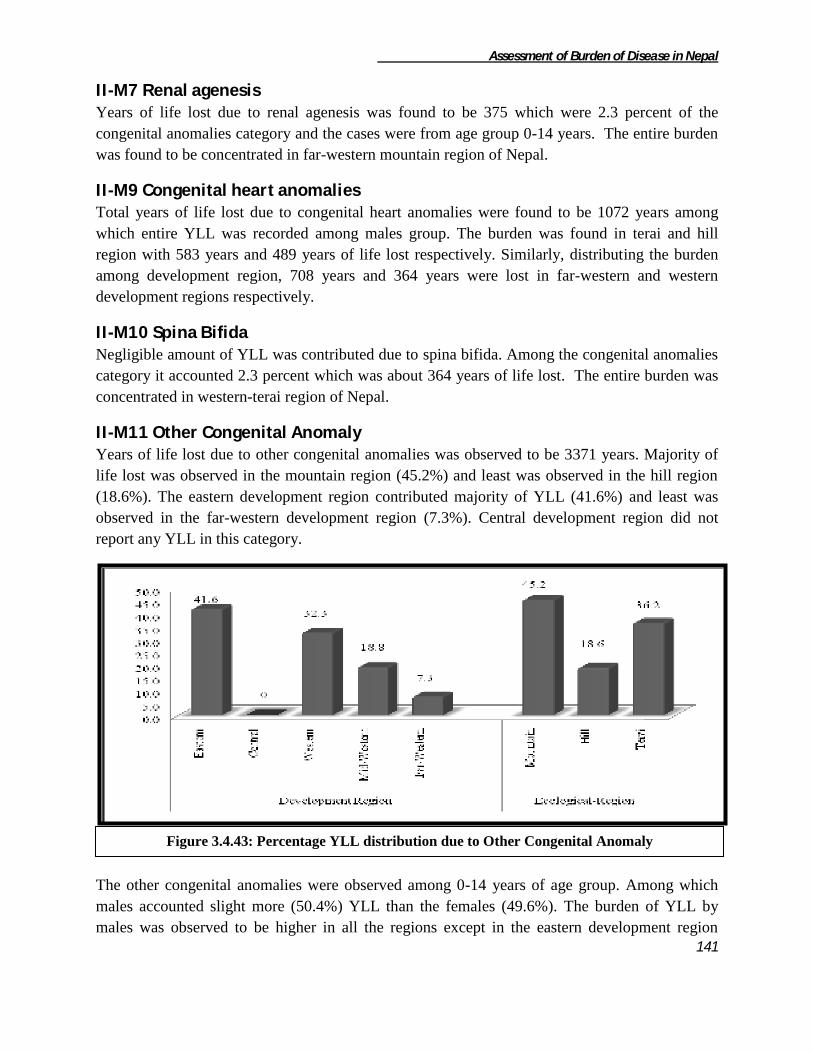
Assessment of Burden of Disease in Nepal
141
II-M7 Renal agenesis Years of life lost due to renal agenesis was found to be 375 which were 2.3 percent of the
congenital anomalies category and the cases were from age group 0-14 years. The entire burden
was found to be concentrated in far-western mountain region of Nepal.
II-M9 Congenital heart anomalies Total years of life lost due to congenital heart anomalies were found to be 1072 years among
which entire YLL was recorded among males group. The burden was found in terai and hill
region with 583 years and 489 years of life lost respectively. Similarly, distributing the burden
among development region, 708 years and 364 years were lost in far-western and western
development regions respectively.
II-M10 Spina Bifida Negligible amount of YLL was contributed due to spina bifida. Among the congenital anomalies
category it accounted 2.3 percent which was about 364 years of life lost. The entire burden was
concentrated in western-terai region of Nepal.
II-M11 Other Congenital Anomaly Years of life lost due to other congenital anomalies was observed to be 3371 years. Majority of
life lost was observed in the mountain region (45.2%) and least was observed in the hill region
(18.6%). The eastern development region contributed majority of YLL (41.6%) and least was
observed in the far-western development region (7.3%). Central development region did not
report any YLL in this category.
The other congenital anomalies were observed among 0-14 years of age group. Among which
males accounted slight more (50.4%) YLL than the females (49.6%). The burden of YLL by
males was observed to be higher in all the regions except in the eastern development region
Figure 3.4.43: Percentage YLL distribution due to Other Congenital Anomaly

Assessment of Burden of Disease in Nepal
142
where females accounted more YLL and in the far-western development region and hill region
where all the YLL was accounted by females group only. Similarly all the YLL was contributed
by males group in mid-western development region.
II-N Blood Disorder
Mortality due to blood disorder is also found prevalent in our country. This study revealed that
altogether 4620 years of life lost was contributed due to blood disorder. Majority of YLL was
contributed from terai (47.4%) and hill (45.3%) regions while least was observed from the
mountain (7.3%) region of Nepal. Eastern development region contributed the highest YLL
(57.3%) and least was recorded from the western development region (17.5%). No YLL was
recorded from central and far-western development region.
The age and sex-wise distribution of blood disorder is given in the table 3.4.54 below. Majority
(57.8%) of YLL was contributed by females group nationally. Children of age group 0-14 were
observed to contribute highest YLL (78.4%) out of total burden due to blood disorder and least
(9.3%) was observed among the elderly age group. The YLL burden was found higher among
females in all the regions except in eastern development and terai regions. Similarly, the entire
burden was accounted by males of 0-14 years in mountain region. The age distribution was
observed highest among the 0-14 years age group in all the eco-development regions of Nepal.
Table 3.4.49: YLL distribution of Blood Disorder
Figure: 3.4.44: Percentage YLL distribution due to Blood Disorder

Assessment of Burden of Disease in Nepal
143
Background characteristics Age Group
Total YLL 0-14 30-59 60+
Development region
Eastern
Male 87.6 0.0 12.4 100 1596
Female 33.4 44.4 22.2 100 1049
Total 66.1 17.6 16.3 100 2645
Western
Female 100 0 0 100 810
Total 100 0 0 100 810
Mid-Western
Male 71.8 28.2 0 100 355
Female 100.0 0.0 0 100 810
Total 91.4 8.6 0 100 1165
Eco-Region
Mountain
Male 100 0 0 100 338
Total 100 0 0 100 338
Hill
Female 77.4 11.5 11.1 100 2093
Total 77.4 11.5 11.1 100 2093
Terai
Male 81.5 6.2 12.3 100 1613
Female 60.8 39.2 0 100 576
Total 76.1 14.9 9.0 100 2189
National
Male 84.7 5.1 10.1 100 1951
Female 73.8 17.5 8.7 100 2669
Total 78.4 12.3 9.3 100 4620

Assessment of Burden of Disease in Nepal
144
3.5 Injuries
Injuries were observed to be responsible for 12 percent of total years of life lost nationally.
Injuries were distributed equally among all the development regions ranging from 21% to 23%
except in Far-Western region which was responsible for only 10% of total YLL. Distribution
among ecological regions shows that Terai and Hill regions are responsible for almost equal
share 44% and 41% respectively while Mountain region has minimum share 15% only.
Injuries are classified into two major categories i.e. unintentional and intentional injuries by
GBD 2000 classification. Among injury categories more than 2/3rd
of YLL (i.e. 69 percent) were
contributed by unintentional injuries. YLL due to injuries were observed in all the ecological and
developmental regions of Nepal. The entire ecological and developmental regions showed
similar distribution of the injury categories as the national. However, burden due to unintentional
injuries were found to be lower in Eastern region (62.5%) as compared to other regions as well
as national estimates.
Table 3.5.1 : YLL distribution of Unintentional Injuries
Injury Categories Development Region Ecological Region
National E C W MW FW M H T
Unintentional
Injuries 62.5 71.9 71.4 70.3 71.8 70.8 68.1 69.7 69.2
Intentional Injuries 37.5 28.1 28.6 29.7 28.2 29.2 31.9 30.3 30.8
Total 100 100 100 100 100 100 100 100 100
Total YLL 64606 61700 57993 65091 27369 41605 112782 122372 276759
0.0 5.0
10.0 15.0 20.0 25.0 30.0 35.0 40.0 45.0
East
ern
Cen
tral
Wes
tern
Mid
-Wes
tern
Far-
Wes
tern
Mo
un
tain
Hill
Tera
i
Development Region Ecological Region
23.3 22.3 21.0 23.5
9.9 15.0
40.8 44.2
Figure 3.5.1 Region wise distribution of total YLL due to Injuries

Assessment of Burden of Disease in Nepal
145
The distribution of injury category shows road traffic accident as the major cause of YLL sharing 21.8
percent out of total injuries. Likewise poisoning was the second leading cause of YLL in this category.
Snake bite covers 15.4 percent of YLL out of all. Conflict ranked 10th position contributing 1.8 percent of
YLL. At last 1.6 percent of YLL was contributed by other intentional injuries like Dakoits attack,
robberies etc.
Table 3.5.2: YLL distribution of Injury categories
Rank Injury categories YLL Percent
1 Road traffic accidents 59449 21.48
2 Poisonings 54179 19.58
3 Snake Bite 42613 15.40
4 Falls 38920 14.06
5 Fires 26796 9.68
6 Drownings 17769 6.42
7 Other unintentional injuries 12013 4.34
8 Self-inflicted injuries 9123 3.30
9 Violence 6099 2.20
10 Conflict 5186 1.87
11 Other intentional injuries 4613 1.67
Total 276759 100
III-A Unintentional Injuries The burden of injuries in Nepal has yet to be addressed in a systematic fashion. Altogether
191560 YLL had been lost due to injuries which are responsible for 69% of total YLL due to
injuries.
0.0 5.0
10.0 15.0 20.0 25.0 30.0 35.0 40.0 45.0
East
ern
Cen
tral
Wes
tern
Mid
-Wes
tern
Far-
Wes
tern
Mo
un
tain
Hill
Tera
i
Development Region Ecological Region
21.1 23.2 21.6 23.9
10.3 15.4
40.1 44.5
Figure 3.5.2 Region wise distribution of total YLL due to Unintentional Injuries

Assessment of Burden of Disease in Nepal
146
Region wise distribution shows similar pattern as that of total YLL distribution due to Injuries
with highest share of Terai (45%) followed by Hill (40%) and Mountain
(15%). Likewise burden is evenly distributed among the development regions except far-western
region which has only 10% burden.
Table 3.5.3 : YLL distribution of Unintentional Injuries
Cause Of Death Development Region Eco-Region
National E C W MW FW M H T
Road traffic accidents 14.4 25.5 27.7 22.4 19.2 10.6 27.7 21.3 22.2
Poisonings 2.7 5.1 2.8 2.0 3.5 3.2 1.9 4.3 3.2
Snake Bite 7.8 13.0 7.5 9.1 8.0 0.4 7.0 14.3 9.3
Falls 23.6 25.7 28.1 30.3 39.6 39.1 36.0 17.6 28.3
Fires 2.1 4.5 0.0 3.0 4.8 5.0 3.0 1.7 2.7
Drowning 31.1 19.6 23.8 11.0 14.3 16.4 11.4 29.7 20.3
Other unintentional
injuries 18.4 6.5 10.2 22.2 10.6 25.3 12.9 11.0 14.0
Total 100 100 100 100 100 100 100 100 100
Total YLL 40375 44361 41390 45776 19658 29460 76856 85244 191560
The YLL distribution due to Road Traffic Accident (RTA), Poisonings, Snake Bite, Falls, Fires,
Drowning and other unintentional injuries is shown in the Table 3.5.2. Majority of YLL i.e. 28.2
percent is contributed by fall which is followed by RTA (22.2%) and drowning (20.3%). Cause
specific YLL distribution among all the regions were similar to that of national except Terai and
Eastern region where the highest contributor is drowning instead of RTA. Even though the ranks
were similar to national, the percentage distribution was quite different. Percentage share of Falls
category was quite high in Mid-Western (30%), Far-Western (40%), Mountain (39%) and Hill
(36%) region as compared to national (28%). In contrast, its burden was only 18% in Terai.
Likewise, Burden of RTA were found to be little higher in Western and Hill region. Percentage
share of Poisonings were found to be almost two higher (5%) than national (3%) in Central
region. Eastern and Terai region had highest share of burden due to drowning; 31% and 30%
respectively.
III-A1 Road Traffic Accident Road traffic Accidents (RTA) has emerged as an important investigations during recent years in
Nepal. Years of life lost shared by RTA among the total unintentional injuries was found to be
the second highest responsible for about 22 percent of total YLL i.e. 42612 years. Development
region wise distribution shows the burden to be equally distributed in Central and Western region
(26%) followed by Mid-Western region (24%), Eastern (14%) and Far-Western (9%). While
ecological region wise distribution is different from that of distribution of total injuries. Unlike
total burden of injuries, Hill region has higher burden (50%) than Terai (43%), however,
Mountain region consistently shared minimum burden (7%).

Assessment of Burden of Disease in Nepal
147
According to the age and sex distribution of the mortality it was observed more among the males
almost 12 times higher than in females. All the regions also showed similar pattern, however the
difference varied with the regions. The male female difference was highest in Hill region with 20
times higher burden in males than in females. Likewise among the development regions this
difference was highest in Central region (16 times) followed by Eastern region (15 times). Age
wise distribution was higher in 15-29 age group (46%). Mountain and Terai regions had similar
distribution across the age groups except Hill region in which burden was highest in 30-59 age
group (51%). In contrast, all the regions had highest burden in 30-59 age group except Central
region.
0.0
10.0
20.0
30.0
40.0
50.0
60.0
East
ern
Cen
tral
Wes
tern
Mid
-Wes
tern
Far-
Wes
tern
Mo
un
tain
Hill
Tera
i
Development Region Ecological region
13.7
26.6 26.9 24.0
8.9 7.4
50.0
42.6
Figure 3.5.3. Region wise distribution of total YLL due to Road traffic Accidents

Assessment of Burden of Disease in Nepal
148
Table3.5.4: YLL distribution of Road traffic accidents
Background Characteristics Age Group
Total YLL 0-14 15-29 30-59 60+
Development Region
Eastern
Male 18.6 38.7 42.7 0.0 100 5443
Female 0.0 0.0 62.0 38.0 100 374
Total 17.4 36.2 44.0 2.4 100 5817
Central
Male 1.7 72.6 25.7 0.0 100 10642
Female 52.1 47.9 0.0 0.0 100 685
Total 4.8 71.1 24.1 0.0 100 11327
Western
Male 10.5 36.5 49.0 4.0 100 10602
Female 0.0 0.0 79.0 21.0 100 844
Total 9.7 33.9 51.2 5.3 100 11446
Mid-Western
Male 1.3 44.7 53.3 0.7 100 9424
Female 0.0 29.1 41.3 29.6 100 814
Total 1.2 43.4 52.3 3.0 100 10238
Far-Western
Male 3.9 39.0 43.7 13.4 100 3121
Female 50.8 0.0 31.7 17.5 100 662
Total 12.1 32.1 41.6 14.1 100 3783
Ecological region
Mountain
Male 12.8 61.2 21.3 4.7 100 2384
Female 47.5 43.7 0.0 8.8 100 751
Total 21.1 57.0 16.2 5.7 100 3135
Hill
Male 3.3 43.9 51.5 1.2 100 20282
Female 22.5 0.0 42.9 34.6 100 1027
Total 4.3 41.8 51.1 2.8 100 21309
Terai
Male 9.5 52.9 34.3 3.3 100 16566
Female 6.6 14.8 62.6 16.0 100 1601
Total 9.2 49.5 36.8 4.4 100 18167
National
Male 6.5 48.8 42.4 2.3 100 39233
Female 20.5 16.7 42.7 20.0 100 3379
Total 7.6 46.2 42.4 3.7 100 42612
III-A2 Poisonings Poisoning with various substance is common everywhere. Years of life lost shared by Poisonings
among the total unintentional injuries was found to be only about 3 percent of total YLL i.e.
6099 years. According to the age and sex distribution of the mortality it was observed more
among the males of 0-14 age group (47%). Sex wise distribution was similar to that of national
in all ecological regions, however, among development regions only Western regions had higher

Assessment of Burden of Disease in Nepal
149
burden in males than females. While Central and Far-Western regions showed females had
higher burden than males. Eastern and Mid-Western region had total burden in males only. Age
wise distribution among the regions was not consistent. Only Central and Terai regions had
highest burden in 0-14 age group while in case of Eastern and Mountain regions, it was in 15-29
age group. Likewise, in Hill, Mid-Western and Western region, majority of burden was in 60+
age group.
Table 3.5.5: YLL distribution of Poisonings
Background Characteristics Age Group
Total YLL 0-14 15-29 30-59 60+
Development Region
Eastern
Male 0.0 61.0 26.6 12.4 100 1071
Total 0.0 61.0 26.6 12.4 100 1071
Central
Male 100.0 0.0 0.0 0.0 100 1065
Female 88.0 0.0 12.0 0.0 100 1190
Total 93.7 0.0 6.3 0.0 100 2255
Western
Male 0.0 42.7 0.0 57.3 100 762
Female 100.0 0.0 0.0 0.0 100 390
Total 33.9 28.2 0.0 37.9 100 1152
Mid-Western
Male 14.0 27.1 12.0 46.9 100 931
Total 14.0 27.1 12.0 46.9 100 931
Far-Western
Male 0.0 0.0 100.0 0.0 100 75
Female 39.9 0.0 60.1 0.0 100 616
Total 35.6 0.0 64.4 0.0 100 691
Ecological region
Mountain
Male 0.0 83.1 0.0 16.9 100 786
Female 0.0 0.0 100.0 0.0 100 143
Total 0.0 70.3 15.4 14.3 100 929
Hill
Male 0.0 0.0 0.0 100.0 100 873
Female 39.9 0.0 60.1 0.0 100 616
Total 16.5 0.0 24.8 58.6 100 1489
Terai
Male 53.3 25.7 21.0 0.0 100 2243
Female 100.0 0.0 0.0 0.0 100 1437
Total 71.5 15.7 12.8 0.0 100 3680
National
Male 30.6 31.5 12.1 25.8 100 3903
Female 76.6 0.0 23.4 0.0 100 2196
Total 47.2 20.2 16.1 16.5 100 6099
Distributing YLL among the regions, its burden was found to be highest in Central region (37%)
while remaining four development regions had little difference in their percentage share ranging

Assessment of Burden of Disease in Nepal
150
from 11% to 19 %. Likewise, Terai was estimated to have more than double burden contributed
by Hill (24%) and four times more burden than Mountain (15%).
III-A3 Falls Nepal has one of the highest rates of road accidents in the world. Years of life lost shared by falls
among the total unintentional injuries was found to be the highest of about 28 percent of total
YLL (54179 YLL). Burden of falls is found to be almost equally distributed among the
development regions, however, Mid-Western region had highest burden (26%) and Far-Western
region had the lowest burden (14%). Among the ecological regions, Hill region constituted more
than half of the total burden due to Falls while Mountain and Terai regions had almost similar
burden 21% and 28% respectively.
According to the four major age groups, highest YLL was observed in 30-59 age group (32%).
Sex wise distribution showed higher mortality burden in males than in females. All the regions
0.0 10.0 20.0 30.0 40.0 50.0 60.0 70.0
East
ern
Cen
tral
Wes
tern
Mid
-Wes
tern
Far-
Wes
tern
Mo
un
tain
Hill
Tera
i
Development Region Ecological region
17.5
37.0
18.9 15.3 11.3 15.2 24.4
60.3
0.0
10.0
20.0
30.0
40.0
50.0
60.0
East
ern
Cen
tral
Wes
tern
Mid
-Wes
tern
Far-
Wes
tern
Mo
un
tain
Hill
Tera
i
Development Region Ecological region
17.6 21.1 21.4 25.6
14.4 21.2
51.0
27.7
Figure 3.5.4.Region wise distribution of total YLL due to Poisonings
Figure 3.5.5.Region wise distribution of total YLL due to Falls

Assessment of Burden of Disease in Nepal
151
had similar pattern of sex wise distribution. Particularly in Eastern region, mortality burden in
males were four times higher than in females. Age wise distribution was also similar to national
distribution except in Western, Mid-Western and Hill region where higher burden was observed
in 15-29 age group.
Table 3.5.6: YLL distribution of Falls
Background Characteristics Age Group
Total YLL 0-14 15-29 30-59 60+
Development Region
Eastern
Male 23.3 14.9 42.7 19.1 100 7595
Female 18.3 8.3 33.7 39.8 100 1913
Total 22.3 13.5 40.9 23.2 100 9508
Central
Male 35.9 18.6 24.7 20.9 100 6297
Female 35.5 36.3 28.2 100 5114
Total 35.7 10.3 29.9 24.2 100 11411
Western
Male 9.6 46.9 22.4 21.1 100 8040
Female 21.5 53.1 25.5 100 3577
Total 6.6 39.1 31.8 22.4 100 11617
Mid-Western
Male 21.5 40.8 23.1 14.7 100 9538
Female 22.3 20.5 35.5 21.7 100 4328
Total 21.7 34.4 27.0 16.9 100 13866
Far-Western
Male 29.3 22.6 37.6 10.5 100 3960
Female 24.0 30.4 37.8 7.8 100 3816
Total 26.7 26.4 37.7 9.2 100 7776
Ecological region
Mountain
Male 24.7 17.4 45.2 12.7 100 7391
Female 24.7 24.1 33.9 17.3 100 4119
Total 24.7 19.8 41.2 14.3 100 11510
Hill
Male 22.2 37.9 20.7 19.2 100 18668
Female 20.8 19.6 39.6 20.1 100 8971
Total 21.7 32.0 26.8 19.5 100 27639
Terai
Male 21.8 26.5 32.9 18.8 100 9371
Female 20.5 3.9 42.9 32.6 100 5658
Total 21.3 18.0 36.7 24.0 100 15029
National
Male 22.6 30.6 29.0 17.7 100 35431
Female 21.6 15.9 39.3 23.2 100 18748
Total 22.2 25.5 32.6 19.6 100 54179

Assessment of Burden of Disease in Nepal
152
III-A4 Fires Years of life lost shared by fires among the total unintentional injuries was found to be negligible
accounting for only 2 percent of total YLL (5186 YLL). According to the four major age groups,
highest YLL was observed in 0-14 age group (64%). Region wise distribution also showed
similar distribution however, Eastern region is the only region where burden was highest in 60+
age group (62%). At national level, sex wise distribution showed five times higher mortality
burden in females than in males. All the regions had higher burden in females than in males at
almost same proportion as that of national except Eastern and Hill region where the burden was
six and eight times higher in females than males respectively.
Table 3.5.7: YLL distribution of Fires
Background Characteristics Age Group
Total YLL 0-14 15-29 30-59 60+
Development Region
Eastern
Male 0.0 0.0 0.0 100.0 100 120
Female 44.3 0.0 0.0 55.7 100 743
Total 38.1 0.0 0.0 61.9 100 863
Central
Female 50.0 50.0 0.0 0.0 100 1995
Total 50.0 50.0 0.0 0.0 100 1995
Mid-Western
Male 100.0 0.0 0.0 0.0 100 262
Female 100.0 0.0 0.0 0.0 100 1131
Total 100.0 0.0 0.0 0.0 100 1393
Far-Western
Male 81.5 0.0 18.5 0.0 100 454
Female 100.0 0.0 0.0 0.0 100 481
Total 91.0 0.0 9.0 0.0 100 935
Ecological region
Mountain
Male 51.0 0.0 0.0 49.0 100 245
Female 97.0 0.0 0.0 3.0 100 1215
Total 89.3 0.0 0.0 10.7 100 1460
Hill
Male 100.0 0.0 0.0 0.0 100 244
Female 51.5 48.5 0.0 0.0 100 2059
Total 56.7 43.3 0.0 0.0 100 2303
Terai
Male 75.7 0.0 24.3 0.0 100 346
Female 64.9 0.0 0.0 35.1 100 1076
Total 67.5 0.0 5.9 26.6 100 1422
National
Male 75.6 0.0 10.0 14.4 100 836
Female 67.5 22.9 0.0 9.5 100 4350
Total 68.8 19.2 1.6 10.3 100 5186

Assessment of Burden of Disease in Nepal
153
LIkewise, region wise distribution shows that Central region had the highest YLL due to Fires
(38.5%) followed by Mid-Western region (27%). Likewise, majority of burden is confined in
Hill region (44%) while Mountain and Terai regions had almost similar burden of about 28%.
III-A5 Drowning Years of life lost shared by drowning among the total unintentional injuries was found to be 20
percent of total YLL i.e. 38921 years. Distribution of mortality burden among the development
regions doesn't show much difference, however, highest contributor is Eastern region (32%) and
lowest is Far-western region (7%). Ecological region wise distribution shows majority of burden
in Terai region (65%).
According to the age and sex distribution of the mortality it was observed more among the males
of 0-14 age group (62%). Age and sex wise distribution was similar to national in all regions.
0.0 5.0
10.0 15.0 20.0 25.0 30.0 35.0 40.0 45.0
East
ern
Cen
tral
Wes
tern
Mid
-Wes
tern
Far-
Wes
tern
Mo
un
tain
Hill
Tera
i
Development Region Ecological region
16.6
38.5
0
26.9
18.0
28.2
44.4
27.4
0.0 10.0 20.0 30.0 40.0 50.0 60.0 70.0
East
ern
Cen
tral
Wes
tern
Mid
-Wes
tern
Far-
Wes
tern
Mo
un
tain
Hill
Tera
i
Development Region Ecological region
32.2 22.3 25.3
12.9 7.2
12.4 22.5
65.1
Figure 3.5.6.Region wise distribution of total YLL due to Fires
Figure 3.5.7.Region wise distribution of total YLL due to Drowning

Assessment of Burden of Disease in Nepal
154
Table 3.5.8: YLL distribution of Drowning
Background Characteristics Age Group
Total YLL 0-14 15-29 30-59 60+
Development Region
Eastern
Male 46.7 25.7 24.4 3.2 100 8950
Female 68.7 9.3 19.7 2.3 100 3596
Total 53.0 21.0 23.1 2.9 100 12546
Central
Male 61.9 8.9 29.3 0.0 100 4023
Female 84.0 0.0 3.1 13.0 100 4670
Total 73.7 4.1 15.2 7.0 100 8693
Western
Male 45.6 23.5 28.9 2.0 100 7432
Female 83.3 16.7 0.0 0.0 100 2426
Total 54.9 21.8 21.8 1.5 100 9858
Mid-Western
Male 72.3 18.7 7.0 2.0 100 3384
Female 89.5 0.0 10.5 0.0 100 1632
Total 77.9 12.6 8.1 1.4 100 5016
Far-Western
Male 71.3 11.1 11.4 6.2 100 2028
Female 61.7 28.0 10.2 0.0 100 781
Total 68.6 15.8 11.1 4.5 100 2809
Ecological region
Mountain
Male 29.3 47.5 23.2 0.0 100 4058
Female 61.2 20.3 18.5 0.0 100 774
Total 34.4 43.1 22.5 0.0 100 4832
Hill
Male 85.7 4.4 7.5 2.4 100 5152
Female 87.4 0.0 6.4 6.1 100 3615
Total 86.4 2.6 7.1 4.0 100 8767
Terai
Male 50.3 18.7 28.0 3.0 100 16607
Female 77.1 9.2 8.4 5.3 100 8714
Total 59.5 15.4 21.2 3.8 100 25321
National
Male 54.0 20.4 23.2 2.4 100 25819
Female 79.0 7.3 8.4 5.2 100 13102
Total 62.5 16.0 18.2 3.4 100 38921
III-A6 Other unintentional injuries Years of life lost shared by other unintentional injuries among the total unintentional injuries was
found only 13 percent of total YLL i.e. 26796 years. According to the age distribution of the
mortality, it was observed more in 15-29 age group (35%). All the regions also had similar
pattern of age distribution except Terai, Far-Western and Central region where the burden was
higher in 30-59 age group. Distributing total years of life lost among two sexes, the burden was
found to be two times higher in males than in females. Sex wise distribution in the regions also
showed similar pattern. Particularly in Mountain, Eastern and Western region, burden in males

Assessment of Burden of Disease in Nepal
155
was much higher (three, four and five times respectively) than females in comparison to other
regions.
Table 3.5.9: YLL distribution of Other unintentional injuries
Background Characteristics Age Group
Total YLL 0-14 15-29 30-59 60+
Development Region
Eastern
Male 22.1 31.9 32.6 13.4 100 6188
Female 42.3 21.9 20.4 15.4 100 1231
Total 25.5 30.2 30.5 13.7 100 7419
Central
Male 0.0 10.9 58.5 30.5 100 1635
Female 0.0 0.0 40.7 59.3 100 1260
Total 0.0 6.2 50.8 43.0 100 2895
Western
Male 0.0 69.0 26.8 4.1 100 3408
Female 0.0 0.0 78.4 21.6 100 821
Total 0.0 55.6 36.9 7.5 100 4229
Mid-Western
Male 20.2 46.1 29.7 4.0 100 6882
Female 32.1 28.5 34.0 5.4 100 3282
Total 24.0 40.4 31.1 4.5 100 10164
Far-Western
Male 25.3 37.8 31.3 5.6 100 1398
Female 31.2 17.1 45.7 6.1 100 690
Total 27.3 31.0 36.0 5.7 100 2088
Ecological region
Mountain
Male 22.2 40.3 35.0 2.5 100 5665
Female 24.6 51.9 11.5 12.0 100 1802
Total 22.8 43.1 29.3 4.8 100 7467
Hill
Male 7.9 49.5 30.1 12.4 100 7190
Female 0.0 9.9 77.2 13.0 100 2741
Total 5.7 38.6 43.1 12.6 100 9931
Terai
Male 19.3 35.5 33.4 11.9 100 6655
Female 49.0 4.4 18.8 27.8 100 2743
Total 28.0 26.4 29.1 16.5 100 9398
National
Male 15.9 42.1 32.6 9.4 100 19511
Female 24.6 18.2 39.0 18.3 100 7285
Total 18.3 35.6 34.4 11.8 100 26796
Region wise distribution showed that majority of burden due to other unintentional injuries was
found to be in two regions Mid-Western (38%) and Eastern (28%) region among the
development regions. However, there was not much difference in burden distribution among the
ecological regions; Hill (37%), Terai (35%) and Mountain (28%).

Assessment of Burden of Disease in Nepal
156
III-A7 Snake Bite Snakebite occurs in all parts of Nepal where there is tropical climate that favors the snakes.
Years of life lost shared by snake bites among the total unintentional injuries was found to be
about 9 percent of total YLL. Highest burden of snake bite was observed in Central region (32%)
followed by Mid-Western (23%). Likewise, majority of burden was observed in Terai region
(69%).
According to the age and sex distribution of the mortality it was observed more among the
females of 0-14 age group (66%). Central and Far-Western region were found to have highest
burden in age groups 15-29 (25%) and 30-59 (42%) while remaining regions had age distribution
similar to that of national distribution. Likewise, sex wise distribution was found to higher in
0.0 5.0
10.0 15.0 20.0 25.0 30.0 35.0 40.0
East
ern
Cen
tral
Wes
tern
Mid
-Wes
tern
Far-
Wes
tern
Mo
un
tain
Hill
Tera
i
Development Region Ecological region
27.7
10.8 15.8
37.9
7.8
27.9
37.1 35.1
0.0 10.0 20.0 30.0 40.0 50.0 60.0 70.0
East
ern
Cen
tral
Wes
tern
Mid
-Wes
tern
Far-
Wes
tern
Mo
un
tain
Hill
Tera
i
Development Region Ecological region
17.7
32.6
17.4 23.5
8.9 0.7
30.5
68.8
Figure 3.5.8.Region wise distribution of total YLL due to other unintentional injuries
Figure 3.5.9.Region wise distribution of total YLL due to snake bite
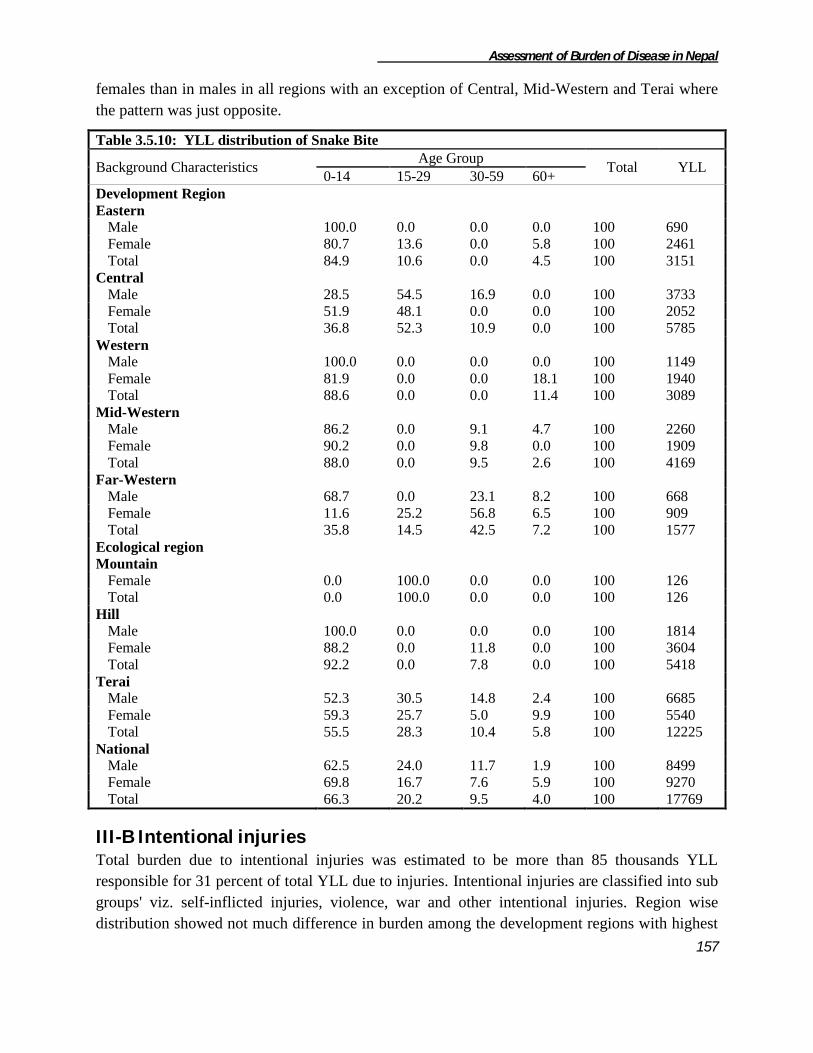
Assessment of Burden of Disease in Nepal
157
females than in males in all regions with an exception of Central, Mid-Western and Terai where
the pattern was just opposite.
Table 3.5.10: YLL distribution of Snake Bite
Background Characteristics Age Group
Total YLL 0-14 15-29 30-59 60+
Development Region
Eastern
Male 100.0 0.0 0.0 0.0 100 690
Female 80.7 13.6 0.0 5.8 100 2461
Total 84.9 10.6 0.0 4.5 100 3151
Central
Male 28.5 54.5 16.9 0.0 100 3733
Female 51.9 48.1 0.0 0.0 100 2052
Total 36.8 52.3 10.9 0.0 100 5785
Western
Male 100.0 0.0 0.0 0.0 100 1149
Female 81.9 0.0 0.0 18.1 100 1940
Total 88.6 0.0 0.0 11.4 100 3089
Mid-Western
Male 86.2 0.0 9.1 4.7 100 2260
Female 90.2 0.0 9.8 0.0 100 1909
Total 88.0 0.0 9.5 2.6 100 4169
Far-Western
Male 68.7 0.0 23.1 8.2 100 668
Female 11.6 25.2 56.8 6.5 100 909
Total 35.8 14.5 42.5 7.2 100 1577
Ecological region
Mountain
Female 0.0 100.0 0.0 0.0 100 126
Total 0.0 100.0 0.0 0.0 100 126
Hill
Male 100.0 0.0 0.0 0.0 100 1814
Female 88.2 0.0 11.8 0.0 100 3604
Total 92.2 0.0 7.8 0.0 100 5418
Terai
Male 52.3 30.5 14.8 2.4 100 6685
Female 59.3 25.7 5.0 9.9 100 5540
Total 55.5 28.3 10.4 5.8 100 12225
National
Male 62.5 24.0 11.7 1.9 100 8499
Female 69.8 16.7 7.6 5.9 100 9270
Total 66.3 20.2 9.5 4.0 100 17769
III-B Intentional injuries Total burden due to intentional injuries was estimated to be more than 85 thousands YLL
responsible for 31 percent of total YLL due to injuries. Intentional injuries are classified into sub
groups' viz. self-inflicted injuries, violence, war and other intentional injuries. Region wise
distribution showed not much difference in burden among the development regions with highest
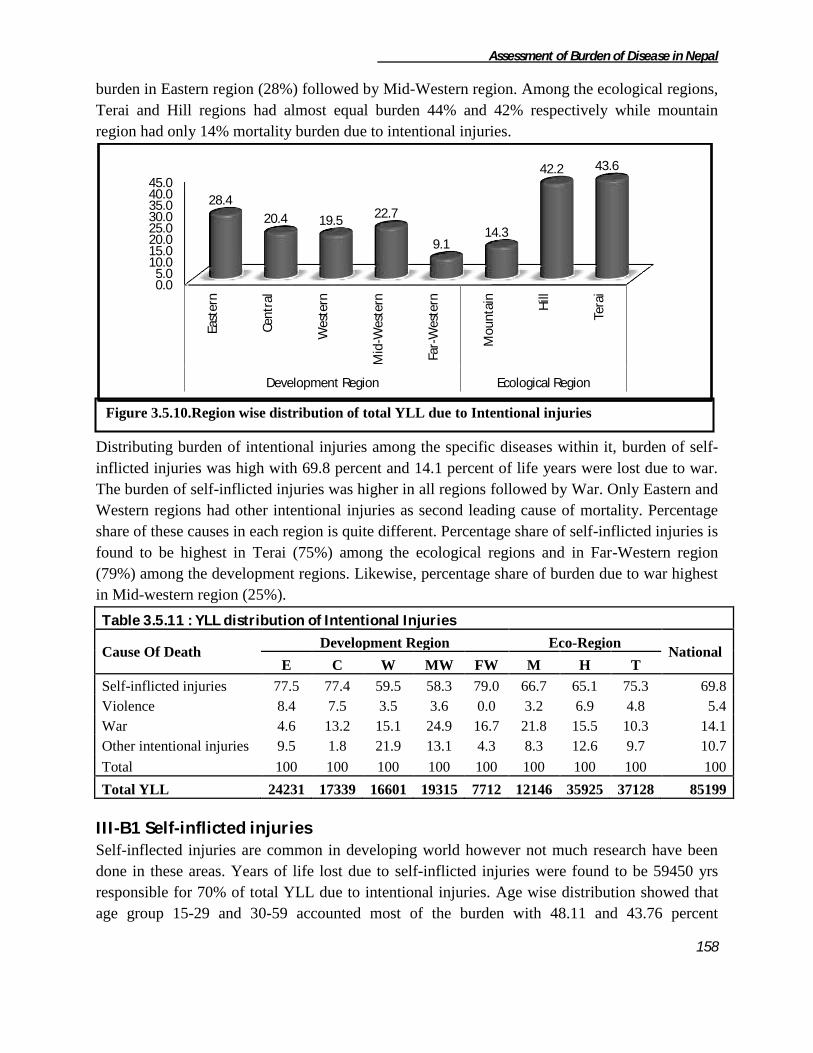
Assessment of Burden of Disease in Nepal
158
burden in Eastern region (28%) followed by Mid-Western region. Among the ecological regions,
Terai and Hill regions had almost equal burden 44% and 42% respectively while mountain
region had only 14% mortality burden due to intentional injuries.
Distributing burden of intentional injuries among the specific diseases within it, burden of self-
inflicted injuries was high with 69.8 percent and 14.1 percent of life years were lost due to war.
The burden of self-inflicted injuries was higher in all regions followed by War. Only Eastern and
Western regions had other intentional injuries as second leading cause of mortality. Percentage
share of these causes in each region is quite different. Percentage share of self-inflicted injuries is
found to be highest in Terai (75%) among the ecological regions and in Far-Western region
(79%) among the development regions. Likewise, percentage share of burden due to war highest
in Mid-western region (25%).
Table 3.5.11 : YLL distribution of Intentional Injuries
Cause Of Death Development Region Eco-Region
National E C W MW FW M H T
Self-inflicted injuries 77.5 77.4 59.5 58.3 79.0 66.7 65.1 75.3 69.8
Violence 8.4 7.5 3.5 3.6 0.0 3.2 6.9 4.8 5.4
War 4.6 13.2 15.1 24.9 16.7 21.8 15.5 10.3 14.1
Other intentional injuries 9.5 1.8 21.9 13.1 4.3 8.3 12.6 9.7 10.7
Total 100 100 100 100 100 100 100 100 100
Total YLL 24231 17339 16601 19315 7712 12146 35925 37128 85199
III-B1 Self-inflicted injuries Self-inflected injuries are common in developing world however not much research have been
done in these areas. Years of life lost due to self-inflicted injuries were found to be 59450 yrs
responsible for 70% of total YLL due to intentional injuries. Age wise distribution showed that
age group 15-29 and 30-59 accounted most of the burden with 48.11 and 43.76 percent
0.0 5.0
10.0 15.0 20.0 25.0 30.0 35.0 40.0 45.0
East
ern
Cen
tral
Wes
tern
Mid
-Wes
tern
Far-
Wes
tern
Mo
un
tain
Hill
Tera
i
Development Region Ecological Region
28.4
20.4 19.5 22.7
9.1 14.3
42.2 43.6
Figure 3.5.10.Region wise distribution of total YLL due to Intentional injuries

Assessment of Burden of Disease in Nepal
159
respectively. Even among the regions, the burden was mainly distributed in these two age
groups. Eastern, Terai and Far-Western regions had higher burden in 15-29 age group while
remaining regions had higher burden in 30-59 age group. Sex wise distribution was also not
consistent among the regions. At national level, both sexes had almost equal burden. At regional
level, Central, Western and Terai regions had higher burden in females than males while the
remaining regions had higher burden in males.
Table 3.5.12: YLL distribution of self inflicted injuries
Background Characteristics Age Group
Total YLL 0-14 15-29 30-59 60+
Development Region
Eastern
Male 3.5 48.9 42.8 4.8 100 10067
Female 5.7 59.5 29.7 5.1 100 8709
Total 4.5 53.8 36.7 4.9 100 18776
Central
Male 0.0 68.3 27.1 4.6 100 5859
Female 0.0 25.4 73.2 1.3 100 7569
Total 0.0 44.1 53.1 2.8 100 13428
Western
Male 9.9 8.6 66.3 15.2 100 3791
Female 0.0 37.8 54.9 7.4 100 6090
Total 3.8 26.6 59.3 10.4 100 9881
Mid-Western
Male 0.0 27.7 62.9 9.5 100 6675
Female 0.0 37.7 52.8 9.4 100 4593
Total 0.0 31.8 58.8 9.5 100 11268
Far-Western
Male 3.0 63.6 31.1 2.2 100 3474
Female 0.0 59.8 38.6 1.6 100 2619
Total 1.7 62.0 34.3 2.0 100 6093
Ecological Region
Mountain
Male 0.0 42.5 51.9 5.6 100 5169
Female 5.6 45.3 45.2 3.9 100 2938
Total 2.0 43.5 49.5 5.0 100 8107
Hill
Male 3.0 37.0 49.8 10.3 100 11819
Female 0.0 31.2 59.3 9.5 100 11576
Total 1.5 34.1 54.5 9.9 100 23395
Terai
Male 3.7 52.3 39.8 4.2 100 12880
Female 2.2 51.5 44.6 1.7 100 15065
Total 2.9 51.9 42.4 2.8 100 27945
National
Male 2.8 44.5 45.8 6.8 100 29869
Female 1.7 43.0 50.4 5.0 100 29581
Total 2.2 43.8 48.1 5.9 100 59450

Assessment of Burden of Disease in Nepal
160
Region wise distribution shows its highest burden in Eastern region (32%) followed by Central
(22%) and Mid-Western region (19%). Likewise, Terai region is accounts almost half of the total
burden (i.e. 47%) while Mountain region has the minimum burden (14%).
III-B2 Violence Total mortality burden due to violence was 4615 YLL accounting for 5% of total YLL due to
intentional injuries. Among the regions, Eastern region had highest burden due to violence (44%)
followed by Central region (28%). Likewise, majority of burden was in hilly region (53%)
followed by Terai region (38%) and Mountain (8%).
Violence was reported five times higher in males than in females at national level. Region wise
distribution also showed higher burden in males with highest difference in Hill region with seven
times higher burden in males than females. Distributing the burden among age groups, 15-29 yrs
and 30-59 yrs of age were affected the most with 37.10 and 34.52 percent respectively. Region
wise distribution didn't show any consistency in age wise distribution. In Eastern and Terai
regions burden was highest in 15-29 age group while Hill and Central regions had highest burden
in 30-59 and 0-14 age group respectively. Regarding Western, Mid-Western and Mountain
region total burden was estimated to be in males only.
0.0 10.0 20.0 30.0 40.0 50.0
East
ern
Cen
tral
Wes
tern
Mid
-Wes
tern
Far-
Wes
tern
Mo
un
tain
Hill
Tera
i
Developmental Region Ecological Region
31.6 22.6 16.6 19.0
10.2 13.6
39.4 47.0
0.0 10.0 20.0 30.0 40.0 50.0 60.0
East
ern
Cen
tral
Wes
tern
Mid
-Wes
tern
Mo
un
tain
Hill
Tera
i
Development Region Ecological region
43.9
28.4
12.5 15.1 8.3
53.3 38.3
Figure 3.5.11.Region wise distribution of total YLL due to Self-inflected injuries
Figure 3.5.12.Region wise distribution of total YLL due to Violence

Assessment of Burden of Disease in Nepal
161
Table 3.5.13: YLL distribution of Violence
Background
Characteristics
Age Group Total YLL
0-14 15-29 30-59 60+
Development Region
Eastern
Male 0.0 74.7 25.3 0.0 100 1726
Female 0.0 100.0 0.0 100 302
Total 0.0 78.5 21.5 0.0 100 2028
Central
Male 93.1 0.0 0.0 6.9 100 846
Female 0.0 0.0 0.0 100.0 100 464
Total 60.2 0.0 0.0 39.8 100 1310
Western
Male 0.0 0.0 100.0 0.0 100 578
Total 0.0 0.0 100.0 0.0 100 578
Mid-Western
Male 0.0 17.3 82.7 0.0 100 699
Total 0.0 17.3 82.7 0.0 100 699
Ecological region
Mountain
Male 0.0 84.9 0.0 15.1 100 385
Total 0.0 84.9 0.0 15.1 100 385
Hill
Male 36.5 0.0 63.5 0.0 100 2159
Female 0.0 100.0 0.0 0.0 100 302
Total 32.0 12.3 55.7 0.0 100 2461
Terai
Male 0.0 83.0 17.0 0.0 100 1305
Female 0.0 0.0 0.0 100.0 100 464
Total 0.0 61.2 12.5 26.2 100 1769
National
Male 20.5 36.6 41.4 1.5 100 3849
Female 0.0 39.4 0.0 60.6 100 766
Total 17.1 37.1 34.5 11.3 100 4615
III-B3 War
A decade long political conflict has adversely affected health and development of people of
Nepal. It was estimated that war was responsible for more than twelve thousands years of life
lost which was 14 percent of total YLL due to intentional injuries.
0.0 10.0 20.0 30.0 40.0 50.0
East
ern
Cen
tral
Wes
tern
Mid
-Wes
tern
Far-
Wes
tern
Mo
un
tain
Hill
Tera
i
Developmental Region Ecological Region
9.3 19.0 20.9
40.1
10.7 22.0
46.3 31.7
Figure 3.5.13.Region wise distribution of total YLL due to War
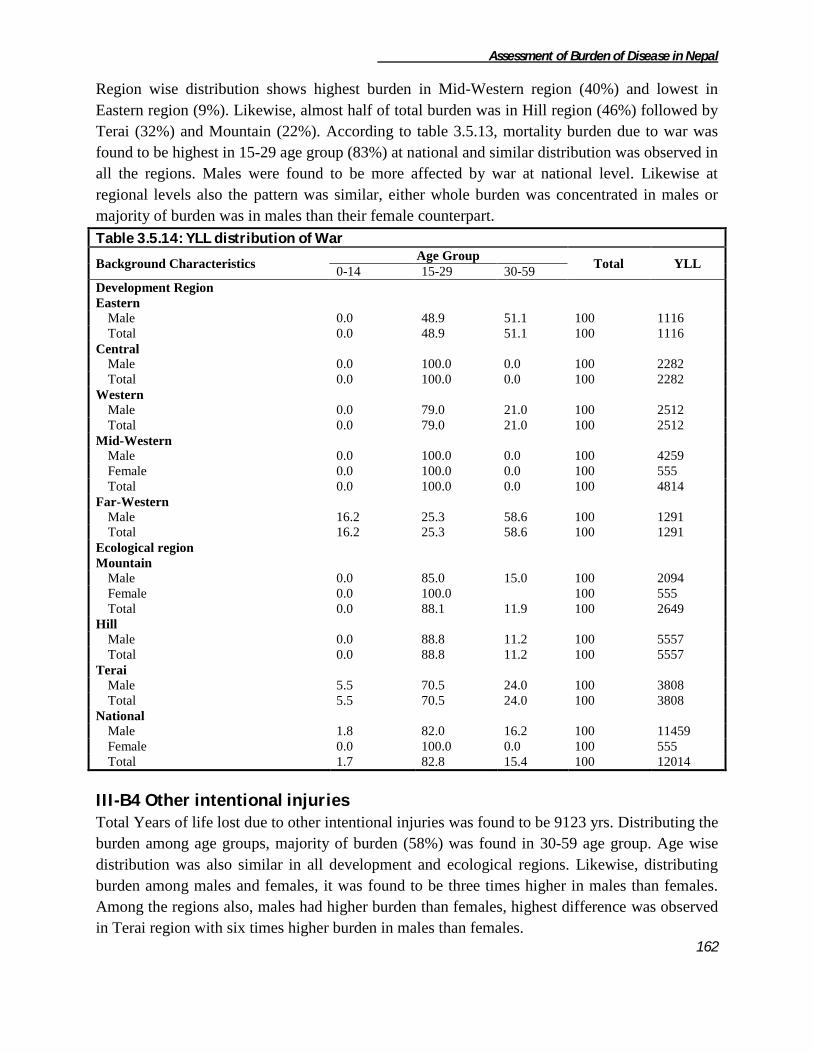
Assessment of Burden of Disease in Nepal
162
Region wise distribution shows highest burden in Mid-Western region (40%) and lowest in
Eastern region (9%). Likewise, almost half of total burden was in Hill region (46%) followed by
Terai (32%) and Mountain (22%). According to table 3.5.13, mortality burden due to war was
found to be highest in 15-29 age group (83%) at national and similar distribution was observed in
all the regions. Males were found to be more affected by war at national level. Likewise at
regional levels also the pattern was similar, either whole burden was concentrated in males or
majority of burden was in males than their female counterpart.
Table 3.5.14: YLL distribution of War
Background Characteristics Age Group
Total YLL 0-14 15-29 30-59
Development Region
Eastern
Male 0.0 48.9 51.1 100 1116
Total 0.0 48.9 51.1 100 1116
Central
Male 0.0 100.0 0.0 100 2282
Total 0.0 100.0 0.0 100 2282
Western
Male 0.0 79.0 21.0 100 2512
Total 0.0 79.0 21.0 100 2512
Mid-Western
Male 0.0 100.0 0.0 100 4259
Female 0.0 100.0 0.0 100 555
Total 0.0 100.0 0.0 100 4814
Far-Western
Male 16.2 25.3 58.6 100 1291
Total 16.2 25.3 58.6 100 1291
Ecological region
Mountain
Male 0.0 85.0 15.0 100 2094
Female 0.0 100.0 100 555
Total 0.0 88.1 11.9 100 2649
Hill
Male 0.0 88.8 11.2 100 5557
Total 0.0 88.8 11.2 100 5557
Terai
Male 5.5 70.5 24.0 100 3808
Total 5.5 70.5 24.0 100 3808
National
Male 1.8 82.0 16.2 100 11459
Female 0.0 100.0 0.0 100 555
Total 1.7 82.8 15.4 100 12014
III-B4 Other intentional injuries Total Years of life lost due to other intentional injuries was found to be 9123 yrs. Distributing the
burden among age groups, majority of burden (58%) was found in 30-59 age group. Age wise
distribution was also similar in all development and ecological regions. Likewise, distributing
burden among males and females, it was found to be three times higher in males than females.
Among the regions also, males had higher burden than females, highest difference was observed
in Terai region with six times higher burden in males than females.

Assessment of Burden of Disease in Nepal
163
Table 3.5.15: YLL distribution of Other intentional injuries
Background Characteristics Age Group
Total YLL 0-14 15-29 30-59 60+
Development Region
Eastern
Male 15.3 26.3 58.4 0.0 100 2311
Total 15.3 26.3 58.4 0.0 100 2311
Central
Male 0.0 100.0 0.0 0.0 100 179
Female 0.0 0.0 100.0 100 142
Total 0.0 55.8 0.0 44.2 100 321
Western
Male 14.6 0.0 85.4 0.0 100 2497
Female 0.0 100.0 0.0 0.0 100 1134
Total 10.0 31.2 58.7 0.0 100 3631
Mid-Western
Male 8.0 0.0 92.0 0.0 100 1635
Female 14.5 85.5 0.0 0.0 100 898
Total 10.3 30.3 59.4 0.0 100 2533
Far-Western
Male 0.0 0.0 100.0 0.0 100 272
Female 0.0 0.0 0.0 100.0 100 57
Total 0.0 0.0 82.7 17.3 100 329
Ecological region
Mountain
Male 0.0 18.9 81.1 0.0 100 949
Female 0.0 0.0 0.0 100.0 100 57
Total 0.0 17.8 76.5 5.7 100 1006
Hill
Male 0.0 0.0 100.0 0.0 100 2833
Female 0.0 91.5 0.0 8.5 100 1678
Total 0.0 34.1 62.8 3.1 100 4511
Terai
Male 27.2 19.5 53.2 0.0 100 3112
Female 26.3 73.7 0.0 100 495
Total 27.1 26.9 45.9 0.0 100 3607
National
Male 12.3 11.4 76.3 100 6892
Female 5.8 85.3 8.9 100 2231
Total 10.7 29.5 57.6 2.2 100 9123
Distributing YLL among the regions, the burden was mainly distributed among Western (40%),
Mid-Western (28%) and Eastern region (25%). Ecological wise distribution showed that half of
burden was concentrated in hill region (50%) followed by Terai (39%) and Mountain region
(11%).

Assessment of Burden of Disease in Nepal
164
3.6 Unidentified Cases
The mortality cases whose cause of death could not be identified were placed under this
category. Such cases contributed altogether 6.4 percent (147687 YLL) out of total years of life
lost captured nationally. The ecological distribution of YLL due to unidentified cases was
concentrated in the terai region (61.1%) and least was observed in the mountain region (7.6%).
Likewise, the YLL distribution according to development region was observed highest in the
western development region (28.2%) and least in the far-western development region of Nepal.
Majority of cases which were not identified were of the age group 0-14 while least was observed
in the 15-29 years of age group. The YLL due to unidentified cases were distributed in all the
regions of Nepal. The 0-14 years of age group showed the highest YLL in all the eco-
0.0 10.0 20.0 30.0 40.0 50.0
East
ern
Cen
tral
Wes
tern
Mid
-Wes
tern
Far-
Wes
tern
Mo
un
tain
Hill
Tera
i
Developmental Region Ecological Region
25.3
3.5
39.8
27.7
3.6 11.0
49.4 39.5
Figure 3.6.1: Percentage YLL distribution due to Unidentified Cases
Figure 3.5.14.Region wise distribution of total YLL due to Other Intentional Injuries

Assessment of Burden of Disease in Nepal
165
development regions. Likewise sex wise distribution of total YLL due to unintentional injuries
showed higher burden in males than in females and similar pattern was found in all regions
except in Western region where the pattern was just reversed.
Table 3.6.1: YLL distribution of Unidentified causes
Background Characteristics Age group
Total YLL 0-14 15-29 30-59 60+
Development Region
Eastern
Male 59.7 8.1 16.1 16.2 100 14926
Female 59.0 2.2 15.4 23.3 100 14391
Total 59.4 5.2 15.8 19.7 100 29317
Central
Male 73.8 13.4 0.4 12.4 100 30739
Female 75.5
15.9 8.7 100 9807
Total 74.2 10.2 4.1 11.5 100 40546
Western
Male 44.8 6.0 20.8 28.4 100 20533
Female 49.4 1.8 13.6 35.1 100 21096
Total 47.2 3.9 17.2 31.8 100 41629
Mid-Western
Male 45.2 10.8 23.6 20.5 100 9925
Female 51.3 2.5 23.5 22.8 100 9745
Total 48.2 6.7 23.5 21.6 100 19670
Far-Western
Male 53.8 10.5 18.8 16.9 100 10756
Female 63.3 5.4 12.4 18.9 100 5767
Total 57.1 8.7 16.6 17.6 100 16523
Ecological region
Mountain
Male 75.7 6.6 8.5 9.2 100 7104
Female 69.1 2.9 12.7 15.3 100 4075
Total 73.3 5.2 10.0 11.4 100 11179
Hill
Male 56.7 9.5 17.5 16.3 100 27207
Female 60.1 0.0 14.3 25.6 100 19037
Total 58.1 5.6 16.2 20.2 100 46244
Terai
Male 57.6 10.9 11.0 20.6 100 52570
Female 54.9 3.0 17.0 25.0 100 37696
Total 56.5 7.6 13.5 22.4 100 90266
National
Male 58.8 10.1 12.8 18.3 100 86880
Female 57.5 2.1 15.9 24.5 100 60807
Total 58.3 6.8 14.1 20.9 100 147687

Assessment of Burden of Disease in Nepal
166
ANNEX I - Disease and injuries categories
GBD Cause Name
I. Communicable, maternal, perinatal and
nutritional conditions
II. Non-communicable diseases
A. Infectious and parasitic diseases A. Malignant neoplasms
1. Tuberculosis 1. Mouth and oropharynx cancers
3. HIV/AIDS 2. Oesophagus cancer
4. Diarrhoeal diseases 3. Stomach cancer
5. Childhood-cluster diseases 4. Colon and rectum cancers
b. Poliomyelitis 5. Liver cancer
c. Diphtheria 7. Trachea, bronchus and lung cancers
d. Measles 9. Breast cancer
e. Tetanus 10. Cervix uteri cancer
6. Meningitis 14. Bladder cancer
7. Hepatitis B 16. Leukaemia
Hepatitis C 17. Other malignant neoplasms
8. Malaria B. Other neoplasms
9. Tropical-cluster diseases C. Diabetes mellitus
d. Leishmaniasis D. Endocrine disorders
e. Lymphatic filariasis E. Neuropsychiatric disorders
g. Rabies 1. Unipolar depressive disorders
10. Leprosy 2. Bipolar affective disorder
12. Japanese encephalitis 4. Epilepsy
14. Intestinal nematode infections 5. Alcohol use disorders
a. Ascariasis 14. Migraine
b. Trichuriasis 15. Mental Retardation
attributable to lead exposure
c. Hookworm disease
(Ancylostomiasis and necatoriasis)
16. Other neuropsychiatric disorders
Other intestinal infections F. Sense organ diseases
15. Other infectious diseases G. Cardiovascular diseases
B. Respiratory infections 1. Rheumatic heart disease
1. Lower respiratory infections 2. Hypertensive heart disease
2. Upper respiratory infections 3. Ischaemic heart disease
3. Otitis media 4. Cerebrovascular disease
C. Maternal conditions 6. Other cardiovascular diseases
1. Maternal haemorrhage H. Respiratory diseases
2. Maternal sepsis 1. Chronic obstructive pulmonary disease
3. Hypertensive disorders of pregnancy 2. Asthma
4. Obstructed labour 3. Other respiratory diseases
5. Abortion I. Digestive diseases
6. Other maternal conditions 1. Peptic ulcer disease
D. Conditions arising during the perinatal
period
2. Cirrhosis of the liver
1. Low birth weight 3. Appendicitis
2. Birth asphyxia and birth trauma 4. Other digestive diseases
3. Other perinatal conditions J. Genito-urinary diseases
E. Nutritional deficiencies 1. Nephritis and nephrosis
1. Protein-energy malnutrition 2. Benign prostatic hypertrophy
4. Iron-deficiency anaemia 3. Other genitourinary system diseases
5. Other nutritional disorders

Assessment of Burden of Disease in Nepal
167
GBD Cause Name
II. Noncommunicable diseases (continued) III. Injuries
K. Skin diseases A. Unintentional injuries
L. Musculoskeletal diseases 1. Road traffic accidents
1. Rheumatoid arthritis 2. Poisonings
3. Gout 3. Falls
4. Low back pain 4. Fires
5. Other musculoskeletal disorders 5. Drowning
M. Congenital anomalies . 6. Other un intentional injuries
2. Anencephaly 7. Snake bite
3. Anorectal atresia B. Intentional injuries
4. Cleft lip 1. Self-inflicted injuries
5. Cleft palate 2. Violence
7. Renal agenesis 3. War
9. Congenital heart anomalies 4. Other intentional injuries
10. Spina bifida
11. Other Congenital anomalies IV. Unidentified
N. Blood disorder

Assessment of Burden of Disease in Nepal
168
Annex II- Sampling Ilaka wise VDCs sampling of Sunsari district (Total Ilaka-12, VDCs=49, N.P.=3)
S.N Name of Ilaka VDCs Selected VDCs
1 Chatara PHC
Barahchhetra
Mahendrenagar Bishnupaduka
Mahendrenagar
2 Itahari PHC
Khanar
Hanshaposha Aekamba
Hanshaposha
Panchakanya
3 Madhuban PHC
Madhuban
Haripur
Haripur
sripur jabdi
Paschimkusuha
Laikahi
4 Harinagar PHC
Harinagar
Harinagar Basantapur
Ramganj senuwari
Madhyeharsahi
5 Saterjhoa PHC
Santerjhora
Tanamuna
Chhitaha
Tanamuna
Aurabarni
Bhaluwa
6 Inaruwa PHC
Madhesa
Madhesa Bhokraha
Dumaraha
Babiya
7 Prakashpur PHC Prakashpur Prakashpur
8 Baklauri HP
Bakalauri
Pakali
Bharaul
Pakali
Bhadgau sinwari
Singiya
9 Madhilee HP
Madhilee
Madhilee
chadwela
Sonapur
Dubahi
simariya
10 Sitaganj HP
Ramganj Belgachhi
Ramganj Belgachhi
Amaduwa
Amahibelaha
Chimdi
Purbakusaha
11 Dewanganja HP
Dewanganja
Dhuskee Dhuskee
Kaptanganja
sahebganj
12 Bhutaha PHC
Ramnagar Bhutaha
Narsinghatappu Narsinghatappu
Gautampur
Jalpapur
S.N. Municipalities Selected N.P. Selected Wards
1 Dharan N. P. Inaruwa N. P. 2, 7, 8
2 Inaruwa N. P.
3 Itahari N. P.

Assessment of Burden of Disease in Nepal
169
Ilaka wise VDCs sampling of illam district (Total Ilaka-10, VDCs=48, N.P.=1)
S.N. Ilaka VDC Selected VDC
1 Pashupati Nagar Ilaka
PashupatiNagar
PashupatiNagar
ShreeAntu
Gorkhe
Jogmai
Namsaling
2 Fikal
Phikalbazar
Goduk Goduk
Panchakanya
Kanyam
3 Kolbung
Kolbung
Erautar
Shantipur
Samalbung
Jirmale
Erautar
Chulachuli
4 Pyang
Pyang
Soyang NayaBazar
Soyang
Jamuna
5 Luring tar
Sulubung
Barbote
Mabu
Maimajhuwa
Maipokhari
Sumbek
Barbote
6 Sakhejung
Sakhejung
Sakhejung Puwamajhuwa
Chameta
7 Magalbare
ShantiDanda
ShantiDanda
Mangalbare
Sangrumba
Siddhithumka
Jitpur
Dhuseni
8 Chisapani
Chisapani
Danabari
Sopak
Laxipur
Danabari
Mahamai
9 Amchowk
Amchok
Phakphok
Ektappa
Phakphok
Lumde
Gajurmukhi
Phyuatappa
10 Bajho
Bajho
Sakfara Sakfara
Ebhang
S.N. Municipality Selected ward
1 Illam Municipality 1, 5

Assessment of Burden of Disease in Nepal
170

Assessment of Burden of Disease in Nepal
171
Ilaka wise VDCs sampling of Solukhumbu district (Total Ilaka=11, VDCs=34)
S. N. Name of Ilaka Name of VDCs Selected VDC
1 Basa
Basa
Jubing Kaku
Jubing
2 Sotang PHC
Bung
Chheskam Chheskam
Mabe (Pawai)
Gudel
3 Nele HP
Nele
Deusa
Mukali
Deusa
Kangel
Panchan
4 Garma Garma Garma
Tingla
5 Gorakhani
Gorakhani
Kureng Kureng
Tapting
6 Chaulakharka
Chaulakharka
Goli Goli
Bhakanje
7 Jubu Jubu
Jubu Lokhim
8 Beni
Salleri
Takasindu Tamakhani
Beni
Takasindu
9 Salyan PHC Salyan Salyan
10 Nechabatase Nechabatase
Nechabatase Nechabedghari
11 Namche
Namche
Namche Khumjung
Chairikharka

Assessment of Burden of Disease in Nepal
172
Ilaka wise VDCs sampling of of Nuwakot district
S.N. Illaka VDCs (63) Selected VDCs (13)
1 Khagabhanjyang HP
KhadagBhanjyang
Jiling
Charghare
Jiling
Duipipal
Ratmate
Taruka
Budhasing
Dangsing
Gorsyang
2 Samari HP Samari
Kalyanpur Kalyanpur
3 Deurali PHC
Deurali
Deurali
Barsunchet
Kintang
Bugtang
Salme
4 Kaule HP
Kaule
Manakamana
Bhalche
Fikuri
Manakamana
Tupche
5 Nuwakot HP
Gerkhu
Bagesworichokade
Kalikahalde
Bagesworichokade
KholegaunKhanigaun
Chaughada
Ganesthan
6 Kharanitar PHC
Kharanitar
Ralukadevi
Narjamandap
Lachyang
Urleni
Ralukadevi
Kabilas
Panchkanya
7 Samundratar HP
Samundratar
Sundaradevi Balkumari
Thapek
Sundaradevi
8 Shikharbesi HP Shikharbesi
Shikharbesi Ghyanphedi
9 Rautbesi HP
Rautbesi
Rautbesi Gaunkharka
Beteni
10 Saryemaidan HP Likhu Sikre

Assessment of Burden of Disease in Nepal
173
Talakhu
Chhap
Sikre
Mahakali
11 Bhadratar HP
Bhadratar Bhadratar
Samundradevi
Sunkhani
Thanapati
Thansing
12 Chaturale HP
Chaturale
Suryamati Suryamati
13 Kakani PHC
Kakani
Okharpauwa
Chauthe Chauthe
Kumari
Belkot
Madanpur
S.N. Municipality Selected Wards
1 Bidur N.P 1,3,5

Assessment of Burden of Disease in Nepal
174
Ilaka wise VDCs sampling of of Sindhupalchok district (Ilaka=13, VDCs=79)
S.N. Illaka VDCs Selected VDCs
1 Barhabise PHC
Ghumthang
Ghorthali
Ghorthali
Ramche
Barhabise
Maneswora
Karthali
Choukati
2 Banskharka HP
Banskharka
Banskharka
Langarche
BhoteNamlang
Thampal Dhhap
Gunsakot
Thampalkot
Motang
Baruwa
3 Bhimtar HP
Bhimtar
Badegaun
Fatakshila
Badegaun
Sipa Pokhari
Bhotasipa
4 Danda Pakhar HP
/Thulo Pakhar
Danda Pakhar
Pangretar
Pangretar
Jethal
Mankha
ThumPakhar
Petaku
5 Devshthan HP
Sunkhani
Yamunadanda Yamunadanda
Thokarpa
Kalika
6 Jalbire PHC
Jalbire
pangtang
Baramchi
Fulpingkot
pangtang
Hagam
Gumba
Fulpingdandagau
Kubhinde
Batase
7 Lisankhu HP
Lisankhu
ThuloDhading ThuloDhading
Atarpur
8 Melamchi PHC Melamchi
Melamchi Talramarang

Assessment of Burden of Disease in Nepal
175
Mahankal
Ichok
Helumbu
Kiwool
Palchok
Dubachour
9 Nawalpur HP
Nawalpur
Kunchok
Sikharpur
Simpal Kavre
Jyamire
Kunchok
10 Piskar HP
Piskar
Tekanpur Dhumthang
Tekanpur
Tauthali
11 Selang HP
Selang
SyauleBazar
Choutara
Irkhu
SyauleBazar
Pipaldanda
Gloche
Sanusiruwari
ThuloSirubari
Kadambas
Sangachok
12 Sindhukot HP
Sindhukot
Bhotechaur
Bhotechaur
Haibung
Bansbari
Thakani
13 Tatopani HP
Tatopani
Marming
Fulpingkatti
Marming
Lisitikot
Gati

Assessment of Burden of Disease in Nepal
176
Ilaka wise VDCs sampling of Mahottari district, Ilaka= 10, VDCs= 76, NP=1
S. N. Ilaka VDCs Selected VDC
1 Simardahi HP
Simardahi
Pigouna
Dhirapur
Fulahatta Parikauli
Matihani
ParsaPateli
Pigouna
SugaVawani
2 Pipra HP
Pipra
Ratauli
Banauli Donauli
Barmarpura
Ekarahiya
Majhora Bishnupur
Mahottari
Ratauli
Sahorawa
3 Ekadarabela HP
Ekadarabela
Anakar
Bathanaha
Bhatauliya
Etaharwakatti
Halkhori
Manara
Anakar
Sisawakataiya
Nainhi
Sandha
4 BalawaHP
Balawa
Paraul
Bairgiya Banchauri
Banouta
Sonaul
Damhimarayee
Gonarpura
Kothuwa Bagiya
Paraul
Sarpallo
5 Ramgopalpur HP
Ramgopalpur
Basabitti
Laxminiya Bairgiya
Basabitti
Dhamaura
Shreepur
MeghanathGorahanna
Sahasaula
Sonamai
6 Shamsi HP Shamsi Khopi
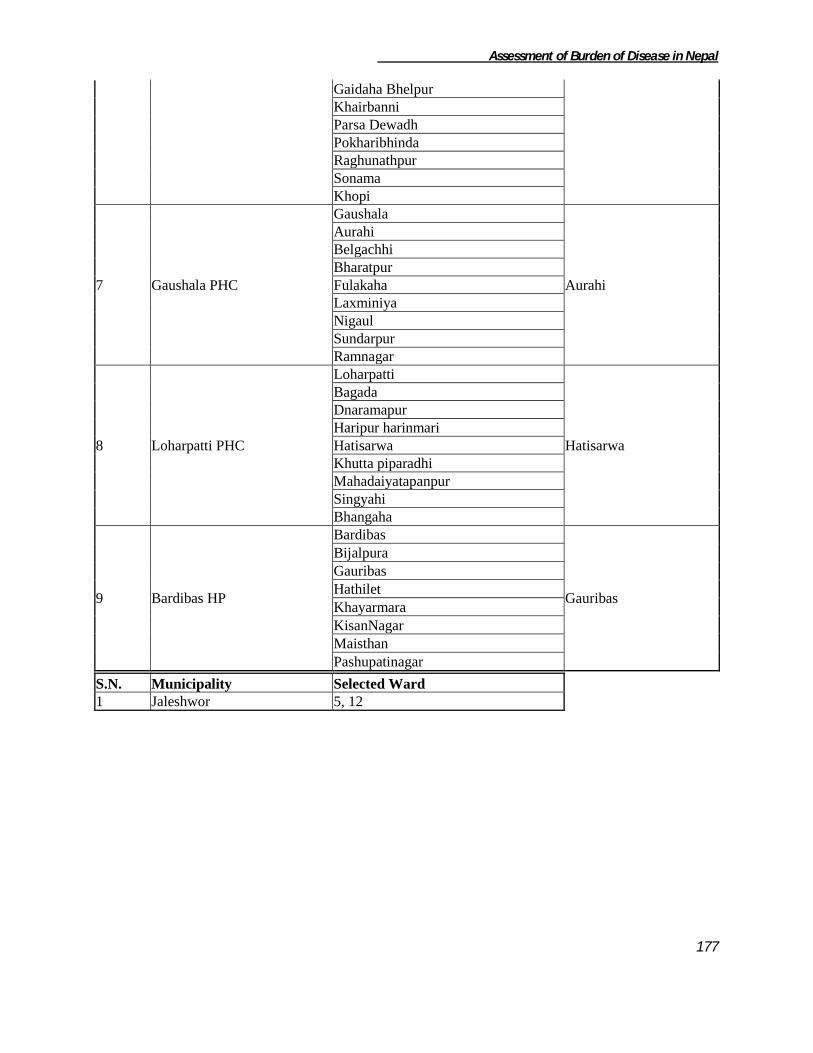
Assessment of Burden of Disease in Nepal
177
Gaidaha Bhelpur
Khairbanni
Parsa Dewadh
Pokharibhinda
Raghunathpur
Sonama
Khopi
7 Gaushala PHC
Gaushala
Aurahi
Aurahi
Belgachhi
Bharatpur
Fulakaha
Laxminiya
Nigaul
Sundarpur
Ramnagar
8 Loharpatti PHC
Loharpatti
Hatisarwa
Bagada
Dnaramapur
Haripur harinmari
Hatisarwa
Khutta piparadhi
Mahadaiyatapanpur
Singyahi
Bhangaha
9 Bardibas HP
Bardibas
Gauribas
Bijalpura
Gauribas
Hathilet
Khayarmara
KisanNagar
Maisthan
Pashupatinagar
S.N. Municipality Selected Ward
1 Jaleshwor 5, 12

Assessment of Burden of Disease in Nepal
178
Ilaka wise VDCs sampling of Manang District (ilaka=9, VDC=13)
S.No. Name of Ilaka VDCs Selected VDC
1 Chame Chame Chame
2 Bhraka Bhraka Bhraka
3 TankiManang TankiManang TankiManang
4 Dharapani Dharapani Dharapani
5 Thoche Thoche
Thoche TachiBagarchhap
6 Khangsar Khangsar Khangsar
7 Manang Manang
Manang Nyawal
8 Nar Nar
Fu Fu
9 Ghyaru Ghyaru
Pisang Pisang

Assessment of Burden of Disease in Nepal
179
Ilaka wise VDCs sampling of Kapilvastu District ilaka=11, VDCs=77, NP=1
S.No. Name of Ilaka VDCs Selected VDC
1 Haranampur PHC
Haranampur
Titirkhi
Baluhawa
Dumara
Titirkhi
Pipara
2 Pakadi HP
Pakadi
Pakadi
Hathihawa
Labani
Bithuwa
NandaNagar
Baskhaur
Abhirawa
Bijuwa
3 Hathausa HP
Hathausa
Fulika
Patna
Patariya
Fulika
Jahadi
Kopawa
4 Pipara PHC
Malwar
Malwar Banganga
Motipur
Gajehada
5 Tilaurakot HP
Tilaurakot
Tilaurakot
Nigalihawa
Gauri
Sauraha
Dohani
Dharmpaniya
Dhankauli
6 Gotihawa SHP
Gotihawa
Gotihawa
Badauli
Rangapur
Somdiha
Singhkhor
Parsohiya
Basantapur

Assessment of Burden of Disease in Nepal
180
7 Maharajganj PHC
Maharajganj
Bhalubari
Manpur
Lalpur
Ajigara
Balaramwapur
Udayapur
Bhalubari
Baraipur
Thunhiya
Chanai
8 Jayanagar HP
Jayanagar
Barakulpur
Mahuwa
Rajpur
Budhi
Mahendrakot
Hariharpur
Dubiya
Barakulpur
9 KrishnaNagar HP
KrishnaNagar
VidhyaNagar
VidhyaNagar
Ramnagar
Shipanagar
Bhagwanpur
Purusottampur
Sirsihawa
Ganeshpur
10 Patthardaihiya HP
Patthardaihiya
Bahadurganj
Bishunpur
Khurhuriya
Shivagadhi
Jawabhari
Shivapur
Gugauli
Bahadurganj
Birpur
11 Hardauna
Harduona
Milmi
Kajarhawa
Kushhawa
Sisawa
Milmi
Kapilbastu N.P.
S.N. Municipality Selected Ward
1 Kapilbastu Municipality 1, 13

Assessment of Burden of Disease in Nepal
181
Ilaka wise VDCs sampling of Palpa District ilaka=12, VDC=65 NP=1
S.No. Name of Ilaka VDCs Selected VDC
1 Chhahara HP
Chhahara
Somadi
Bhuwanpokhari
Somadi
Siddheswar
Juthapauwa
Baldengadhi
Satyawati
2 PalungMainadi
PalungMainadi
Timure Fek
Mujhung
Timure
3 Khasyoli PHC
Khasyoli
Khyaha
Argali
Khyaha
Deurali
Kusumkhola
Bhairabsthan
Bandipokhara
Boudhagumba
Bodhapokharathok
4 Nayarilaka
Nayarnamtales
Chidipani
Barangdi
Khanigau
Pokharathok
Chirtungdhara
Chappani
Yamgha
Darlamdanda
Kanichhap
Chidipani
Pipaldada
5 Madanpokhara ilaka
Madanpokhara
Koldada
Telgha
Masyam
Koldada
Kaseni
Rupse
Dobhan
Kachal

Assessment of Burden of Disease in Nepal
182
6 Tahu ilaka
Tahu
Devinagar
Humin
Haklang
Birkot
Ringneraha
Devinagar
7 Jadewa ilaka
Jadewa
Bahadurpur
Gothadi
Rahabas
Bahadurpur
Jalpa
8 Archale ilaka
Archale
Mityal Jyamire
Mityal
9 Hungi ilaka
Hungi
Hungi Foksingkot
Gejha
10 Rampur ilaka
Rampur
Siluwa Galdha
Khaliban
Siluwa
11 Darchha ilaka Darchha Darchha
12 Gadakot ilaka
Gadakot
Sahalkot Jhirubas
Sahalkot
Wakamalang
S.N. Municipality Selected Ward
1 Tansen N.P 2,4,13

Assessment of Burden of Disease in Nepal
183
Ilaka wise VDCs sampling of Dang (ilaka=14,VDC= 39,NP=2)
S. N. Name of Ilaka VDCs Selected VDC
1 Lamahi
Chaulahi
Satbariya
Rajpur
Satbariya
2 Syuja Syuja
Syuja Saida
3 Tulsipur Tarigaun Tarigaun
4 Shreegaun
Shreegaun
Shatinagar
Dhanauri
Shatinagar
5 Panchakule
Panchakule
Panchakule
Baghmare
Purandhara
6 Hekuli
Hekuli
Hekuli
PawanNagar
Goltakuri
7 Phulbari Phulbari
Urahari Urahari
8 Manpur
Manpur
Bijauri
Halwar
Bijauri
9 Duruwa
Duruwa
Purandhara
Hapur
Dhikpur
Purandhara
10 Laxmipur
Laxmipur
Saudiyar
Dharna
Saudiyar
Rampur
Hansipur
11 Kabhre Kabhre
Loharpani Loharpani
12 Sisahaniya
Sisahaniya
Gobardiya
Lalmatiya
Sonpur
Gobardiya
13 Gadhawa
Gadhawa
Gadhawa
Bela
Gangapraspur
14 Koilabas Koilabas Koilabas
S.N. Municipalities Selected Municipality Selected Ward
1 Tulsipur Tulsipur 3,4,8,9
2 Tribhuwan Nagar

Assessment of Burden of Disease in Nepal
184
Ilaka wise VDCs sampling of Humla district (Ilaka=11, VDCs=27)
S.N Ilaka Name of VDCs Selected VDC
1 Dandafaya Dandafaya
Syada Syada
2 Darma
Darma
Mimi Shreemastha
Mimi
Melchham
3 Gothi
Gothi
Saya (Sama) Saya (Sama)
Rodikot
4 Hepka Hepka Hepka
5 Lali
Lali
Raya Chhipra
Raya
6 Nauthi Kalika HP
Kalika
Maila Maila
Madana
7 Muchu
Muchu
Khagalgaun Limi
Khagalgaun
8 Rip Baraigaun
Sarkeedeu Sarkeedeu
9 ShreeNagar Jair
Jair ShreeNagar
10 Thehe
Kharpunath
Kharpunath Thehe
Bargaun
11 Simikot (DHO) Simikot Simikot
Ilaka wise VDCs sampling of Rolpa District (Ilaka=11,VDCs=51)
S.N. Name of Ilaka VDCs Selected VDCs
1 Thawang
Thawang
Bhirul Bhirul
Kureli
2 Sakhi
Sakhi
Dubaring
Jhenam
Dubaring
Dubidanda
Masina
3 Gajul
Gajul
Gajul Fagaam
Jaiwang
Khumel
4 Jinawang Jinawang
GhartiGaun Pakhapani

Assessment of Burden of Disease in Nepal
185
Wot
GhartiGaun
Rank
5 Ghodagaun
Ghodagaun
Ghodagaun Khungri
Jedwang
JauliPokhari
6 Harjang
Harjang
Gumchal
Siuri
Pang
Gaam
Gumchal
7 Jaimakasala
Jaimakasala
Jaimakasala Uwa
Seram
8 Liwang
Liwang
Liwang
Jankot
Bhawang
Dhawang
Whama
Kotgaun
Korchawang
Kareti
9 Jungar
Jungar
Nuwagaun Gairigaun
Nuwagaun
Budagaun
10 Eriwang (Kebari)
Eriwang
Talawang
Paccawang
Rangkot
Rangsi
Talawang
11 Mijhing
Mijhing
Wadachaur
Wadachaur
Sirpa
Tewang
Aresh
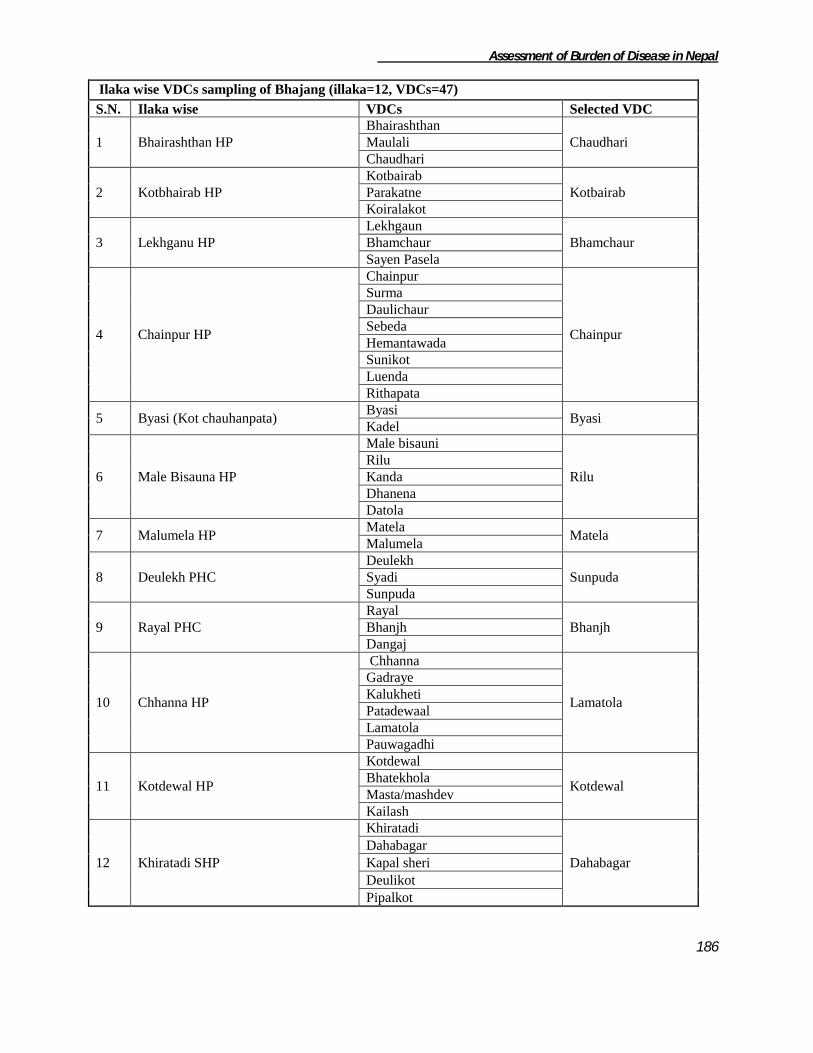
Assessment of Burden of Disease in Nepal
186
Ilaka wise VDCs sampling of Bhajang (illaka=12, VDCs=47)
S.N. Ilaka wise VDCs Selected VDC
1 Bhairashthan HP
Bhairashthan
Chaudhari Maulali
Chaudhari
2 Kotbhairab HP
Kotbairab
Kotbairab Parakatne
Koiralakot
3 Lekhganu HP
Lekhgaun
Bhamchaur Bhamchaur
Sayen Pasela
4 Chainpur HP
Chainpur
Chainpur
Surma
Daulichaur
Sebeda
Hemantawada
Sunikot
Luenda
Rithapata
5 Byasi (Kot chauhanpata) Byasi
Byasi Kadel
6 Male Bisauna HP
Male bisauni
Rilu
Rilu
Kanda
Dhanena
Datola
7 Malumela HP Matela
Matela Malumela
8 Deulekh PHC
Deulekh
Sunpuda Syadi
Sunpuda
9 Rayal PHC
Rayal
Bhanjh Bhanjh
Dangaj
10 Chhanna HP
Chhanna
Lamatola
Gadraye
Kalukheti
Patadewaal
Lamatola
Pauwagadhi
11 Kotdewal HP
Kotdewal
Kotdewal Bhatekhola
Masta/mashdev
Kailash
12 Khiratadi SHP
Khiratadi
Dahabagar
Dahabagar
Kapal sheri
Deulikot
Pipalkot

Assessment of Burden of Disease in Nepal
187
Ilaka wise VDCs sampling of Kailali District (Ilaka=13,VDCs=42 ,NP=2)
S.N. Name of Ilaka VDCs Selected VDCs
1 Tikapur PHC
Narayanpur
Narayanpur Dansinhapur
Pathariya
Durgauli
2 Bhajani PHC
Bhajani
Bhajani Lalbhoji
Khailad
3 Chaumala PHC
Chaumala
Khairala Urma
Masuriya
Khairala
4 Joshipur PHC
Joshipur
Boniya Thapapur
Boniya
5 Udasipur PHC
Udasipur
Gadariya Gadariya
Phulwari
6 Malakheti PHC
Malakheti
Sahajpur Godawari
Nigali
Sahajpur
7 Pandaun HP Pandaun
Mohanyal Mohanyal
8 Dododhara HP
Dododhara
Sadepani
Kota Tulsipur
Chauha
Baliya
Sadepani
9 Munuwa HP
Munuwa
Pratapur Janakinagar
Pratapur
10 Pahalmanpur HP
Pahalmanpur
Darakh Ramshikhar Jhala
Darakh
11 Basauti HP
Basauti
Ratanpur Pawera
Ratanpur
Hasuliya
12 Sreepur HP
Sreepur
Beladevipur Geta
Beladevipur
13 Sugarkhal HP Sugarkhal Sugarkhal
S.N. Municipalities Selected Municipality Selected Wards
1 Tikapur Tikapur 1,2,5
2 Dhangadhi
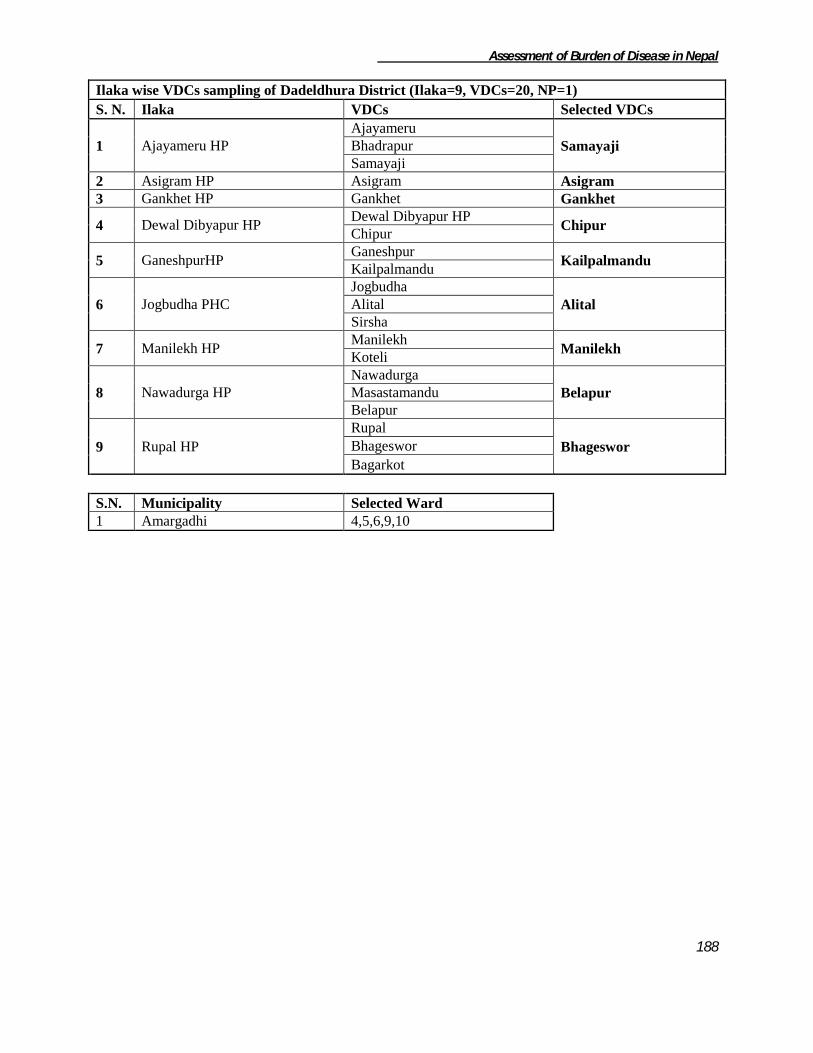
Assessment of Burden of Disease in Nepal
188
Ilaka wise VDCs sampling of Dadeldhura District (Ilaka=9, VDCs=20, NP=1)
S. N. Ilaka VDCs Selected VDCs
1 Ajayameru HP
Ajayameru
Samayaji Bhadrapur
Samayaji
2 Asigram HP Asigram Asigram
3 Gankhet HP Gankhet Gankhet
4 Dewal Dibyapur HP Dewal Dibyapur HP
Chipur Chipur
5 GaneshpurHP Ganeshpur
Kailpalmandu Kailpalmandu
6 Jogbudha PHC
Jogbudha
Alital Alital
Sirsha
7 Manilekh HP Manilekh
Manilekh Koteli
8 Nawadurga HP
Nawadurga
Belapur Masastamandu
Belapur
9 Rupal HP
Rupal
Bhageswor Bhageswor
Bagarkot
S.N. Municipality Selected Ward
1 Amargadhi 4,5,6,9,10

Assessment of Burden of Disease in Nepal
189
References
i World Health Organization Global Program on Evidence for Health policy. National Burden of Disease Studies: A
Practical Guide. Edition 2.0 October 2001;
ii Murray CJL, Salmon JA, Mathers, Lopez AD (eds.) WHO,Geneva. Summary measures of population health
concepts, ethics, measurement and applications (2002).Available at http://www.who.int/pub/smph/en/index.html.
iii
The Thai Working Group on Burden of Disease and Injury. Burden of Disease and Injury in Thailand. November
iv Murray CJ, Lopez AD. The Global Burden Of Disease-A comprehensive assessment of mortality and disability
from diseases, injuries and risk factors in 1990 and projected to 2020. 1996
v Ministry of Population and Environment, Central Bureau of Statistics. Population Projections For Nepal 2001-
2021.December 2003