assessment of compatibility between various intraoral
TRANSCRIPT
materials
Article
Assessment of Compatibility between VariousIntraoral Scanners and 3D Printers through anAccuracy Analysis of 3D Printed Models
Chang-Hee Im † , Ji-Man Park † , Jang-Hyun Kim, You-Jung Kang and Jee-Hwan Kim *
Department of Prosthodontics, Yonsei University College of Dentistry, 50-1 Yonsei-ro, Seodaemun-Gu,Seoul 03722, Korea; [email protected] (C.-H.I.); [email protected] (J.-M.P.);[email protected] (J.-H.K.); [email protected] (Y.-J.K.)* Correspondence: [email protected]; Tel.: +82-2-2228-3161† These authors contributed equally to this work.
Received: 21 September 2020; Accepted: 1 October 2020; Published: 4 October 2020�����������������
Abstract: To assess the accuracy of various intraoral scanners (IOSs) and to investigate the existenceof mutual compatibility that affects the accuracy between IOS and 3-dimensional (3D) printingusing a scan quadrant model. For clinical implication, crown preparations and cavity designaccording to prosthetic diagnosis and treatment considerations must be acquired by a digital scanner.The selected typodont model was scanned using a reference scanner, from which reference (Ref)standard tessellation language (STL) data were created. Data obtained by scanning the typodontmodel with IOSs based on three different technologies were divided into three groups (CS3600, i500,and Trios3). Scanned data from the groups were divided into sub-groups of digital light processing(DLP), fused deposition modeling (FDM), and stereolithography apparatus (SLA), based on which3D printed models (3DP) were fabricated. The 3DP dental models were scanned to obtain a totalof 90 3DP STL datasets. The best-fit algorithm of 3D analysis software was used for teeth and archmeasurements, while trueness was analyzed by calculating the average deviation among measuredvalues based on superimposition of Ref and IOS and 3DP data. The differences between Ref andIOS (Ref-IOS), Ref and 3DP (Ref-IOS/3DP), and IOS and 3DP data (IOS-3DP) were compared andanalyzed, while accuracy within each of the three main groups was assessed. For statistical analysis,the Kruskal–Wallis, Mann–Whitney U, and repeated measures ANOVA test were used (p < 0.05).The major finding is that the mutual relationships between IOSs and 3D printers vary dependingon the combination. However, i500 intraoral scanner and DLP 3D printer was the combination thatshowed the best trueness value.
Keywords: dental computer aided manufacturing (CAD-CAM); intraoral scanner; 3-dimensionalprinter; quadrant model; trueness
1. Introduction
In the world of data and digital technology, dental treatment has benefitted significantly fromrapid advances in computer-aided design and computer aided manufacturing (CAD/CAM) technology,making dental clinical practice much more convenient [1–5]. With the introduction of variousproducts based on new technologies, difficult and complex procedures using aligners, inlays, onlays,and coverage crowns became more affordable, efficient, and simpler. Moreover, it became easierto obtain direct data, which could then be acquired and transmitted by digital platforms [1,2,4–11].By using such new technologies, we are able to improve diagnostic accuracy and treat patients ina more effective and comfortable manner, while also being able to provide a safer, faster, and more
Materials 2020, 13, 4419; doi:10.3390/ma13194419 www.mdpi.com/journal/materials
Materials 2020, 13, 4419 2 of 16
comfortable experience through greater availability of CAD/CAM technology [2,5,7,12–14]. Currently,CAD/CAM technology is being applied more quickly in dentistry than in other industries. Owing totechnical advances in artificial intelligence and big data for impression taking with three-dimensional(3D) scanners and CAD processes, dentists and dental technicians can easily connect with each otheranywhere in the world [2,4,5,15].
The increased availability of intraoral scanner (IOS) technology in the dental field is expandingthe applicable range of 3D printed dental models for fabrication of customized products. As a result,IOS has been used often according to digital workflow in the past 7 years, with increasing use forfabricating the final restoration by printing the scanned data obtained from dental restorations witha 3D printer. It has become possible to actively analyze data, plan restorations in virtual space,directly fabricate anatomical models with a 3D printer, and materialize dental restorations, includingocclusal devices, aligners, retainers, bridges, veneers, partial denture framework, dental implants,and computer-guided implant templates. Meanwhile, the successful use of 3D printers is being appliedto patients and increasing in clinical practice [4,5,15–19]. However, assessment of compatibility withrespect to the matching process between two types of equipment with different functional principlesremains somewhat unclear; 3D printers toughen resin layers with a digital optical projector or a laserbeam and IOSs are a part of limited optical equipment with a depth of field that varies depending onthe system. Accordingly, comparative studies on this topic are needed [1–4,9,17,19].
Differences in the accuracy of IOS could lead to differences in restoration fabrication accuracy andfit when installed in the mouth. Minute errors during digital impression taking could cause biologicaland mechanical complications due to prosthesis misfit; the clinically acceptable marginal discrepancy(width) must be less than 120 µm [2,20]. Therefore, to fabricate a model that is accurate enough toresult in restoration with excellent fit, the overlapping area of image acquisition must not be distortedduring intraoral scanning and standard tessellation language (STL) format reconstruction [2,21].When digital impression taking using IOS and traditional impression taking are compared, the digitalmethod, which uses IOS to capture optical images as well as various software programs that are beingupgraded, could save time and cost, while enabling the fabrication of dental restorations, including 3Dmodels. As a result, there are various modifications and versions of digital products in today’s market,and software technology has become important, as the equipment can save time and accelerate theworkflow in modern dental clinics [4,5,8,14,22,23]. For the features of each IOS method, especially theprecision and accuracy of a product, the fact that there are favorable functions preferred over othersmust be considered [24,25]. IOSs are very popular owing to various advantages, and in particular,the latest digital impressions allow for complete-arch scanning at clinically allowable level, and manystudies have been conducted to assess the accuracy between various IOSs [2,14,26–28], Renne et al.reported an in vitro assessment of the accuracy of seven types of digital complete-arch scanners andstated that it is necessary to have a good understanding of the fact that each scanner has its own uniqueadvantages and disadvantages [26]. Therefore, varying levels of accuracy may appear depending onthe equipment characteristics of each IOS; it is necessary to identify issues that should be consideredfor clinical application.
Digital techniques involved in IOS data processing and designing and printing the data witha 3D printer have recently drawn much interest [17,29,30]. Various types of 3D structures could befabricated using STL data obtained from IOS, and various dental devices could be fabricated with3D printers. However, there is a lack of studies on IOS based on which principle and what type of3D printers have high compatibility and are superior [9,10,18]. Therefore, it is necessary to studywhether accurate results could be obtained through print tests using data obtained from IOS printedusing various types of 3D printers. Digital manufacturing can be divided into two types: additivemanufacturing (AM) and subtractive manufacturing (SM). AM involves adding layer upon layer untilthe final model is produced. In contrast, SM, which is also referred to as milling, involves cutting ablock to the desired shape. Compared to SM, such as milling hard ceramic, AM, which lacks resolution

Materials 2020, 13, 4419 3 of 16
and accuracy, can be used to produce complex structures without wasting material unlike SM wherematerial is discarded after being cut [4,5,18,19,31].
A study by Nestler et al. assessed the accuracy of complete-arch casts using various 3D printers,including fused deposition modeling (FDM), stereolithography apparatus (SLA), and digital lightprocessing (DLP) technologies, and identified that the deviation between printers with respect totrueness was 12 to 240 µm. This study concluded that the DLP 3D printer showed the highest overallaccuracy. Therefore, because technologies related to 3D printers have varying levels of trueness, thisshould be considered when the use of technology is assessed in dentistry and prosthodontics [9,32].
The present study aimed to find the optimal combination of a scanner and printer with differentattributes to obtain the best possible results that affect the accuracy between digital impression takingand 3D printing through IOS [1–3] according to the dentition of quadrant model geometry thatneeds planned prosthodontic treatment. Various crown preparations and cavity designs accordingto prosthetic diagnosis and treatment considerations must be acquired by a digital scanner throughsuperimposition of the product. Because there are almost no studies on the compatibility between 3Dprinted products, clinical assessment must be performed. Keeping this in mind, the objective of thepresent study was to assess how much error there is as compared to the original model to determinehow much influence there is on accuracy according to the compatibility of 3D products after IOS and3D printer printing processes. For this, quadrant models with various crown preparations and cavitydesigns were scanned with three different IOSs, after which, scanned data were converted to a 3Dresin model using three different 3D printers. The deviations for each part were compared betweenthe reference scan data and the 3D printing data, and between the reference scan data and IOS data.The interoperability and effects of IOS and 3D printers were also evaluated. The null hypothesis wasthat there would be no differences in the accuracy between the trueness after the 3D printing processalone and that of IOS scanning and 3D printing.
2. Materials and Methods
2.1. Study Quadrant Phantom Model Design
The present study used a maxillary complete-arch artificial dental model (A50H-Set; J. MoritaEurope GmbH, Dietzenbach, Germany) fabricated with epoxy resin that was prepared for variousinlays and complete coverage crowns. The artificial tooth model was scanned using a digital impressionindustrial precision scanner (stereoSCAN neo; AICON 3D Systems GmbH, Braunschweig, Germany).Scanned STL data were used, and the direct metal laser sintering technique was used to fabricate amaxillary right quadrant phantom model with cobalt-chromium (Co-Cr) material using a 3D printer(Eosint M270; EOS GmbH, Krailling, Germany). The types and locations of various inlays and completecoverage crowns prepared with the quadrant model were as follows: a complete coverage crownpreparation on a maxillary central incisor, a mesio-occlusal inlay preparation on a maxillary secondmolar, a mesio-occlusal inlay preparation on a maxillary first molar (MxFM#16), an occlusal inlaypreparation on a maxillary first premolar (MxFPM#14), and a complete coverage crown preparation ona maxillary canine (MxC#13) (Figure 1). Metal typodont is used to prevent from distortion or volumechange due to the experimental conditions such as temperature and humidity. Heat application onmetal typodont made its surface like it is sandblasted, resulting in no light distortion. So, there isno need to use powder on metal typodont [33]. During the experiment, the quadrant model wasnot altered by the addition or removal of teeth or the application of external force. All experimentalactions were performed under experimental conditions, with a temperature of 23 ± 1 ◦C and a relativehumidity of 50 ± 5%.

Materials 2020, 13, 4419 4 of 16Materials 2020, 13, x FOR PEER REVIEW 4 of 15
Figure 1. (A) 3-dimensional (3D) printed right maxillary quadrant Co-Cr typodont model, (B) Complete coverage crown preparation on maxillary canine (MxC#13), (C) Occlusal inlay preparation on maxillary first premolar (MxFPM#14), (D) Mesio-occlusal inlay preparation on maxillary first molar (MxFM#16).
2.2. Digital Scanning Process
To obtain reference (Ref) data, the typodont model was scanned once using a T500, blue light-emitting diode high-accuracy tabletop scanner (Identica T500; Medit Inc., Seoul, Korea), which was used as the reference scanner. Scanned data were saved as an STL reference file. For the next process, three different IOSs were used to scan the phantom model to acquire STL data, and data were divided into three groups. Table 1 shows the scanners that were used: CS3600 (Carestream, Rochester, NY, USA); i500 (Medit, Inc., Seoul, Korea); and Trios3 (3Shape A/S, Copenhagen, Denmark). For the scan process, 10 scans were completed by each scanner and a total of 30 scanned datasets named from data obtained from IOS (n = 10 for each group) were generated. The scanning procedure was conducted according to the manufacturers’ instructions by one trained, experienced operator. In the next process, STL data from the IOS group were used, and 3D models were fabricated with the next AM technique connected to three different 3D printers. Each 3D printed model has a unique printing method. Table 2 shows the types of 3D printers used: DLP (D2; Veltz3D, Incheon, Korea); FDM (Creator Pro; Flashforge, Zhejiang, China), and SLA (Form2; Formlabs, Somerville, MA, USA). During the experiment, the 3D models were not altered by the addition or removal of teeth or application of external force. Each completed 3D model was scanned using the colLab Scan software (2017 v.2.0.0.4; Medit Inc., Seoul, Korea) of the T500 reference scanner to obtain 3D printed model data (3DP) (n = 30 for each printer group), and as a result, a total of 90 sets of STL model data named according to the printer were generated. The 3D printer model data were divided into sub-groups.
Table 1. Characteristics of scanners used in this study.
System Manufacturer Scanner Technology Light Source Acquisition Method
Necessary of Coating
Identica T500 MEDIT Corp. Phase-shifting optical
triangulation Blue LED 1 Video None
CS3600 Carestream Dental
Active triangulation (Stream projection)
Light Video None
i500 MEDIT Corp. Dual camera optical triangulation
Light Video None
Trios3 3shape Confocal microscopy Light Video None 1 LED: light-emitting diode.
Figure 1. (A) 3-dimensional (3D) printed right maxillary quadrant Co-Cr typodont model, (B) Completecoverage crown preparation on maxillary canine (MxC#13), (C) Occlusal inlay preparation on maxillaryfirst premolar (MxFPM#14), (D) Mesio-occlusal inlay preparation on maxillary first molar (MxFM#16).
2.2. Digital Scanning Process
To obtain reference (Ref) data, the typodont model was scanned once using a T500,blue light-emitting diode high-accuracy tabletop scanner (Identica T500; Medit Inc., Seoul, Korea),which was used as the reference scanner. Scanned data were saved as an STL reference file. For thenext process, three different IOSs were used to scan the phantom model to acquire STL data, and datawere divided into three groups. Table 1 shows the scanners that were used: CS3600 (Carestream,Rochester, NY, USA); i500 (Medit, Inc., Seoul, Korea); and Trios3 (3Shape A/S, Copenhagen, Denmark).For the scan process, 10 scans were completed by each scanner and a total of 30 scanned datasetsnamed from data obtained from IOS (n = 10 for each group) were generated. The scanning procedurewas conducted according to the manufacturers’ instructions by one trained, experienced operator.In the next process, STL data from the IOS group were used, and 3D models were fabricated with thenext AM technique connected to three different 3D printers. Each 3D printed model has a uniqueprinting method. Table 2 shows the types of 3D printers used: DLP (D2; Veltz3D, Incheon, Korea); FDM(Creator Pro; Flashforge, Zhejiang, China), and SLA (Form2; Formlabs, Somerville, MA, USA). Duringthe experiment, the 3D models were not altered by the addition or removal of teeth or application ofexternal force. Each completed 3D model was scanned using the colLab Scan software (2017 v.2.0.0.4;Medit Inc., Seoul, Korea) of the T500 reference scanner to obtain 3D printed model data (3DP) (n = 30for each printer group), and as a result, a total of 90 sets of STL model data named according to theprinter were generated. The 3D printer model data were divided into sub-groups.
Table 1. Characteristics of scanners used in this study.
System Manufacturer Scanner Technology Light Source AcquisitionMethod
Necessaryof Coating
Identica T500 MEDIT Corp. Phase-shifting opticaltriangulation Blue LED 1 Video None
CS3600 CarestreamDental
Active triangulation(Stream projection) Light Video None
i500 MEDIT Corp. Dual camera opticaltriangulation Light Video None
Trios3 3shape Confocal microscopy Light Video None1 LED: light-emitting diode.

Materials 2020, 13, 4419 5 of 16
Table 2. Characteristics of 3D printers.
3D Printer Category Additive Manufacturing Process Techniques LayerThickness Print Time
FormlabsForm2
Vatphotopolymerization
SLA technology that operates byheating a hard-photosensitive liquid
resin into a hard-solid 3D form made ofplastic through the application of a
powerful laser beam with vatpolymerization-based technology.
Accordingly, after projecting a laserbeam moved by micromirrors, the resinlayer is cured to produce the product.SLA could produce complex shapeswith high functional resolution andproduce smooth and precise lines to
produce good models.
Stereolithographyapparatus
(SLA)100 µm 2 h 54 min
Veltz3D D2 Vatphotopolymerization
DLP technology is similar to that ofSLA, but it uses a high intensity lightbeam instead and the desired shape is
formed as the liquid photopolymerresin hardens. However, rough linesmay be produced, and pixels may be
displayed depending on the resolutionof the digital light projector. This means
that the resolution of the projector isreflected in the quality of the final
product. DLP has good accuracy andproduce smooth surfaces.
Digital lightprocessing
(DLP)100 µm 50 min
FlashforgeCreator Pro Material extrusion
One of the popular 3D printers thatrepresents AM technology is the FDM
printer with extrusion-basedtechnology. A pressure-based process
heats thermoplastic or compositefilament material in the bottom layer toits melting point and releases it layer bylayer to produce a pressure-assisted 3Dprinted product. The material used forthe FDM is relatively inexpensive andcan have a high mechanical strength.
Fuseddepositionmodeling
(FDM)
100 µm 3 h 12 min
2.3. Three-Dimensional Analysis
There was superimposition of 121 STL data sets by 3D software analysis (Geomagic Verify Xv.4.1.0.0; 3D Systems) and a total of 210 measured digitized data sets were generated by Geomagic 3Danalysis software. For the trueness evaluation, alignment between the reference data and scannedexperimental data was conducted by the best-fit algorithm. The median trueness of Ref-IOS data,Ref-IOS/3DP data, and IOS-3DP superimposed data were calculated. The overall data evaluationworkflow is presented in Figure 2. To evaluate the magnitude and distribution of the digitizedquadrant-arch model set acquired by the superimposition of Ref-IOS, Ref-IOS/3DP, and IOS-3DP data,color-coded map diagrams were drawn in the inspection software (Figure 3).

Materials 2020, 13, 4419 6 of 16Materials 2020, 13, x FOR PEER REVIEW 6 of 15
Figure 2. Three main groups (Ref-IOS, Ref-IOS/3D printed models (3DP), and IOS-3DP data) of the superimposed data read workflow diagram. (* Each printed model was scanned with a tabletop scanner to obtain standard tessellation language (STL) data).
2.4. 3D Printing Process
To obtain perfect quality, printable model data, function from the Model Creator module of Exocad software (Dental CAD software v.6136; Exocad GmbH, Darmstadt, Germany) was used. The quality of the entire area of STL data scanned using this software was checked, and unscanned empty areas were filled and the marginal areas of scanned data were organized to prepare STL data. Organized STL data were used to print with three different 3D printers to produce the 3D printed models. The build orientation of products printed by a DLP printer was set to 0° and the layer thickness of the prosthesis was 100 μm. The dental models were printed using resin (DM-1, 3D system) material. The occlusal surface of the printed model was connected vertically to the support structure to achieve 0° build orientation. Each printed model was washed for 20 min using 95% isopropyl alcohol (IPA) (wash produced by the Form manufacturer) before drying. Subsequently, an ultraviolet ray curable unit (60°, MP100; Hephzibah, Incheon, Korea) was used for 30 min to cure and harden the model to obtain 30 completed 3D DLP models. The build orientation of products printed by a FDM printer was set to 0° and the layer thickness of the prosthesis was 100 μm. The dental models were printed using a PLA/PHA flexible filament (standard white d1.75 mm) material. Subsequently, an ultraviolet ray curable unit (60°, P100; Hephzibah, Incheon, South Korea) was used for 30 min to cure and harden the model to obtain 30 completed 3D FDM models. The build orientation of products printed by an SLA printer was set to 0° and the layer thickness of the prosthesis was 100 μm. The dental models were printed using grey resin (V4, Photopolymer resin) material. Each printed model was washed for 20 min using 95% IPA with a form washing machine from the manufacturer before drying. Subsequently, an ultraviolet ray curable unit (MP100; Hephzibah, Incheon, Korea 60°) was used for 30 min to cure and harden the model to obtain 30 completed 3D SLA models. The 3D printers were prepared using preparation instructions given by each manufacturer, and a total of 90 printed models were produced.
2.5. Comparative Photo Analysis Through the Experimental Process
Prepared 3D models were photographed using a zoom lens of a Nikon AF-S Micro-NIKKOR 105-mm f/2.8G IF-ED lens camera. The three types of teeth that were selected #16 (MxFM), #14 (MxFPM), and #13 (MxC) were visualized for edge sharpness and the surface smoothness specific margin (Figure 4). Rapidform 2006 software (INUS Technology, Seoul, Korea) was used, and according to the tooth shape (#16, #14, and #13), IOS data and 3DP data were compared within isolated areas for visualization of the geometric assessment of the triangle polygon density and shape (Figure 5). Microstructures and qualities of 3D printed models were compared and visualized with field emission scanning electron microscope (FE-SEM) images (Figure 6).
Figure 2. Three main groups (Ref-IOS, Ref-IOS/3D printed models (3DP), and IOS-3DP data) of thesuperimposed data read workflow diagram. (* Each printed model was scanned with a tabletop scannerto obtain standard tessellation language (STL) data).
Materials 2020, 13, x FOR PEER REVIEW 9 of 15
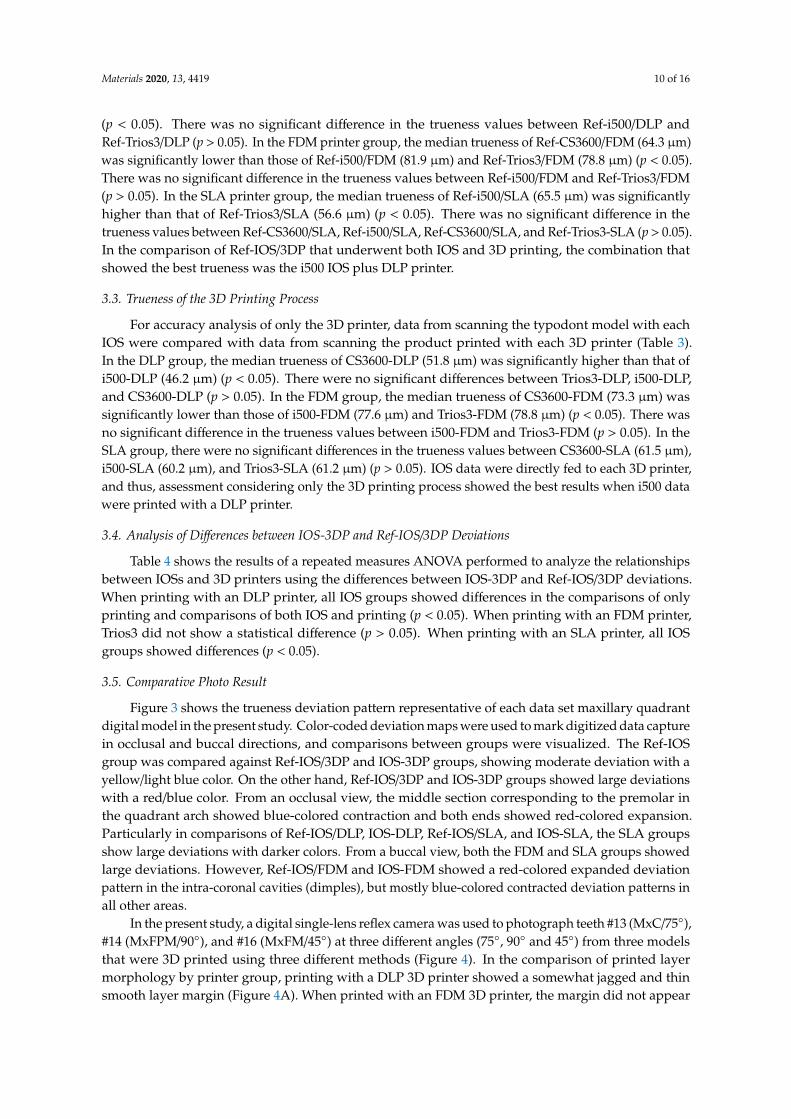
deviations with a red/blue color. From an occlusal view, the middle section corresponding to the premolar in the quadrant arch showed blue-colored contraction and both ends showed red-colored expansion. Particularly in comparisons of Ref-IOS/DLP, IOS-DLP, Ref-IOS/SLA, and IOS-SLA, the SLA groups show large deviations with darker colors. From a buccal view, both the FDM and SLA groups showed large deviations. However, Ref-IOS/FDM and IOS-FDM showed a red-colored expanded deviation pattern in the intra-coronal cavities (dimples), but mostly blue-colored contracted deviation patterns in all other areas.
Figure 3. Representative deviations of superimposition using a surface matching software on the 3D digital model. Range of deviation was color coded from −100 (blue) to +100 μm (red). (A) superimposition between Ref-IOS data. (B) superimposition between Ref-IOS/3DP data. (C) superimposition between IOS-3DP data.
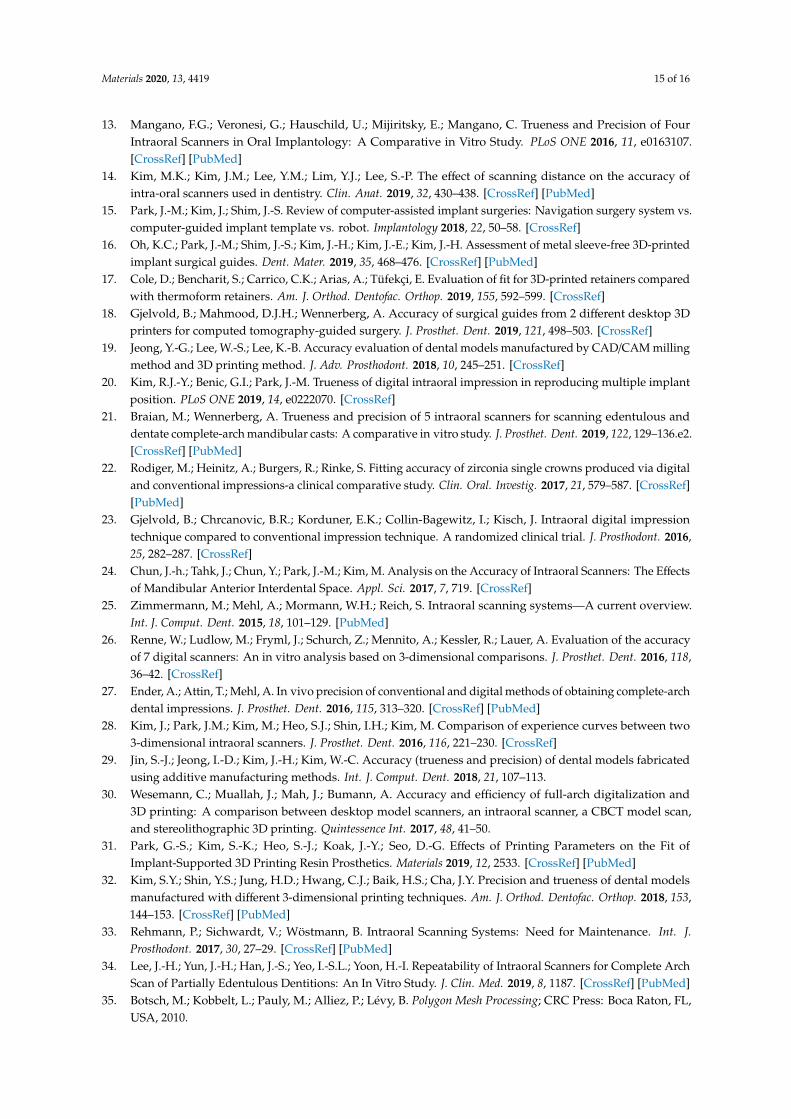
In the present study, a digital single-lens reflex camera was used to photograph teeth #13 (MxC/75°), #14 (MxFPM/90°), and #16 (MxFM/45°) at three different angles (75°, 90° and 45°) from three models that were 3D printed using three different methods (Figure 4). In the comparison of printed layer morphology by printer group, printing with a DLP 3D printer showed a somewhat jagged and thin smooth layer margin (Figure 4A). When printed with an FDM 3D printer, the margin did not appear prominently, and an insufficient thick layer appeared (Figure 4B). In contrast, when printed with an SLA 3D printer, layers with symmetrical straight smooth margins appeared (Figure 4C).
Figure 4. Surface characteristics of three different types of ((A) digital light processing (DLP), (B) fused deposition modeling (FDM), and (C) stereolithography apparatus (SLA)) 3D printed models.
In the present study, the differences in digital data deviation could be explained by the density of polygons formed by IOS and 3D printing data; Rapidform software was used for data analysis. IOS and 3DP data were selected and tooth data were investigated from three areas: teeth #13 (MxC), #14 (MxFPM), and #16 (MxFM) (Figure 5). Typically, IOS data showed a higher density (polygons per unit area) relative to 3DP data. When polygon images acquired by software were investigated, the stitch density of various types of triangular polygon shapes was high in complex shapes with many anatomical details. Triangle polygons overlapped by stitching between IOS groups showed a
Figure 3. Representative deviations of superimposition using a surface matching software onthe 3D digital model. Range of deviation was color coded from −100 (blue) to +100 µm(red). (A) superimposition between Ref-IOS data. (B) superimposition between Ref-IOS/3DP data.(C) superimposition between IOS-3DP data.
2.4. 3D Printing Process
To obtain perfect quality, printable model data, function from the Model Creator module of Exocadsoftware (Dental CAD software v.6136; Exocad GmbH, Darmstadt, Germany) was used. The quality ofthe entire area of STL data scanned using this software was checked, and unscanned empty areas werefilled and the marginal areas of scanned data were organized to prepare STL data. Organized STLdata were used to print with three different 3D printers to produce the 3D printed models. The buildorientation of products printed by a DLP printer was set to 0◦ and the layer thickness of the prosthesiswas 100 µm. The dental models were printed using resin (DM-1, 3D system) material. The occlusalsurface of the printed model was connected vertically to the support structure to achieve 0◦ buildorientation. Each printed model was washed for 20 min using 95% isopropyl alcohol (IPA) (washproduced by the Form manufacturer) before drying. Subsequently, an ultraviolet ray curable unit(60◦, MP100; Hephzibah, Incheon, Korea) was used for 30 min to cure and harden the model to obtain30 completed 3D DLP models. The build orientation of products printed by a FDM printer was setto 0◦ and the layer thickness of the prosthesis was 100 µm. The dental models were printed using

Materials 2020, 13, 4419 7 of 16
a PLA/PHA flexible filament (standard white d1.75 mm) material. Subsequently, an ultraviolet raycurable unit (60◦, P100; Hephzibah, Incheon, South Korea) was used for 30 min to cure and harden themodel to obtain 30 completed 3D FDM models. The build orientation of products printed by an SLAprinter was set to 0◦ and the layer thickness of the prosthesis was 100 µm. The dental models wereprinted using grey resin (V4, Photopolymer resin) material. Each printed model was washed for 20 minusing 95% IPA with a form washing machine from the manufacturer before drying. Subsequently,an ultraviolet ray curable unit (MP100; Hephzibah, Incheon, Korea 60◦) was used for 30 min to cureand harden the model to obtain 30 completed 3D SLA models. The 3D printers were prepared usingpreparation instructions given by each manufacturer, and a total of 90 printed models were produced.
2.5. Comparative Photo Analysis Through the Experimental Process
Prepared 3D models were photographed using a zoom lens of a Nikon AF-S Micro-NIKKOR105-mm f/2.8G IF-ED lens camera. The three types of teeth that were selected #16 (MxFM), #14(MxFPM), and #13 (MxC) were visualized for edge sharpness and the surface smoothness specificmargin (Figure 4). Rapidform 2006 software (INUS Technology, Seoul, Korea) was used, and accordingto the tooth shape (#16, #14, and #13), IOS data and 3DP data were compared within isolated areasfor visualization of the geometric assessment of the triangle polygon density and shape (Figure 5).Microstructures and qualities of 3D printed models were compared and visualized with field emissionscanning electron microscope (FE-SEM) images (Figure 6).
Materials 2020, 13, x FOR PEER REVIEW 9 of 15
deviations with a red/blue color. From an occlusal view, the middle section corresponding to the premolar in the quadrant arch showed blue-colored contraction and both ends showed red-colored expansion. Particularly in comparisons of Ref-IOS/DLP, IOS-DLP, Ref-IOS/SLA, and IOS-SLA, the SLA groups show large deviations with darker colors. From a buccal view, both the FDM and SLA groups showed large deviations. However, Ref-IOS/FDM and IOS-FDM showed a red-colored expanded deviation pattern in the intra-coronal cavities (dimples), but mostly blue-colored contracted deviation patterns in all other areas.
Figure 3. Representative deviations of superimposition using a surface matching software on the 3D digital model. Range of deviation was color coded from −100 (blue) to +100 μm (red). (A) superimposition between Ref-IOS data. (B) superimposition between Ref-IOS/3DP data. (C) superimposition between IOS-3DP data.
In the present study, a digital single-lens reflex camera was used to photograph teeth #13 (MxC/75°), #14 (MxFPM/90°), and #16 (MxFM/45°) at three different angles (75°, 90° and 45°) from three models that were 3D printed using three different methods (Figure 4). In the comparison of printed layer morphology by printer group, printing with a DLP 3D printer showed a somewhat jagged and thin smooth layer margin (Figure 4A). When printed with an FDM 3D printer, the margin did not appear prominently, and an insufficient thick layer appeared (Figure 4B). In contrast, when printed with an SLA 3D printer, layers with symmetrical straight smooth margins appeared (Figure 4C).
Figure 4. Surface characteristics of three different types of ((A) digital light processing (DLP), (B) fused deposition modeling (FDM), and (C) stereolithography apparatus (SLA)) 3D printed models.
In the present study, the differences in digital data deviation could be explained by the density of polygons formed by IOS and 3D printing data; Rapidform software was used for data analysis. IOS and 3DP data were selected and tooth data were investigated from three areas: teeth #13 (MxC), #14 (MxFPM), and #16 (MxFM) (Figure 5). Typically, IOS data showed a higher density (polygons per unit area) relative to 3DP data. When polygon images acquired by software were investigated, the stitch density of various types of triangular polygon shapes was high in complex shapes with many anatomical details. Triangle polygons overlapped by stitching between IOS groups showed a
Figure 4. Surface characteristics of three different types of ((A) digital light processing (DLP), (B) fuseddeposition modeling (FDM), and (C) stereolithography apparatus (SLA)) 3D printed models.
2.6. Statistical Analysis
Statistical analyses were conducted using SPSS (IBM Statistics, v.25.0; IBM Corp, Armonk, NY,USA), and all analyses were performed with a significance level of α = 0.05. The data was analyzednot to follow the normal distribution after the Kolmogorov–Smirnov test of three major groups,nonparametric analysis was conducted. The median trueness values of the three major groups wereanalyzed using the Kruskal–Wallis test, after which, the Mann–Whitney U test was used for pairedcomparisons between data from each group. Interactions between scanners were assessed usingpost-hoc testing with a Bonferroni adjustment (p < 0.05). To identify the differences between IOS-3DPand Ref-IOS/3DP deviations, a repeated measures analysis of variance (ANOVA) was performed,while the results from both IOS and 3D printing were compared and tested against analysis resultsfrom 3D printing. For mean estimated values, the Bonferroni test was used for pairwise comparisons(p < 0.05).

Materials 2020, 13, 4419 8 of 16
Materials 2020, 13, x FOR PEER REVIEW 10 of 15
good match (Figure 5A,B,C2). Further, between 3D model data, triangular polygon density and stitched shapes were different according to the 3D printed model (Figure 5A,B,C3–5).
Figure 5. (A) The teeth #13 (MxC), (B) #14 (MxFPM), and (C) #16 (MxFM). The numbers of per unit area compared in terms of the density and geometry of the triangle polygons for qualitative evaluation of each intraoral scanners (IOSs) and 3DP STL data.
For in-depth analysis of the printing processes of three different types of 3D printed models, teeth #13 (MxC), #14 (MxFPM), and #16 (MxFM) were selected and investigated using FE-SEM images (Figure 6). In the DLP model, examination of the cavities in the #14 (MxFPM) area showed that the layers were insufficient, and that the flow of the hardened resin material was uneven. When layers were added in #13 (MxC), each layer stayed intact in a straight line (Figure 6A). In the FDM model, #14 (MxFPM) and #16 (MxFM) areas showed thick layers and the margins were not prominent, while the order of layers when layering filament material did not match or was uneven (Figure 6B). In the SLA model, the order of layers in the entire area was clean, the flow of resin was even, and the hardened resin material in between layers showed good adhesion (Figure 6C).
Figure 5. (A) The teeth #13 (MxC), (B) #14 (MxFPM), and (C) #16 (MxFM). The numbers of per unitarea compared in terms of the density and geometry of the triangle polygons for qualitative evaluationof each intraoral scanners (IOSs) and 3DP STL data.Materials 2020, 13, x FOR PEER REVIEW 11 of 15
Figure 6. (A) DLP, (B) FDM, and (C) SLA each of the 3D printed models-SEM images at the three type surface characteristics of the models in the layer thickness density and shape by layer technique for qualitative evaluation (original magnification 30×).
4. Discussion
The objective of the present study was to confirm the presence of a mutual relationships between IOS and 3D printing in digital workflow which could affect the accuracy of digital impressions. For this, the reference model was scanned using IOS and the accuracy of the 3D printed model was analyzed. Based on this, it can be assessed whether the compatibility between the two types of equipment could have a major influence on the clinical process. The null hypothesis was that there would be no differences in compatibility with respect to the accuracy values between various combinations of technologies, when the result accounting for both IOS and 3D printing processes (Ref-IOS/3DP) and results accounting for only 3D printing (IOS-3DP) were compared. Measurement results showed that the median trueness of each group varied, and that there was specific combination of IOSs and 3D printers that were compatible with each other. Therefore, the null hypothesis that there would be no difference in the accuracy between Ref-IOS/3DP and IOS-3DP was rejected.
Every year, new upgraded IOSs with their own unique operating principle and operational characteristics are introduced to the market and are becoming more commonplace in clinics based on efficiently improved performance [2,20]. In the present study, recently introduced CS3600, i500, and Trios3 IOSs were used to scan a phantom model, and the results were compared with reference data from scanning with a reference scanner to assess trueness (Ref-IOS). The accuracy of CS3600 was inferior to those of Trios3 and i500, while the most accurate IOS was found to be the i500. Such findings were consistent with the results of a study by Kim et al. regarding the comparison of trueness between various IOSs and a complete-arch scan of multiple implant cylinders. i500 and Trios3 showed excellent accuracies among the various IOSs [20]. The size of errors that appeared in the color-coded map in the present study was smaller than that of the previous study. There are several causes of IOS data error, and in particular, errors may occur during the process of aligning images of large and simple objects [21,24]. Scan accuracy and deviation have been reported to generalize inaccurate and false information due to error accumulation in the image recombination process or overlapping data stitching error [34]. When the polygon density of IOS scanned data was investigated in the present study, the CS3600 group showed higher polygon density than i500 and Trios 3 (Figure 5A1–C1), but it also showed poorer accuracy. The study by Kim et al. reported that the shape of polygons for IOS data could cause differences in accuracy according to the difference in the distribution of equilateral and skinny triangles. For example, the PlanScan group generated polygons with a high density, but its measured accuracy was inferior, which was consistent with the tendency found in the present study [2,35]. In the present study, the i500 group showed many equilateral triangles, whereas the CS3600 and Trios3 groups showed many skinny and equilateral triangles, along with some uneven lines and surfaces (Figure 5, per unit area A1–C1 of A2–C2 red box).
The present study performed intraoral scans on a quadrant-arch model, and when compared to studies that used complete-arch models, the median trueness values were relatively accurate. In an in vivo study by Ender et al. and an in vitro study by Renne et al., the quadrant-arch scan was more accurate than a complete-arch scan. Unscanned areas, which are represented as holes, are
Figure 6. (A) DLP, (B) FDM, and (C) SLA each of the 3D printed models-SEM images at the three typesurface characteristics of the models in the layer thickness density and shape by layer technique forqualitative evaluation (original magnification 30×).

Materials 2020, 13, 4419 9 of 16
3. Results
Comparisons between IOSs and the median trueness values of IOS-3DP and Ref-IOS/3DP areshown in Table 3. Table 4 shows the results of analyzing the relationship between IOSs and 3D printersby identifying the differences between deviations of IOS-3DP and Ref-IOS/3DP using raw data fromIOS-3DP and Ref-IOS/3DP.
Table 3. Comparison of median trueness values by all data capture principle (unit: µm).
Variable N
Ref-IOSData
Ref-IOS/DLPData
Ref-IOS/FDMData
Ref-IOS/SLAData IOS-DLP Data IOS-FDM
Data IOS-SLA Data
Median (Q1–Q3)
CS3600 10 30.2(27.1–34.9) a
59.5(57.9–66.1) a
64.3(63.8–68.1) b
57.1(46.7–64.8)
ab51.8 (49.8–55.8) a 73.3
(71.8–75.1) b 61.5 (58.1–68.3) a
i500 10 23.5(20.8–25.9) b
43.2(38.5–46.1) b
81.9(79.9–85.2) a
65.5(62.8–68.9) a 46.2 (44.4–48.4) b 77.6
(74.9–79.9) a 60.2(56.6–63.1) a
Trios3 1026.9
(24.5–28.6)ab
44.8(39.2–48.2) b
78.8(74.5–81.5) a
56.6(47.9–60.5) b
50.8 (47.1–54.7)ab
78.8(75.1–81.1) a 61.2(56.9–66.3) a
Total 30 26.6(24.5–28.9)
47.1(41.6–58.2)
76.3(66.5–81.5)
59.8(53.5–65.5) 49.5 (46.4–53.5) 75.9
(73.3–79.1) 61.2 (57.5–65.8)
df - 2 2 2 2 2 2 2Chi-square - 15.4 19.6 19.1 8.7 10.5 11.5 0.7p value - <0.001 <0.001 <0.001 0.013 0.005 0.03 0.695
df, degrees of freedom. Statistically significant at p < 0.05. Bonferroni: a>b. Median values used for statisticalanalysis. Different lowercase letters within the same column indicate statistical difference between Ref-IOS,Ref-IOS/3DP and IOS-3DP overall digital data capture principles. The “a” indicates higher value of each data whilethe “b” indicates lower value of each data. There is a significant difference between “a” and “b” while there isno significant difference between the same lowercase letters. If there is an “ab”, there is no significant differencebetween the “ab” and the “a”, and between the “ab” and “b” as well (multiple comparison by Mann-Whitney Utest) (p < 0.05).
Table 4. Comparison of median trueness values of IOS-3DP and Ref-IOS/3DP deviations.
Variable IOS-DLP—Ref-IOS/DLP IOS-FDM—Ref-IOS/FDM IOS-SLA—Ref-IOS/SLA
CS3600 51.8b—59.5a 73.3a—64.3b 61.5a—57.1bi500 46.2a—43.2b 77.6b—81.9a 60.2b—65.5a
Trios3 50.8a—44.8b 78.8a—78.8a 61.2a—56.6bSum of Squares 3.408(143.092) 14.308(46.122) 87.363(191.065)
df 1(27) 1(27) 1(27)Median square 3.408(5.300) 14.308(1.708) 87.363(7.076)
F 0.643(−) 8.376(−) 12.345(−)p value 0.430(−) 0.007(−) 0.002(−)
Statistically significant at p < 0.05. Bonferroni: a>b. Repeated measures ANOVA group relations based on testpairwise comparisons are reported. The median trueness value used for statistical analysis showed no significantdifference between Trios3-FDM and Ref-Trios3/FMD (p > 0.906) within the same column, and showed a significantdifference between IOS-3DP and Ref-IOS/3DP (p < 0.001).
3.1. Trueness of Only the IOS Process
For accuracy analysis between IOSs, reference data of the typodont model were overlappedwith IOS data and trueness values were compared. The results showed that the deviation betweenRef-i500 (23.5 µm) was significantly lower than the deviation between Ref-CS3600 (30.2 µm) (p < 0.05).There were no significant differences in the deviation values between Ref-Trios3 and Ref-CS3600,and between Ref-Trios3 and Ref-i500 (p < 0.05, Table 3).
3.2. Trueness of IOS and 3D Printing Processes
To assess the changes in accuracy during the process of undergoing IOS and 3D printing processes,reference data of the typodont model (Ref) and data from scanning the 3D printed model in each group(3DP) were compared (Table 3). In the DLP printer group, the median trueness of Ref-CS3600/DLP(59.5 µm) was significantly higher than that of Ref-i500/DLP (43.2 µm) and Ref-Trios3/DLP (44.8 µm)
Materials 2020, 13, 4419 10 of 16
(p < 0.05). There was no significant difference in the trueness values between Ref-i500/DLP andRef-Trios3/DLP (p > 0.05). In the FDM printer group, the median trueness of Ref-CS3600/FDM (64.3 µm)was significantly lower than those of Ref-i500/FDM (81.9 µm) and Ref-Trios3/FDM (78.8 µm) (p < 0.05).There was no significant difference in the trueness values between Ref-i500/FDM and Ref-Trios3/FDM(p > 0.05). In the SLA printer group, the median trueness of Ref-i500/SLA (65.5 µm) was significantlyhigher than that of Ref-Trios3/SLA (56.6 µm) (p < 0.05). There was no significant difference in thetrueness values between Ref-CS3600/SLA, Ref-i500/SLA, Ref-CS3600/SLA, and Ref-Trios3-SLA (p > 0.05).In the comparison of Ref-IOS/3DP that underwent both IOS and 3D printing, the combination thatshowed the best trueness was the i500 IOS plus DLP printer.
3.3. Trueness of the 3D Printing Process
For accuracy analysis of only the 3D printer, data from scanning the typodont model with eachIOS were compared with data from scanning the product printed with each 3D printer (Table 3).In the DLP group, the median trueness of CS3600-DLP (51.8 µm) was significantly higher than that ofi500-DLP (46.2 µm) (p < 0.05). There were no significant differences between Trios3-DLP, i500-DLP,and CS3600-DLP (p > 0.05). In the FDM group, the median trueness of CS3600-FDM (73.3 µm) wassignificantly lower than those of i500-FDM (77.6 µm) and Trios3-FDM (78.8 µm) (p < 0.05). There wasno significant difference in the trueness values between i500-FDM and Trios3-FDM (p > 0.05). In theSLA group, there were no significant differences in the trueness values between CS3600-SLA (61.5 µm),i500-SLA (60.2 µm), and Trios3-SLA (61.2 µm) (p > 0.05). IOS data were directly fed to each 3D printer,and thus, assessment considering only the 3D printing process showed the best results when i500 datawere printed with a DLP printer.
3.4. Analysis of Differences between IOS-3DP and Ref-IOS/3DP Deviations
Table 4 shows the results of a repeated measures ANOVA performed to analyze the relationshipsbetween IOSs and 3D printers using the differences between IOS-3DP and Ref-IOS/3DP deviations.When printing with an DLP printer, all IOS groups showed differences in the comparisons of onlyprinting and comparisons of both IOS and printing (p < 0.05). When printing with an FDM printer,Trios3 did not show a statistical difference (p > 0.05). When printing with an SLA printer, all IOSgroups showed differences (p < 0.05).
3.5. Comparative Photo Result
Figure 3 shows the trueness deviation pattern representative of each data set maxillary quadrantdigital model in the present study. Color-coded deviation maps were used to mark digitized data capturein occlusal and buccal directions, and comparisons between groups were visualized. The Ref-IOSgroup was compared against Ref-IOS/3DP and IOS-3DP groups, showing moderate deviation with ayellow/light blue color. On the other hand, Ref-IOS/3DP and IOS-3DP groups showed large deviationswith a red/blue color. From an occlusal view, the middle section corresponding to the premolar inthe quadrant arch showed blue-colored contraction and both ends showed red-colored expansion.Particularly in comparisons of Ref-IOS/DLP, IOS-DLP, Ref-IOS/SLA, and IOS-SLA, the SLA groupsshow large deviations with darker colors. From a buccal view, both the FDM and SLA groups showedlarge deviations. However, Ref-IOS/FDM and IOS-FDM showed a red-colored expanded deviationpattern in the intra-coronal cavities (dimples), but mostly blue-colored contracted deviation patterns inall other areas.
In the present study, a digital single-lens reflex camera was used to photograph teeth #13 (MxC/75◦),#14 (MxFPM/90◦), and #16 (MxFM/45◦) at three different angles (75◦, 90◦ and 45◦) from three modelsthat were 3D printed using three different methods (Figure 4). In the comparison of printed layermorphology by printer group, printing with a DLP 3D printer showed a somewhat jagged and thinsmooth layer margin (Figure 4A). When printed with an FDM 3D printer, the margin did not appear

Materials 2020, 13, 4419 11 of 16
prominently, and an insufficient thick layer appeared (Figure 4B). In contrast, when printed with anSLA 3D printer, layers with symmetrical straight smooth margins appeared (Figure 4C).
In the present study, the differences in digital data deviation could be explained by the densityof polygons formed by IOS and 3D printing data; Rapidform software was used for data analysis.IOS and 3DP data were selected and tooth data were investigated from three areas: teeth #13 (MxC),#14 (MxFPM), and #16 (MxFM) (Figure 5). Typically, IOS data showed a higher density (polygonsper unit area) relative to 3DP data. When polygon images acquired by software were investigated,the stitch density of various types of triangular polygon shapes was high in complex shapes with manyanatomical details. Triangle polygons overlapped by stitching between IOS groups showed a goodmatch (Figure 5A,B,C2). Further, between 3D model data, triangular polygon density and stitchedshapes were different according to the 3D printed model (Figure 5A,B,C3–5).
For in-depth analysis of the printing processes of three different types of 3D printed models,teeth #13 (MxC), #14 (MxFPM), and #16 (MxFM) were selected and investigated using FE-SEM images(Figure 6). In the DLP model, examination of the cavities in the #14 (MxFPM) area showed that thelayers were insufficient, and that the flow of the hardened resin material was uneven. When layerswere added in #13 (MxC), each layer stayed intact in a straight line (Figure 6A). In the FDM model, #14(MxFPM) and #16 (MxFM) areas showed thick layers and the margins were not prominent, while theorder of layers when layering filament material did not match or was uneven (Figure 6B). In the SLAmodel, the order of layers in the entire area was clean, the flow of resin was even, and the hardenedresin material in between layers showed good adhesion (Figure 6C).
4. Discussion
The objective of the present study was to confirm the presence of a mutual relationships betweenIOS and 3D printing in digital workflow which could affect the accuracy of digital impressions. For this,the reference model was scanned using IOS and the accuracy of the 3D printed model was analyzed.Based on this, it can be assessed whether the compatibility between the two types of equipmentcould have a major influence on the clinical process. The null hypothesis was that there would beno differences in compatibility with respect to the accuracy values between various combinations oftechnologies, when the result accounting for both IOS and 3D printing processes (Ref-IOS/3DP) andresults accounting for only 3D printing (IOS-3DP) were compared. Measurement results showed thatthe median trueness of each group varied, and that there was specific combination of IOSs and 3Dprinters that were compatible with each other. Therefore, the null hypothesis that there would be nodifference in the accuracy between Ref-IOS/3DP and IOS-3DP was rejected.
Every year, new upgraded IOSs with their own unique operating principle and operationalcharacteristics are introduced to the market and are becoming more commonplace in clinics basedon efficiently improved performance [2,20]. In the present study, recently introduced CS3600, i500,and Trios3 IOSs were used to scan a phantom model, and the results were compared with referencedata from scanning with a reference scanner to assess trueness (Ref-IOS). The accuracy of CS3600was inferior to those of Trios3 and i500, while the most accurate IOS was found to be the i500. Suchfindings were consistent with the results of a study by Kim et al. regarding the comparison of truenessbetween various IOSs and a complete-arch scan of multiple implant cylinders. i500 and Trios3 showedexcellent accuracies among the various IOSs [20]. The size of errors that appeared in the color-codedmap in the present study was smaller than that of the previous study. There are several causes ofIOS data error, and in particular, errors may occur during the process of aligning images of large andsimple objects [21,24]. Scan accuracy and deviation have been reported to generalize inaccurate andfalse information due to error accumulation in the image recombination process or overlapping datastitching error [34]. When the polygon density of IOS scanned data was investigated in the presentstudy, the CS3600 group showed higher polygon density than i500 and Trios 3 (Figure 5A1–C1), but italso showed poorer accuracy. The study by Kim et al. reported that the shape of polygons for IOSdata could cause differences in accuracy according to the difference in the distribution of equilateral

Materials 2020, 13, 4419 12 of 16
and skinny triangles. For example, the PlanScan group generated polygons with a high density,but its measured accuracy was inferior, which was consistent with the tendency found in the presentstudy [2,35]. In the present study, the i500 group showed many equilateral triangles, whereas theCS3600 and Trios3 groups showed many skinny and equilateral triangles, along with some unevenlines and surfaces (Figure 5, per unit area A1–C1 of A2–C2 red box).
The present study performed intraoral scans on a quadrant-arch model, and when comparedto studies that used complete-arch models, the median trueness values were relatively accurate.In an in vivo study by Ender et al. and an in vitro study by Renne et al., the quadrant-arch scanwas more accurate than a complete-arch scan. Unscanned areas, which are represented as holes,are automatically patched by the software [26,27,36]. Ender et al. reported that the accuracy of scanneddata may be affected by the algorithm of scan software and that deviation gradually increases as theerror in the anterior teeth region accumulates and carries over to the distal end of the arch [27,37].Despite this, Braian et al. reported that accuracy increases during the overlap process when scanning acomplex-shaped object with a short span, and in particular, because stitching is easier when scanningan occlusal surface with complex geometry, there may be fewer errors than when scanning a smoothsurface [2,20,21]. Figure 3A shows the assessment results of trueness of IOS data of a quadrant-archfrom color map analysis in the present study. Park et al. analyzed the trueness of scanned inlaycavity data and expressed the results as a color map. When the maxillary first premolar and firstmolar were compared within the same range as the present study (−100 to +100 µm), the cervical area,especially the surrounding pattern in the box area of cavities showed less red color. Such a differencemay appear because of a difference in accuracy according to the laboratory environment, surfacecharacteristics of the reference model, scan strategy of the investigator, weight of the scanner, or wandsize [3]. In the present study, anterior (incisor) and posterior (molar) regions showed the largest errorsin the post-printing color map (Figures 3B and 4C). It was confirmed that errors were more diverseaccording to the digital model region, as compared to reference IOS images, because the printed modelcontained a mixture of expanding and contracting areas.
When the 3D printed models based on an intraoral scan of the quadrant model were analyzedin the present study, trueness became much worse as compared that of the intraoral scan processalone. However, the trueness values in all groups were within the clinically allowable range [9]. In themeasurement results that accounted for only the 3D printing process (IOS-3DP), there were differencesin median trueness between the groups, with FDM showing a high value of 75.9 µm and DLP showinga low value of 49.5 µm, while SLA showed a median value of 61.2 µm. In the study by Kim et al. on aprinted complete-arch model, fused filament fabrication showed a value of 241 µm and DLP showed ahigh value of 260 µm, whereas SLA showed a low trueness value of 237 µm [32]. The accuracy of 3Dprinters can be affected by various causes, such as arch size (complete-arch or quadrant-arch), the 3Dprinting process, and measurement method. Nestler et al., who explained the causes of deviationsthat occur during printing, compared photopolymerization-based and extrusion-based systems andreported that shrinkage and warpage were caused by incomplete polymerization of the resin monomerby light sources during printing. It was explained that DLP showed superior trueness compared withother printers because of better polymerization of resin [5,9,18]. Gjelvold et al. assessed deviationsbetween the positions of surgical guides for computed tomography implant surgery fabricated bydesktop 3D printers based on two different techniques (DLP and SLA). They reported that the SLAtechnique showed a slightly higher deviation in specific parts of the guide, as compared to the DLPtechnique, and presented the cause of the difference between the mean deviation of the dental implantposition [18]. Other studies reported that one of the advantages of DLP and SLA printers was lessshrinkage as compared to other 3D technologies, including FDM [16,31,38,39].
The present study used images to show the difference between the FDM technique (extrusion-based)that applies heat for printing and SLA and DLP techniques (photopolymerization-based) that hardenlight curable resin by laser or ultraviolet light. The fact that using a laser allowed for a soft and smoothfinish and showed higher resolution was confirmed based on magnified electron microscopic findings

Materials 2020, 13, 4419 13 of 16
(Figure 6), which was contrary to the FDM group that showed a pattern of a stepped layer. Meanwhile,Kim et al. compared images of three different models produced by three different 3D printing methods,and showed that models printed with SLA, FDM, and DLP 3D printers all appeared to have the samesmooth surface [32]. In the present study, the shape of the support was presented by a high-resolutionphotograph for a clear comparison of differences in the surfaces of models produced by differentprinting methods. The inlay model printed by the FDM method did not show a clear crown margin orclear boundary lines, whereas SLA and DLP models showed clear marginal lines (Figure 4). This partis an essential element for excellent clinical outcomes. A study by Cole et al., which compared andassessed conventionally fabricated clear retainers and 3D printed retainers, reported that 3D printedretainers had a higher trueness value and that the size of the model generally changed during the 3Dprinting process; thus, accuracy may be lowered [17]. It is necessary for 3D printed dental models tohave high dimensional accuracy, while the 3D printing method and specifications that affect surfaceresolution are also important. Accuracy is determined mostly by the characteristics of SLA, DLP,and FDM printers, but material-related geometry of layer thickness and 3D printing build orientationcould also influence the warpage effect and the dimensional accuracy of shrinkage [9,10,31,32].
The present study conducted a comparative analysis of trueness values that accounted for only the3D printing process (IOS-3DP) and for both scanning and printing processes (Ref-IOS/3DP). The resultsshowed that there was a difference in accuracy according to the compatibility flow between IOS and3D printing (Table 4). Based on this, the association between three different IOS groups and threedifferent 3D printer groups could be assessed. When assessing the accuracy of models that were 3Dprinted based on orally scanned data, it was determined that different results may be found dependingon different combinations because of the characteristics and advantages/disadvantages of each type ofequipment and technology. The combination that showed the best result among IOS-3DP truenesswith only 3D printing was the DLP printer and i500scanner, while the most suitable scanner for theFDM printer was the CS3600. On the other hand, it was confirmed that the SLA printer generallyworked well with all scanners (Table 3). When assessing both IOS and 3D printing, the combinationthat showed the best result for Ref-IOS/3DP trueness was the i500 scanner and DLP printer. The FDMprinter was suitable for use with the CS3600 scanner but had a poor mutual relationship with the i500scanner (Table 3). Trios3 and the SLA printer were found to be a good combination. Trueness valuesfound in the present study were all less than 43 to 78 µm, which would be sufficient for the purposeof assessing occlusion with a contact point for prostheses. Median trueness values of the 3D printeddental models were clinically acceptable according to the guidelines [9,32,40]. However, the resultsalso showed that combining different scanners and printers could lead to different results.
The laboratory conditions were kept as accurate as possible and as close to the natural environment,but the study was not able to fully reproduce the conditions in actual clinical settings. As a result,there were some limitations. The experiment used a maxillary quadrant-arch typodont model madeof Co-Cr metal for scanning; the study did not test dentin, enamel, or soft tissues that are typicallyencountered in actual clinical practice. Moreover, the present study was conducted under a constantrelative humidity to minimize environmental bias, but it did not consider patient-related variablessuch as patients with limited mouth opening during intraoral scanning and interference by the cheek,tongue, saliva, and blood during scanning. Various combinations of IOSs and 3D printers wereassessed in the present study and it was discovered that they have mutual compatibility. Therefore,when implementing equipment in the clinical setting, it is important to compare the various advantagesand disadvantages of each equipment; however, compatibility should also be considered when choosinga system that suits each treatment environment. Finally, development of IOSs and 3D printer producedata that would benefit reduced costs, increased speed of manufacture, and more efficient, minimallyinvasive treatments for the patients. Accordingly, additional studies related to this are needed.

Materials 2020, 13, 4419 14 of 16
5. Conclusions
Based on the assessment of accuracy considering mutual compatibility when using a combinationof IOSs and 3D printers within the limitations of the present study, the following conclusions werederived:
• In the Ref-IOS group, the i500 scanner was accurate (p < 0.05).• In the Ref-IOS/3DP group, the best match was the combination of i500 and DLP, while Trios3 and
i500 were more suitable for an SLA printer. Meanwhile, the FDM printer was suitable for use withthe CS3600 (p < 0.05).
• In the IOS-3DP group, the best match was the combination of i500 and DLP, while CS3600 andFDM were suitable for use together. Meanwhile, the SLA printer worked well with all scanners(p < 0.05).
• The mutual relationship between IOS and the 3D printer varied depending on the combination.Although no equipment could be classified as being the most accurate, the DLP printer was mostaccurate in this study, regardless of which scanner it was combined with (p < 0.05).
Author Contributions: Conceptualization, J.-H.K. (Jee-Hwan Kim) and J.-M.P.; methodology, J.-M.P.; software,C.-H.I., J.-H.K. (Jang-Hyun Kim); formal analysis, C.-H.I., Y.-J.K.; investigation, C.-H.I.; data curation, C.-H.I.;writing—original draft preparation, C.-H.I.; writing—review & editing, J.-H.K. (Jee-Hwan Kim), J.-M.P.;visualization, C.-H.I., J.-M.P.; supervision, J.-H.K. (Jee-Hwan Kim); project administration, J.-H.K. (Jee-Hwan Kim),J.-M.P. All authors have read and agreed to the published version of the manuscript.
Funding: This study was supported by a faculty research grant of Yonsei University College of Dentistry(6-2020-0020).
Conflicts of Interest: The authors declare no conflict of interest.
References
1. Park, J.M. Comparative analysis on reproducibility among 5 intraoral scanners: Sectional analysis accordingto restoration type and preparation outline form. J. Adv. Prosthodont. 2016, 8, 354–362. [CrossRef] [PubMed]
2. Kim, R.J.-Y.; Park, J.-M.; Shim, J.-S. Accuracy of 9 intraoral scanners for complete-arch image acquisition:A qualitative and quantitative evaluation. J. Prosthet. Dent. 2018, 120, 895–903. [CrossRef] [PubMed]
3. Park, J.M.; Kim, R.J.; Lee, K.W. Comparative reproducibility analysis of 6 intraoral scanners used on complexintracoronal preparations. J. Prosthet. Dent. 2019, 123, 113–120. [CrossRef] [PubMed]
4. Dawood, A.; Marti, B.M.; Sauret-Jackson, V.; Darwood, A. 3D printing in dentistry. Br. Dent. J. 2015, 219, 521.[CrossRef]
5. Liaw, C.-Y.; Guvendiren, M. Current and emerging applications of 3D printing in medicine. Biofabrication2017, 9, 024102. [CrossRef]
6. Addi, S.; Hedayati-Khams, A.; Poya, A.; Sjögren, G. Interface gap size of manually and CAD/CAM-manufactured ceramic inlays/onlays in vitro. J. Dent. 2002, 30, 53–58. [CrossRef]
7. Lim, J.-H.; Park, J.-M.; Kim, M.; Heo, S.-J.; Myung, J.-Y. Comparison of digital intraoral scanner reproducibilityand image trueness considering repetitive experience. J. Prosthet. Dent. 2018, 119, 225–232. [CrossRef]
8. Kim, J.E.; Hong, Y.S.; Kang, Y.J.; Kim, J.H.; Shim, J.S. Accuracy of scanned stock abutments using differentintraoral scanners: An in vitro study. J. Prosthodont. 2019, 28, 797–803. [CrossRef]
9. Nestler, N.; Wesemann, C.; Spies, B.C.; Beuer, F.; Bumann, A. Dimensional accuracy of extrusion-andphotopolymerization-based 3D printers: In vitro study comparing printed casts. J. Prosthet. Dent. 2020.[CrossRef]
10. Tahayeri, A.; Morgan, M.; Fugolin, A.P.; Bompolaki, D.; Athirasala, A.; Pfeifer, C.S.; Ferracane, J.L.;Bertassoni, L.E. 3D printed versus conventionally cured provisional crown and bridge dental materials.Dent. Mater. 2018, 34, 192–200. [CrossRef]
11. Son, K.; Lee, W.-S.; Lee, K.-B. Effect of repeated learning for two dental CAD software programs. J. Dent.Rehabil. Appl. Sci. 2017, 33, 88–96. [CrossRef]
12. Kim, J.E.; Amelya, A.; Shin, Y.; Shim, J.S. Accuracy of intraoral digital impressions using an artificial landmark.J. Prosthet. Dent. 2017, 117, 755–761. [CrossRef] [PubMed]
Materials 2020, 13, 4419 15 of 16
13. Mangano, F.G.; Veronesi, G.; Hauschild, U.; Mijiritsky, E.; Mangano, C. Trueness and Precision of FourIntraoral Scanners in Oral Implantology: A Comparative in Vitro Study. PLoS ONE 2016, 11, e0163107.[CrossRef] [PubMed]
14. Kim, M.K.; Kim, J.M.; Lee, Y.M.; Lim, Y.J.; Lee, S.-P. The effect of scanning distance on the accuracy ofintra-oral scanners used in dentistry. Clin. Anat. 2019, 32, 430–438. [CrossRef] [PubMed]
15. Park, J.-M.; Kim, J.; Shim, J.-S. Review of computer-assisted implant surgeries: Navigation surgery system vs.computer-guided implant template vs. robot. Implantology 2018, 22, 50–58. [CrossRef]
16. Oh, K.C.; Park, J.-M.; Shim, J.-S.; Kim, J.-H.; Kim, J.-E.; Kim, J.-H. Assessment of metal sleeve-free 3D-printedimplant surgical guides. Dent. Mater. 2019, 35, 468–476. [CrossRef] [PubMed]
17. Cole, D.; Bencharit, S.; Carrico, C.K.; Arias, A.; Tüfekçi, E. Evaluation of fit for 3D-printed retainers comparedwith thermoform retainers. Am. J. Orthod. Dentofac. Orthop. 2019, 155, 592–599. [CrossRef]
18. Gjelvold, B.; Mahmood, D.J.H.; Wennerberg, A. Accuracy of surgical guides from 2 different desktop 3Dprinters for computed tomography-guided surgery. J. Prosthet. Dent. 2019, 121, 498–503. [CrossRef]
19. Jeong, Y.-G.; Lee, W.-S.; Lee, K.-B. Accuracy evaluation of dental models manufactured by CAD/CAM millingmethod and 3D printing method. J. Adv. Prosthodont. 2018, 10, 245–251. [CrossRef]
20. Kim, R.J.-Y.; Benic, G.I.; Park, J.-M. Trueness of digital intraoral impression in reproducing multiple implantposition. PLoS ONE 2019, 14, e0222070. [CrossRef]
21. Braian, M.; Wennerberg, A. Trueness and precision of 5 intraoral scanners for scanning edentulous anddentate complete-arch mandibular casts: A comparative in vitro study. J. Prosthet. Dent. 2019, 122, 129–136.e2.[CrossRef] [PubMed]
22. Rodiger, M.; Heinitz, A.; Burgers, R.; Rinke, S. Fitting accuracy of zirconia single crowns produced via digitaland conventional impressions-a clinical comparative study. Clin. Oral. Investig. 2017, 21, 579–587. [CrossRef][PubMed]
23. Gjelvold, B.; Chrcanovic, B.R.; Korduner, E.K.; Collin-Bagewitz, I.; Kisch, J. Intraoral digital impressiontechnique compared to conventional impression technique. A randomized clinical trial. J. Prosthodont. 2016,25, 282–287. [CrossRef]
24. Chun, J.-h.; Tahk, J.; Chun, Y.; Park, J.-M.; Kim, M. Analysis on the Accuracy of Intraoral Scanners: The Effectsof Mandibular Anterior Interdental Space. Appl. Sci. 2017, 7, 719. [CrossRef]
25. Zimmermann, M.; Mehl, A.; Mormann, W.H.; Reich, S. Intraoral scanning systems—A current overview.Int. J. Comput. Dent. 2015, 18, 101–129. [PubMed]
26. Renne, W.; Ludlow, M.; Fryml, J.; Schurch, Z.; Mennito, A.; Kessler, R.; Lauer, A. Evaluation of the accuracyof 7 digital scanners: An in vitro analysis based on 3-dimensional comparisons. J. Prosthet. Dent. 2016, 118,36–42. [CrossRef]
27. Ender, A.; Attin, T.; Mehl, A. In vivo precision of conventional and digital methods of obtaining complete-archdental impressions. J. Prosthet. Dent. 2016, 115, 313–320. [CrossRef] [PubMed]
28. Kim, J.; Park, J.M.; Kim, M.; Heo, S.J.; Shin, I.H.; Kim, M. Comparison of experience curves between two3-dimensional intraoral scanners. J. Prosthet. Dent. 2016, 116, 221–230. [CrossRef]
29. Jin, S.-J.; Jeong, I.-D.; Kim, J.-H.; Kim, W.-C. Accuracy (trueness and precision) of dental models fabricatedusing additive manufacturing methods. Int. J. Comput. Dent. 2018, 21, 107–113.
30. Wesemann, C.; Muallah, J.; Mah, J.; Bumann, A. Accuracy and efficiency of full-arch digitalization and3D printing: A comparison between desktop model scanners, an intraoral scanner, a CBCT model scan,and stereolithographic 3D printing. Quintessence Int. 2017, 48, 41–50.
31. Park, G.-S.; Kim, S.-K.; Heo, S.-J.; Koak, J.-Y.; Seo, D.-G. Effects of Printing Parameters on the Fit ofImplant-Supported 3D Printing Resin Prosthetics. Materials 2019, 12, 2533. [CrossRef] [PubMed]
32. Kim, S.Y.; Shin, Y.S.; Jung, H.D.; Hwang, C.J.; Baik, H.S.; Cha, J.Y. Precision and trueness of dental modelsmanufactured with different 3-dimensional printing techniques. Am. J. Orthod. Dentofac. Orthop. 2018, 153,144–153. [CrossRef] [PubMed]
33. Rehmann, P.; Sichwardt, V.; Wöstmann, B. Intraoral Scanning Systems: Need for Maintenance. Int. J.Prosthodont. 2017, 30, 27–29. [CrossRef] [PubMed]
34. Lee, J.-H.; Yun, J.-H.; Han, J.-S.; Yeo, I.-S.L.; Yoon, H.-I. Repeatability of Intraoral Scanners for Complete ArchScan of Partially Edentulous Dentitions: An In Vitro Study. J. Clin. Med. 2019, 8, 1187. [CrossRef] [PubMed]
35. Botsch, M.; Kobbelt, L.; Pauly, M.; Alliez, P.; Lévy, B. Polygon Mesh Processing; CRC Press: Boca Raton, FL,USA, 2010.

Materials 2020, 13, 4419 16 of 16
36. Ender, A.; Zimmermann, M.; Attin, T.; Mehl, A. In vivo precision of conventional and digital methods forobtaining quadrant dental impressions. Clin. Oral Investig. 2016, 20, 1495–1504. [CrossRef] [PubMed]
37. Ender, A.; Mehl, A. Accuracy of complete-arch dental impressions: A new method of measuring truenessand precision. J. Prosthet. Dent. 2013, 109, 121–128. [CrossRef]
38. Wu, G.-H.; Hsu, S.-H. Review: Polymeric-Based 3D Printing for Tissue Engineering. J. Med. Biol. Eng. 2015,35, 285–292. [CrossRef]
39. Rebong, R.E.; Stewart, K.T.; Utreja, A.; Ghoneima, A.A. Accuracy of three-dimensional dental resin modelscreated by fused deposition modeling, stereolithography, and Polyjet prototype technologies: A comparativestudy. Angle Orthod. 2018, 88, 363–369. [CrossRef]
40. Park, M.-E.; Shin, S.-Y. Three-dimensional comparative study on the accuracy and reproducibility of dentalcasts fabricated by 3D printers. J. Prosthet. Dent. 2018, 119, 861.e1–861.e7. [CrossRef]
© 2020 by the authors. Licensee MDPI, Basel, Switzerland. This article is an open accessarticle distributed under the terms and conditions of the Creative Commons Attribution(CC BY) license (http://creativecommons.org/licenses/by/4.0/).