assessment of dairy waste treatment based · pdf file · 2016-10-20cheese, yogurt,...
TRANSCRIPT

http://www.iaeme.com/IJCIET/index.asp 368 [email protected]
International Journal of Civil Engineering and Technology (IJCIET) Volume 7, Issue 5, September-October 2016, pp. 368–381, Article ID: IJCIET_07_05_040
Available online at http://www.iaeme.com/IJCIET/issues.asp?JType=IJCIET&VType=7&IType=5
ISSN Print: 0976-6308 and ISSN Online: 0976-6316
© IAEME Publication
ASSESSMENT OF DAIRY WASTE TREATMENT
BASED ON SLUDGE VOLUME INDEX TECHNIQUE
Leena A.V
Research Scholar, CED, Karpagam University, Coimbatore, India.
Dr. N. Balasundaram
Professor, CED, Karpagam University, Coimbatore, India.
Dr. C. Meiaraj
Assistant Professor, CED, Government College of Technology, Coimbatore, India.
ABSTRACT
Unscientific and Improperly treated sewage and industrial waste disposals causes
environmental pollution. New technologies for modernity and change in life style of humans
attribute new industries for their easiness and comfortability on one side which results in highly
complicated and dangerous waste generation on the other side. Present study deals with the
industrial waste treatment. Dairy industry is one among the highly objectionable waste producing
sectors which increases the pollution rate of the total environment. Dairy industry consumes 2.5 to
4 litres of water per litre of milk process which comes out as waste water. Various studies revealed
that dairy waste water is diluted milk and it contains BOD, COD, TSS, Oil & Grease and
sometimes pH. So, treatment of dairy waste need special attention and adequate care is to be given
before its final discharge to water bodies or to land. This work is an assessment of the performance
of few dairies based on Sludge Volume Index whichhas been discussed and further scope of
research area has been identified.
Key words: Dairy, Efficiency, Effluent Treatment Plant, Settleablity, Sludge Volume Index.
Cite this Article: Leena A.V , Dr. N. Balasundaram, Dr. C. Meiaraj, Assessment of Dairy Waste
Treatment Based on Sludge Volume Index Technique. International Journal of Civil Engineering
and Technology, 7(5), 2016, pp.368 –381.
http://www.iaeme.com/IJCIET/issues.asp?JType=IJCIET&VType=7&IType=5
1. INTRODUCTION
Dairy industries are engaged in the manufacturing of various types of milk products such as milk, butter,
cheese, yogurt, condensed milk, flavoured milk, milk powder, ice cream, etc. A sequence of operations is
involved in dairy industry. Receiving and storing of raw materials, processing of raw materials into
finished products, packaging and storing of finished products and a group of other supplementary
operations are some of the operations performed in the dairy industries. Homogenization, standardization,
clarification, separation, and pasteurization are the common initial operations in most dairy plants.
Clarification and separation, generally, are accomplished by specially designed large centrifuges. Drying,
condensing, etc. are also used in dairy industries for the production of various products. The raw material

Leena A.V , Dr. N. Balasundaram, Dr. C. Meiaraj
http://www.iaeme.com/IJCIET/index.asp 369 [email protected]
input and final products manufactured determines the type and size of processes and equipments used. The
dairy industry is one among the most polluting industries, not only in terms of the volume of effluent
generated but also in terms of its characteristics as well. Reports reveal that the milk processing units
generates about 10 liters of effluent per liter of processed milk with an average generation of about 2.5
liters of wastewater per liter of the milk processed. In the dairy industry, majority of waste water generated
during cleaning operations especially between product changes when different types of products
are produced and some amount of wastewater gets generated during starting, equilibrating, stopping, and
rinsing of the processing units. Dairy processing effluents are generated in an intermittent way and the
flow rates of these effluents change significantly.
This paper deals with an evaluation study of various dairy waste treatment plants. Its performance was
evaluated based on the overall removal efficiency of various characteristics such as Total Suspended
Solids, Biochemical Oxygen Demand, Chemical Oxygen Demand, and Oil & Grease. The overall
performance of the Treatment Plant was also evaluated by considering Sludge Volume Index as tool.
Through the study, further possibilities for the improvement of the dairy waste treatment was sought to
make the final effluent and sludge disposal more environment friendly.
2. DAIRY INDUSTRY: OVER THE TIME
Traditionally, in the past, the complete milk production was done in the villages in India. Even today, a
large percentage of total milk supply in our country comes from cattle owners in village areas. The
marketing facilities did not exist in those days,for this reason they generally converted the surplus milk
into ghee and sold in the village or in the nearby small markets
India’s first five year plan in 1951 accelerated the modernization of the dairy industry in India. With an
objective of catering clean milk for the growing population in urban areas, the government organized milk
schemes for large cities as an initial action in this regard. The main objective of the scheme was to provide
proper arrangements for transmitting the milk produced in the rural areas to the dairy plants situated in
cities and distribution of processed milk to the consumers.
In India, the establishment of milk co-operatives is another feature of the modern dairy industry and it
is necessary for the successful functioning of economic enterprises in villages. The first co-operative dairy
society was established at Allahabad (U.P.) in 1913 and subsequently spread in different parts of our
country. Systematic break through could be noticed since 1946 when Kaira District Co-operative Milk
producers’ Union Limited (KDCMPUL) popularly known as ‘Amul Dairy’ which was set up at Anand in
the Gujarat state.
2.1. Dairy Technology
Milk treatment is necessary for milk processing and it is the preparation of raw milk including heat
treatment. The milk treatment is done in the preparation room and it is the first process in diary plant. The
processing of milk gives assurance for the quality in manufacturing and packing of diary based products
also on the basis of treated milk [4]. The diary industries have several production sectors and each sector
produces wastewater of a characteristic composition according to the product like milk, cheese, butter, and
milk powder.
2.2. Milk Processes
A great variety of operations are performed in the diary industries such as receiving and storing of raw
materials, processing of raw material into finished products, packing and storing of finished products and
other ancillary operations. The common initial operations in most plants and products are standardization,
homogenization, clarification, separation, and pasteurization. Specially designed large centrifuges are
generally used for the operations such as clarification and separation. The processes like drying and
condensing also used for the production of various products in diary industries [1].
Assessment of Dairy Waste Treatment Based on Sludge Volume Index Technique Aggregate
http://www.iaeme.com/IJCIET/index.asp 370 [email protected]
2.3. Water Consumption, Sources, and Generation of Waste Water
Basically, the range of heat treatments in a dairy determines the microbiological quality of milk. It affects
the usage of cooling water in heat exchangers and the consumption of cleaning water [7].
Dairy factories discharges huge amount of effluent from various processing units and cleaning, and the
ratio varies according to the type of product. The effluent discharge was often noticed as 85 – 90% of the
consumed water in the case of pasteurized milk, 90 – 95% for butter and cheese, for milk powder and
condensed milk it was more than 100%. Dairy waste contains milk solids entering from almost all of the
operations in dilute condition with varying concentration. Generally, the wastes generated from dairy
industry are as follows: • The washing and cleaning out of product remaining in equipments like tank, trucks and cans. 2. Spill out is
produced due to overflow, leaks, boiling over, freezing-on and careless handling.
• Losses during milk processing are (1) Sludge discharge from settling tank, (2) Discharges from bottles and
washers and (3) Splashing and container breakage in automatic packaging equipment.
• Detergents and other compounds are used in the washing and sanitizing solution [4], [6], [3].
2.4. Characteristics of the Effluent
The effluent characteristics of dairy industry can be determined by the parameters such as color,
temperature, DO, pH, COD, BOD, suspended solids, dissolved solids, sulphate, chlorides, oil and grease.
These parameters largely depend on the quantity of milk and milk products. Dairy wastes are usually white
in color. It is slightly alkaline in nature, but due to the fermentation of milk it becomes acidic and they
have high BOD level in all liquids. Due to the curd content in cheese waste there is significant quantity of
suspended matter found in dairy waste. High oxygen demand is arising due to the dairy waste pollution. As
a result of the decomposition of casein heavy black sludge and strong butyric acid odours are formed [8],
[1].
2.5. Methods of Treatment and Disposal
Proper management of dairy wastes plays an important role in protecting, preserving, and improving the
quality of surface and ground waters. The best management practices can prevent direct discharge of
wastewater and can enhance the operational efficiency of the dairy unit. The dairy waste can also be used
for beneficial purposes such as fertilizer, compost, or bedding. Agricultural Utilization Systems of
treatment and disposal effluents of dairy industry is one of the pioneer methods which include (a) Ridge
and furrow system, (b) Flood irrigation and (c) Spray irrigation.
All over the world various treatment methods and technologies developed in this sector. The treatment
of dairy effluents in India consists of Preliminary, Primary and Secondary treatment of effluents and which
became the conventional treatment units. Preliminary treatment involves removal of oil, grease and coarse
solids, Primary treatment involves dilution with water and anaerobic lagooning or aerated lagooning for a
shorter period unlike settling and digesting the sludge in usual waste treatment practice and the secondary
treatment consists of Oxidation ditch/ Aerated lagoon/ Anaerobic lagoon followed by stabilization pond
[5].
2.6. Effects of Effluents
The waste water generated from dairy industry contains huge amount of milk constituents like inorganic
salts, caseins, along with sanitizers and detergents used for washing. All these components will make
increase the BOD and COD levels higher than the specified limits in BIS for industrial effluent discharge.
So disposal of these wastes to river or land, without prior treatment cause serious problems to the
environment [4], [1].
Leena A.V , Dr. N. Balasundaram, Dr. C. Meiaraj
http://www.iaeme.com/IJCIET/index.asp 371 [email protected]
3. MATERIALS AND METHODS
3.1. Study Area
Initial Studies have been conducted on 4 Dairies in which one is at Karnataka and other three from Kerala.
As instructed by the Dairy authorities and as directed by the experts, it is unable to provide the name of the
Dairies along with the data. Instead, it was decided to provide the names of dairies as A, B, C and D. The
study was carried out in the period of January – December 2014. The Dairy selected for the study at
Karnataka has a processing capacity of about 7 Lakh Litres per day. The dairies selected from Kerala have
production capacity of 100,000, 1. 1, 25,000 and 50,000 liters per day respectively.
3.2. Methodology
Sampling of waste water was done before and after treatment as per Standard methods. All the samples
were analyzed for BOD, COD, Oil &Grease, and TSS in accordance with standard procedures [10]. Mixed
liquor suspended solids (MLSS) of influent and effluent of dairies were measured to determine Sludge
Volume Index (SVI). Fresh sample of mixed liquor used for the tests and was collected from the effluent
end of the aeration system, just upstream of the secondary clarifier. In SVI test; 1-liter graduated cylinder
for the MLSS settling test was used. The test results were tabulated for detailed analysis and
interpretations.
4. RESULTS AND DISCUSSIONS
The initial studies were conducted in the above four Dairies. Here the name of dairies is mentioned as
Dairy-A, Dairy-B, Dairy-C, and Dairy-D for the studies, which are not in order or sequence as mentioned
earlier.
Table 1 Details of water consumption and waste water Generation in Litres
Sl
No
Name of
Dairy
Capacity of
Dairy
Water
Consumption
Waste water
generated
Capacity of
ETP
1 Dairy - A 700000 1540000 1447600 1500000
2 Dairy - B 125000 312500 296875 300000
3 Dairy - C 100000 220000 208032 200000
4 Dairy - D 50000 125000 116250 100000
While going through the water consumption with respect to the capacity of dairy, Dairy - A and Dairy -
C consumes 2.20 times of dairy capacity whereas Dairy – B and Dairy – D‘s water demand seems to be as
2.50 times of dairy capacity. In the case of waste water generation Dairy – A generates 94% of its water
consumption while Dairy – B generates 95% of its water consumption. This is 94.6% and 93% for the case
of Dairy – C and Dairy – D respectively.
Assessment of Dairy Waste Treatment Based on Sludge Volume Index Technique
http://www.iaeme.com/IJCIET/index.asp
4.1. Effluent Treatment Plant
Figure 1
Figure 1 describes about the ETP of Dairy
Chamber, the Oil & Grease trap and the Equalization Tank are acting as the
After chemical dosing, the effluent is allowed to the Primary treatment including the primary settling. The
effluent is then passed to the anaerobic digester and to the aeration tank for further possibilities of settling.
The sludge from the primary settling tank, Digester, and the Aeration Tank are permitted to the sludge
drying bed. The units after the Primary treatment to the drying bed are to be considered as the secondary
treatment units. The decant unit, Pressure Filter an
units. Introduction of the tertiary units are seen as the main advantage of this ETP, which produce better
performance of the plant’s total performance.
Figure 2 provides the ETP of dairy
Tank are the preliminary treatment units. The Primary Aeration Tank and Secondary Aeration tanks
considered as the primary treatment units and the secondary treatment units are
sludge drying beds. The final effluent from the clarifier is used for gardening purpose or a land discharge.
The sludge from the secondary aeration tank is re
the waste to its maximum possible extent. The final sludge from the clarifier is transferred to the drying
bed to reduce its volume to the possible extent before disposing the same for land filling purposes. The
effluent collected through the under drains of the drying
tank.
The ETP for dairy –C and dairy
Assessment of Dairy Waste Treatment Based on Sludge Volume Index Technique
http://www.iaeme.com/IJCIET/index.asp 372
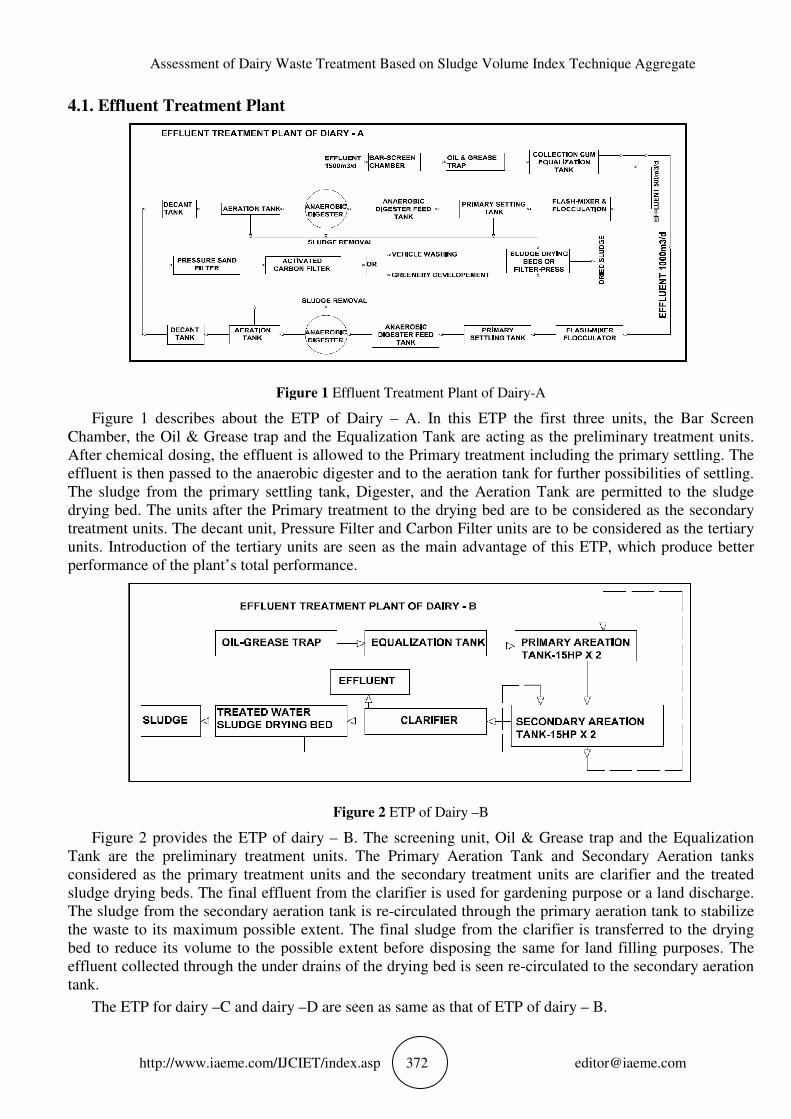
Figure 1 Effluent Treatment Plant of Dairy-A
Figure 1 describes about the ETP of Dairy – A. In this ETP the first three units, the Bar Screen
Chamber, the Oil & Grease trap and the Equalization Tank are acting as the
After chemical dosing, the effluent is allowed to the Primary treatment including the primary settling. The
effluent is then passed to the anaerobic digester and to the aeration tank for further possibilities of settling.
ludge from the primary settling tank, Digester, and the Aeration Tank are permitted to the sludge
drying bed. The units after the Primary treatment to the drying bed are to be considered as the secondary
treatment units. The decant unit, Pressure Filter and Carbon Filter units are to be considered as the tertiary
units. Introduction of the tertiary units are seen as the main advantage of this ETP, which produce better
performance of the plant’s total performance.
Figure 2 ETP of Dairy –B
e ETP of dairy – B. The screening unit, Oil & Grease trap and the Equalization
Tank are the preliminary treatment units. The Primary Aeration Tank and Secondary Aeration tanks
considered as the primary treatment units and the secondary treatment units are
sludge drying beds. The final effluent from the clarifier is used for gardening purpose or a land discharge.
The sludge from the secondary aeration tank is re-circulated through the primary aeration tank to stabilize
its maximum possible extent. The final sludge from the clarifier is transferred to the drying
bed to reduce its volume to the possible extent before disposing the same for land filling purposes. The
effluent collected through the under drains of the drying bed is seen re-circulated to the secondary aeration
C and dairy –D are seen as same as that of ETP of dairy
Assessment of Dairy Waste Treatment Based on Sludge Volume Index Technique Aggregate
A. In this ETP the first three units, the Bar Screen
Chamber, the Oil & Grease trap and the Equalization Tank are acting as the preliminary treatment units.
After chemical dosing, the effluent is allowed to the Primary treatment including the primary settling. The
effluent is then passed to the anaerobic digester and to the aeration tank for further possibilities of settling.
ludge from the primary settling tank, Digester, and the Aeration Tank are permitted to the sludge
drying bed. The units after the Primary treatment to the drying bed are to be considered as the secondary
d Carbon Filter units are to be considered as the tertiary
units. Introduction of the tertiary units are seen as the main advantage of this ETP, which produce better
B. The screening unit, Oil & Grease trap and the Equalization
Tank are the preliminary treatment units. The Primary Aeration Tank and Secondary Aeration tanks
considered as the primary treatment units and the secondary treatment units are clarifier and the treated
sludge drying beds. The final effluent from the clarifier is used for gardening purpose or a land discharge.
circulated through the primary aeration tank to stabilize
its maximum possible extent. The final sludge from the clarifier is transferred to the drying
bed to reduce its volume to the possible extent before disposing the same for land filling purposes. The
circulated to the secondary aeration
D are seen as same as that of ETP of dairy – B.

Leena A.V , Dr. N. Balasundaram, Dr. C. Meiaraj
http://www.iaeme.com/IJCIET/index.asp 373 [email protected]
Table 2 Effluents Discharge Standards
Sl No
Parameters
ISI Standards
Water Body Land
1 pH 5.5-9.0 5.5-9.0
2 BOD mg/L 30 100
3 COD mg/L 250 --
4 TSS mg/L 100 200
5 O & G mg/L 10 10
Table 3 says the characteristic of influent and effluent from Dairy – A. According to IS standard the
TSS concentration of effluent from dairies is limited to 100mg/L for discharge to water bodies and
200mg/L to land. Concentration of TSS in the effluent from dairy –A is found to be less than 100mg/L for
all months from January to December in 2014 and it is within the limit. The highest value for TSS found is
91mg/L in November. In the case of BOD the maximum allowable value of effluent discharge is 30mg/L
and 100mg/L for inland surface water and land irrigation respectively. Here, effluent from dairy – A, value
of BOD is found in between 300-400mg/L for every month in the year and proper treatment have to be
done for making the BOD level in the effluent to the permissible level. In the case of COD the maximum
allowable value of effluent discharge is 250mg/L for inland surface water and COD should be zero for land
irrigation. Value of COD is found in between 700-800mg/L in effluent from dairy –A for every month in
the year and more treatment required to make the effluent to the permissible level. The maximum value of
Oil & Grease content of effluent discharge is 10mg/L for both inland surface water and land irrigation. In
Dairy –A, it is greater than the permissible value in standard, so this require further treatment.
Table 3 Influent – Effluent Characteristics of Dairy- A
Inlet- Influent, Outlet- Effluent, TSS, BOD,COD and O&G in mg/L and SVI in mL/g
Characteristics of Dairy-A
Date TSS BOD COD O & G SVI
Inlet Outlet Inlet Outlet Inlet Outlet Inlet Outlet Inlet Outlet
Jan-14 301 83 1560 350 3368 747 236 41 1200 210
Feb-14 302 85 1511 340 3400 800 240 42 1080 206
Mar-14 310 86 1571 342 3406 788 245 45 1020 198
Apr-14 311 87 1567 353 3401 789 250 46 980 172
May-14 306 84 1516 311 3398 752 249 43 690 135
Jun-14 295 72 1561 349 3393 728 241 43 984 169
Jul-14 293 70 1546 309 3361 733 240 40 1016 218
Aug-14 300 75 1552 352 3370 738 238 35 1120 224
Sep-14 302 88 1548 311 3381 724 232 32 1096 202
Oct-14 301 89 1597 356 3396 773 240 42 992 196
Nov-14 305 91 1560 353 3432 755 241 43 1025 190
Dec-14 299 68 1564 355 3440 762 249 40 1184 214

Assessment of Dairy Waste Treatment Based on Sludge Volume Index Technique Aggregate
http://www.iaeme.com/IJCIET/index.asp 374 [email protected]
Table 4 Influent – Effluent Characteristics of Dairy- B
Inlet- Influent, Outlet- Effluent, TSS, BOD,COD and O&G in mg/l and SVI in ml/g
Characteristicts of Dairy-B
TSS BOD COD O & G SVI
Date Inlet Outlet Inlet Outlet Inlet Outlet Inlet Outlet Inlet Outlet
Jan-14 353 176 1857 526 5253 1317 404 155 1440 370
Feb-14 354 149 1788 482 5307 1417 413 127 1296 347
Mar-14 365 135 1872 469 5316 1382 425 117 1524 387
Apr-14 365 182 1867 530 5309 1428 435 165 1476 384
May-14 359 177 1794 470 5303 1366 433 160 1828 452
Jun-14 344 131 1858 495 5295 1297 414 128 1580 412
Jul-14 340 113 1837 424 5242 1249 413 107 1619 432
Aug-14 351 165 1845 528 5257 1301 408 140 1344 456
Sep-14 354 183 1839 470 5275 1321 396 134 1315 392
Oct-14 353 155 1909 505 5301 1330 414 126 1490 385
Nov-14 359 141 1856 485 5360 1284 416 113 1430 408
Dec-14 349 155 1862 532 5373 1341 433 153 1420 394
Table 4 says the characteristic of influent and effluent from Dairy – B. Concentration of TSS in the
effluent from dairy –B is found in between 100 -200 mg/L for all months and it is greater than the
permissible value (100mg/L) for discharging into water body and it is within the limit for land disposal (
200mg/L). So it needs further treatment for discharging in to water bodies. In the case of BOD the
maximum allowable value of effluent discharge is 30mg/L and 100mg/L for inland surface water and land
irrigation respectively. Here, effluent from dairy – B, value of BOD is found to be greater than 400mg/L in
every month in the year and further treatment is required for making the BOD level of the effluent to the
permissible level. The value of COD is found in the range of 1000mg/L for every month and it is very
much greater than the allowable value. So it cannot discharge to environment without further treatment. In
Dairy –B value of Oil & Grease content is greater than the standard value (10 mg/L) of effluent discharge
to the environment, so this require further treatment.
Table 5 Influent – Effluent Characteristics of Dairy- C
Inlet- Influent, Outlet- Effluent, TSS, BOD,COD and O&G in mg/L and SVI in mL/g
Characteristics of Dairy-C
TSS BOD COD O & G SVI
Date Inlet Outlet Inlet Outlet Inlet Outlet Inlet Outlet Inlet Outlet
Jan-14 335 182 1755 484 4210 1055 364 154 1390 295
Feb-14 336 169 1700 458 4250 1138 369 140 1216 272
Mar-14 345 143 1768 433 4257 1096 378 117 1276 246
Apr-14 345 158 1763 460 4252 1111 385 133 1326 282
May-14 340 183 1705 440 4248 1092 383 157 1278 285
Jun-14 328 155 1756 468 4241 1048 370 141 1200 299
Jul-14 325 126 1739 396 4202 996 369 110 1271 268
Aug-14 334 145 1746 458 4213 1016 366 116 1294 262
Sep-14 336 187 1741 440 4226 1058 358 140 1265 250

Leena A.V , Dr. N. Balasundaram, Dr. C. Meiaraj
http://www.iaeme.com/IJCIET/index.asp 375 [email protected]
Oct-14 335 174 1797 476 4246 1073 370 139 1210 262
Nov-14 340 148 1755 446 4290 1023 371 114 1382 320
Dec-14 332 137 1759 461 4300 1046 384 125 1370 264
The characteristic of influent and effluent from Dairy – C is depicted through Table 5. TSS
Concentration in the effluent from dairy –C also found in between 100 -200 mg/L as dairy –B from
January to December and it is greater than the permissible value (100mg/L) in the case of discharging to
water bodies. So it needs further treatment for disposing to the inland surface water. For land disposal TSS
is within the permissible limit. In the case of BOD the maximum allowable value of effluent discharge is
30mg/L and 100mg/L for inland surface water and land irrigation respectively. Here, effluent from dairy –
C, value of BOD is found much greater than the permissible value in every month in the year and further
treatment is required for making the BOD level in the effluent to the permissible level. In the effluent from
dairy –C also the value of COD is found near 1000mg/L for every month and it is very much greater than
the limited value. For this reason, it cannot discharge to environment without further treatment. The value
of Oil & Grease content of effluent discharge from this dairy is in the range of hundreds which is greater
than maximum allowable value 10mg/L, so this require further treatment for discharging to both water and
land.
Table 6 Influent – Effluent Characteristics of Dairy- D
Inlet- Influent, Outlet- Effluent, TSS, BOD,COD and O&G in mg/L and SVI in mL/g
Characteristicts of Dairy-D
TSS BOD COD O & G SVI
Date Inlet Outlet Inlet Outlet Inlet Outlet Inlet Outlet Inlet Outlet
Jan-14 349 159 1791 466 4296 1048 372 129 1380 302
Feb-14 350 146 1735 439 4337 1133 377 115 1242 257
Mar-14 360 125 1805 419 4344 1096 386 97 1173 228
Apr-14 360 139 1799 446 4339 1110 393 112 1127 298
May-14 355 148 1740 409 4335 1074 391 120 794 255
Jun-14 342 147 1792 465 4328 1056 378 131 1132 294
Jul-14 339 130 1775 404 4288 1016 377 112 1168 251
Aug-14 348 113 1782 431 4299 1000 374 82 1288 258
Sep-14 350 140 1777 397 4313 1027 366 91 1260 232
Oct-14 349 155 1834 461 4333 1070 378 117 1141 225
Nov-14 355 144 1791 446 4378 1034 379 107 1179 219
Dec-14 346 130 1795 459 4388 1056 392 116 1362 246
In Table 6, the characteristic of influent and effluent from Dairy – D is tabulated. The effluent from
dairy –D also have TSS Concentration in between 100 -200 mg/L as dairy –B and dairy –C in the whole
year and it is greater than the permissible value (100mg/L) for water bodies and it is within the limit for
land disposal ( 200mg/L). As this reason it needs further treatment for disposing to the inland surface
water. While taking the parameter BOD, in dairy- D, its value is greater than 400mg/L in most of the
months and that is much greater than the permissible values for discharging to environment. Regarding the
COD, the value is found much greater than the permissible limit insisted by the Environmental Protection
rules 1986. As this reason, it cannot discharge to environment without further treatment. The value of Oil
& Grease content of effluent discharge from the dairy -D is much greater than the maximum allowable
value 10mg/L. In view of this, it requires further treatment for discharging to water body or to land.

Assessment of Dairy Waste Treatment Based on Sludge Volume Index Technique
http://www.iaeme.com/IJCIET/index.asp
Further, a comparison among the four dairy ETPs based on the removal efficiency of the TSS has been
carried out.
Figure
A comparison study of the total suspended solids (TSS) removal efficiency of the treatment plants is
depicted through Figure 3. ETP of dairy has given much better performance than other ETPs. About 70%
of TSS removal efficiency was achieved through the ETP of dairy
performance of the ETP. Regarding the ETPs of the other dairies much fluctuation are seen in the TSS
removal efficiency on a month wise analysis. This indicates that
Performance of the ETP of dairy –
About the overall efficiency of the plants also, ETP of Dairy
comparison of efficiencies of ETPs of these plants is depicted through Figure 4. Here, ETP of Dairy
possessing a status of an average efficiency of 77%, the performance of Dairy
with a status of an average efficiency of 72% and Dairy
efficiency of 68%. Dairy-C could satisfy with the fourth position only for an average efficiency of 66%.
This indicates that the performance of all the four ETPs is not upto the standard. Considering the
concentration of the influent characteristics of dairy waste treatment plants a minimum of 95% of the
removal efficiency is essentially required to bring the final effluent to the standards for discharging to the
environment. In view of the results achieved there are poss
dairy –A, for which certain additional treatment methodologies can be adopted. But in the case of other
dairies a total improvement in all units are seen required.
Assessment of Dairy Waste Treatment Based on Sludge Volume Index Technique
http://www.iaeme.com/IJCIET/index.asp 376
Further, a comparison among the four dairy ETPs based on the removal efficiency of the TSS has been
ure 3 Comparison of TSS Removal Efficiency
A comparison study of the total suspended solids (TSS) removal efficiency of the treatment plants is
depicted through Figure 3. ETP of dairy has given much better performance than other ETPs. About 70%
efficiency was achieved through the ETP of dairy-A and also a consistency is seen in the
performance of the ETP. Regarding the ETPs of the other dairies much fluctuation are seen in the TSS
removal efficiency on a month wise analysis. This indicates that flow to these ETPs may not be uniform.
–C is seen as very poor compared to others.
Figure 4 Overall Efficiency
About the overall efficiency of the plants also, ETP of Dairy –A shows the highest performance and
fficiencies of ETPs of these plants is depicted through Figure 4. Here, ETP of Dairy
possessing a status of an average efficiency of 77%, the performance of Dairy-
with a status of an average efficiency of 72% and Dairy-B holds the third position with an average
C could satisfy with the fourth position only for an average efficiency of 66%.
This indicates that the performance of all the four ETPs is not upto the standard. Considering the
the influent characteristics of dairy waste treatment plants a minimum of 95% of the
removal efficiency is essentially required to bring the final effluent to the standards for discharging to the
environment. In view of the results achieved there are possibilities for further improvement in the ETP of
A, for which certain additional treatment methodologies can be adopted. But in the case of other
dairies a total improvement in all units are seen required.
Assessment of Dairy Waste Treatment Based on Sludge Volume Index Technique Aggregate
Further, a comparison among the four dairy ETPs based on the removal efficiency of the TSS has been
A comparison study of the total suspended solids (TSS) removal efficiency of the treatment plants is
depicted through Figure 3. ETP of dairy has given much better performance than other ETPs. About 70%
A and also a consistency is seen in the
performance of the ETP. Regarding the ETPs of the other dairies much fluctuation are seen in the TSS
flow to these ETPs may not be uniform.
A shows the highest performance and
fficiencies of ETPs of these plants is depicted through Figure 4. Here, ETP of Dairy-A
-D holds the second position
the third position with an average
C could satisfy with the fourth position only for an average efficiency of 66%.
This indicates that the performance of all the four ETPs is not upto the standard. Considering the
the influent characteristics of dairy waste treatment plants a minimum of 95% of the
removal efficiency is essentially required to bring the final effluent to the standards for discharging to the
ibilities for further improvement in the ETP of
A, for which certain additional treatment methodologies can be adopted. But in the case of other

Leena A.V , Dr. N. Balasundaram, Dr. C. Meiaraj
http://www.iaeme.com/IJCIET/index.asp 377 [email protected]
4.2. Computation of Sludge Volume Index (SVI)
Sludge Volume Index (SVI) is an extremely useful parameter in analysis of wastewater treatment process
[8]. SVI is the result of a mathematical calculation which considers the results of 30-minute settle ability
test and the activated sludge mixed liquor suspended solids (MLSS) test. SVI number gives more accurate
sludge settling characteristics.
The changes taking place in an activated sludge treatment process can be monitored by SVI. Operators
can prevent problems by utilizing SVI data over a period of time. SVI determined during the waste water
treatment process when running at optimum should be used as a benchmark.
SVI (mL/g) = (Settled Sludge Volume (mL/L) X 1000) / Mixed Liquor Suspended Solids (g/L)
The SVI’s of influent and effluent of all the Dairies under study is provided in the Table 9. SVI of the
influent of Dairy A is in the range of 690 to 1200 and for the effluent the SVI was noticed as 135 to 224.
Based on the literature, if SVI is 250 mL/g or higher the sludge settles very slowly and compacts poorly in
the settleability test [9]. In the case of Influent, the SVI is greater than 250 and it indicates that the MLSS
status will be light and fluffy, not as very dense. While the effluent gives the SVI values are below 250.
The values indicate that the sludge typically settles more slowly and traps more particulate matter as it
forms a uniform blanket before settling. According to the literature, the microscopic examination of this
MLSS would show an irregularly shaped floc particle with some filaments forming a backbone for floc-
forming bacteria to attach and colonize [9].
Table 7 Sludge Volume Index (SVI) of the Influent and Effluent
Dairy-A Dairy-B Dairy-C Dairy-D
Date Inlet Outlet Inlet Outlet Inlet Outlet Inlet Outlet
Jan-14 1200 210 1440 370 1390 295 1380 302
Feb-14 1080 206 1296 347 1216 272 1242 257
Mar-14 1020 198 1524 387 1276 246 1173 228
Apr-14 980 172 1476 384 1326 282 1127 298
May-14 690 135 1828 452 1278 285 794 255
Jun-14 984 169 1580 412 1200 299 1132 294
Jul-14 1016 218 1619 432 1271 268 1168 251
Aug-14 1120 224 1344 456 1294 262 1288 258
Sep-14 1096 202 1315 392 1265 250 1260 232
Oct-14 992 196 1490 385 1210 262 1141 225
Nov-14 1025 190 1430 408 1382 320 1179 219
Dec-14 1184 214 1420 394 1370 264 1362 246
To know the consistency of the treatments the Influent- Effluent relationship was studied with the SVI
using regression analysis. The relationship is depicted through the figure 5 and found that the ‘r’ value is
0.86698, and the Coefficient of determination ‘r2’was found as 0.752. The value reveals that the treatment
is uniform and has consistancy which maintained with the influent-effluent relationships. The relationship
was found as linear (Y =a+bX) with ‘a’ the ‘Y’intercept as 2.29 and the ‘b’ slope as 0.166.

Assessment of Dairy Waste Treatment Based on Sludge Volume Index Technique Aggregate
http://www.iaeme.com/IJCIET/index.asp 378 [email protected]
Figure 5 Sludge Volume Index in ml/g of Dairy – A
SVI of the influent of Dairy B is in the range of 1296 to 1828 and for the effluent the SVI was noticed
as 370 to 456. Here, the SVI is greater than 250, which indicates that the MLSS status will be light and
fluffy, not as very dense. This is the case for both influent and effluent. As the SVI is poor, it is advised to
take urgent actions to improve the treatment unit’s efficiency or the ETP as such is to be improved. A high
SVI may also indicate filamentous sludge bulking. In this case, a microscopic examination is
recommended and might show light floc particles that contain long filaments extending out of the particle
and touching filaments from other particles. The filaments may be contained within the floc, causing a
dispersed, open floc structure. In these cases, the liquid above the sludge blanket is usually very clear. The
sludge can sit in the settleability test container for long periods and settle very little, or not at all.
The Influent- Effluent relationship which is studied with the SVI using regression analysis is depicted
in figure 6 to know the consistency of the treatments. It is found that the ‘r’ value is 0.52748, and the
Coefficient of determination ‘r2’value was 0.278. Even though the ‘r’ value found to be as greater than
0.50, the ‘r2’ do not provide a hopeful result. The value reveals that the treatment is not uniform and the
influent-effluent relationship is not strong enough. The relationship was found as linear (Y =a+bX) with
‘a’ the ‘Y’intercpt as 23.10 and the ‘b’the slope as 0.116.
Figure 6 Sludge Volume Index in ml/g of Dairy - B
SVI of the influent of Dairy C is in the range of 1200 to 1390 and for the effluent the SVI was observed
as 246 to 320. As the SVI is about 250 mL/g and higher the sludge settles very slowly and compacts poorly
in the settleability test. In the case of Influent, the SVI is greater than 250 and it indicates that the MLSS
status will be light and fluffy, not as very dense. While the effluent gives the SVI values are about 250 and

Leena A.V , Dr. N. Balasundaram, Dr. C. Meiaraj
http://www.iaeme.com/IJCIET/index.asp 379 [email protected]
above, attention is to be given to the treatment side to bring the performance of the units of the palnt to
bring down the SVI to the maximum possible.
The Influent- Effluent relationship is depicted through the figure 7 to know the consistency of the
treatments with the SVI using regression analysis and found that the ‘r’ value is 0.35923, and the
Coefficient of determination ‘r2’was found as 0.067. The value reveals that the treatment is not uniform
and has no consistency with poor relationships between the influent and effluent. The existing relationship
was found as linear (Y =a+bX) with ‘a’ the ‘Y’intercept as 12.30 and the ‘b’ slope as 0.118. Adequate
attention is required to improve the efficiency and performance of the ETP.
Figure 7 Sludge Volume Index in ml/g of Dairy – C
In the case of the Dairy D, the SVI of the influent is in the range of 794 to 1380 and that for the
effluent was 219 to 302. Even though the influent SVI seems to be as very poor, that for the effluent is
about 250, for which the sludge settles very slowly and compacts poorly in the settleability test. In the case
of Influent, the SVI is greater than 250 and it indicates that the MLSS status will be light and fluffy, not as
very dense. While the effluent gives the SVI values which are below and about 250. The values indicate
that the sludge typically settles more slowly and traps more particulate matter as it forms a uniform blanket
before settling. In this case also on the microscopic examination of this MLSS would show an irregularly
shaped floc particle with some filaments forming a backbone for floc-forming bacteria to attach and
colonize.
Figure 8 Sludge Volume Index in ml/g of Dairy – D
Further, to know the consistency of the treatments the Influent- Effluent relationship was studied with
the SVI using regression analysis. The relationship is depicted through the figure 8 and found that the ‘r’
value is 0.07581, and the Coefficient of determination ‘r2’was found as 0.00575. The value reveals that the

Assessment of Dairy Waste Treatment Based on Sludge Volume Index Technique Aggregate
http://www.iaeme.com/IJCIET/index.asp 380 [email protected]
treatment is not at all uniform and has no consistency and no relationship is seen maintained between the
influent and effluent. On the assessment for the linear relationship it was found as linear (Y =a+bX) with
‘a’ the ‘Y’ intercept as 23.80 and the ‘b’ the slope as 0.0145. This reveals that the plant as such is to be
renovated and a uniform flow is to be maintained.
As the evaluation of the selected Plants is described in detail as above, it is now concluded below for
further studies.
5. CONCLUSIONS AND SCOPE OF FURTHER STUDIES
• Dairy A and Dairy C consume 2.20 liters of water per liter of Milk while Dairy B and Dairy D consume 2.50
litres of water per liter of Milk. Regarding the Consumption of Water, this is within the average of the water
requirement noticed by various researchers for the Dairy industry.
• The waste water produced from Dairy D is noted as the minimum, 93% of the consumed water. Dairy A
generates about 94% waste water against its water consumption and that for Dairy B is 95% and 94.6% for
Dairy C.
• Effluent Treatment Plants of Dairies C and D are seen overloaded than its installed capacities.
• TSS values of the effluent of Dairy A are seen with in the permissible level and all the other parameters are
beyond the admissible level. For other Dairies all the effluent parameters are seen as beyond the permissible
levels.
• The overall efficiency of the ETP of Dairy A was found as 77% and that for other dairies found as 68% for
Dairy B, 66% for Dairy C and 72% for Dairy D. Consistency in performance was seen in Dairy A whereas
other Dairies’ efficiency was seen fluctuating.
• As SVI is an indicator of settleability of suspended solids, none of the treatment plant was able to produce
good results. But Dairy A provides a strong relationship between its Influent- Effluent SVI values in a
month wise analysis.
• The Influent- Effluent SVI relationship found as linear and its coefficient of determination found as 0.752,
further studies are possible to improve the standards of the effluent characteristics of Dairy A.
REFERENCE
[1] A.S. Kolhe et.al; “Effluent of Dairy Technology”, International Research Journal, ISSN-0974-2832 Vol.
II, Issue-5 (Nov.08-Jan.09)
[2] Ajim S. Sutar et.al; “Effluent Treatment Plant of Dairy Wastewater – A Performance Evaluation”,
International Research Journal of Engineering and Technology e-ISSN: 2395 -0056 Volume: 02 Issue:
08 | Nov-2015
[3] Bharati S. Shete and N. P. Shinkar, “Comparative Study of Various Treatments for Dairy
Industry Wastewater”, IOSR Journal of Engineering (IOSRJEN) e-ISSN: Vol. 3, Issue 8
(August. 2013), ||V4|| PP 42-47
[4] Rodhan Abdullah Salih, Evaluation of the Drinking Water Quality and the Efficiency of Al-
Hawija Water Treatment Plant: A Case Study in Iraq. International Journal of Civil
Engineering and Technology (IJCIET), 5(6),2014, pp.37–57.
[5] Bharati S. Shete and N. P. Shinkar, “Dairy Industry Wastewater Sources, Characteristics & its Effects on
Environment”, International Journal of Current Engineering and Technology, Vol.3, No.5 (December
2013)
[6] BIS, Indian Standard 8682- 1977, Guide for Treatment and Disposal of Effluents of Dairy
Industry, Third Reprint August 1998)

Leena A.V , Dr. N. Balasundaram, Dr. C. Meiaraj
http://www.iaeme.com/IJCIET/index.asp 381 [email protected]
[7] Dipali H. Chaiudhari and R.M. Dhoble, “Performance Evaluation of Effluent Treatment Plant
of Dairy Industry”, Current World Environment Vol. 5(2), 373-378 (2010)
[8] Mostafa. H. and Aly. O.H.I., Comparison between Rapid Sand Filter and Dyna Sand Filter in
Wastewater Tertiary Treatment. International Journal of Civil Engineering and Technology
(IJCIET), 4(6),2014, pp.230–238.
[9] JanuszWojdalski et.al; “Determinants of water consumption in the dairy industry”,Polish
Journal of Chemical Technology, 15, 2, 61 —72,10.2478/project-2013.- 0025 8
[10] Swati A.Patilet.al;“Dairy Wastewater-A Case Study”, International Journal of Research in Engineering
and Technology, Volume: 03 Issue: 09 | Sep-2014 10
[11] W. Janczukowicz et.al, Settling Properties of Activated Sludge from a Sequencing Batch
Reactor (SBR), Polish Journal of Environmental Studies,Vol. 10, No. 1 (2001), 15-20 11
[12] APHA, American Public Health Association (APHA), 1985, Standard Methods for the
Examination of Water and Waste Water, Washington, 20th
edition. 12.