assessment of deposition rate in mig welding of … · assessment of deposition rate in mig welding...
TRANSCRIPT
IJSRD - International Journal for Scientific Research & Development| Vol. 3, Issue 03, 2015 | ISSN (online): 2321-0613
All rights reserved by www.ijsrd.com 2011
Assessment of Deposition Rate in MIG Welding of Metal, Research Paper
Gaurang R. Patel1 Prof. B. D. Patel
2
1ME Student
2Assistant Professor
1,2Department of Mechanical Engineering 1,2
Ahmedabad Institute of Technology
Abstract— Metal inert gas arc welding (MIG) is preferable
more its inherent qualities like easy control of variables,
high quality, deep penetration, smooth finish. The quality of
weld depends on metal deposition rate which in turn
depends on the process parameters. In this present work, the
effect of Taguchi Methodology approach for experimental
investigation of metal inert gas arc welding parameters
welding current, welding voltage and wire feed speed on
metal deposition rate has been studied.
Key words: Taguchi Method and Orthogonal Array
I. INTRODUCTION
Gas metal arc welding (GMAW), sometimes referred to by
its subtypes metal inert gas (MIG) welding or metal active
gas (MAG) welding, is a welding process in which an
electric arc forms between a consumable wire electrode and
the work piece metal(s), which heats the work piece
metal(s), causing them to melt, and join. Along with the
wire electrode, a shielding gas feeds through the welding
gun, which shields the process from contaminants in the air.
The process can be semi-automatic or automatic. A constant
voltage, direct current power source is most commonly used
with GMAW, but constant current systems, as well as
alternating current, can be used. There are four primary
methods of metal transfer in GMAW, called globular, short-
circuiting, spray, and pulsed-spray, each of which has
distinct properties and corresponding advantages and
limitations [1].
Today, GMAW is the most common industrial
welding process, preferred for its versatility, speed and the
relative ease of adapting the process to robotic automation.
Unlike welding processes that do not employ a shielding
gas, such as shielded metal arc welding, it is rarely used
outdoors or in other areas of air volatility. A related process,
flux cored arc welding, often does not use a shielding gas,
but instead employs an electrode wire that is hollow and
filled with flux [2].
To perform gas metal arc welding, the basic
necessary equipment is a welding gun, a wire feed unit, a
welding power supply, an electrode wire, and a shielding
gas supply.
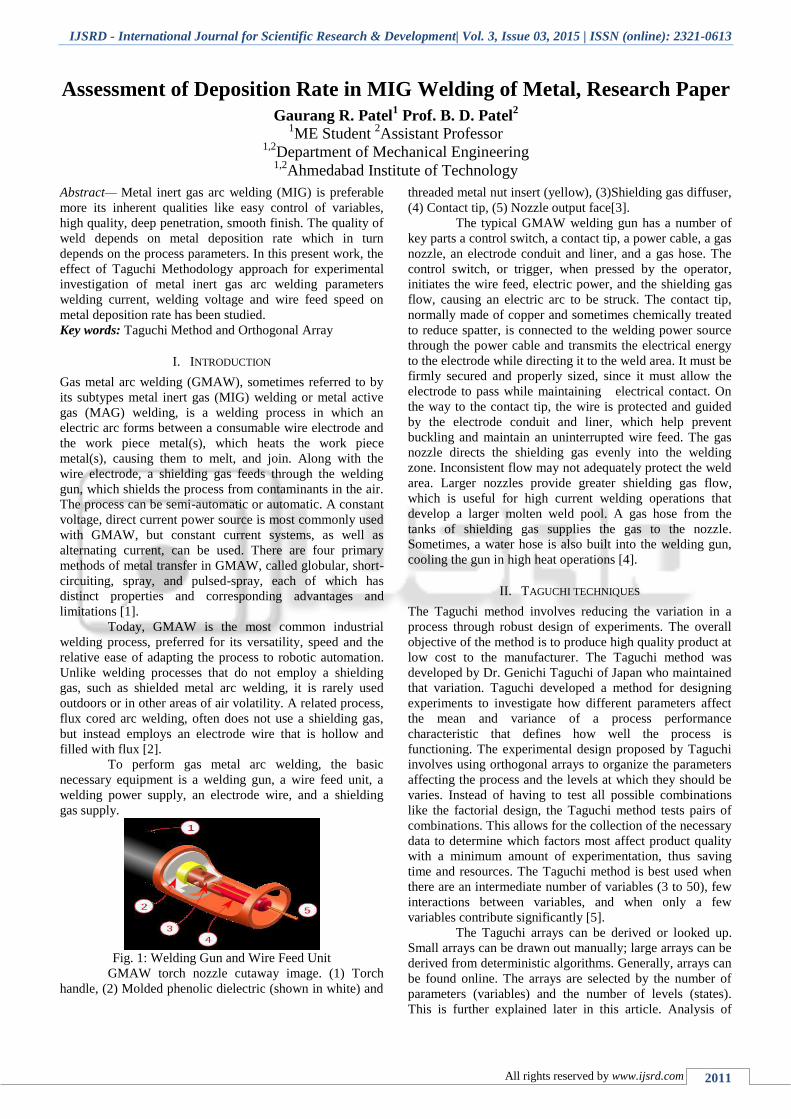
Fig. 1: Welding Gun and Wire Feed Unit
GMAW torch nozzle cutaway image. (1) Torch
handle, (2) Molded phenolic dielectric (shown in white) and
threaded metal nut insert (yellow), (3)Shielding gas diffuser,
(4) Contact tip, (5) Nozzle output face[3].
The typical GMAW welding gun has a number of
key parts a control switch, a contact tip, a power cable, a gas
nozzle, an electrode conduit and liner, and a gas hose. The
control switch, or trigger, when pressed by the operator,
initiates the wire feed, electric power, and the shielding gas
flow, causing an electric arc to be struck. The contact tip,
normally made of copper and sometimes chemically treated
to reduce spatter, is connected to the welding power source
through the power cable and transmits the electrical energy
to the electrode while directing it to the weld area. It must be
firmly secured and properly sized, since it must allow the
electrode to pass while maintaining electrical contact. On
the way to the contact tip, the wire is protected and guided
by the electrode conduit and liner, which help prevent
buckling and maintain an uninterrupted wire feed. The gas
nozzle directs the shielding gas evenly into the welding
zone. Inconsistent flow may not adequately protect the weld
area. Larger nozzles provide greater shielding gas flow,
which is useful for high current welding operations that
develop a larger molten weld pool. A gas hose from the
tanks of shielding gas supplies the gas to the nozzle.
Sometimes, a water hose is also built into the welding gun,
cooling the gun in high heat operations [4].
II. TAGUCHI TECHNIQUES
The Taguchi method involves reducing the variation in a
process through robust design of experiments. The overall
objective of the method is to produce high quality product at
low cost to the manufacturer. The Taguchi method was
developed by Dr. Genichi Taguchi of Japan who maintained
that variation. Taguchi developed a method for designing
experiments to investigate how different parameters affect
the mean and variance of a process performance
characteristic that defines how well the process is
functioning. The experimental design proposed by Taguchi
involves using orthogonal arrays to organize the parameters
affecting the process and the levels at which they should be
varies. Instead of having to test all possible combinations
like the factorial design, the Taguchi method tests pairs of
combinations. This allows for the collection of the necessary
data to determine which factors most affect product quality
with a minimum amount of experimentation, thus saving
time and resources. The Taguchi method is best used when
there are an intermediate number of variables (3 to 50), few
interactions between variables, and when only a few
variables contribute significantly [5].
The Taguchi arrays can be derived or looked up.
Small arrays can be drawn out manually; large arrays can be
derived from deterministic algorithms. Generally, arrays can
be found online. The arrays are selected by the number of
parameters (variables) and the number of levels (states).
This is further explained later in this article. Analysis of

Assessment of Deposition Rate in MIG Welding of Metal, Research Paper
(IJSRD/Vol. 3/Issue 03/2015/500)
All rights reserved by www.ijsrd.com 2012
variance on the collected data from the Taguchi design of
experiments can be used to select new parameter values to
optimize the performance characteristic. The data from the
arrays can be analyzed by plotting the data and performing a
visual analysis, ANOVA, bin yield and Fisher's exact test, or
Chi-squared test to test significance [5].
III. ANOVA
The ANOVA was used to investigate which design
parameters significantly affect the quality characteristic. The
ANOVA is performed by separating the total variability of
the S/N ratios into contributions by each of the design
parameters and the errors. The total variability of S/N ratio
is measured by the sum of the squared deviations from the
total mean S/N ratio [6].
IV. MATERIAL AND EXPERIMENTAL SETUP
Fig .2: GMAW Circuit Diagram (1) Welding Torch, (2)
Work Piece (3) Power Source, (4) Wire Feed Unit, (5)
Electrode Source,(6) Shielding Gas Supply.
Shielding gases are necessary for gas metal arc
welding to protect the welding area from atmospheric gases
such as nitrogen and oxygen, which can cause fusion
defects, porosity, and weld metal embrittlement if they come
in contact with the electrode, the arc, or the welding metal.
This problem is common to all arc welding processes; for
example, in the older Shielded-Metal Arc Welding process
(SMAW), the electrode is coated with a solid flux which
evolves a protective cloud of carbon dioxide when melted
by the arc. In GMAW, however, the electrode wire does not
have a flux coating, and a separate shielding gas is
employed to protect the weld. This eliminates slag, the hard
residue from the flux that builds up after welding and must
be chipped off to reveal the completed weld [7 & 8].
%ag
e C Mn S P Si Al Cr
Base
Plate
0.15
0
0.82
0
0.0.1
0
0.01
1
0.15
0
0.03
0
0.01
0
Table 1: Chemical Compositions of the MILD STEEL
BASE PLATE
%age C Si Mn P S Cu
Electrode
Wire
0.06
–
0.15
0.80
–
1.15
1.40
–
1.85
0.025
max
0.035
max
0.50
max
Table 2: Chemical Compositions of the Electrode Wire
ER70S-6
Fig. 3: MIG Welding Machine
In my experimental DOE method selected 3 levels
of each input process parameters.
Symbol Control unit factors Unit Low High
P Power Kilo Watt 2 6
F Feed rate mm/sec 3 7
Α Orientation Angle Degree 30 90
P Gas Pressure Bar 10 40
Table 3: Process Input Parameters and Their Levels
V. RESULT AND DISCUSSION
Run
Order
P
(kw)
F
(m/min)
A
(degree)
P
(bar)
D
(kg/hr)
1 4 5 90 25 1.4
2 2 7 90 10 2.83
3 4 5 30 25 2.79
4 4 5 60 25 2.39
5 6 3 90 10 0.83
6 4 5 60 40 1.36
7 2 3 30 40 1.39
8 6 3 30 10 1.54
9 6 3 90 40 1.46
10 2 3 90 10 1.06
11 4 5 60 25 1.56
12 4 5 60 25 1.76
13 6 7 30 10 2.74
14 4 5 60 25 2.1
15 6 7 90 10 3.13
16 6 7 90 40 2.94
17 6 7 30 40 3.46
18 4 5 60 25 1.54
19 6 5 60 25 2.08
20 2 7 30 40 3.34
21 4 7 60 25 2.9
22 4 3 60 25 1.39
23 6 3 30 40 1.58
24 2 7 30 10 3.93
25 2 3 30 10 1.2
26 2 5 60 25 2.06
27 2 7 90 40 3.53
28 4 5 60 10 2.5
29 4 5 60 25 1.56
30 4 5 60 25 1.48
Assessment of Deposition Rate in MIG Welding of Metal, Research Paper
(IJSRD/Vol. 3/Issue 03/2015/500)
All rights reserved by www.ijsrd.com 2013
31 2 3 90 40 1.48
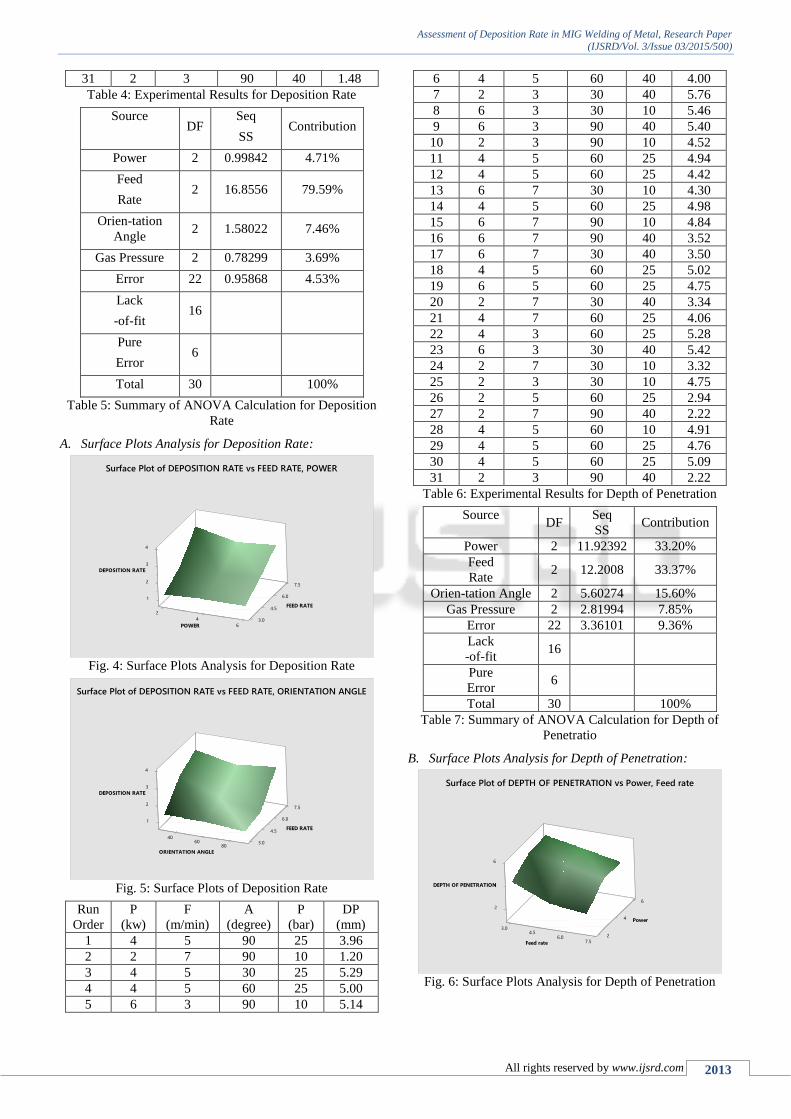
Table 4: Experimental Results for Deposition Rate
Source
DF
Seq
SS Contribution
Power 2 0.99842 4.71%
Feed
Rate 2 16.8556 79.59%
Orien-tation
Angle 2 1.58022 7.46%
Gas Pressure 2 0.78299 3.69%
Error 22 0.95868 4.53%
Lack
-of-fit 16
Pure
Error 6
Total 30 100%
Table 5: Summary of ANOVA Calculation for Deposition
Rate
A. Surface Plots Analysis for Deposition Rate:
Fig. 4: Surface Plots Analysis for Deposition Rate
Fig. 5: Surface Plots of Deposition Rate
Run
Order
P
(kw)
F
(m/min)
A
(degree)
P
(bar)
DP
(mm)
1 4 5 90 25 3.96
2 2 7 90 10 1.20
3 4 5 30 25 5.29
4 4 5 60 25 5.00
5 6 3 90 10 5.14
6 4 5 60 40 4.00
7 2 3 30 40 5.76
8 6 3 30 10 5.46
9 6 3 90 40 5.40
10 2 3 90 10 4.52
11 4 5 60 25 4.94
12 4 5 60 25 4.42
13 6 7 30 10 4.30
14 4 5 60 25 4.98
15 6 7 90 10 4.84
16 6 7 90 40 3.52
17 6 7 30 40 3.50
18 4 5 60 25 5.02
19 6 5 60 25 4.75
20 2 7 30 40 3.34
21 4 7 60 25 4.06
22 4 3 60 25 5.28
23 6 3 30 40 5.42
24 2 7 30 10 3.32
25 2 3 30 10 4.75
26 2 5 60 25 2.94
27 2 7 90 40 2.22
28 4 5 60 10 4.91
29 4 5 60 25 4.76
30 4 5 60 25 5.09
31 2 3 90 40 2.22
Table 6: Experimental Results for Depth of Penetration
Source
DF
Seq
SS Contribution
Power 2 11.92392 33.20%
Feed
Rate 2 12.2008 33.37%
Orien-tation Angle 2 5.60274 15.60%
Gas Pressure 2 2.81994 7.85%
Error 22 3.36101 9.36%
Lack
-of-fit 16
Pure
Error 6
Total 30 100%
Table 7: Summary of ANOVA Calculation for Depth of
Penetratio
B. Surface Plots Analysis for Depth of Penetration:
Fig. 6: Surface Plots Analysis for Depth of Penetration
7.5
0.61
2
.542
3
4
4 3.06
ETAR NOITISOPED
ETAR DEEF
REWOP
urface Plot of DEPOSITION RATE vs FEED RATE, S OWERP
7.5
06.1
2
4.5
3
04
4
06 0.308
DEPOSI IT ETAR NO
ETAR DEEF
ELGNA NOIRIENTAO T
urface Plot of DEPOSITION RATE vs FEED RATE, ORIENTATS ON ANGLEI
6
4
2
4
0.3
6
4.526.0
.7 5
DEPTH OF P R NOITATENE
rewoP
eed rF ate
urfaS e Plot of DEPTH OF PENc TRATION vs Power, Feed rateE
Assessment of Deposition Rate in MIG Welding of Metal, Research Paper
(IJSRD/Vol. 3/Issue 03/2015/500)
All rights reserved by www.ijsrd.com 2014
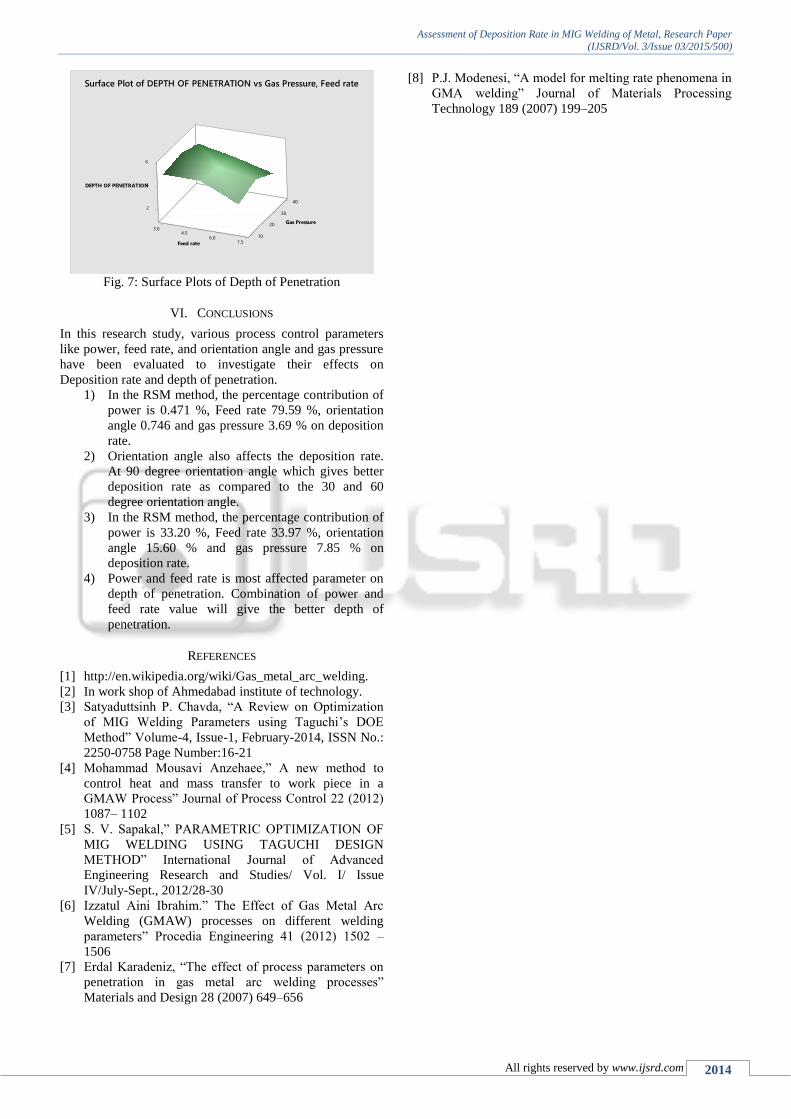
Fig. 7: Surface Plots of Depth of Penetration
VI. CONCLUSIONS
In this research study, various process control parameters
like power, feed rate, and orientation angle and gas pressure
have been evaluated to investigate their effects on
Deposition rate and depth of penetration.
1) In the RSM method, the percentage contribution of
power is 0.471 %, Feed rate 79.59 %, orientation
angle 0.746 and gas pressure 3.69 % on deposition
rate.
2) Orientation angle also affects the deposition rate.
At 90 degree orientation angle which gives better
deposition rate as compared to the 30 and 60
degree orientation angle.
3) In the RSM method, the percentage contribution of
power is 33.20 %, Feed rate 33.97 %, orientation
angle 15.60 % and gas pressure 7.85 % on
deposition rate.
4) Power and feed rate is most affected parameter on
depth of penetration. Combination of power and
feed rate value will give the better depth of
penetration.
REFERENCES
[1] http://en.wikipedia.org/wiki/Gas_metal_arc_welding.
[2] In work shop of Ahmedabad institute of technology.
[3] Satyaduttsinh P. Chavda, “A Review on Optimization
of MIG Welding Parameters using Taguchi’s DOE
Method” Volume-4, Issue-1, February-2014, ISSN No.:
2250-0758 Page Number:16-21
[4] Mohammad Mousavi Anzehaee,” A new method to
control heat and mass transfer to work piece in a
GMAW Process” Journal of Process Control 22 (2012)
1087– 1102
[5] S. V. Sapakal,” PARAMETRIC OPTIMIZATION OF
MIG WELDING USING TAGUCHI DESIGN
METHOD” International Journal of Advanced
Engineering Research and Studies/ Vol. I/ Issue
IV/July-Sept., 2012/28-30
[6] Izzatul Aini Ibrahim.” The Effect of Gas Metal Arc
Welding (GMAW) processes on different welding
parameters” Procedia Engineering 41 (2012) 1502 –
1506
[7] Erdal Karadeniz, “The effect of process parameters on
penetration in gas metal arc welding processes”
Materials and Design 28 (2007) 649–656
[8] P.J. Modenesi, “A model for melting rate phenomena in
GMA welding” Journal of Materials Processing
Technology 189 (2007) 199–205
04
032
02
4
0.3
6
4.510.06
5.7
DEPTH OF P NOITARTENE
erusserP saG
eed rateF
urface Plot of DEPTH OF PENETRATIOS vs Gas Pressure, Feed rateN