assessment of domestic pollution load from urban...
TRANSCRIPT
Report Code: 059_GBP_IIT_EQP_S&R_09_Ver 1_DEC 2014
Assessment of Domestic Pollution Load from Urban
Agglomeration in Ganga Basin: Haryana
GRBMP: Ganga River Basin Management Plan
by
IIT Bombay
IIT Delhi
IIT Guwahati
IIT Kanpur
IIT Kharagpur
IIT Madras
IIT Roorkee
Indian Institutes of Technology
Report Code: 059_GBP_IIT_EQP_S&R_09_Ver 1_Dec 2014
2 | P a g e
Preface
In exercise of the powers conferred by sub-sections (1) and (3) of Section 3 of the
Environment (Protection) Act, 1986 (29 of 1986), the Central Government has constituted
National Ganga River Basin Authority (NGRBA) as a planning, financing, monitoring and
coordinating authority for strengthening the collective efforts of the Central and State
Government for effective abatement of pollution and conservation of the river Ganga. One
of the important functions of the NGRBA is to prepare and implement a Ganga River Basin
Management Plan (GRBMP).
A Consortium of 7 Indian Institute of Technology (IIT) has been given the responsibility of
preparing Ganga River Basin Environment Management Plan (GRBMP) by the Ministry of
Environment and Forests (MoEF), GOI, New Delhi. Memorandum of Agreement (MoA) has
been signed between 7 IITs (Bombay, Delhi, Guwahati, Kanpur, Kharagpur, Madras and
Roorkee) and MoEF for this purpose on July 6, 2010.
This report is one of the many reports prepared by IITs to describe the strategy,
information, methodology, analysis and suggestions and recommendations in developing
Ganga River Basin Management Plan (GRB EMP). The overall Frame Work for
documentation of GRBMP and Indexing of Reports is presented on the inside cover page.
There are two aspects to the development of GRB EMP. Dedicated people spent hours
discussing concerns, issues and potential solutions to problems. This dedication leads to the
preparation of reports that hope to articulate the outcome of the dialog in a way that is
useful. Many people contributed to the preparation of this report directly or indirectly. This
report is therefore truly a collective effort that reflects the cooperation of many,
particularly those who are members of the IIT Team. Lists of persons who have contributed
directly and those who have taken lead in preparing this report is given on the reverse side.
Dr. Vinod Tare Professor and Coordinator
Development of GRBMP IIT Kanpur
Report Code: 059_GBP_IIT_EQP_S&R_09_Ver 1_Dec 2014
3 | P a g e
The Team
1. A AKazmi, IIT Roorkee [email protected] 2. A K Gupta, IIT Kharagpur [email protected],[email protected] 3. A K Mittal, IIT Delhi [email protected] 4. A K Nema, IIT Delhi [email protected] 5. Ajay Kalmhad, IIT Guwahati [email protected] 6. Anirban Gupta, BESU Shibpur [email protected] 7. Arun Kumar, IIT Delhi [email protected] 8. G J Chakrapani, IIT Roorkkee [email protected] 9. GazalaHabib, IIT Delhi [email protected] 10. Himanshu Joshi, IIT Roorkee [email protected] 11. InduMehrotra, IIT Roorkee [email protected] 12. I M Mishra, IIT Roorkee [email protected] 13. Ligy Philip, IIT Madras [email protected] 14. M MGhangrekar, IIT Kharagpur [email protected] 15. MukeshDoble, IIT Bombay [email protected] 16. P K Singh, IT BHU [email protected] 17. Purnendu Bose, IIT Kanpur [email protected] 18. R Ravi Krishna, IIT Madras [email protected] 19 . Rakesh Kumar, NEERI Nagpur [email protected] 20. S M Shivnagendra, IIT Madras [email protected] 21. SaumyenGuha, IIT Kanpur [email protected] 22. Shyam R Asolekar, IIT Bombay [email protected] 23. SudhaGoel, IIT Kharagpur [email protected] 24. Suparna Mukherjee, IIT Bombay [email protected] 25. T R Sreekrishanan, IIT Delhi [email protected] 26. Vinod Tare, IIT Kanpur [email protected] 27. Vivek Kumar, IIT Roorkee [email protected]
Lead Persons
1. Vinod Tare, IIT Kanpur 2. Purnendu Bose, IIT Kanpur 3. Shashikant Patel, IIT Kanpur 4. Swatanta Pratap Singh, IIT Kanpur

Report Code: 059_GBP_IIT_EQP_S&R_09_Ver 1_Dec 2014
4 | P a g e
Contents
Page 1 Introduction 6
2 Major Obstruction and Abstraction Projects on the Tributaries of the river Ganga executed in the State
8
3 Demographic profile of Ganga Basin in the State 8
4 Pollution Load 15
5 Conclusions 22
References 23
Appendix 1: Compilation of Fact Sheets of Water Balance & Pollution Load (Domestic) of Class I Cities/Towns in Haryana
25
Appendix 2: Compilation of Fact Sheets of Water Balance & Pollution Load (Domestic) of Class II Cities/Towns in Haryana
37

Report Code: 059_GBP_IIT_EQP_S&R_09_Ver 1_Dec 2014
5 | P a g e
Report Code: 059_GBP_IIT_EQP_S&R_09_Ver 1_Dec 2014
6 | P a g e
1. Introduction:
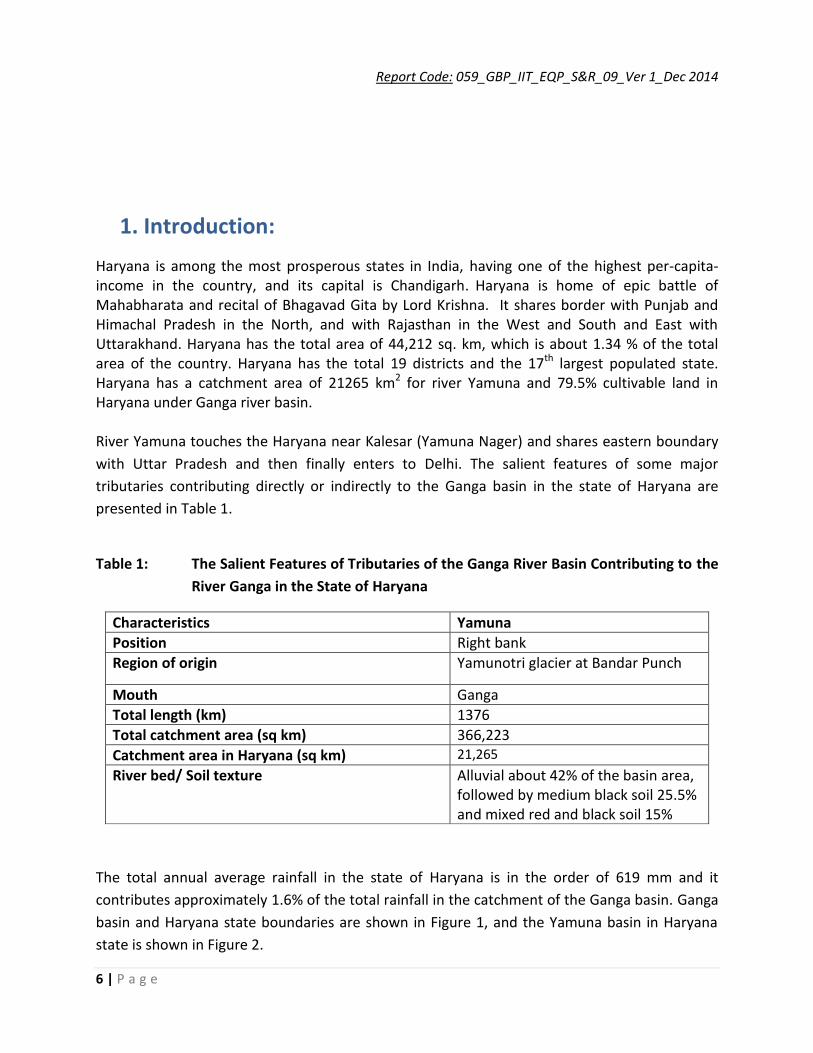
Haryana is among the most prosperous states in India, having one of the highest per-capita- income in the country, and its capital is Chandigarh. Haryana is home of epic battle of Mahabharata and recital of Bhagavad Gita by Lord Krishna. It shares border with Punjab and Himachal Pradesh in the North, and with Rajasthan in the West and South and East with Uttarakhand. Haryana has the total area of 44,212 sq. km, which is about 1.34 % of the total area of the country. Haryana has the total 19 districts and the 17th largest populated state. Haryana has a catchment area of 21265 km2 for river Yamuna and 79.5% cultivable land in Haryana under Ganga river basin. River Yamuna touches the Haryana near Kalesar (Yamuna Nager) and shares eastern boundary
with Uttar Pradesh and then finally enters to Delhi. The salient features of some major
tributaries contributing directly or indirectly to the Ganga basin in the state of Haryana are
presented in Table 1.
Table 1: The Salient Features of Tributaries of the Ganga River Basin Contributing to the
River Ganga in the State of Haryana
Characteristics Yamuna
Position Right bank
Region of origin Yamunotri glacier at Bandar Punch
Mouth Ganga
Total length (km) 1376
Total catchment area (sq km) 366,223
Catchment area in Haryana (sq km) 21,265
River bed/ Soil texture Alluvial about 42% of the basin area, followed by medium black soil 25.5% and mixed red and black soil 15%
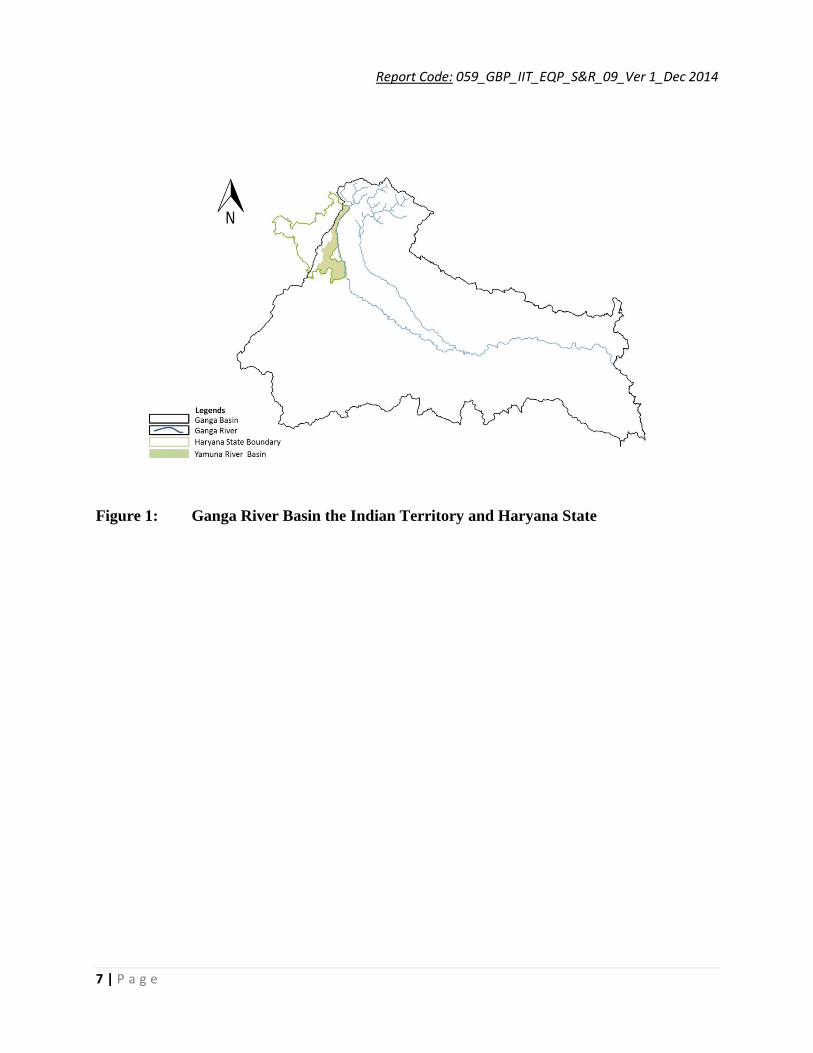
The total annual average rainfall in the state of Haryana is in the order of 619 mm and it
contributes approximately 1.6% of the total rainfall in the catchment of the Ganga basin. Ganga
basin and Haryana state boundaries are shown in Figure 1, and the Yamuna basin in Haryana
state is shown in Figure 2.
Report Code: 059_GBP_IIT_EQP_S&R_09_Ver 1_Dec 2014
7 | P a g e
Figure 1: Ganga River Basin the Indian Territory and Haryana State
Report Code: 059_GBP_IIT_EQP_S&R_09_Ver 1_Dec 2014
8 | P a g e
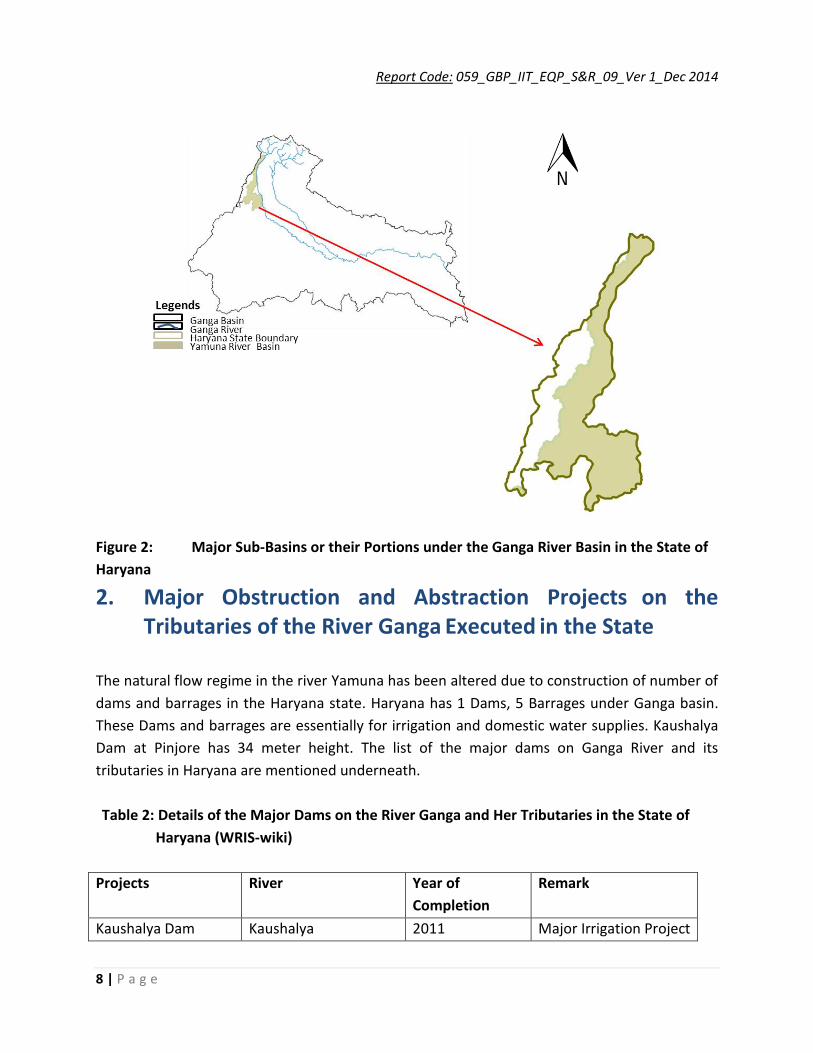
Figure 2: Major Sub-Basins or their Portions under the Ganga River Basin in the State of
Haryana
2. Major Obstruction and Abstraction Projects on the Tributaries of the River Ganga Executed in the State
The natural flow regime in the river Yamuna has been altered due to construction of number of
dams and barrages in the Haryana state. Haryana has 1 Dams, 5 Barrages under Ganga basin.
These Dams and barrages are essentially for irrigation and domestic water supplies. Kaushalya
Dam at Pinjore has 34 meter height. The list of the major dams on Ganga River and its
tributaries in Haryana are mentioned underneath.
Table 2: Details of the Major Dams on the River Ganga and Her Tributaries in the State of
Haryana (WRIS-wiki)
Projects River Year of
Completion
Remark
Kaushalya Dam Kaushalya 2011 Major Irrigation Project

Report Code: 059_GBP_IIT_EQP_S&R_09_Ver 1_Dec 2014
9 | P a g e
Dadupur Barrage Yamuna 1890 Major Irrigation Project
Hathini Kund Barrage Yamuna 1999 Major Irrigation Project
Masani Barrage Yamuna Not Avialable Major Irrigation Project
3. Demographic Profile of Ganga Basin in the State
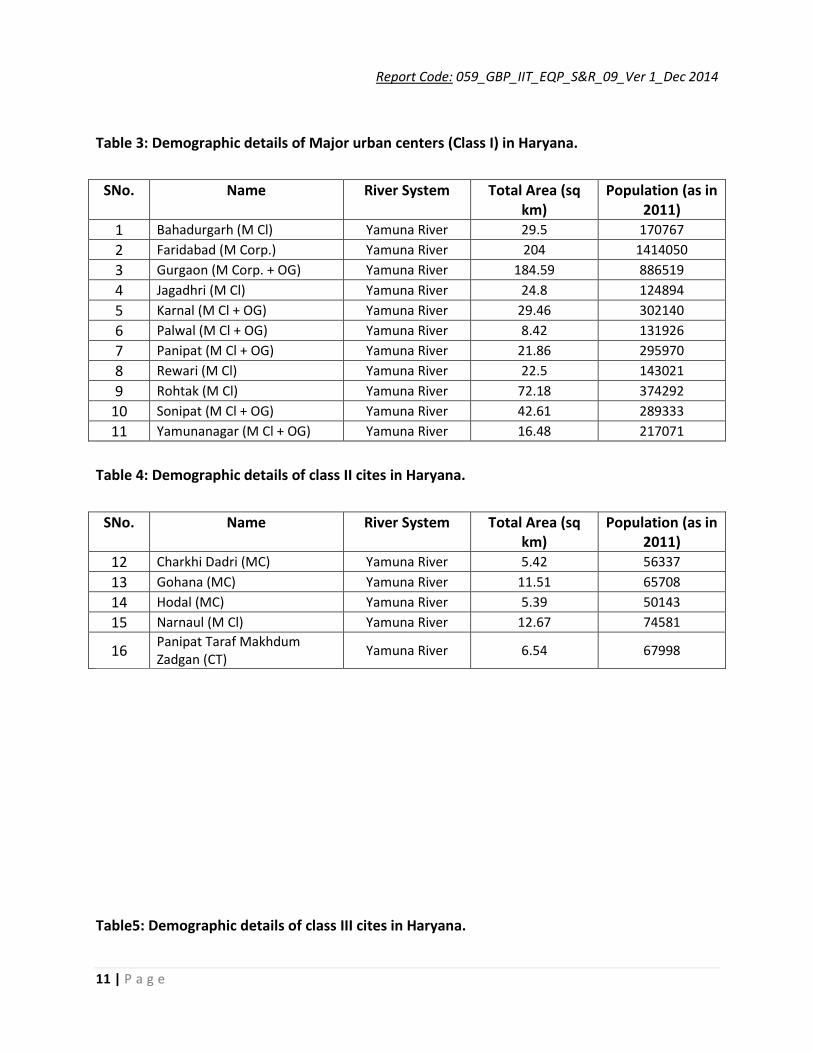
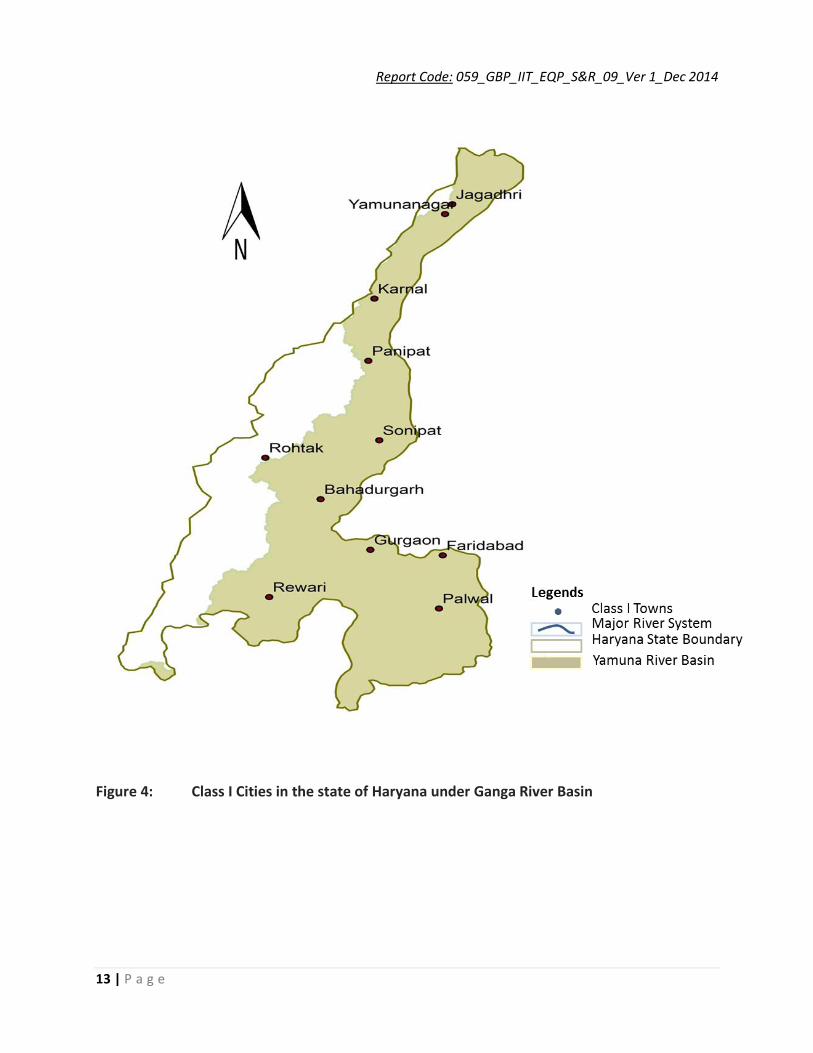
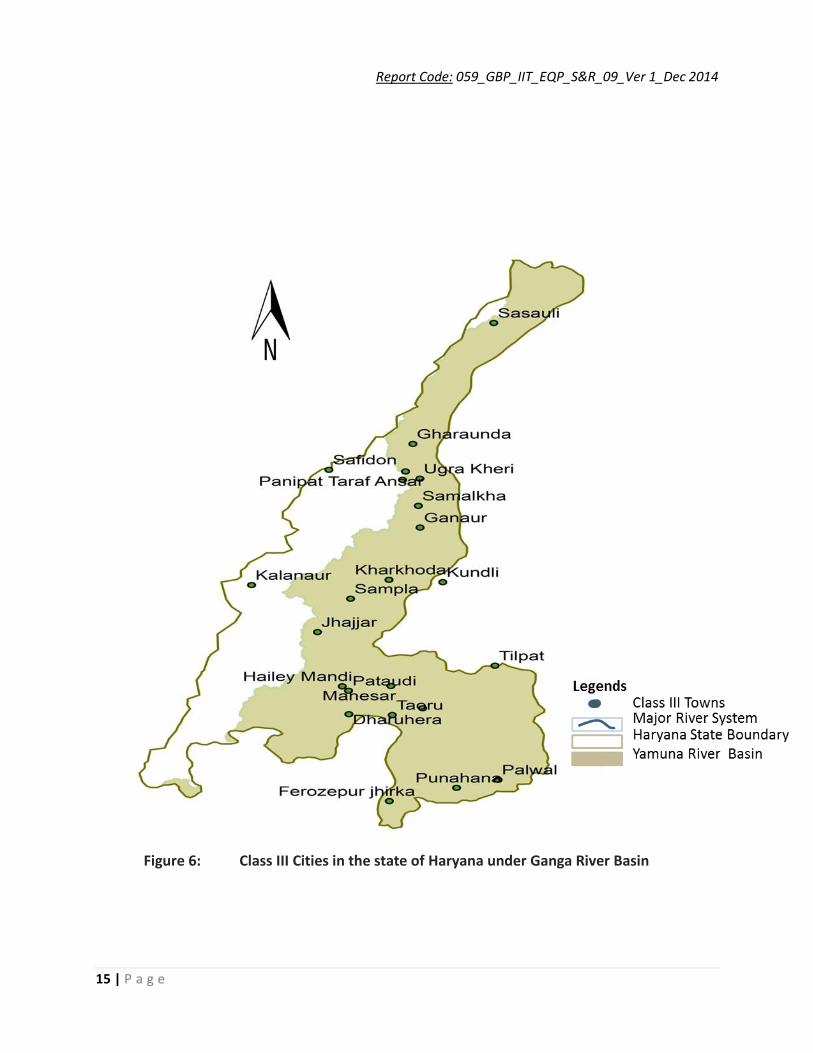
Haryana has 11 Class I cities, 5 Class II cities and 21 Class III cities under Ganga basin (Figure 4-
6). The total population of the state according to the Census 2011 is 25.35 million out of which
34.88% belong to the urban area. The density in the state is about 573 people per square
kilometer. According to the Population Census 2011, some of the Class I cities are Bahadurgarh,
Faridabad, Gurgaon, Jagadhri, Karnal, Palwal, Panipat, Rewari, Rohtak, Sonipat, and
Yamunanager. The details of the area, population and the major river systems of all the Class I,
II and III cities are presented in Table 3-5, respectively.
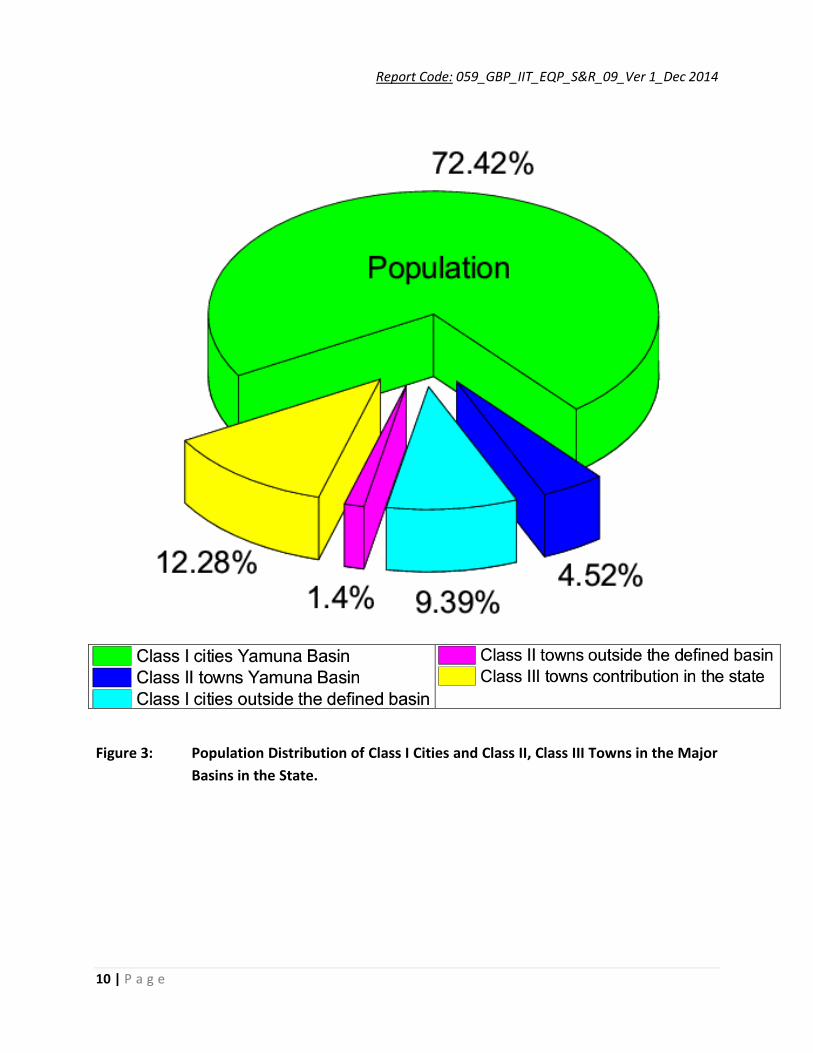
Figure 3 shows the population distribution of Class I cities, Class II and III towns in the Ganga
basin in the Haryana state and along the main stream of the river Yamuna. Map in the Figure 4,
5 and 6 showing the distribution of Class I cities, Class II, and Class III towns respectively in the
state under Ganga River Basin. The average population of class I town in the state is 0.39
million, approximately six times and thirteen times higher than the population of class II and
class III towns, respectively. Faridabad is the highly populated class I city having the population
of 1.4 million, while Jagadhri is the least populated (0.12 million) class I city. Narnaul and Hodal
are the cities having maximum and minimum population under class II towns, contains 0.074
and 0.05 million, respectively. In class III towns where the population is less than 0.05 million,
the maximum population is in the Jhaggar town (0.048 million), while minimum is in the
Pataudi (0.02 million).
Report Code: 059_GBP_IIT_EQP_S&R_09_Ver 1_Dec 2014
10 | P a g e
Figure 3: Population Distribution of Class I Cities and Class II, Class III Towns in the Major
Basins in the State.
Report Code: 059_GBP_IIT_EQP_S&R_09_Ver 1_Dec 2014
11 | P a g e
Table 3: Demographic details of Major urban centers (Class I) in Haryana.
SNo. Name River System Total Area (sq km)
Population (as in 2011)
1 Bahadurgarh (M Cl) Yamuna River 29.5 170767
2 Faridabad (M Corp.) Yamuna River 204 1414050
3 Gurgaon (M Corp. + OG) Yamuna River 184.59 886519
4 Jagadhri (M Cl) Yamuna River 24.8 124894
5 Karnal (M Cl + OG) Yamuna River 29.46 302140
6 Palwal (M Cl + OG) Yamuna River 8.42 131926
7 Panipat (M Cl + OG) Yamuna River 21.86 295970
8 Rewari (M Cl) Yamuna River 22.5 143021
9 Rohtak (M Cl) Yamuna River 72.18 374292
10 Sonipat (M Cl + OG) Yamuna River 42.61 289333
11 Yamunanagar (M Cl + OG) Yamuna River 16.48 217071
Table 4: Demographic details of class II cites in Haryana.
SNo. Name River System Total Area (sq km)
Population (as in 2011)
12 Charkhi Dadri (MC) Yamuna River 5.42 56337
13 Gohana (MC) Yamuna River 11.51 65708
14 Hodal (MC) Yamuna River 5.39 50143
15 Narnaul (M Cl) Yamuna River 12.67 74581
16 Panipat Taraf Makhdum Zadgan (CT)
Yamuna River 6.54 67998
Table5: Demographic details of class III cites in Haryana.

Report Code: 059_GBP_IIT_EQP_S&R_09_Ver 1_Dec 2014
12 | P a g e
SNo. Name River System Total Area (sq km)
Population (as in 2011)
1 Dharuhera (MC) Sahibi River 11.49 30344
2 Ferozepur jhirka (MC) Yamuna River 8.86 24750
3 Ganaur (MC) Yamuna River 9.06 35603
4 Gharaunda (MC) Yamuna River 12.98 37816
5 Hailey Mandi (MC) Yamuna River 16.27 20906
6 Jhajjar (MC) Yamuna River 36 48424
7 Kalanaur (MC) Yamuna River 6.85 23319
8 Kharkhoda (MC) Yamuna River 1.63 25051
9 Kundli (55) (CT) Yamuna River 7.9 21633
10 Manesar (154) (CT) Yamuna River 14.7 23448
11 Palwal (Rural) (Part) (73) (CT) Yamuna River 20.1 23072
12 Panipat Taraf Ansar (CT) Yamuna River 7.88 42877
13 Panipat Taraf Rajputan (CT) Yamuna River 5.1 28803
14 Pataudi (MC) Yamuna River 13.51 20418
15 Punahana (MC) Yamuna River 10.12 24734
16 Safidon (MC) Yamuna River 9.48 34728
17 Samalkha (MC + OG) Yamuna River 4.66 39710
18 Sampla (MC) Yamuna River 17.83 20563
19 Sasauli (CT) Yamuna River 2.88 22479
20 Sohna (MC) Yamuna River 9.7 36552
21 Taoru (MC) Yamuna River 4.52 22599
Report Code: 059_GBP_IIT_EQP_S&R_09_Ver 1_Dec 2014
13 | P a g e
Figure 4: Class I Cities in the state of Haryana under Ganga River Basin

Report Code: 059_GBP_IIT_EQP_S&R_09_Ver 1_Dec 2014
14 | P a g e
Figure 5: Class II Cities in the state of Haryana under Ganga River Basin
Report Code: 059_GBP_IIT_EQP_S&R_09_Ver 1_Dec 2014
15 | P a g e
Figure 6: Class III Cities in the state of Haryana under Ganga River Basin
Report Code: 059_GBP_IIT_EQP_S&R_09_Ver 1_Dec 2014
16 | P a g e
4. Pollution Load
The major pollution load in the area of basin under the state is due to point and nonpoint
sources. Discharges of untreated/partially treated sewage from urban centers, discharge from
open drain carrying sewage, discharges from the tributaries and discharge of
untreated/partially treated wastewater from industrial units are the major point sources that
contribute to the pollution load in the state. The major cities contributing the wastewater
discharge of approximately 239 MLD in river Yamuna are in Faridabad, Karnal, Panipat, Sonipat,
Gurgaon (CPCB, 2013). The report published by CPCB in 2009 revealed that the total sewage
generation of class I cities in whole Ganga basin is 15,305.55 MLD while its treatment capacity is
only one third (32%) of the total sewage generation (4,886.28 MLD). The situation getting more
critical in the class II towns as the difference between the sewage generation (1,083.85 MLD)
and its treatment capacity (91.82 MLD) increased.
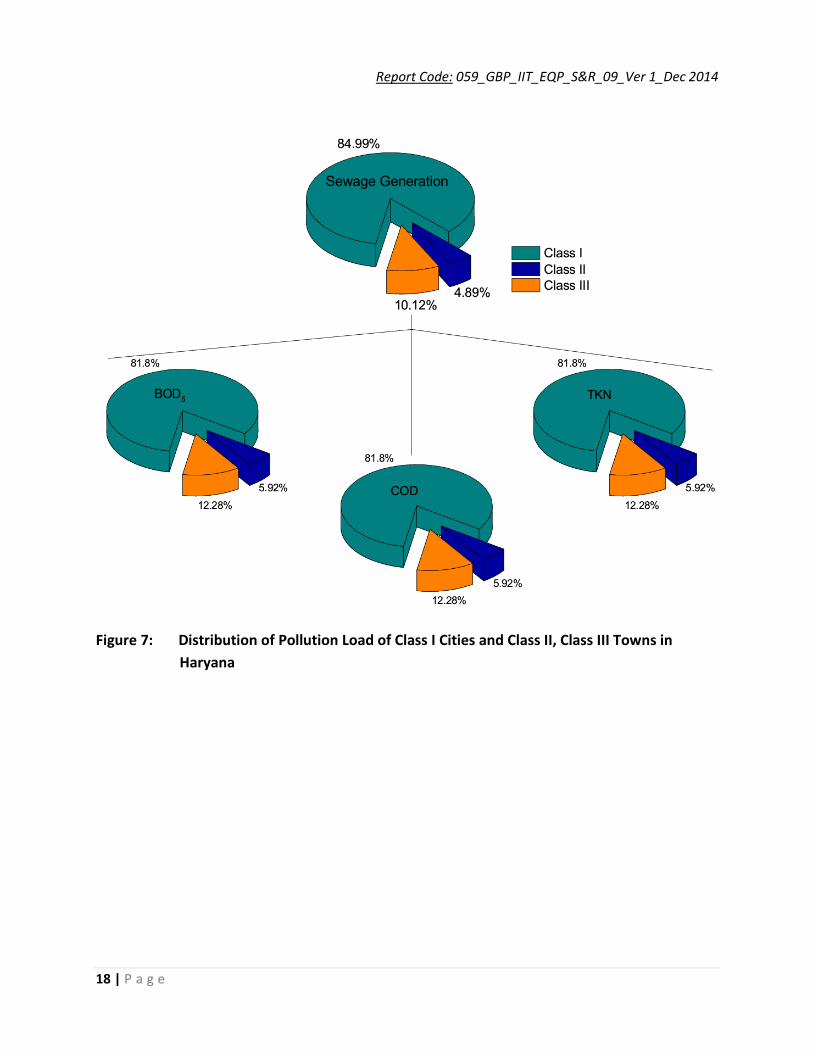
The maximum sewage generated by class I cities and class II towns of Haryana are 592 and 34
MLD. The comparison of the total sewage generation and sewage treatment capacity of the
class I cities and Class II towns of the states lying under Ganga basin has been represented in
Figure 8. The trends of the data Haryana depicted that the maximum share of sewage
generation (88.33%) is from class I cities followed by class II and III towns, 10.12 and 4.89%,
respectively (Figure 7). The BOD and COD load for Class I cities, Class II and Class III towns are in
the range of 81.8, 12.28 and 5.92%, respectively. The TKN load almost showing the same trend
as BOD and COD load.
The assessment of the total water supply and total sewage generation of class I cities in the
state revealed that the maximum sewage generation is in Faridabad 152.7 MLD, approximately
79.9% of the water supply. In case of the class II towns the sewage generation in Namaul is
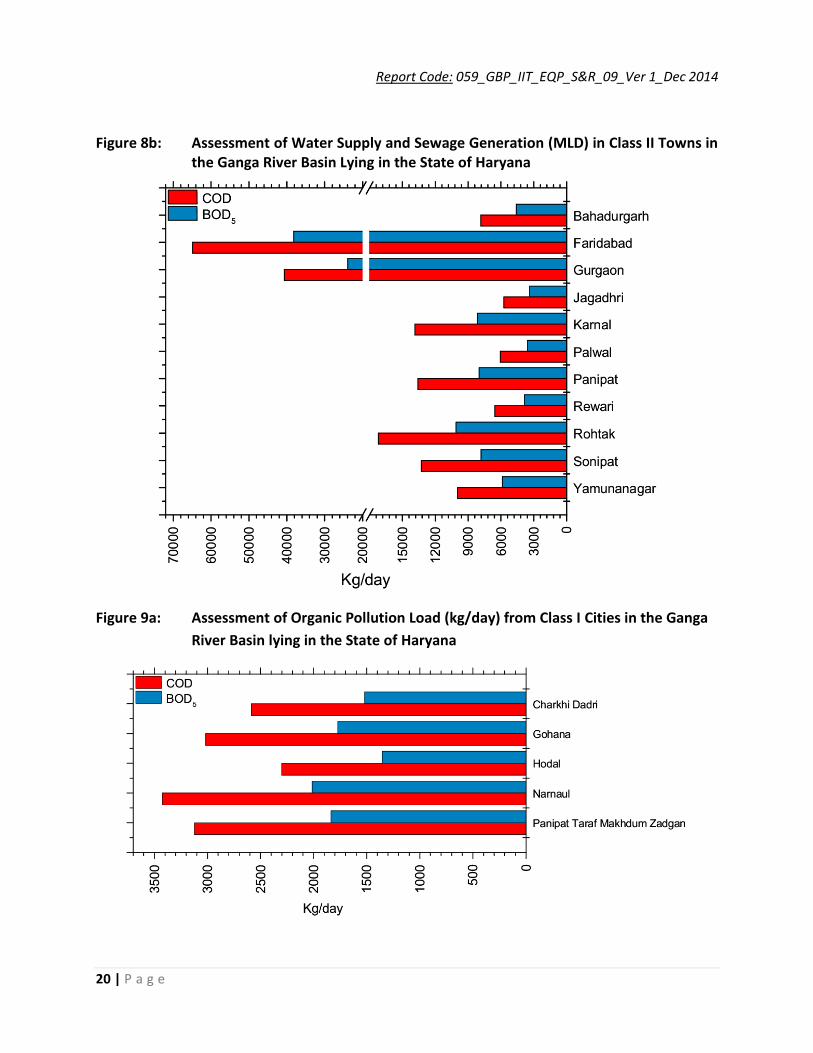
maximum 8.1 MLD, ~80.4% of its total water supply. The total BOD and COD load in Kg/day has
been estimated on the per capita basis in Class I towns and its average are approximately 10.6
and 18.1 tons/day, respectively. The average BOD and COD load from the Class II towns is 1.7
and 2.9 tons/day, respectively whereas Class III towns contribute approximately 0.9 tons/day
and 1.55 tons/day of BOD and COD, respectively. The maximum and minimum BOD and COD
contributing cities in Class I towns are Faridabad and Jagadhri, respectively. In Class II towns
Report Code: 059_GBP_IIT_EQP_S&R_09_Ver 1_Dec 2014
17 | P a g e
maximum BOD and COD is from Namaul, whereas minimum BOD and COD are from Hodal. In
class III towns maximum and minimum BOD and COD is from Jhajjar and Pataudi respectively.
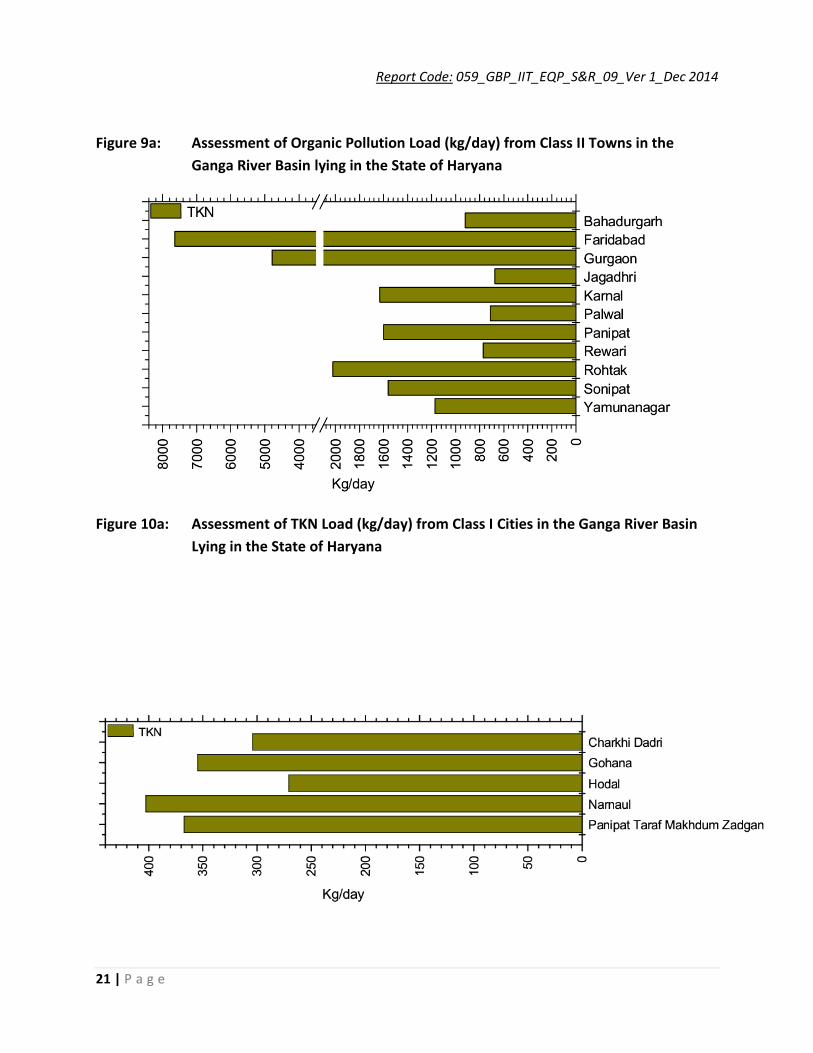
The total TKN in metric tons/day contributed by Class I, Class II and Class III towns are
approximately 2.1, 0.33 and 0.15 tons/day, respectively. The maximum and minimum
contribution of TKN from class I towns are from Faridabad and Jagadhri respectively. The
maximum and minimum contribution of TKN from class II towns is from Namaul and Hodal,
respectively while the maximum and minimum contribution of TKN from class III towns is from
Jhajjar and Pataudi, respectively. The estimates of total water supplied, total sewage generated,
BOD, COD and TKN loads are summarized and illustrated in Figures (8-10) for class I cities and
class II towns. The comparative account of all the classes (I, II and III) for its population, sewage
generation, water supply and BOD, COD and TKN load are presented in Figure 11.
Report Code: 059_GBP_IIT_EQP_S&R_09_Ver 1_Dec 2014
18 | P a g e
Figure 7: Distribution of Pollution Load of Class I Cities and Class II, Class III Towns in
Haryana

Report Code: 059_GBP_IIT_EQP_S&R_09_Ver 1_Dec 2014
19 | P a g e
Figure 8a: Assessment of Water Supply and Sewage Generation (MLD) in Class I Cities in the Ganga River Basin Lying in the State of Haryana
Report Code: 059_GBP_IIT_EQP_S&R_09_Ver 1_Dec 2014
20 | P a g e
Figure 8b: Assessment of Water Supply and Sewage Generation (MLD) in Class II Towns in the Ganga River Basin Lying in the State of Haryana
Figure 9a: Assessment of Organic Pollution Load (kg/day) from Class I Cities in the Ganga
River Basin lying in the State of Haryana
Report Code: 059_GBP_IIT_EQP_S&R_09_Ver 1_Dec 2014
21 | P a g e
Figure 9a: Assessment of Organic Pollution Load (kg/day) from Class II Towns in the
Ganga River Basin lying in the State of Haryana
Figure 10a: Assessment of TKN Load (kg/day) from Class I Cities in the Ganga River Basin
Lying in the State of Haryana
Report Code: 059_GBP_IIT_EQP_S&R_09_Ver 1_Dec 2014
22 | P a g e
Figure 10a: Assessment of TKN Load (kg/day) from Class II Towns in the Ganga River Basin
Lying in the State of Haryana
Report Code: 059_GBP_IIT_EQP_S&R_09_Ver 1_Dec 2014
23 | P a g e

Report Code: 059_GBP_IIT_EQP_S&R_09_Ver 1_Dec 2014
24 | P a g e
Figure 11: Comparative Analysis of Class I, Class II and Class III Cities/Towns Lying Under
the State: (a) Population (b) Total Water Supply and Sewage Generation (c) Pollution Load
Report Code: 059_GBP_IIT_EQP_S&R_09_Ver 1_Dec 2014
25 | P a g e
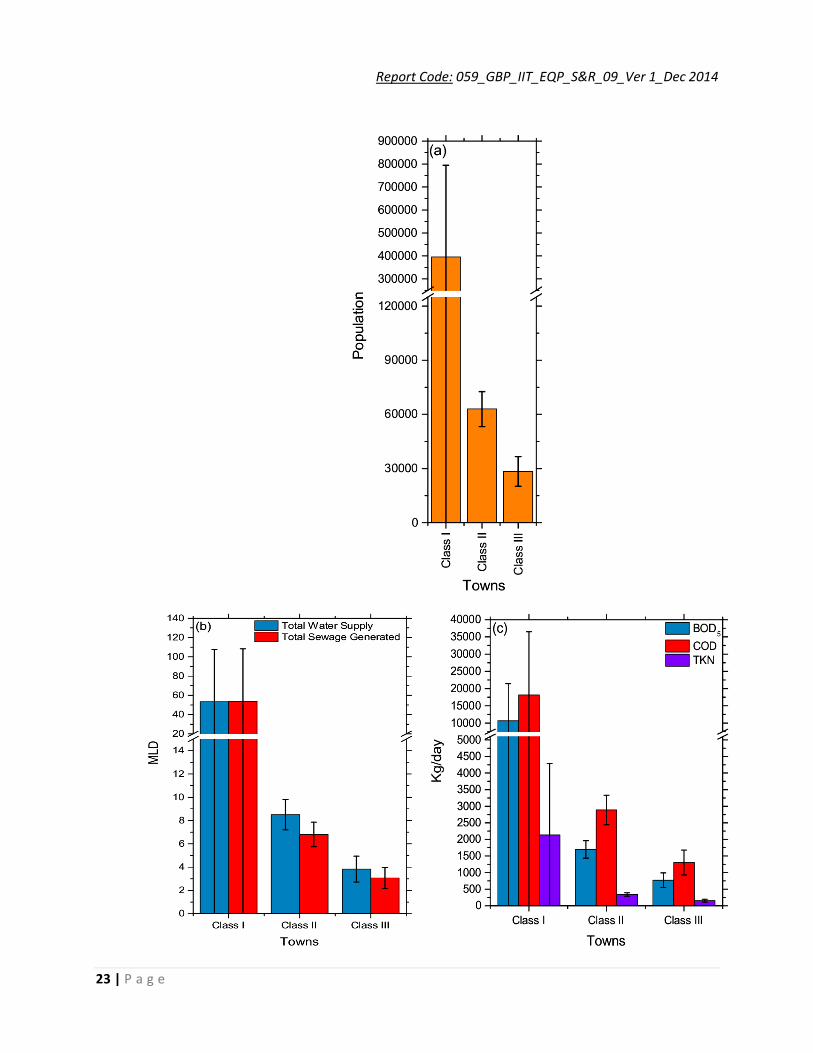
Figure 12 (a-d): Pollution load of Class I Cities and Class II, Class III Towns in the Major Basins
in the State: (a) Sewage Generation; (b) BOD5 ; (c) COD; (d) TKN
The results of the pollution load of Class I cities, Class II and Class III towns under the major
basins of river Ganga in the state has been evaluated (Figure 12a-d) and the results revealed
that the percentage of the total sewage generation is maximum in the Class I cities situated
along the main stem of Yamuna (77.26%). The Class I cities and Class II towns outside the
major defined basins combinedly release 8.99% of waste water. The percentage sewage
generation by Class III towns of the entire state is 10.12% of the total sewage generated by the
state.
The BOD, COD and TKN load contributed by Class I cities of the main stem of Yamuna is 72.42%.
The Class II and Class III towns of the state imparted around 4.52% and 12.69% respectively of
the total BOD, COD, and TKN load. The details of the BOD and COD load in the state are
presented in Figure 12b and c.
5. Conclusions:
River Yamuna is the one of the main tributaries of River Ganga flows in the Indo-Gangetic
plains. Yamuna flows from Yamunotri to Allahabad, and merge with river Ganga. During her
course from Yamunotri to Allahabad, it passes through Himachal Pradesh, Uttarakhand,
Haryana, Delhi and Uttar Pradesh. The catchment of the river addressed the load of 11 Class I
cities, 5 Class II towns and 21 Class III towns, directly or indirectly. The scenario of water quality
in the system is varies from bad to worse base on the spatial and temporal alterations. The
multitudinous problems are also arising during lean season due to the continuous discharge of
untreated and/or partially treated sewage and industrial wastewater.
The maximum sewage generation is in the Class I cities (77.26%) followed by Class III (10.12%)
and Class II towns (7.74%). Pollution load (BOD, COD and TKN load) also follows the same trend
with maximum values for Class I cities. Faridabad and Namaul are the Class I and Class II towns
showing maximum amount of sewage generation in comparison to their water supply. The
maximum BOD, COD and TKN contributing Class I cities, Class II and III towns are Faridabad,
Namaul and Jhajjar respectably. All calculations related to pollution load were done on per
capita basis. There is lack of real data (drains, water supply, etc.) for the Haryana state and real
data collection is suggested to be done for more accurate pollution situation.

Report Code: 059_GBP_IIT_EQP_S&R_09_Ver 1_Dec 2014
26 | P a g e
References
1. CPCB (2013). Pollution Assessment: River Ganga. [Accessed April 26, 2014 from:
http://cpcb.nic.in/upload/NewItems/NewItem_203_Ganga_report.pdf].
2. Jain S.K., Agarwal, P.K. and Singh, V.P. (2007). Hydrology and Water Resources of India. Springer
Netherlands, p 358.
3. Parua, P.K. (2009). The Ganga: Water Use in the Indian Subcontinent. DOI 10.1007/978-90-481-
3103-Springer Netherlands.
4. Water Resources Information System (WRIS)- Wiki (http://india-
wris.nrsc.gov.in/wrpinfo/index.php?title=Main_Page)
5. CPCB (2009). Status of Water Supply, Wastewater Generation and Treatment in Class-I Cities &
Class-II Towns of India.
Report Code: 059_GBP_IIT_EQP_S&R_09_Ver 1_Dec 2014
27 | P a g e
Report Code: 059_GBP_IIT_EQP_S&R_09_Ver 1_Dec 2014
28 | P a g e
Appendix-1
Compilation of Fact Sheets of
Water Balance & Pollution Load (Domestic) of
Major Class I Cities/Towns in
Haryana
Report Code: 059_GBP_IIT_EQP_S&R_09_Ver 1_Dec 2014
29 | P a g e
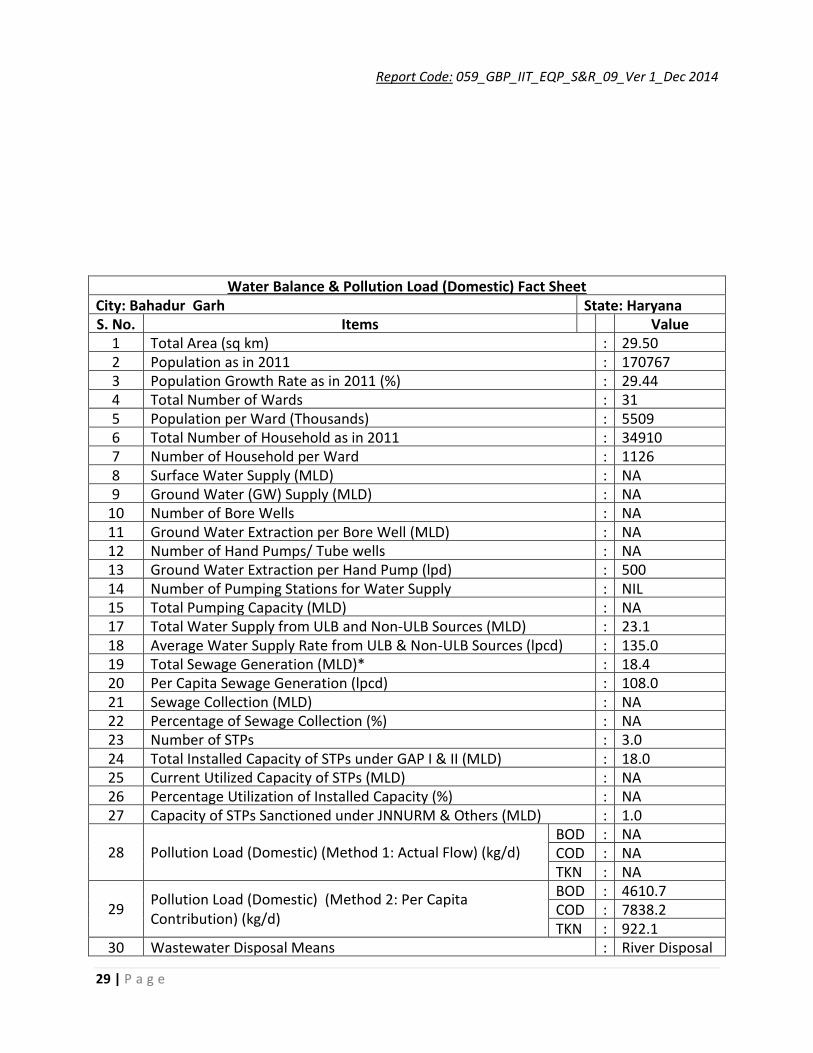
Water Balance & Pollution Load (Domestic) Fact Sheet City: Bahadur Garh State: Haryana S. No. Items Value
1 Total Area (sq km) : 29.50 2 Population as in 2011 : 170767 3 Population Growth Rate as in 2011 (%) : 29.44 4 Total Number of Wards : 31 5 Population per Ward (Thousands) : 5509 6 Total Number of Household as in 2011 : 34910 7 Number of Household per Ward : 1126 8 Surface Water Supply (MLD) : NA 9 Ground Water (GW) Supply (MLD) : NA
10 Number of Bore Wells : NA 11 Ground Water Extraction per Bore Well (MLD) : NA 12 Number of Hand Pumps/ Tube wells : NA 13 Ground Water Extraction per Hand Pump (lpd) : 500 14 Number of Pumping Stations for Water Supply : NIL 15 Total Pumping Capacity (MLD) : NA 17 Total Water Supply from ULB and Non-ULB Sources (MLD) : 23.1 18 Average Water Supply Rate from ULB & Non-ULB Sources (lpcd) : 135.0 19 Total Sewage Generation (MLD)* : 18.4 20 Per Capita Sewage Generation (lpcd) : 108.0 21 Sewage Collection (MLD) : NA 22 Percentage of Sewage Collection (%) : NA 23 Number of STPs : 3.0 24 Total Installed Capacity of STPs under GAP I & II (MLD) : 18.0 25 Current Utilized Capacity of STPs (MLD) : NA 26 Percentage Utilization of Installed Capacity (%) : NA 27 Capacity of STPs Sanctioned under JNNURM & Others (MLD) : 1.0
28 Pollution Load (Domestic) (Method 1: Actual Flow) (kg/d) BOD
5 : NA
COD : NA TKN : NA
29 Pollution Load (Domestic) (Method 2: Per Capita Contribution) (kg/d)
BOD
5 : 4610.7
COD : 7838.2 TKN : 922.1
30 Wastewater Disposal Means : River Disposal

Report Code: 059_GBP_IIT_EQP_S&R_09_Ver 1_Dec 2014
30 | P a g e
31 Name of River/Streams for Wastewater Disposal : Yamuna River 32 Number of Drains/Nallah for Wastewater Disposal : 2 33 Number of Water Bodies : NA 34 Gross Area of Water Bodies (Hectare) : NA 35 Area of Water Bodies as % of Total Area : <<< 1
Water Balance & Pollution Load (Domestic) Fact Sheet City: Faridabad State: Haryana S. No. Items Value
1 Total Area (sq km) : 204.00 2 Population as in 2011 : 1414050 3 Population Growth Rate as in 2011 (%) : 33.91 4 Total Number of Wards : 35 5 Population per Ward (Thousands) : 40401 6 Total Number of Household as in 2011 : 290675 7 Number of Household per Ward : 8305 8 Surface Water Supply (MLD) : NA 9 Ground Water (GW) Supply (MLD) : NA
10 Number of Bore Wells : NA 11 Ground Water Extraction per Bore Well (MLD) : NA 12 Number of Hand Pumps/ Tubewells : NA 13 Ground Water Extraction per Hand Pump (lpd) : 500 14 Number of Pumping Stations for Water Supply : NA 15 Total Pumping Capacity (MLD) : NA 16 Average Water Supply Rate from ULB Sources (lpcd) : NA 17 Total Water Supply from ULB and Non-ULB Sources (MLD) : 190.90 18 Average Water Supply Rate from ULB & Non-ULB Sources (lpcd) : 135.00 19 Total Sewage Generation (MLD)* : 152.72 20 Per Capita Sewage Generation (lpcd) : 108.00 21 Sewage Collection (MLD) : 142.3 22 Percentage of Sewage Collection (%) : NA 23 Number of STPs : 4.0 24 Total Installed Capacity of STPs under GAP I & II (MLD) : NA 25 Current Utilized Capacity of STPs (MLD) : NA 26 Percentage Utilization of Installed Capacity (%) : NA 27 Capacity of STPs Sanctioned under JNNURM & Others (MLD) : NA
28 Pollution Load (Domestic) (Method 1: Actual Flow) (kg/d) BOD5 : NA COD : NA TKN : NA
29 Pollution Load (Domestic) (Method 2: Per Capita BOD5 : 38179.4
Report Code: 059_GBP_IIT_EQP_S&R_09_Ver 1_Dec 2014
31 | P a g e
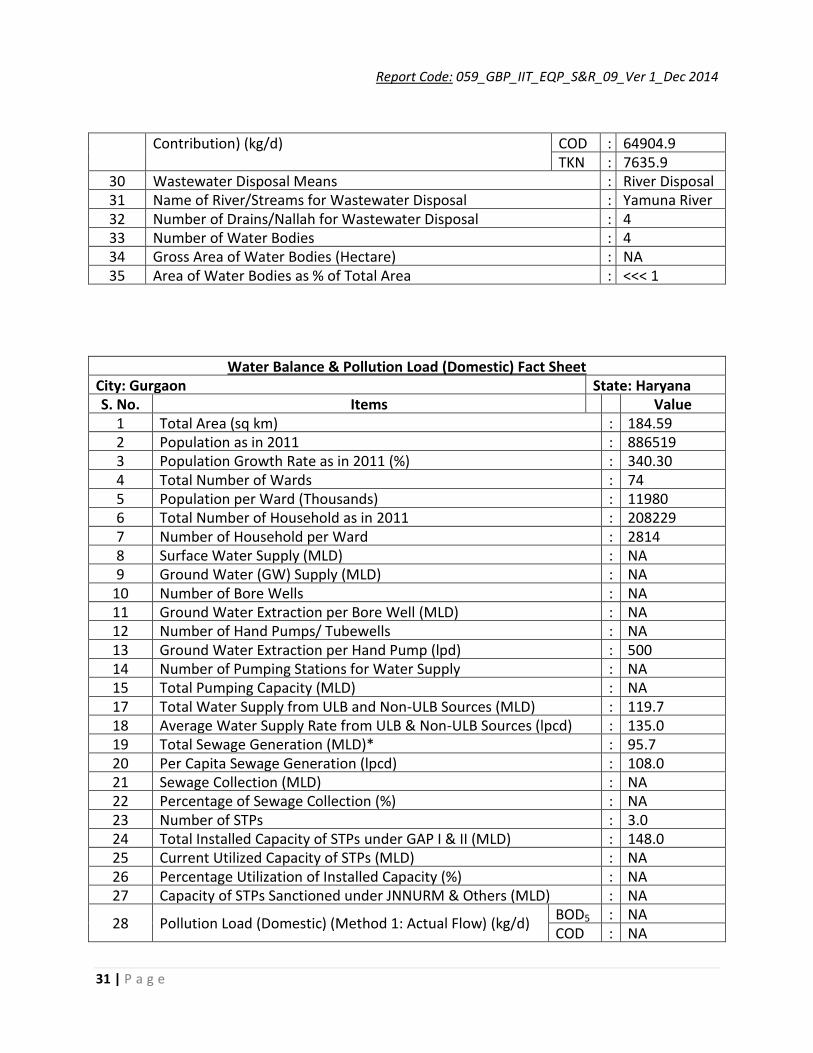
Contribution) (kg/d) COD : 64904.9 TKN : 7635.9
30 Wastewater Disposal Means : River Disposal 31 Name of River/Streams for Wastewater Disposal : Yamuna River 32 Number of Drains/Nallah for Wastewater Disposal : 4 33 Number of Water Bodies : 4 34 Gross Area of Water Bodies (Hectare) : NA 35 Area of Water Bodies as % of Total Area : <<< 1
Water Balance & Pollution Load (Domestic) Fact Sheet City: Gurgaon State: Haryana S. No. Items Value
1 Total Area (sq km) : 184.59 2 Population as in 2011 : 886519 3 Population Growth Rate as in 2011 (%) : 340.30 4 Total Number of Wards : 74 5 Population per Ward (Thousands) : 11980 6 Total Number of Household as in 2011 : 208229 7 Number of Household per Ward : 2814 8 Surface Water Supply (MLD) : NA 9 Ground Water (GW) Supply (MLD) : NA
10 Number of Bore Wells : NA 11 Ground Water Extraction per Bore Well (MLD) : NA 12 Number of Hand Pumps/ Tubewells : NA 13 Ground Water Extraction per Hand Pump (lpd) : 500 14 Number of Pumping Stations for Water Supply : NA 15 Total Pumping Capacity (MLD) : NA 17 Total Water Supply from ULB and Non-ULB Sources (MLD) : 119.7 18 Average Water Supply Rate from ULB & Non-ULB Sources (lpcd) : 135.0 19 Total Sewage Generation (MLD)* : 95.7 20 Per Capita Sewage Generation (lpcd) : 108.0 21 Sewage Collection (MLD) : NA 22 Percentage of Sewage Collection (%) : NA 23 Number of STPs : 3.0 24 Total Installed Capacity of STPs under GAP I & II (MLD) : 148.0 25 Current Utilized Capacity of STPs (MLD) : NA 26 Percentage Utilization of Installed Capacity (%) : NA 27 Capacity of STPs Sanctioned under JNNURM & Others (MLD) : NA
28 Pollution Load (Domestic) (Method 1: Actual Flow) (kg/d) BOD5 : NA COD : NA
Report Code: 059_GBP_IIT_EQP_S&R_09_Ver 1_Dec 2014
32 | P a g e
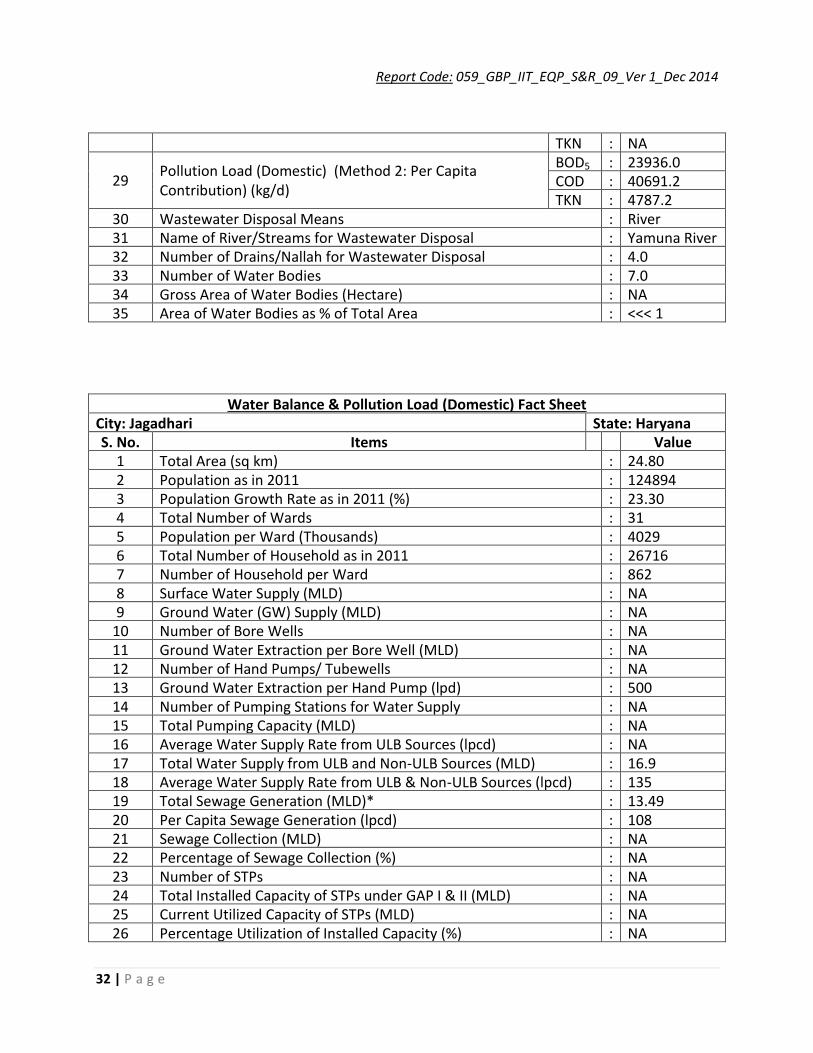
TKN : NA
29 Pollution Load (Domestic) (Method 2: Per Capita Contribution) (kg/d)
BOD5 : 23936.0 COD : 40691.2 TKN : 4787.2
30 Wastewater Disposal Means : River Disposal 31 Name of River/Streams for Wastewater Disposal : Yamuna River
32 Number of Drains/Nallah for Wastewater Disposal : 4.0 33 Number of Water Bodies : 7.0 34 Gross Area of Water Bodies (Hectare) : NA 35 Area of Water Bodies as % of Total Area : <<< 1
Water Balance & Pollution Load (Domestic) Fact Sheet City: Jagadhari State: Haryana S. No. Items Value
1 Total Area (sq km) : 24.80 2 Population as in 2011 : 124894 3 Population Growth Rate as in 2011 (%) : 23.30 4 Total Number of Wards : 31 5 Population per Ward (Thousands) : 4029 6 Total Number of Household as in 2011 : 26716 7 Number of Household per Ward : 862 8 Surface Water Supply (MLD) : NA 9 Ground Water (GW) Supply (MLD) : NA
10 Number of Bore Wells : NA 11 Ground Water Extraction per Bore Well (MLD) : NA 12 Number of Hand Pumps/ Tubewells : NA 13 Ground Water Extraction per Hand Pump (lpd) : 500 14 Number of Pumping Stations for Water Supply : NA 15 Total Pumping Capacity (MLD) : NA 16 Average Water Supply Rate from ULB Sources (lpcd) : NA 17 Total Water Supply from ULB and Non-ULB Sources (MLD) : 16.9 18 Average Water Supply Rate from ULB & Non-ULB Sources (lpcd) : 135 19 Total Sewage Generation (MLD)* : 13.49 20 Per Capita Sewage Generation (lpcd) : 108 21 Sewage Collection (MLD) : NA 22 Percentage of Sewage Collection (%) : NA 23 Number of STPs : NA 24 Total Installed Capacity of STPs under GAP I & II (MLD) : NA 25 Current Utilized Capacity of STPs (MLD) : NA 26 Percentage Utilization of Installed Capacity (%) : NA
Report Code: 059_GBP_IIT_EQP_S&R_09_Ver 1_Dec 2014
33 | P a g e
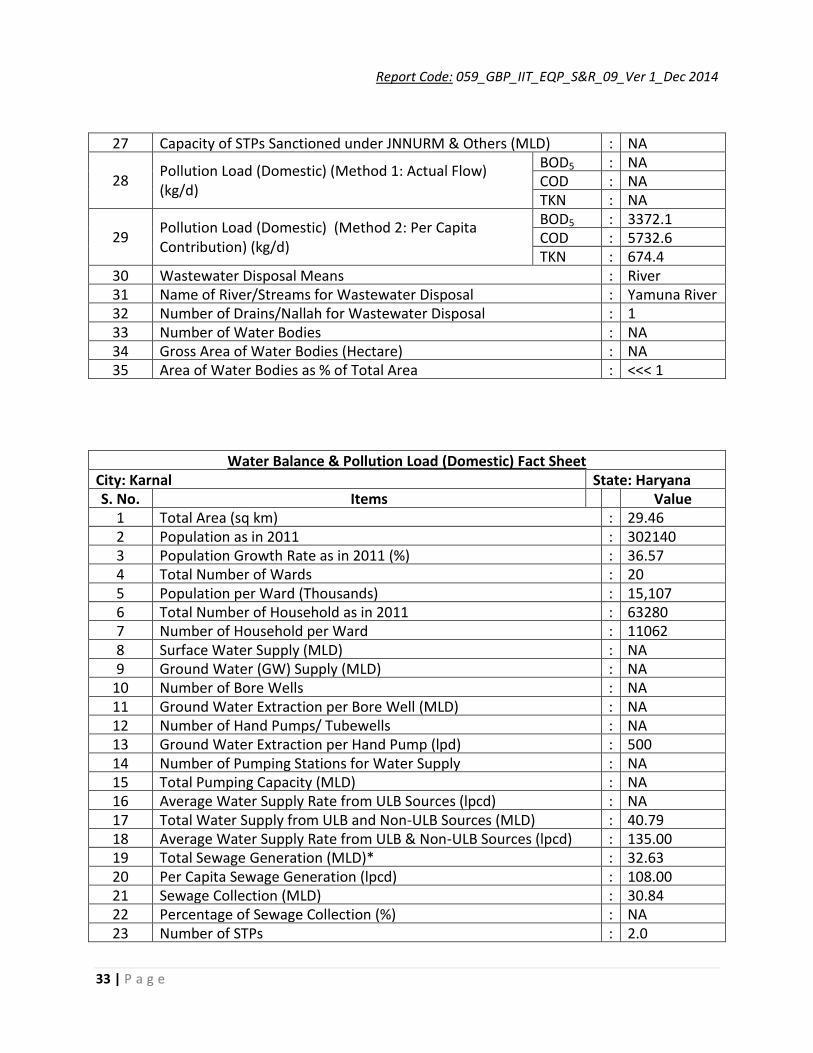
27 Capacity of STPs Sanctioned under JNNURM & Others (MLD) : NA
28 Pollution Load (Domestic) (Method 1: Actual Flow) (kg/d)
BOD5 : NA COD : NA TKN : NA
29 Pollution Load (Domestic) (Method 2: Per Capita Contribution) (kg/d)
BOD5 : 3372.1 COD : 5732.6 TKN : 674.4
30 Wastewater Disposal Means : River Disposal 31 Name of River/Streams for Wastewater Disposal : Yamuna River
32 Number of Drains/Nallah for Wastewater Disposal : 1 33 Number of Water Bodies : NA 34 Gross Area of Water Bodies (Hectare) : NA 35 Area of Water Bodies as % of Total Area : <<< 1
Water Balance & Pollution Load (Domestic) Fact Sheet City: Karnal State: Haryana S. No. Items Value
1 Total Area (sq km) : 29.46 2 Population as in 2011 : 302140 3 Population Growth Rate as in 2011 (%) : 36.57 4 Total Number of Wards : 20 5 Population per Ward (Thousands) : 15,107 6 Total Number of Household as in 2011 : 63280 7 Number of Household per Ward : 11062 8 Surface Water Supply (MLD) : NA 9 Ground Water (GW) Supply (MLD) : NA
10 Number of Bore Wells : NA 11 Ground Water Extraction per Bore Well (MLD) : NA 12 Number of Hand Pumps/ Tubewells : NA 13 Ground Water Extraction per Hand Pump (lpd) : 500 14 Number of Pumping Stations for Water Supply : NA 15 Total Pumping Capacity (MLD) : NA 16 Average Water Supply Rate from ULB Sources (lpcd) : NA 17 Total Water Supply from ULB and Non-ULB Sources (MLD) : 40.79 18 Average Water Supply Rate from ULB & Non-ULB Sources (lpcd) : 135.00 19 Total Sewage Generation (MLD)* : 32.63 20 Per Capita Sewage Generation (lpcd) : 108.00 21 Sewage Collection (MLD) : 30.84 22 Percentage of Sewage Collection (%) : NA 23 Number of STPs : 2.0

Report Code: 059_GBP_IIT_EQP_S&R_09_Ver 1_Dec 2014
34 | P a g e
24 Total Installed Capacity of STPs under GAP I & II (MLD) : 48.0 25 Current Utilized Capacity of STPs (MLD) : NA 26 Percentage Utilization of Installed Capacity (%) : NA 27 Capacity of STPs Sanctioned under JNNURM & Others (MLD) : NA
28 Pollution Load (Domestic) (Method 1: Actual Flow) (kg/d)
BOD5 : NA COD : NA TKN : NA
29 Pollution Load (Domestic) (Method 2: Per Capita Contribution) (kg/d)
BOD5 : 8157.8 COD : 13868.2 TKN : 1631.6
30 Wastewater Disposal Means : River Disposal 31 Name of River/Streams for Wastewater Disposal : Yamuna River 32 Number of Drains/Nallah for Wastewater Disposal : 1 33 Number of Water Bodies : NA 34 Gross Area of Water Bodies (Hectare) : NA 35 Area of Water Bodies as % of Total Area : <<< 1
Water Balance & Pollution Load (Domestic) Fact Sheet City: Palwal State: Haryana S. No. Items Value
1 Total Area (sq km) : 8.42 2 Population as in 2011 : 131926 3 Population Growth Rate as in 2011 (%) : 30.98 4 Total Number of Wards : 32 5 Population per Ward (Thousands) : 4,123 6 Total Number of Household as in 2011 : 23742 7 Number of Household per Ward : 742 8 Surface Water Supply (MLD) : NA 9 Ground Water (GW) Supply (MLD) : NA
10 Number of Bore Wells : NA 11 Ground Water Extraction per Bore Well (MLD) : NA 12 Number of Hand Pumps/ Tube wells : NA 13 Ground Water Extraction per Hand Pump (lpd) : 500 14 Number of Pumping Stations for Water Supply : NA 15 Total Pumping Capacity (MLD) : NA 16 Average Water Supply Rate from ULB Sources (lpcd) : NA 17 Total Water Supply from ULB and Non-ULB Sources (MLD) : 17.81 18 Average Water Supply Rate from ULB & Non-ULB Sources (lpcd) : 135.00 19 Total Sewage Generation (MLD)* : 14.25 20 Per Capita Sewage Generation (lpcd) : 108.00

Report Code: 059_GBP_IIT_EQP_S&R_09_Ver 1_Dec 2014
35 | P a g e
21 Sewage Collection (MLD) : NA 22 Percentage of Sewage Collection (%) : NA 23 Number of STPs : 1 24 Total Installed Capacity of STPs under GAP I & II (MLD) : 9 25 Current Utilized Capacity of STPs (MLD) : 9 26 Percentage Utilization of Installed Capacity (%) : NA 27 Capacity of STPs Sanctioned under JNNURM & Others (MLD) : NA
28 Pollution Load (Domestic) (Method 1: Actual Flow) (kg/d) BOD5 : NA COD : NA TKN : NA
29 Pollution Load (Domestic) (Method 2: Per Capita Contribution) (kg/d)
BOD5 : 3562.0 COD : 6055.4 TKN : 712.4
30 Wastewater Disposal Means : River Disposal 31 Name of River/Streams for Wastewater Disposal : Yamuna River 32 Number of Drains/Nallah for Wastewater Disposal : 2 33 Number of Water Bodies : NA 34 Gross Area of Water Bodies (Hectare) : NA 35 Area of Water Bodies as % of Total Area : <<< 1
Water Balance & Pollution Load (Domestic) Fact Sheet City: Panipat State: Haryana S. No. Items Value
1 Total Area (sq km) : 21.86 2 Population as in 2011 : 295970 3 Population Growth Rate as in 2011 (%) : 10.07 4 Total Number of Wards : 24 5 Population per Ward (Thousands) : 12,332 6 Total Number of Household as in 2011 : 60905 7 Number of Household per Ward : 2538 8 Surface Water Supply (MLD) : NA 9 Ground Water (GW) Supply (MLD) : NA
10 Number of Bore Wells : NA 11 Ground Water Extraction per Bore Well (MLD) : NA 12 Number of Hand Pumps/ Tube wells : NA 13 Ground Water Extraction per Hand Pump (lpd) : 500 14 Number of Pumping Stations for Water Supply : 2 15 Total Pumping Capacity (MLD) : NA 16 Average Water Supply Rate from ULB Sources (lpcd) : NA 17 Total Water Supply from ULB and Non-ULB Sources (MLD) : 40.0
Report Code: 059_GBP_IIT_EQP_S&R_09_Ver 1_Dec 2014
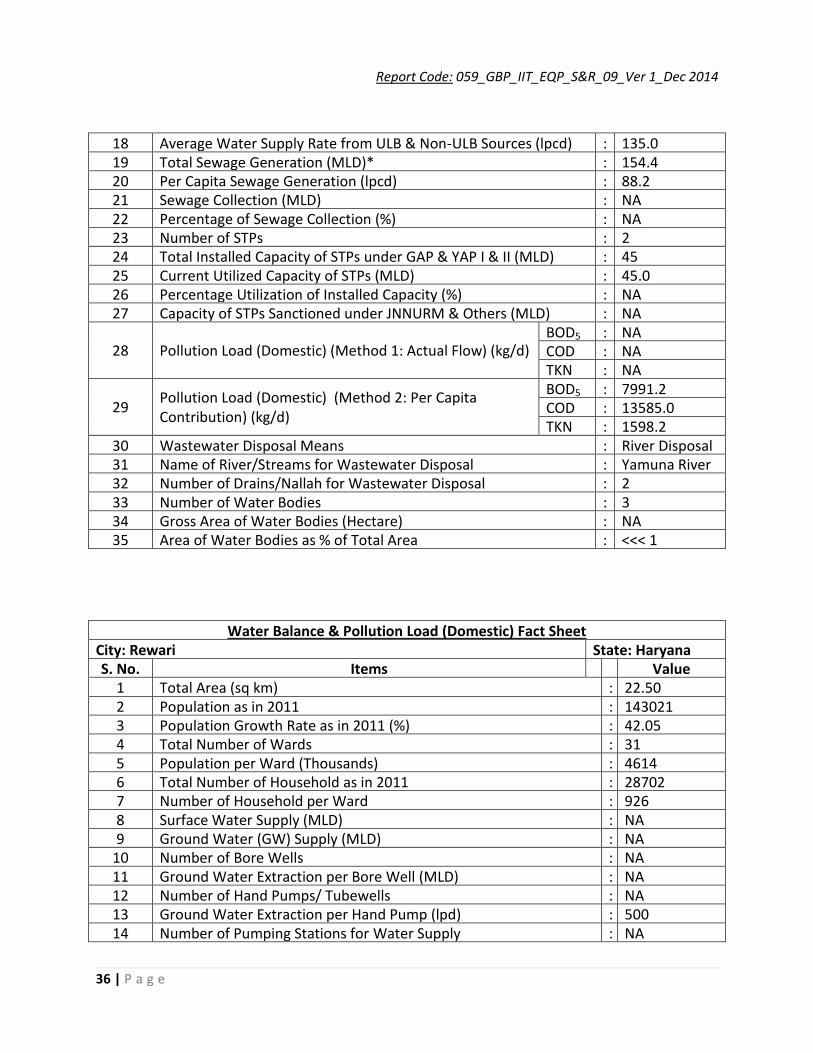
36 | P a g e
18 Average Water Supply Rate from ULB & Non-ULB Sources (lpcd) : 135.0 19 Total Sewage Generation (MLD)* : 154.4 20 Per Capita Sewage Generation (lpcd) : 88.2 21 Sewage Collection (MLD) : NA 22 Percentage of Sewage Collection (%) : NA 23 Number of STPs : 2 24 Total Installed Capacity of STPs under GAP & YAP I & II (MLD) : 45 25 Current Utilized Capacity of STPs (MLD) : 45.0 26 Percentage Utilization of Installed Capacity (%) : NA 27 Capacity of STPs Sanctioned under JNNURM & Others (MLD) : NA
28 Pollution Load (Domestic) (Method 1: Actual Flow) (kg/d) BOD5 : NA COD : NA TKN : NA
29 Pollution Load (Domestic) (Method 2: Per Capita Contribution) (kg/d)
BOD5 : 7991.2 COD : 13585.0 TKN : 1598.2
30 Wastewater Disposal Means : River Disposal 31 Name of River/Streams for Wastewater Disposal : Yamuna River 32 Number of Drains/Nallah for Wastewater Disposal : 2 33 Number of Water Bodies : 3 34 Gross Area of Water Bodies (Hectare) : NA 35 Area of Water Bodies as % of Total Area : <<< 1
Water Balance & Pollution Load (Domestic) Fact Sheet City: Rewari State: Haryana S. No. Items Value
1 Total Area (sq km) : 22.50 2 Population as in 2011 : 143021 3 Population Growth Rate as in 2011 (%) : 42.05 4 Total Number of Wards : 31 5 Population per Ward (Thousands) : 4614 6 Total Number of Household as in 2011 : 28702 7 Number of Household per Ward : 926 8 Surface Water Supply (MLD) : NA 9 Ground Water (GW) Supply (MLD) : NA
10 Number of Bore Wells : NA 11 Ground Water Extraction per Bore Well (MLD) : NA 12 Number of Hand Pumps/ Tubewells : NA 13 Ground Water Extraction per Hand Pump (lpd) : 500 14 Number of Pumping Stations for Water Supply : NA

Report Code: 059_GBP_IIT_EQP_S&R_09_Ver 1_Dec 2014
37 | P a g e
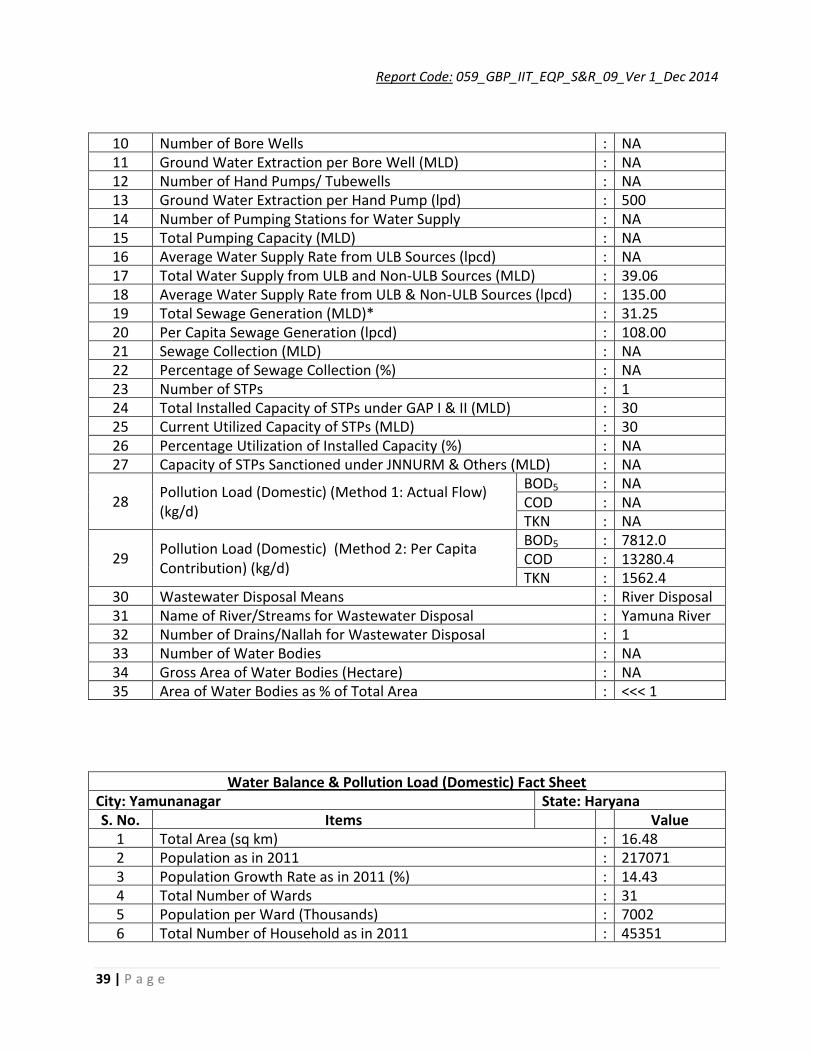
15 Total Pumping Capacity (MLD) : NA 17 Total Water Supply from ULB and Non-ULB Sources (MLD) : 19.3 18 Average Water Supply Rate from ULB & Non-ULB Sources (lpcd) : 135.0 19 Total Sewage Generation (MLD)* : 15.4 20 Per Capita Sewage Generation (lpcd) : 108.0 21 Sewage Collection (MLD) : NA 22 Percentage of Sewage Collection (%) : NA 23 Number of STPs : NA 24 Total Installed Capacity of STPs under GAP I & II (MLD) : NA 25 Current Utilized Capacity of STPs (MLD) : NA 26 Percentage Utilization of Installed Capacity (%) : NA 27 Capacity of STPs Sanctioned under JNNURM & Others (MLD) : NA
28 Pollution Load (Domestic) (Method 1: Actual Flow) (kg/d) BOD5 : NA COD : NA TKN : NA
29 Pollution Load (Domestic) (Method 2: Per Capita Contribution) (kg/d)
BOD5 : 3861.6 COD : 6564.7 TKN : 772.3
30 Wastewater Disposal Means : River Disposal 31 Name of River/Streams for Wastewater Disposal : Yamuna River 32 Number of Drains/Nallah for Wastewater Disposal : NA 33 Number of Water Bodies : NA 34 Gross Area of Water Bodies (Hectare) : NA 35 Area of Water Bodies as % of Total Area : <<< 1
Water Balance & Pollution Load (Domestic) Fact Sheet City: Rohtak State: Haryana S. No. Items Value
1 Total Area (sq km) : 72.18 2 Population as in 2011 : 374292 3 Population Growth Rate as in 2011 (%) : 27.06 4 Total Number of Wards : 31 5 Population per Ward (Thousands) : 12074 6 Total Number of Household as in 2011 : 75528 7 Number of Household per Ward : 2436 8 Surface Water Supply (MLD) : NA 9 Ground Water (GW) Supply (MLD) : NA
10 Number of Bore Wells : NA 11 Ground Water Extraction per Bore Well (MLD) : NA 12 Number of Hand Pumps/ Tubewells : NA

Report Code: 059_GBP_IIT_EQP_S&R_09_Ver 1_Dec 2014
38 | P a g e
13 Ground Water Extraction per Hand Pump (lpd) : 500 14 Number of Pumping Stations for Water Supply : NA 15 Total Pumping Capacity (MLD) : NA 16 Average Water Supply Rate from ULB Sources (lpcd) : NA 17 Total Water Supply from ULB and Non-ULB Sources (MLD) : 50.5 18 Average Water Supply Rate from ULB & Non-ULB Sources (lpcd) : 135.0 19 Total Sewage Generation (MLD)* : 40.4 20 Per Capita Sewage Generation (lpcd) : 108.0 21 Sewage Collection (MLD) : NA 22 Percentage of Sewage Collection (%) : NA 23 Number of STPs : 3 24 Total Installed Capacity of STPs under GAP & YAP I & II (MLD) : 20 25 Current Utilized Capacity of STPs (MLD) : NA 26 Percentage Utilization of Installed Capacity (%) : NA 27 Capacity of STPs Sanctioned under JNNURM & Others (MLD) : 16.0
28 Pollution Load (Domestic) (Method 1: Actual Flow) (kg/d) BOD5 : NA COD : NA TKN : NA
29 Pollution Load (Domestic) (Method 2: Per Capita Contribution) (kg/d)
BOD5 : 10105.9 COD : 17180.0 TKN : 2021.2
30 Wastewater Disposal Means : River Disposal 31 Name of River/Streams for Wastewater Disposal : Yamuna River 32 Number of Drains/Nallah for Wastewater Disposal : 2 33 Number of Water Bodies : 4 34 Gross Area of Water Bodies (Hectare) : 6.88 35 Area of Water Bodies as % of Total Area : <<< 1
Water Balance & Pollution Load (Domestic) Fact Sheet City: Sonipat State: Haryana S. No. Items Value
1 Total Area (sq km) : 42.61 2 Population as in 2011 : 289333 3 Population Growth Rate as in 2011 (%) : 28.55 4 Total Number of Wards : 31 5 Population per Ward (Thousands) : 9,333 6 Total Number of Household as in 2011 : 57740 7 Number of Household per Ward : 1863 8 Surface Water Supply (MLD) : NA 9 Ground Water (GW) Supply (MLD) : NA
Report Code: 059_GBP_IIT_EQP_S&R_09_Ver 1_Dec 2014
39 | P a g e
10 Number of Bore Wells : NA 11 Ground Water Extraction per Bore Well (MLD) : NA 12 Number of Hand Pumps/ Tubewells : NA 13 Ground Water Extraction per Hand Pump (lpd) : 500 14 Number of Pumping Stations for Water Supply : NA 15 Total Pumping Capacity (MLD) : NA 16 Average Water Supply Rate from ULB Sources (lpcd) : NA 17 Total Water Supply from ULB and Non-ULB Sources (MLD) : 39.06 18 Average Water Supply Rate from ULB & Non-ULB Sources (lpcd) : 135.00 19 Total Sewage Generation (MLD)* : 31.25 20 Per Capita Sewage Generation (lpcd) : 108.00 21 Sewage Collection (MLD) : NA 22 Percentage of Sewage Collection (%) : NA 23 Number of STPs : 1 24 Total Installed Capacity of STPs under GAP I & II (MLD) : 30 25 Current Utilized Capacity of STPs (MLD) : 30 26 Percentage Utilization of Installed Capacity (%) : NA 27 Capacity of STPs Sanctioned under JNNURM & Others (MLD) : NA
28 Pollution Load (Domestic) (Method 1: Actual Flow) (kg/d)
BOD5 : NA COD : NA TKN : NA
29 Pollution Load (Domestic) (Method 2: Per Capita Contribution) (kg/d)
BOD5 : 7812.0 COD : 13280.4 TKN : 1562.4
30 Wastewater Disposal Means : River Disposal 31 Name of River/Streams for Wastewater Disposal : Yamuna River 32 Number of Drains/Nallah for Wastewater Disposal : 1 33 Number of Water Bodies : NA 34 Gross Area of Water Bodies (Hectare) : NA 35 Area of Water Bodies as % of Total Area : <<< 1
Water Balance & Pollution Load (Domestic) Fact Sheet City: Yamunanagar State: Haryana S. No. Items Value
1 Total Area (sq km) : 16.48 2 Population as in 2011 : 217071 3 Population Growth Rate as in 2011 (%) : 14.43 4 Total Number of Wards : 31 5 Population per Ward (Thousands) : 7002 6 Total Number of Household as in 2011 : 45351
Report Code: 059_GBP_IIT_EQP_S&R_09_Ver 1_Dec 2014
40 | P a g e
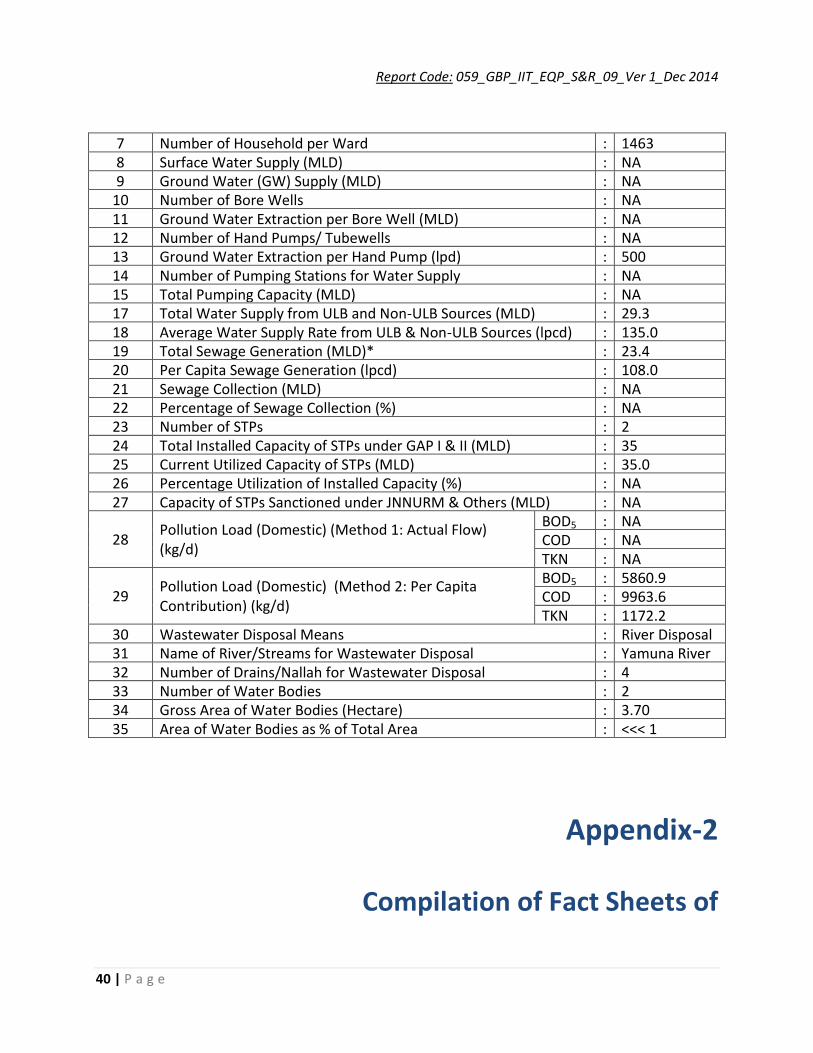
7 Number of Household per Ward : 1463 8 Surface Water Supply (MLD) : NA 9 Ground Water (GW) Supply (MLD) : NA
10 Number of Bore Wells : NA 11 Ground Water Extraction per Bore Well (MLD) : NA 12 Number of Hand Pumps/ Tubewells : NA 13 Ground Water Extraction per Hand Pump (lpd) : 500 14 Number of Pumping Stations for Water Supply : NA 15 Total Pumping Capacity (MLD) : NA 17 Total Water Supply from ULB and Non-ULB Sources (MLD) : 29.3 18 Average Water Supply Rate from ULB & Non-ULB Sources (lpcd) : 135.0 19 Total Sewage Generation (MLD)* : 23.4 20 Per Capita Sewage Generation (lpcd) : 108.0 21 Sewage Collection (MLD) : NA 22 Percentage of Sewage Collection (%) : NA 23 Number of STPs : 2 24 Total Installed Capacity of STPs under GAP I & II (MLD) : 35 25 Current Utilized Capacity of STPs (MLD) : 35.0 26 Percentage Utilization of Installed Capacity (%) : NA 27 Capacity of STPs Sanctioned under JNNURM & Others (MLD) : NA
28 Pollution Load (Domestic) (Method 1: Actual Flow) (kg/d)
BOD5 : NA COD : NA TKN : NA
29 Pollution Load (Domestic) (Method 2: Per Capita Contribution) (kg/d)
BOD5 : 5860.9 COD : 9963.6 TKN : 1172.2
30 Wastewater Disposal Means : River Disposal 31 Name of River/Streams for Wastewater Disposal : Yamuna River 32 Number of Drains/Nallah for Wastewater Disposal : 4 33 Number of Water Bodies : 2 34 Gross Area of Water Bodies (Hectare) : 3.70 35 Area of Water Bodies as % of Total Area : <<< 1
Appendix-2
Compilation of Fact Sheets of
Report Code: 059_GBP_IIT_EQP_S&R_09_Ver 1_Dec 2014
41 | P a g e
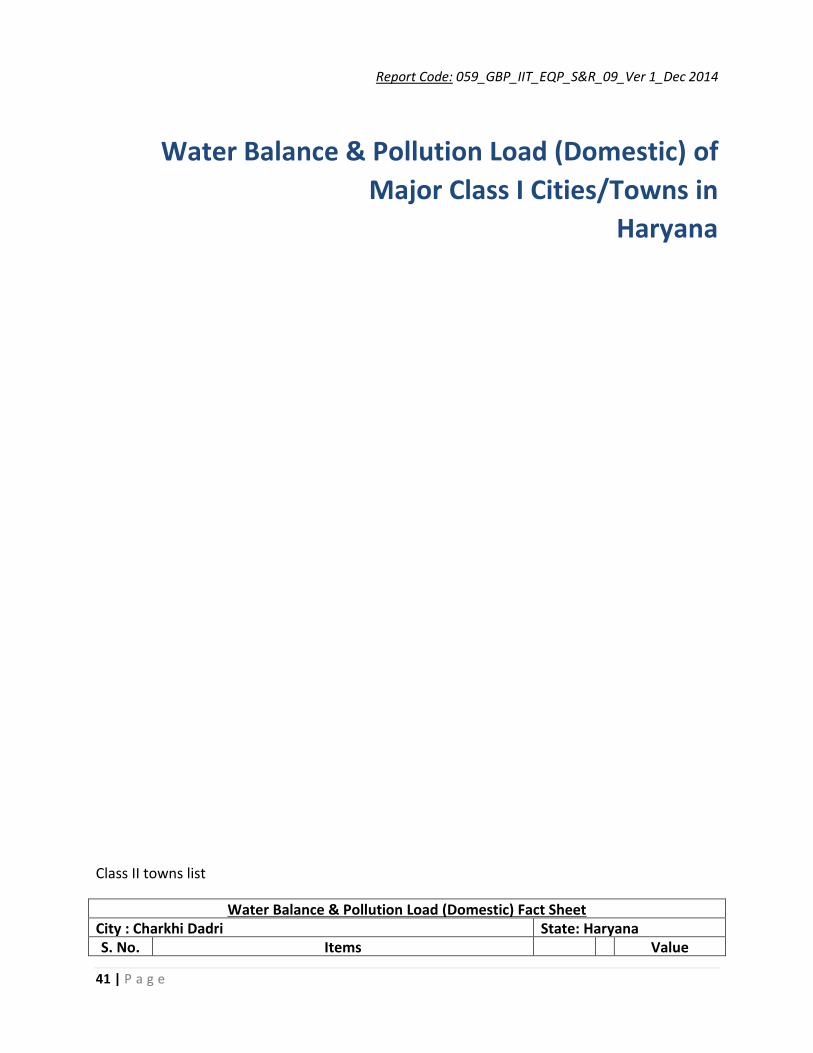
Water Balance & Pollution Load (Domestic) of
Major Class I Cities/Towns in
Haryana
Class II towns list
Water Balance & Pollution Load (Domestic) Fact Sheet City : Charkhi Dadri State: Haryana S. No. Items Value

Report Code: 059_GBP_IIT_EQP_S&R_09_Ver 1_Dec 2014
42 | P a g e
1 Total Area (sq km) : 5.42 2 Population as in 2011 : 56337 3 Population Growth Rate as in 2011 (%) : 25.49 4 Total Number of Wards : 19 5 Population per Ward (Thousands) : 2965 6 Total Number of Household as in 2011 : 11074 7 Number of Household per Ward : 583 8 Surface Water Supply (MLD) : NA 9 Ground Water (GW) Supply (MLD) : NA
10 Number of Bore Wells : NA 11 Ground Water Extraction per Bore Well (MLD) : NA 12 Number of Hand Pumps/ Tubewells : NA 13 Ground Water Extraction per Hand Pump (lpd) : 500 14 Number of Pumping Stations for Water Supply : NA 15 Total Pumping Capacity (MLD) : NA 16 Average Water Supply Rate from ULB Sources (lpcd) : NA 17 Total Water Supply from ULB and Non-ULB Sources (MLD) : 7.61 18 Average Water Supply Rate from ULB & Non-ULB Sources (lpcd) : 135 19 Total Sewage Generation (MLD)* : 6.08 20 Per Capita Sewage Generation (lpcd) : 108 21 Sewage Collection (MLD) : NA 22 Percentage of Sewage Collection (%) : NA 23 Number of STPs : 1 24 Total Installed Capacity of STPs under GAP I & II (MLD) : 9 25 Current Utilized Capacity of STPs (MLD) : 5.9 26 Percentage Utilization of Installed Capacity (%) : NA 27 Capacity of STPs Sanctioned under JNNURM & Others (MLD) : NA
28 Pollution Load (Domestic) (Method 1: Actual Flow) (kg/d) BOD5 : NA COD : NA TKN : NA
29 Pollution Load (Domestic) (Method 2: Per Capita Contribution) (kg/d)
BOD5 : 1521.1 COD : 2585.9 TKN : 304.2
30 Wastewater Disposal Means : River Disposal 31 Name of River/Streams for Wastewater Disposal : Yamuna River 32 Number of Drains/Nallah for Wastewater Disposal : 1 33 Number of Water Bodies : NA 34 Gross Area of Water Bodies (Hectare) : NA 35 Area of Water Bodies as % of Total Area : <<< 1
Water Balance & Pollution Load (Domestic) Fact Sheet City: Gohana State: Haryana

Report Code: 059_GBP_IIT_EQP_S&R_09_Ver 1_Dec 2014
43 | P a g e
S. No. Items Value 1 Total Area (sq km) : 11.51 2 Population as in 2011 : 65708 3 Population Growth Rate as in 2011 (%) : 35.39 4 Total Number of Wards : 21 5 Population per Ward (Thousands) : 3,129 6 Total Number of Household as in 2011 : 12477 7 Number of Household per Ward : 594 8 Surface Water Supply (MLD) : NA 9 Ground Water (GW) Supply (MLD) : NA
10 Number of Bore Wells : NA 11 Ground Water Extraction per Bore Well (MLD) : NA 12 Number of Hand Pumps/ Tubewells : NA 13 Ground Water Extraction per Hand Pump (lpd) : 500 14 Number of Pumping Stations for Water Supply : NA 15 Total Pumping Capacity (MLD) : NA 16 Average Water Supply Rate from ULB Sources (lpcd) : NA 17 Total Water Supply from ULB and Non-ULB Sources (MLD) : 8.87 18 Average Water Supply Rate from ULB & Non-ULB Sources (lpcd) : 135.00 19 Total Sewage Generation (MLD)* : 7.10 20 Per Capita Sewage Generation (lpcd) : 108.00 21 Sewage Collection (MLD) : NA 22 Percentage of Sewage Collection (%) : NA 23 Number of STPs : NA 24 Total Installed Capacity of STPs under GAP I & II (MLD) : NA 25 Current Utilized Capacity of STPs (MLD) : NA 26 Percentage Utilization of Installed Capacity (%) : NA 27 Capacity of STPs Sanctioned under JNNURM & Others (MLD) : NA
28 Pollution Load (Domestic) (Method 1: Actual Flow) (kg/d)
BOD5 : NA COD : NA TKN : NA
29 Pollution Load (Domestic) (Method 2: Per Capita Contribution) (kg/d)
BOD5 : 1774.1 COD : 3016.0 TKN : 354.8
30 Wastewater Disposal Means : River Disposal 31 Name of River/Streams for Wastewater Disposal : Yamuna River 32 Number of Drains/Nallah for Wastewater Disposal : NA 33 Number of Water Bodies : NA 34 Gross Area of Water Bodies (Hectare) : NA 35 Area of Water Bodies as % of Total Area : <<< 1

Report Code: 059_GBP_IIT_EQP_S&R_09_Ver 1_Dec 2014
44 | P a g e
Water Balance & Pollution Load (Domestic) Fact Sheet City: Hodal State: Haryana S. No. Items Value
1 Total Area (sq km) : 5.39 2 Population as in 2011 : 50143 3 Population Growth Rate as in 2011 (%) : 30.89 4 Total Number of Wards : 17 5 Population per Ward (Thousands) : 2,950 6 Total Number of Household as in 2011 : 8579 7 Number of Household per Ward : 505 8 Surface Water Supply (MLD) : NA 9 Ground Water (GW) Supply (MLD) : NA
10 Number of Bore Wells : NA 11 Ground Water Extraction per Bore Well (MLD) : NA 12 Number of Hand Pumps/ Tubewells : NA 13 Ground Water Extraction per Hand Pump (lpd) : 500 14 Number of Pumping Stations for Water Supply : NA 15 Total Pumping Capacity (MLD) : NA 16 Average Water Supply Rate from ULB Sources (lpcd) : NA 17 Total Water Supply from ULB and Non-ULB Sources (MLD) : 6.77 18 Average Water Supply Rate from ULB & Non-ULB Sources (lpcd) : 135 19 Total Sewage Generation (MLD)* : 5.42 20 Per Capita Sewage Generation (lpcd) : 108.00 21 Sewage Collection (MLD) : NA 22 Percentage of Sewage Collection (%) : NA 23 Number of STPs : NA 24 Total Installed Capacity of STPs under GAP I & II (MLD) : NA 25 Current Utilized Capacity of STPs (MLD) : NA 26 Percentage Utilization of Installed Capacity (%) : NA 27 Capacity of STPs Sanctioned under JNNURM & Others (MLD) : NA
28 Pollution Load (Domestic) (Method 1: Actual Flow) (kg/d) BOD5 : NA COD : NA TKN : NA
29 Pollution Load (Domestic) (Method 2: Per Capita Contribution) (kg/d)
BOD5 : 1353.9 COD : 2301.6 TKN : 270.8
30 Wastewater Disposal Means : River Disposal 31 Name of River/Streams for Wastewater Disposal : Yamuna River 32 Number of Drains/Nallah for Wastewater Disposal : NA 33 Number of Water Bodies : NA 34 Gross Area of Water Bodies (Hectare) : NA 35 Area of Water Bodies as % of Total Area : <<< 1
Report Code: 059_GBP_IIT_EQP_S&R_09_Ver 1_Dec 2014
45 | P a g e
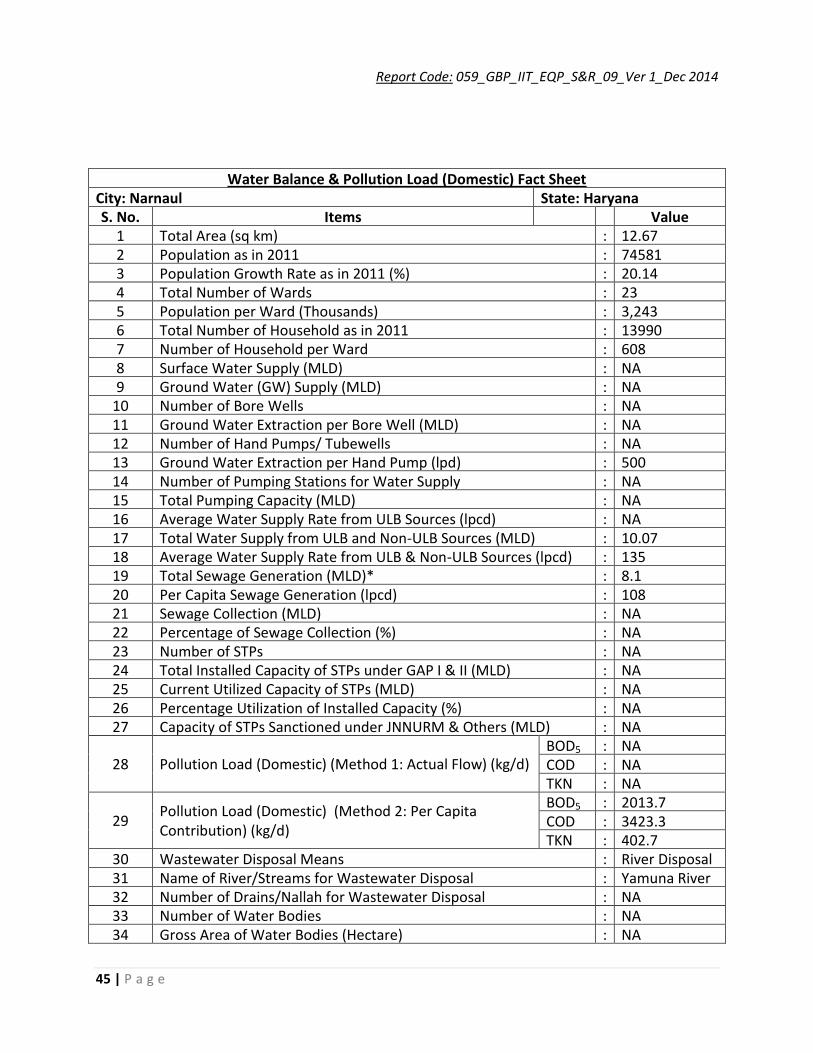
Water Balance & Pollution Load (Domestic) Fact Sheet City: Narnaul State: Haryana S. No. Items Value
1 Total Area (sq km) : 12.67 2 Population as in 2011 : 74581 3 Population Growth Rate as in 2011 (%) : 20.14 4 Total Number of Wards : 23 5 Population per Ward (Thousands) : 3,243 6 Total Number of Household as in 2011 : 13990 7 Number of Household per Ward : 608 8 Surface Water Supply (MLD) : NA 9 Ground Water (GW) Supply (MLD) : NA
10 Number of Bore Wells : NA 11 Ground Water Extraction per Bore Well (MLD) : NA 12 Number of Hand Pumps/ Tubewells : NA 13 Ground Water Extraction per Hand Pump (lpd) : 500 14 Number of Pumping Stations for Water Supply : NA 15 Total Pumping Capacity (MLD) : NA 16 Average Water Supply Rate from ULB Sources (lpcd) : NA 17 Total Water Supply from ULB and Non-ULB Sources (MLD) : 10.07 18 Average Water Supply Rate from ULB & Non-ULB Sources (lpcd) : 135 19 Total Sewage Generation (MLD)* : 8.1 20 Per Capita Sewage Generation (lpcd) : 108 21 Sewage Collection (MLD) : NA 22 Percentage of Sewage Collection (%) : NA 23 Number of STPs : NA 24 Total Installed Capacity of STPs under GAP I & II (MLD) : NA 25 Current Utilized Capacity of STPs (MLD) : NA 26 Percentage Utilization of Installed Capacity (%) : NA 27 Capacity of STPs Sanctioned under JNNURM & Others (MLD) : NA
28 Pollution Load (Domestic) (Method 1: Actual Flow) (kg/d) BOD5 : NA COD : NA TKN : NA
29 Pollution Load (Domestic) (Method 2: Per Capita Contribution) (kg/d)
BOD5 : 2013.7 COD : 3423.3 TKN : 402.7
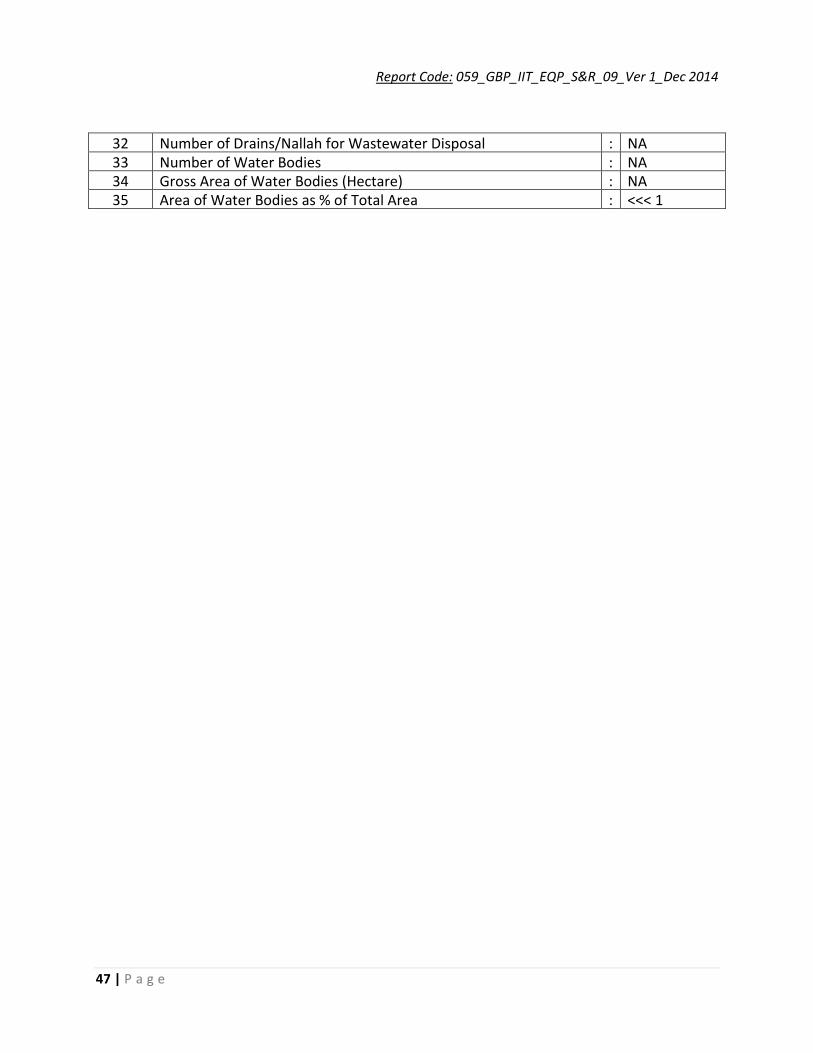
30 Wastewater Disposal Means : River Disposal 31 Name of River/Streams for Wastewater Disposal : Yamuna River 32 Number of Drains/Nallah for Wastewater Disposal : NA 33 Number of Water Bodies : NA 34 Gross Area of Water Bodies (Hectare) : NA

Report Code: 059_GBP_IIT_EQP_S&R_09_Ver 1_Dec 2014
46 | P a g e
35 Area of Water Bodies as % of Total Area : <<< 1
Water Balance & Pollution Load (Domestic) Fact Sheet City: Panipat Taraf Makhdum Zadgan State: Haryana S. No. Items Value
1 Total Area (sq km) : 6.54 2 Population as in 2011 : 67998 3 Population Growth Rate as in 2011 (%) : 93.42 4 Total Number of Wards : 1 5 Population per Ward (Thousands) : 67,998 6 Total Number of Household as in 2011 : 14066 7 Number of Household per Ward : 14066 8 Surface Water Supply (MLD) : NA 9 Ground Water (GW) Supply (MLD) : NA
10 Number of Bore Wells : NA 11 Ground Water Extraction per Bore Well (MLD) : NA 12 Number of Hand Pumps/ Tubewells : NA 13 Ground Water Extraction per Hand Pump (lpd) : 500 14 Number of Pumping Stations for Water Supply : NA 15 Total Pumping Capacity (MLD) : NA 16 Average Water Supply Rate from ULB Sources (lpcd) : NA 17 Total Water Supply from ULB and Non-ULB Sources (MLD) : 9.18 18 Average Water Supply Rate from ULB & Non-ULB Sources (lpcd) : 135.00 19 Total Sewage Generation (MLD)* : 7.34 20 Per Capita Sewage Generation (lpcd) : 108.00 21 Sewage Collection (MLD) : NA 22 Percentage of Sewage Collection (%) : NA 23 Number of STPs : NA 24 Total Installed Capacity of STPs under GAP I & II (MLD) : NA 25 Current Utilized Capacity of STPs (MLD) : NA 26 Percentage Utilization of Installed Capacity (%) : NA 27 Capacity of STPs Sanctioned under JNNURM & Others (MLD) : NA
28 Pollution Load (Domestic) (Method 1: Actual Flow) (kg/d) BOD5 : NA COD : NA TKN : NA
29 Pollution Load (Domestic) (Method 2: Per Capita Contribution) (kg/d)
BOD5 : 1835.9 COD : 3121.1 TKN : 367.2
30 Wastewater Disposal Means : River Disposal 31 Name of River/Streams for Wastewater Disposal : Yamuna River
Report Code: 059_GBP_IIT_EQP_S&R_09_Ver 1_Dec 2014
47 | P a g e
32 Number of Drains/Nallah for Wastewater Disposal : NA 33 Number of Water Bodies : NA 34 Gross Area of Water Bodies (Hectare) : NA 35 Area of Water Bodies as % of Total Area : <<< 1