assessment of e-waste status in port harcourt city and its...
TRANSCRIPT
Environmental Sciences, Vol. 3, 2015, no. 1, 45 - 66
HIKARI Ltd, www.m-hikari.com
http://dx.doi.org/10.12988/es.2015.521
Assessment of E-Waste Status in
Port Harcourt City and its Environs
R. S. Konya, B. B. Babatunde and D. Iniefe
Department of Animal and Environmental Biology, Faculty of Biological
Sciences, College of Natural and Applied Sciences, University of Port Harcourt,
P.M.B. 5323, Choba Port Harcourt, Rivers State, Nigeria
Copyright © 2015 R. S. Konya, B. B. Babatunde and D. Iniefe. This article is distributed under
the Creative Commons Attribution License, which permits unrestricted use, distribution, and
reproduction in any medium, provided the original work is properly cited.
Abstract
Port Harcourt is one the fastest growing cities in Nigeria witnessing high influx of
migrants seeking economic prosperity in the oil and gas companies there. The
consequence of such socioeconomic impact could range from increased
population, material consumption, generation of unprecedented quantity and
quality of waste and environmental contamination. Waste electrical electronic
equipment generated when these equipment go bad, old or obsolete has been on
the increase in developing nations due mainly to increase demand for information
and communication technology, technology advancement in the North and
consequent shipment of their old and discarded EEE to poor countries such as
Nigeria where most people cannot afford new ones. This has resulted to increase
WEEE generated since the life span of such EEE has most time expired or near
expiration before they were shipped to the poor countries. The WEEE so
generated enters the municipal solid waste stream after poor attempt by informal
collectors to recover useful materials from them exposing themselves and the
environment to hazardous materials present in WEEE. The present study is a
baseline attempt to analyse WEEE in Port Harcourt and Obio/Apkor Local
Government Areas in River State, Nigeria with the view to elucidating the
composition of e-waste in municipal solid waste in the state providing baseline
data needed for further research and sustainable management of e-waste. Four
settlements were selected in each of the LGAs and e-waste components were
enumerated and evaluated according to ASMTM 92 (2008) method of solid waste
analysis from several dumpsites. Electronic waste dominated all sampling
locations ranging from 71.2% at Eneka in Obio/Akpor LGA to 91.2% at Dioub in
Port Harcourt LGA. Computer and accessories was the most prominent e-waste
46 R. S. Konya et al.
followed by circuits of various electronic devices. Radio recorded the least overall
e-waste composition in all the sampling sites. The sustainable management of e-
waste in the state would require baseline data provided by this field work to be
combined with other studies such as consumer inventory and e-waste commerce
across the borders.
Keywords: Port Harcourt, e-waste composition, sustainable management
strategies
Introduction
Waste electrical and electronic equipment (WEEE) popularly known as e-waste
has fast become one of the major sources of contamination to the environment and
humans. The WEEE typically consist of discarded TV sets, refrigerators,
microwave ovens, mobile phones, computers and accessories, recordable
electronics such as DVDs, VCRs, tape recorder, radio and other audio visual
equipment Table 1. These discarded electrical and electronic goods contain a
range of toxic materials such as furans, dioxins, polycyclic aromatic hydrocarbons
(PAHs), polyhalogenated aromatic hydrocarbons (PHAHs), hydrogen chloride
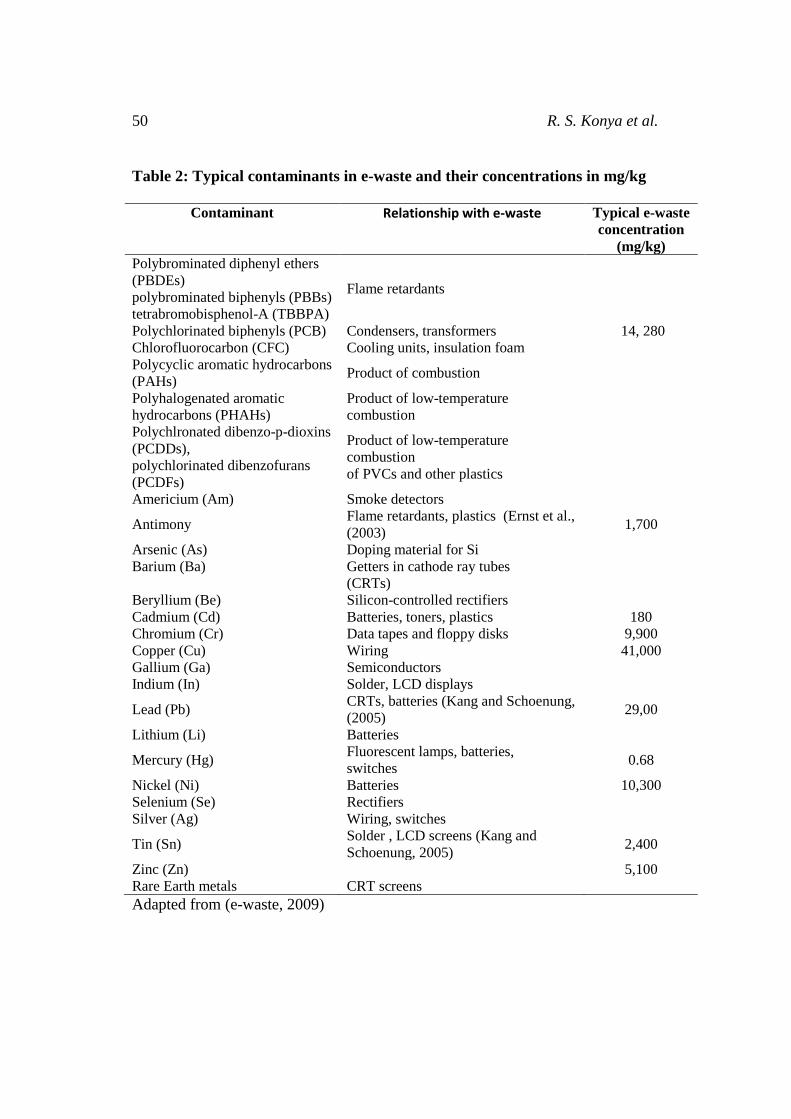
and heavy metals (Table 2). These toxic materials requires special handling prior
to disposal (Robinson, 2009; Sthiannopkao and Hung Wang, 2013) and can
become difficult and expensive to recycle safely with profit (Arora and GTZ-
Asem, 2008). In 2006, the world's production of e-waste was estimated at 20–50
million tonnes per year (UNEP, 2006), representing 1–3% of the global municipal
waste production of 1636 million tonnes per year (OECD, 2008) with most e-
waste being produced in Europe, the United States and Australasia. Cobbing
(2008) calculated that computers, mobile telephones and television sets would
contribute 5.5 million tonnes to the E-waste stream in 2010, rising to 9.8 million
tonnes in 2015. In rich countries, E-waste may constitute some 8% by volume of
municipal waste (Widmer et al. 2005). China, Eastern Europe and Latin America
will become major e-waste producers in the next ten years (Robison, 2009).
Computing is driving the generation of e-waste. According to Osibanjo and
Nnorom (2007), information and telecommunications technology (ICT) and
computer Internet networking has penetrated nearly every aspect of modern life,
and is positively affecting human life even in the most remote areas of the
developing countries. The rapid growth in ICT has led to an improvement in the
capacity of computers but simultaneously to a decrease in the products lifetime as
a result of which increasingly large quantities of waste electrical and electronic
equipment (e-waste) are generated annually (Arora and GTZ-Asem, 2008). Ladou
and Lovegrove, (2008) estimated that by the year 2013, more than one billion
computers would have been retired. The Greenpeace, (2008) report predicted the
global WEEE arising from PCs, mobile phones and televisions will be around
5,504,737 MT in the year 2010 and 9,762,935 MT by the year 2016. The UN esti-

Assessment of e-waste status in Port Harcourt city and its environs 47
mated that some 20-50 MT of e-waste is generated worldwide each year,
comprising more than 5% of all municipal solid waste (UNEP, 2008).
Debate on environmental, health and social problems associated with the
uncontrolled dumping and inappropriate recycling of e-waste has already reached
the mainstream of policy-makers in developed as well as developing countries.
However, most of the developing countries have not yet been able to enforce
national policies and legislations for managing e-waste. Furthermore, lack of
technology and skills, and unexplored business and financing opportunities,
coupled with an exponential growth in the use of electric and electronic
equipment in the developing countries, have led to severe challenges in terms of
managing e-waste in a proper manner (Prakash et al. 2010). As e-waste entails
several toxic and hazardous substances, its improper processing, recycling and
disposal leads to severe health hazards, environmental pollution and social
problems, not only for the people involved directly in e-waste related activities,
but also for the local communities and the society as a whole.
Developed countries have conventions, directives, and laws to regulate their
disposal, most based on extended producer responsibility (EPR). Manufacturers
take back items collected by retailers and local governments for safe destruction
or recovery of materials. Compliance, however, is difficult to assure, and
frequently runs against economic incentives. The expense of proper disposal leads
to the shipment of large amounts of e-waste to China, India, Pakistan, Nigeria,
and other developing countries. Shipment is often through middlemen, and under
tariff classifications that make quantities difficult to assess. Therefore, despite the
intents of regulations and hazardous waste laws, most e-waste is treated as general
refuse, or crudely processed, often by burning or acid baths, with recovery of only
a few materials of value (Sthiannopkao and Hung Wang, 2013). In the developing
worlds such as Nigeria, e-waste is simply dumped in municipal solid waste
streams without considerations for its potential harm to the environment and
human health (Orisakwe and Frazzoli, 2010).
According to Robison, (2009), effective reprocessing technology, which recovers
the valuable materials with minimal environmental impact, is expensive, so most
e-waste is disposed in landfills in the developed worlds with strict guidelines.
Consequently, although illegal under the Basel Convention, rich countries export
an unknown quantity of e-waste to poor countries, where inadequate recycling
techniques include burning and dissolution in strong acids with few measures to
protect human health and the environment is practiced. Such reprocessing initially
results in extreme localised contamination followed by migration of the
contaminants into receiving waters and food chains where they can become very
dangerous due to biomagnification at higher trophic levels (Orisakwe and
Frazzoli, 2010). E-Waste is chemically and physically distinct from other forms of
municipal or industrial waste; it contains both valuable and hazardous materials
that require special handling and recycling methods to avoid environmental conta-
48 R. S. Konya et al.
mination and detrimental effects on human health. Recycling can recover reusable
components and base materials, especially Cu and precious metals. However, due
to lack of facilities, high labour costs, and tough environmental regulations, rich
countries tend not to recycle e-waste. Instead, it is either landfilled, or exported
from rich countries to poor countries, where it may be recycled using primitive
techniques and little regard for worker safety or environmental protection
(Cobbing, 2008).
The problems of transfer of e-waste burden from rich to poor countries and
consequent lack of adequate regulations and facilities to dispose them in a safe
manner has given rise to the informal collectors who are now almost totally in
charge of the trade of e-waste across developing nations of the world. The
informal collection activities, involving door-to-door collection as well as
collection from the ware houses and dump sites seem to be operating in a very
effective manner. The informal collectors, also known as scavengers, buy or
scavenge the obsolete e-equipment from the end consumers at relatively low
prices and dismantle every part of the equipment to recover useful metals and
other materials before burning or final disposal at dumpsites. In Ghana for
instance, an obsolete desktop PC for US$ 1.0 to 2.5 and US$ 0.67 in Nigeria,
making this refurbishing of old and second-hand electrical and electronic
equipment also an important economic activity in these countries. In many cases,
collectors themselves conduct the dismantling, while in other cases, they pass on
the e-waste to specialised recyclers for the recovery of metals, such as aluminium,
copper and steel (Prakash et al. 2010). However, in most cases, these informal
collectors use primitive measures that exposed them and the environment to
contaminants present in the e-waste and in some cases, refurbished items are
recirculated/resold for use and may expose unsuspecting consumers to hazards
present in the item purchased.
The electronic waste forms 1% of solid waste on an average in developed
countries and is expected to grow to 2% by 2010. However in developing
countries, the e-waste can range from 0.01% to 1% of solid waste. The developing
countries will be the fastest growing segment of the e-Waste market with the
potential to triple output over the next five years with China, the leading country
(Arora and GTZ-Asem, 2008). In Nigeria, the domestic consumption of electrical
and electronic devices is increasing rapidly and consequently leading to rapidly
growing e-waste volumes. According to E-waste Africa Project, Nigeria’s e-waste
generation is by far the highest in all West African countries. These volumes,
along with the absence of environmentally sound management systems for this
particular waste stream, have manifold impacts on the environment, local
communities and the economic system in Nigeria. Although obsolete electric and
electronic devices undergo some basic form of recycling in Nigeria, many e-waste
fractions cannot be managed appropriately, which is resulting in the accumulation
of large hazardous waste volumes in and around major refurbishing and recycling
centres. Furthermore, some recycling practices – like the open burning of cables

Assessment of e-waste status in Port Harcourt city and its environs 49
and plastic parts – cause severe emissions of pollutants such as heavy metals and
dioxins. Additionally, electrical and electronic equipment contain a whole range
of valuable metals like copper, palladium, gold, silver, indium and germanium
that are lost if not recovered in an early stage of waste treatment. Port Harcourt
where the present study took place is a fast growing urban centre in Rivers State,
Nigeria experiencing high influx of people with consequent demand for electrical
and electronics goods. The present study was carried out to assess the current
status of e-waste in Port Harcourt city and its environs with a view to providing
scientific data necessary for an integrated and sustainable e-waste management in
the catchment area.
Table 1: Typical WEEE items
Item Weight (kg) Typical lifespan
Computers 25 3
Facsimile machine 3 5
High-fidelity system 10 10
Mobile telephone 0.1 2
Electronic games 3 5
Photocopier 60 8
Radio 2 10
Television 30 5
Video recorder and DVD player 5 5
Electricals
Air conditioning unit 55 12
Dish washer 50 10
Electric cooker 60 10
Electric heaters 5 20
Food mixer 1 5
Freezer 35 10
Hair dryer 1 10
Iron 1 10
Kettle 1 3
Microwave 15 7
Refrigerator 35 10
Telephone 1 5
Toaster 1 5
Tumble dryer 35 10
Vacuum cleaner 10 10
Washing machine
Sources: (Betts, 2008; Cobbing, 2008; Li et al., 2009).
50 R. S. Konya et al.
Table 2: Typical contaminants in e-waste and their concentrations in mg/kg
Contaminant Relationship with e-waste Typical e-waste
concentration
(mg/kg) Polybrominated diphenyl ethers
(PBDEs)
polybrominated biphenyls (PBBs)
tetrabromobisphenol-A (TBBPA)
Flame retardants
Polychlorinated biphenyls (PCB) Condensers, transformers 14, 280
Chlorofluorocarbon (CFC) Cooling units, insulation foam
Polycyclic aromatic hydrocarbons
(PAHs) Product of combustion
Polyhalogenated aromatic
hydrocarbons (PHAHs)
Product of low-temperature
combustion
Polychlronated dibenzo-p-dioxins
(PCDDs),
polychlorinated dibenzofurans
(PCDFs)
Product of low-temperature
combustion
of PVCs and other plastics
Americium (Am) Smoke detectors
Antimony Flame retardants, plastics (Ernst et al.,
(2003) 1,700
Arsenic (As) Doping material for Si
Barium (Ba) Getters in cathode ray tubes
(CRTs)
Beryllium (Be) Silicon-controlled rectifiers
Cadmium (Cd) Batteries, toners, plastics 180
Chromium (Cr) Data tapes and floppy disks 9,900
Copper (Cu) Wiring 41,000
Gallium (Ga) Semiconductors
Indium (In) Solder, LCD displays
Lead (Pb) CRTs, batteries (Kang and Schoenung,
(2005) 29,00
Lithium (Li) Batteries
Mercury (Hg) Fluorescent lamps, batteries,
switches 0.68
Nickel (Ni) Batteries 10,300
Selenium (Se) Rectifiers
Silver (Ag) Wiring, switches
Tin (Sn) Solder , LCD screens (Kang and
Schoenung, 2005) 2,400
Zinc (Zn) 5,100
Rare Earth metals CRT screens
Adapted from (e-waste, 2009)
Assessment of e-waste status in Port Harcourt city and its environs 51
Materials and Methods
Rivers State where this study was carried out is a maritime state in the southern
geopolitical zone of Nigeria (Figure 1) located on 4°45′0″ and 4.75 N and 6°50′0″
and 6°83′3″ E. It has a total population of 5,198,716 (NPC, 2006) comprising of
23 local government areas with Port Harcourt, the state capital as one of the Local
Government Areas (LGA) Figure 2. For the analysis of e-waste composition in
municipal solid waste, two LGAs, Port Harcourt LGA and Obio/Akpor LGA were
chosen according to the category of inhabitants and socioeconomic activities and
because they share boundary and commerce. Port Harcourt LGA is the main
urban centre in Rivers State but houses some shanties as well. Obio/Akpor is
presumably the richest LGA in Rivers State and houses most of the
multinationals. Detail characteristics of the settlements studied under the three
LGAs in this study is presented in Table 3.
Sampling and data collection
The determination of the composition of e-waste in unprocessed municipal solid
waste during this study was done according to ASTM D5231 - 92(2008) Standard
Test Method which involves the direct sampling of solid waste from specific
sources, a labour-intensive manual process of sorting, classifying and weighing all
items in each sampling unit and a detailed recording of the data. In each LGA,
five distinct communities were selected and five open dumps in each community
surveyed. Ten quadrants of two square meters each were drawn at each open
dump and WEEE components such as TV sets, DVDs, VCRs, Computers and
accessories and radio were counted and classified into two major categories
namely Electrical and Electronics. In each case, the ten quadrants sufficiently
covered the waste dump up to 90%. Secondary data of municipal solid waste
composition of the study sites (Babatunde et al. 2013) was used to estimate
percentage composition of e-waste at each dump site. Statistical quantities such as
the mean, standard deviation and standard error were used to summarise the
findings in this study. Standard deviation showed variation in the values of
variables from the mean and standard error of the mean (SEM) represents the
spread that the mean of a sample of values will have if one keeps taking samples.

52 R. S. Konya et al.
Fig. 1: Map of Nigeria showing Rivers State.
Fig 2: Rivers State showing all the LGAs with the study sites in red circles
Assessment of e-waste status in Port Harcourt city and its environs 53
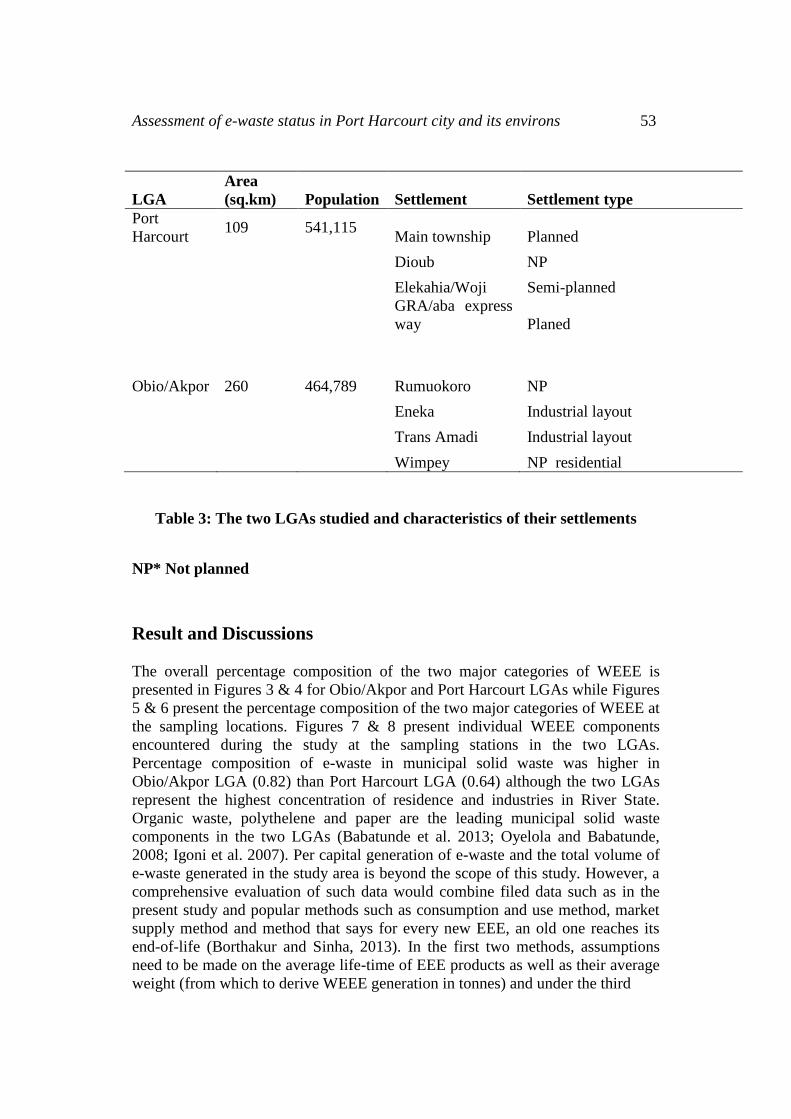
Table 3: The two LGAs studied and characteristics of their settlements
NP* Not planned
Result and Discussions
The overall percentage composition of the two major categories of WEEE is
presented in Figures 3 & 4 for Obio/Akpor and Port Harcourt LGAs while Figures
5 & 6 present the percentage composition of the two major categories of WEEE at
the sampling locations. Figures 7 & 8 present individual WEEE components
encountered during the study at the sampling stations in the two LGAs.
Percentage composition of e-waste in municipal solid waste was higher in
Obio/Akpor LGA (0.82) than Port Harcourt LGA (0.64) although the two LGAs
represent the highest concentration of residence and industries in River State.
Organic waste, polythelene and paper are the leading municipal solid waste
components in the two LGAs (Babatunde et al. 2013; Oyelola and Babatunde,
2008; Igoni et al. 2007). Per capital generation of e-waste and the total volume of
e-waste generated in the study area is beyond the scope of this study. However, a
comprehensive evaluation of such data would combine filed data such as in the
present study and popular methods such as consumption and use method, market
supply method and method that says for every new EEE, an old one reaches its
end-of-life (Borthakur and Sinha, 2013). In the first two methods, assumptions
need to be made on the average life-time of EEE products as well as their average
weight (from which to derive WEEE generation in tonnes) and under the third
LGA
Area
(sq.km) Population Settlement Settlement type
Port
Harcourt 109 541,115
Main township Planned
Dioub NP
Elekahia/Woji Semi-planned
GRA/aba express
way Planed
Obio/Akpor
260
464,789 Rumuokoro NP
Eneka Industrial layout
Trans Amadi Industrial layout
Wimpey NP residential

54 R. S. Konya et al.
method, however, the assumption of the average life-time of the appliances is
irrelevant, as it assumes a completely saturated market (Widmer et al, 2005).
According to Robinson (2009), the contribution of an item to the annual E-waste
production, E (kg/year) depends on the mass of the item, M (kg), the number of
units in service, N, and its average lifespan, L (years).
Therrefore:
E = MN/L
However, all the factors mentioned here are difficult to calculate. These factors
may differ across different stakeholders and countries. These methods have been
used to assess e-waste inventories in other parts of the world (Borthakur and
Sinha, 2013; WHO, 2010) but with suggestions to combine with field data such as
reported in this study.
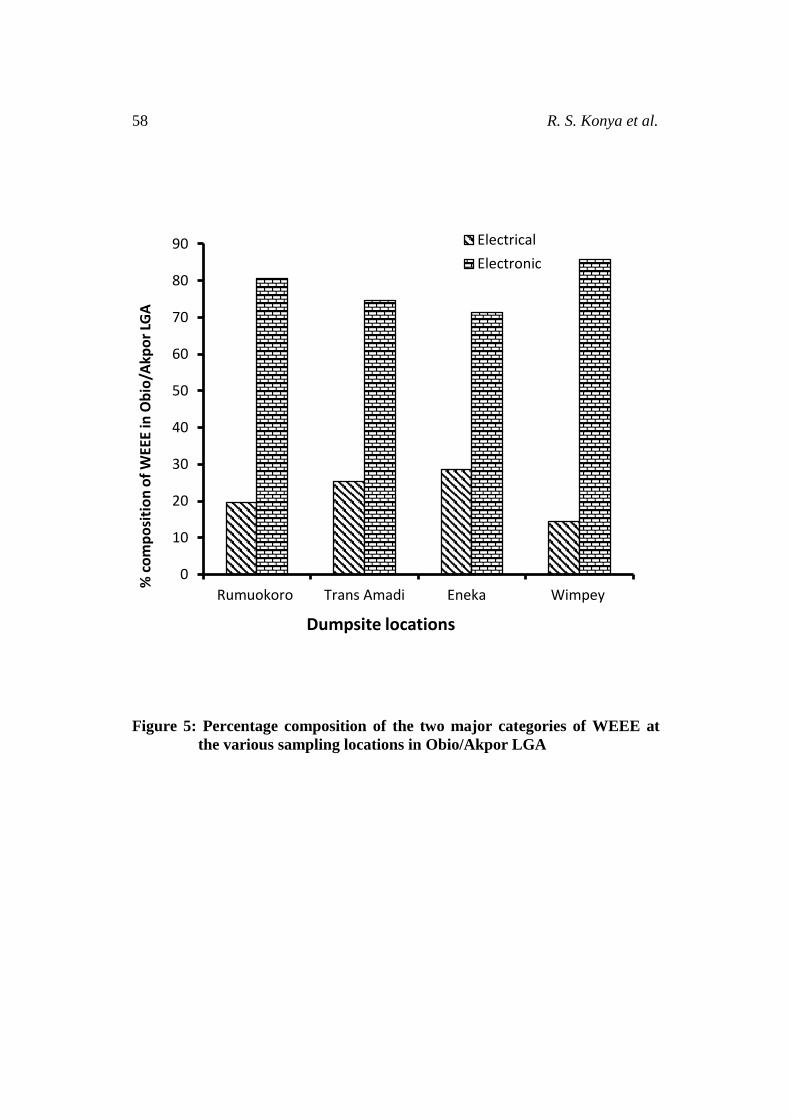
Electronic equipment dominated all the sampling locations ranging from 71.4% at
Rumukoro in Obio/Akpor LGA to 91.5% at Dioub in port Harcourt LGA. Figures
3 and 4 showed percentage composition of WEEE studied in Obio/Akpor and Port
Harcourt LGAs respectively. In Obio/Apkor LGA, mean percentage composition
of electrical devices ranged from 14.3% at Wimpey to 25.4% and 28.7% at Trans
Amadi and Eneka respectively. Eneka and Trans Amadi are industrial areas with
higher probability of discarding electrical equipment such as welding machines,
electrical lamps, soldering gun, Fridges, freezers, fans and general garage waste.
Electronic devices ranged from 71.4% at Eneka to 85.7% at Wimpey. Wimpey is
a residential settlement and more likely to dispose of electronic gadgets such as
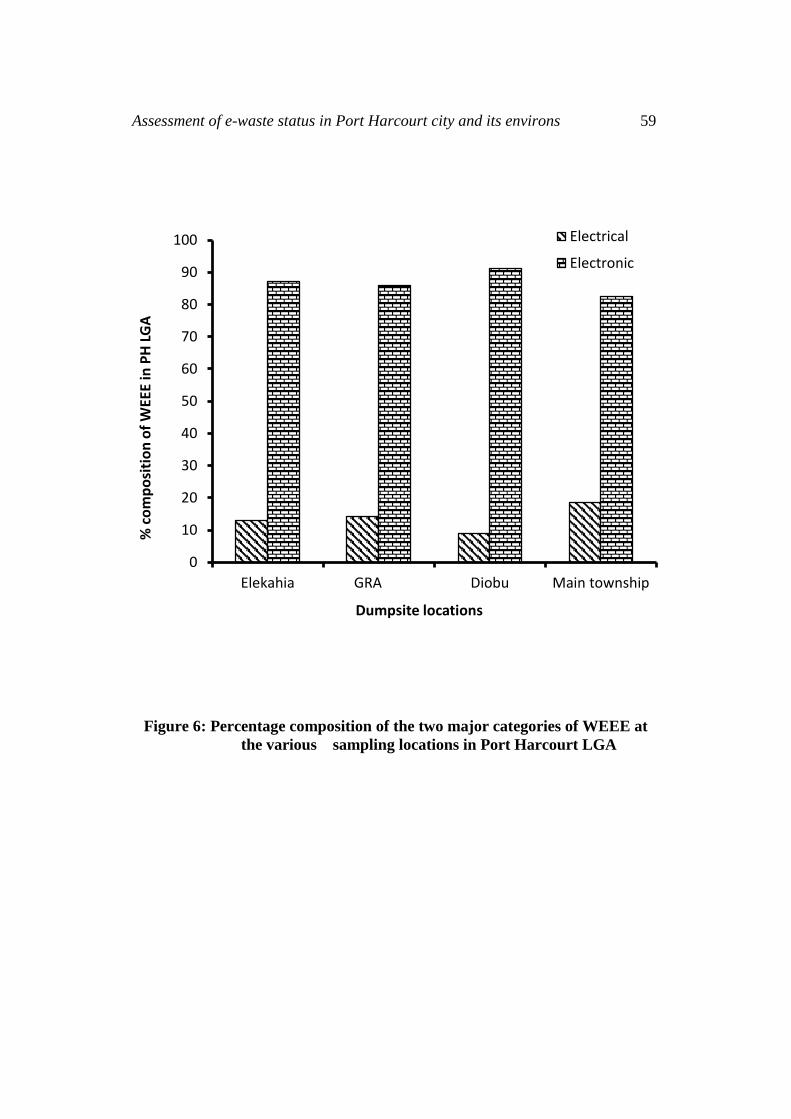
DVDs, VCR, radio, Television sets and cameras Figure 5. In Port Harcourt LGA,
electrical devices ranged from 8.8% at Dioub to 18.5% at Port Harcourt Main
Township which was the original well laid out Port Harcourt town consisting of
mainly colonial households or renovated ones. Being an old township, it is more
likely to possess obsolete electrical equipment now disposed of. Electronic
devices ranged from 82.5% at Port Harcourt Main Township to 91.2% at Dioub a
suburb of Port Harcourt with a dedicated dumpsite at Iluoabuchi for electronic
gadgets such as TV sets, circuit boards, DVDs, VCR, Radio and audio visual
devices Figure 6.
Computer and accessories recorded the highest percentage composition of
electronic devices at Eneka (28.5%) and Trans Amadi (37.3%) in Obio/Akpor
LGA followed by circuit boards which were quite prominent at all sampling
locations (30.3, 33.9, 26.8 and 28.6%) at Rumuokoro, Trans Amadi, Eneka and
Wimpey respectively. Wimpey recorded the least composition of computers and
its accessories (8.6%) since it is mainly a residential area occupied by low income
earners. Rumuokoro had a fairly larger ICTC commerce than Wimpey and more
computers were recorded at its sampling locations but much less than Eneka and
Trans Amadi. DVD was the third most prominent category of electronic wastes at
all stations in Obio/Akpor LGA recording percentage composition higher than TV, VCR and Radio at all locations. The overall least composition was TV followed
Assessment of e-waste status in Port Harcourt city and its environs 55
by Radio and VCR was fairly more prominent than the former two Figure 7. In
Port Harcourt LGA, computer and accessories was the most prominent category
only at the GRA location (41.2%), a government reserved area occupied by
mostly higher income earners who can afford new ones and be inclined to dispose
of the old ones. This category’s 41.2% was higher than it recorded at Trans Amadi
and Eneka in Obio/Akpor LGA. Circuit board was the second most prominent
category at GRA (16.0%) but recorded the highest percentage composition at the
other locations in Port Harcourt LGA (29.2, 35.1 and 31.2%) at Elekahia, Dioub
and Port Harcourt Main Township respectively Figure 8. Contrary to its position
in Obio/Akpor LGA, DVD was the third most prominent category at only three
locations in Port Harcourt LGA with percentage composition of 23, 23.2 and
22.9% at Elekahia, Dioub and Port Harcourt Main Township respectively. VCR
percentage composition (13.5%) at the GRA replaced DVD as the third most
prominent category at this location. Percentage composition of TV category was
higher than VCR and Radio categories at Dioub and Port Harcourt Main
Township and almost equals DVD and Radio at Elekahia and GRA sampling
locations. The overall least category was Radio recording 9.7, 6.8, 6.3 and 8.4% at
Elekahia, GRA, Dioub and Port Harcourt Main Township respectively Figure 8.
The biggest concern with e-Waste is the presence of toxic materials such as lead,
cadmium, beryllium, mercury and arsenic, toxic flameretardants and PVC
containing plastics that pose significant health and environmental risks when
WEEE is disposed (Arora and Asem, 2008). Such toxic materials present in
WEEE such as the categories recorded in this study usually leech out into the
ground contamination soils, surface and ground water and when burnt, releases
toxic fumes into the air. Brigden et al. (2008) tested the soil and ash samples at
the e-waste burning sites in the Agbogbloshie scrap yard, and proved the
deposition of exorbitantly high concentrations of toxic metals, such as lead and
cadmium, and halogenated chemicals, such as phthalates and polybrominated
diphenyl ethers (PBDEs). While exposure to lead fumes or dust is known to cause
multiple disorders, including neurological, cardiovascular and gastrointestinal
diseases (Haefliger et al. 2009), exposure to cadmium fumes or dust leads to
malfunctioning of kidneys (Hellstrom et al. 2001) and respiratory system (WHO
1992), and possibly lung cancer (DHHS 2005). On the other hand, even in
Europe, workers in electronics recycling facilities have higher blood levels of
PBDEs than other workers (Brigden et al. 2008; Sjödin et al. 2003).
Consequently, it is assumed that in the absence of protective gear and other
workplace standards, the levels of PBDEs in the blood of the recycling workers in
Nigeria would be much higher. Exposures to PBDEs have been known to cause
endocrine disruptive properties (Legler & Brouwer 2003) and neurobehavioral
disturbances in animals, such as abnormal brain development (Qu et al. 2007;
Kuriyama et al. 2005). Apart from open incineration, inappropriate dismantling
techniques to recover metals such as copper, aluminium and iron, also represent enormous risks to the workers. For example, breaking of CRT-monitors using stones,
56 R. S. Konya et al.
hammers, heavy metal rods and chisels, to recover copper, steel and plastic
casings, could result in the inhalation of hazardous cadmium dust and other
pollutants by the workers (Manhart et al.2011).
In Agbogbloshie and Koforidua, two major e-waste recycling sites in Ghana, the
concentrations of copper, lead, zinc and tin were found to be in the magnitude of
over one hundred times typical background levels. In particular, the
concentrations of lead in soil and ash samples collected in these sites were found
to be as high as 5,510 mg/kg dry weight (Brigden et al. 2008). Comparable lead
concentrations are also reported from bottom ash samples taken in Indian
recycling sites with intensive cable burning activities (3,560-6,450 mg/kg dry
weight), dust from Indian e-waste separation workshops (150-8,815 mg/kg dry
weight), dust from streets near e-waste recycling facilities in India (31-1,300
mg/kg dry weight) and dust from houses of e-waste recyclers in China (719-4,110
mg/kg dry weight). These values mostly exceed typical natural background levels
for soils and industrial sites (35 and 500 mg/kg dry weight) (Sepúlveda et al.
2010).
In addition, Sepúlveda et al. (2010) demonstrated that levels of PBDEs, too, are
significantly elevated in and around recycling sites in China and India. Exposure
to lead dust or fumes leads to the underdevelopment of brain in children, hence
causing intellectual impairment (Haefliger et al. 2009; Brigden et al. 2008). Apart
from that, lead is known to cause a wide range of disorders, such as “damage to
the nervous system and blood system, impacts on the kidneys and on
reproduction” (Brigden et al. 2008). Similarly, negative health impacts of flame
retardants, such as PBDEs, could also occur, not only through direct exposure, but
also through food contamination (Harrad et al. 2004). In China, for example, high
levels of PBDEs in the blood of local residents living in the proximity of e-waste
recycling activities have been reported (Bi et al. 2007). PBDEs have been known
to cause abnormal brain development in animals (Eriksson et al. 2002), endocrine
disruptive properties (Legler & Brouwer 2003) and anomalies in the immune
system (Birnbaum & Staskal 2004).

Assessment of e-waste status in Port Harcourt city and its environs 57
Figure 3: Percentage composition of the two major categories of WEEE in
Obio/Akpor LGA
Figure 4: Percentage composition of the two major categories of WEEE in
Port Harcourt LGA.
21,95
78,05
Electrical
Electronic
13,6
86,65
Electrical
Electronic
58 R. S. Konya et al.
Figure 5: Percentage composition of the two major categories of WEEE at
the various sampling locations in Obio/Akpor LGA
0
10
20
30
40
50
60
70
80
90
Rumuokoro Trans Amadi Eneka Wimpey
% c
om
po
siti
on
of
WEE
E in
Ob
io/A
kpo
r LG
A
Dumpsite locations
Electrical
Electronic
Assessment of e-waste status in Port Harcourt city and its environs 59
Figure 6: Percentage composition of the two major categories of WEEE at
the various sampling locations in Port Harcourt LGA
0
10
20
30
40
50
60
70
80
90
100
Elekahia GRA Diobu Main township
% c
om
po
siti
on
of
WEE
E in
PH
LG
A
Dumpsite locations
Electrical
Electronic

60 R. S. Konya et al.
Figure 7: Percentage composition of individual items of e-waste at the
various sampling locations in Obio/Akpor LGA
0
5
10
15
20
25
30
35
40
Rumuokoro Trans Amadi Eneka Wimpey
% c
om
po
siti
on
of
ind
ivid
ual
e-w
aste
in O
bio
/Akp
or
LGA
Dumpsite locations
Tv
Radio
DVD
Circuit Board
VCR
Computer

Assessment of e-waste status in Port Harcourt city and its environs 61
Figure 8: Percentage composition of individual items of e-waste at the
various sampling locations in Port Harcourt LGA
0
5
10
15
20
25
30
35
40
45
Elekahia GRA Diobu Main township
% c
om
po
siti
on
of
ind
ivid
ual
e-w
aste
in P
H L
GA
Dumpsite locations
Tv
Radio
DVD
Circuit Board
VCR
Computer
62 R. S. Konya et al.
Conclusion
The present study serves as a reconnaissance approach to the management of e-
waste in Port Harcourt and the Niger Delta as whole. Further studies elucidating
per capital generation of e-waste and its total inventory in the Niger Delta is
expedient to provide scientific data necessary for effective and sustainable
management of e-waste in the region. Effective management of e-waste in the
developing countries demands the implementation of EPR, the establishment of
product reuse through remanufacturing and the introduction of efficient recycling
facilities (Osibanjo and Nnorom, 2007).
In this context, the initiation of the E-waste Africa Project under the umbrella of
the Secretariat of the Basel Convention (SBC) of the UNEP, and co-managed by
the national governments and authorities in African countries, is an important step
forward (Arora and GTZ-ASEM, 2008; Prakash et al. 2010; Manhart et al. 2011).
The project aims at enhancing environmental governance of e-waste and at
creating favourable social and economic conditions for partnerships and small
businesses in the recycling sector in Africa. In particular the project seeks to better
understand and regulate the transboundary movements of used and obsolete e-
equipment from Europe to Africa, and also to improve the local e-waste
management capacities in many African countries, such as Nigeria, Ghana, Côte
d’Ivoire and Benin. Apart from dealing with a better management and control of
the legal and illegal trade of used and obsolete equipment from developed to
developing countries, the project has a special focus on identifying solutions for
sustainable management of domestically generated e-waste too. The idea is to
explore appropriate mechanisms, if any, to link the informal e-waste recycling
sector in the African countries with modern high-tech metal refining enterprises
worldwide with the objectives to:
1. Treat the hazardous fractions of the e-waste in an environmentally sound
manner,
2. Generate decent employment, income opportunities and other positive social
impactsfor the informal sector in African countries, and;
3. Recover valuable materials in the e-waste efficiently.

Assessment of e-waste status in Port Harcourt city and its environs 63
References [1] Arora, R. and GTZ-ASEM (2008). Best practices for e-waste management in
developing nations. GTZ-ASEM pp 25.
[2] Betts K. Producing usable materials from e-waste. Environ Sci Technol 2008a;
42: 6782–3.
http://dx.doi.org/10.1021/es801954d
[3] Bi, X.; Thomas, G. O.; Jones, K. C.; Qu, W.; Sheng, G.; Martin, F. L.; Fu, J.:
Exposure of electronics dismantling workers to polybrominated diphenyl ethers,
polychlorinated biphenyls, and organochlorine pesti-cides in south China.
Environmental Science and Technology 41(16), p. 5647-5653.
http://dx.doi.org/10.1021/es070346a
[4] Birnbaum, L. S.; Staskal, D. F.: Brominated flame retardants: cause for
concern? Environmental Health Perspectives 112(1), p. 9-17.
http://dx.doi.org/10.1289/ehp.6559
[5] Borthakur, A and Sinha, K (2013). Generation of electronic waste in India:
Current scenario, dilemmas and stakeholders African Journal of Environmental
Science and Technology Vol. 7(9), pp. 899-910.
[6] Brigden, K.; Labunska, I.; Santillo, D.; Johnston, P (2008). Chemical
contamination at e-waste recycling and disposal sites in Accra and Korforidua,
Ghana. Greenpeace International, Amsterdam.
[7] Cobbing M. Toxic Tech: Not in Our Backyard (2008). Uncovering the Hidden
Flows of e-waste.Report from Greenpeace International,
http://www.greenpeace.org/raw/content/belgium/fr/press/reports/toxic-tech.pdf,
Amsterdam.
[8] e-waste (2009). Hazardous Substances in e-Waste. A Knowledge Base for the
Sustainable Recycling of E-Waste. E-Waste: A Swiss E-Waste Guide; 2009.
[9] Eriksson, P.; Viberg, H.; Jakobsson, E.; Orn, U.; Fredriksson, A (2002). A
brominated flame retardant, 2, 2 ‘,4,4 ‘,5-pentabromodiphenyl ether: Uptake,
retention, and induction of neurobehavioral alterations in mice during a critical
phase of neonatal brain development. Toxicological Sciences 67(1), p. 98-103.
http://dx.doi.org/10.1093/toxsci/67.1.98
[10] Greenpeace (2008). Poisoning the poor – Electronic waste in Ghana.
Amsterdam.
64 R. S. Konya et al.
[11] Haefliger, P.; Mathieu-Nolf, M.; Lociciro, S.; Ndiaye, C.; Coly, M.; Diouf,
A.; Faye, A.L.; Sow, A.; Tempowski, J.; Pronczuk, J.; Filipe Junior, A.P.;
Bertollini, R.; and Neira, M. (2009). Mass lead intoxication from informal used
lead-acid battery recycling in Dakar, Senegal. Environmental Health Perspective,
Vol. 117(10), p. 1535-1540.
http://dx.doi.org/10.1289/ehp.0900696
[12] Harrad, S.; Wijesekera, R.; Hunter, S.; Halliwell, C.; Baker R (2004).
Preliminary assessment of UK human dietary and inhalation exposure to
polybrominated diphenyl ethers. Environmental Science and Technology 38(8), p.
2345-2350.
http://dx.doi.org/10.1021/es0301121
[13] Hellstrom, L.; Elinder, C. G.; Dahlberg, B.; Lundberg, M.; Jarup, L.; Persson,
B.; Axelson, O (2001). Cadmium Exposure and End-Stage Renal Disease.
American Journal of Kidney Diseases, 38(5), p. 1001-1008.
http://dx.doi.org/10.1053/ajkd.2001.28589
[14] Kuriyama, S. N.; Talsness, C. E.; Grote, K.; and Chahoud, I (2005).
Developmental exposure to low-dose PBDE-99: effects on male fertility and
neurobehavior in rat offspring. Environmental Health Perspective, Vol. 113, p.
149-154.
http://dx.doi.org/10.1289/ehp.7421
[15] Legler, J.; Brouwer, A. (2003). Are brominated flame retardants endocrine
disruptors? Environmental International 29(6), p. 879-885.
http://dx.doi.org/10.1016/s0160-4120(03)00104-1
[16] Li J. H., Gao S., Duan H. B., Liu L. L. (2009). Recovery of valuable
materials from waste liquid crystal display panel. Waste Manag; 29:2033–9.
http://dx.doi.org/10.1016/j.wasman.2008.12.013
[17] Manhart, A; Osibanjo, O; Aderinto, A; Prakash, S (2011). Informal e-waste
management in Lagos, Nigeria – socio-economic impacts and feasibility of inter-
national recycling co-operations. Öko-Institut, Freiburg, 2011 pp 125.
[18] Osibanjo, O. and Nnorom, I.C (2007). The challenge of electronic waste (e-
waste) management in developing countries. Waste Manag. Res. vol. 25 (6) 489-
501.
http://dx.doi.org/10.1177/0734242x07082028
[19] Osibanjo, O (2009). Electronic waste: A major challenge to sustainable
development in Africa. Presentation on the R’09 conference, 14.-16.
Assessment of e-waste status in Port Harcourt city and its environs 65
[20] Prakash, S.; van Houten, J.; Habets, André; Pwamang, J. (2010). Socio-
economic assessment and feasibility study on sustainable e-waste management in
Ghana. Öko-Institut, Freiburg, 2010 pp 118.
[21] Qu, W.; Bi, X.; Sheng, G.; Lu, S.; Fu, J.; Yuan, J.; Li, L. (2007). Exposure to
polybrominated diphenyl ethers among workers at an electronic waste dismantling
region in Guangdong, China. Environment International, 33(8), p. 1029-1034.
http://dx.doi.org/10.1016/j.envint.2007.05.009
[22] Robinson B. H. (2009). E-waste: An assessment of global production and
environmental impacts. Sci. of the Total Environ. 408:183-191.
http://dx.doi.org/10.1016/j.scitotenv.2009.09.044
[23] Sepúlveda A., Schluep M, Renaud F. G., Streicher M., Ruediger Kuehr R.,
Hagelüken C., Gerecke A. C. (2010). A review of the environmental fate and
effects of hazardous substances released from electrical and electronic equipments
during recycling: Examples from China and India. Environmental Impact
Assessment Review. 30:28-41. http://dx.doi.org/10.1016/j.eiar.2009.04.001
[24] Sjödin, A.; Patterson, D.G.; Bergman, A (2003). A review on human
exposure to brominated flame retardants – particularly polybrominated diphenyl
ethers. Environment International, 29, p. 829-839.
http://dx.doi.org/10.1016/s0160-4120(03)00108-9
[25] Sthiannopkao, S and Hung Wong, M (2013). Handling e-waste in developed
and developing countries: Initiatives, practices, and consequences Science of The
Total Environment Volumes 463–464: 1147–1153.
http://dx.doi.org/10.1016/j.scitotenv.2012.06.088
[26] United Nation Environment Programme (UNEP) (2008). Global Action on
Electronic Wastes.
http://www.bmun.net/documents/bmun56/committees/UNEP56.pdf (Accessed
March 11, 2008).
[27] UNEP (2006). Call for Global Action on E-waste. United Nations
Environment Programme.
[28] U.S. Department of Health and Human Services (DHHS), Public Health
Service, National Toxicology Program: Report on Carcinogens, Eleventh Edition.
[29] WHO, 2004 Chlorobenzenes other than hexachlorobenzene: environmental
aspects. Concise international chemical assessment document: 60. ISBN 92 4
153060 X, ISSN 1020-6167, Geneva 2004.

66 R. S. Konya et al.
[30] WHO (2010). Report On Inventorization of E-Waste in Two Cities in Andhra
Pradesh And Karnataka (Hyderabad And Bangalore). Prepared by Environment
Protection Training and Research Institute, Gachibowli, Hyderabad, Andhra
Pradesh, India.
[31] Widmer R., Oswald-Krapf H., Sinha-Khetriwal D., Schnellmann M., Boni H.
Global perspectives on e-waste. Environ Impact Assess Rev 2005; 25:436–58.
http://dx.doi.org/10.1016/j.eiar.2005.04.001
Received: February 10, 2015; Published: April 16, 2015