assessment of ecological status in uk lakes using diatoms · the definition of ecological status...
TRANSCRIPT
Assessment of ecological status in UK lakes using diatoms
Report – SC070034/TR3
Assessment of ecological status in UK lakes using diatoms ii
The Environment Agency is the leading public body protecting and improving the environment in England and Wales.
It’s our job to make sure that air, land and water are looked after by everyone in today’s society, so that tomorrow’s generations inherit a cleaner, healthier world.
Our work includes tackling flooding and pollution incidents, reducing industry’s impacts on the environment, cleaning up rivers, coastal waters and contaminated land, and improving wildlife habitats.
This report is the result of research commissioned and funded by the Environment Agency.
Published by: Environment Agency, Horizon House, Deanery Road, Bristol, BS1 5AH www.environment-agency.gov.uk ISBN: 978-1-84911-282-6 © Environment Agency – October 2012 All rights reserved. This document may be reproduced with prior permission of the Environment Agency. The views and statements expressed in this report are those of the author alone. The views or statements expressed in this publication do not necessarily represent the views of the Environment Agency and the Environment Agency cannot accept any responsibility for such views or statements. Further copies of this report are available from our publications catalogue: http://publications.environment-agency.gov.uk or our National Customer Contact Centre: T: 08708 506506 E: [email protected].
Author(s): Helen Bennion Amy Burgess Steve Juggins Martyn Kelly Gayle Reddihough Marion Yallop Dissemination Status: Publicly available Keywords: Lake, Diatom, Lake Trophic Diatom Index, LTDI, Biological Quality Element, BQE, Freshwater Classification, Water Framework Directive, WFD Research Contractor: M.K. Kelly, Bowburn Consultancy, 11 Monteigne Drive, Bowburn, Durham, DH6 5QB 0191 377 2077. Environment Agency’s Project Managers: Rachel Benstead, Evidence Directorate Jane Jamieson, Evidence Directorate Project Number: SC070034 Product Code: LIT 7367
iii
Evidence at the Environment Agency Evidence underpins the work of the Environment Agency. It provides an up-to-date understanding of the world about us, and helps us to develop tools and techniques to monitor and manage our environment as efficiently and effectively as possible. It also helps us to understand how the environment is changing and to identify what the future pressures may be.
The work of the Environment Agency’s Evidence Directorate is a key ingredient in the partnership between research, guidance and operations that enables the Environment Agency to protect and restore our environment.
This report was produced by the Research, Monitoring and Innovation team within Evidence. The team focuses on four main areas of activity:
• Setting the agenda, by providing the evidence for decisions;
• Maintaining scientific credibility, by ensuring that our programmes and projects are fit for purpose and executed according to international standards;
• Carrying out research, either by contracting it out to research organisations and consultancies or by doing it ourselves;
• Delivering information, advice, tools and techniques, by making appropriate products available.
Miranda Kavanagh
Director of Evidence
Assessment of ecological status in UK lakes using diatoms iv
Executive summary 1. This report describes an ecological classification tool for lakes based on diatoms, a key component of the biological quality element ‘macrophytes and phytobenthos’. 2. A database of benthic diatom samples collected since 2003, specifically for development of the tool, was assembled. In total 1079 samples from 228 lakes were included in the database with matching environmental data. The dataset was divided into three lake types – low, medium and high alkalinity. 3. ‘Reference sites’, relatively unimpacted by human activity, were selected from this database using a range of criteria including evidence of degree of change based on palaeolimnological data, and were used to develop a type-specific reference typology. 4. A Lake Trophic Diatom Index (LTDI) was developed and ecological quality ratios (EQRs) were generated for each lake type that vary from ≥1, where the diatom assemblage showed no impact, to (theoretically) 0, when the diatom assemblage was indicative of major anthropogenic activities. 5. The boundary between ‘high’ and ‘good’ status was defined as the 25th percentile of EQRs of all reference sites. The boundary between ‘good’ and ‘moderate’ status was set at the point at which nutrient-sensitive and nutrient-tolerant taxa were present in equal relative abundance. The ‘moderate’/’poor’ and ‘poor’/’bad’ boundaries were then defined by equal division of the remaining EQR gradient. 6. The reference data were employed to predict the ‘expected’ class at each site and these were compared with the classifications derived from the tool. For lakes identified as reference sites, 68% were classified as high with the remainder classified as good. For non-reference lakes the model predicted the majority of sites to be good or worse. The model appears to perform well. 7. The performance of the model was further tested by application to a set of 17 Cumbrian lakes for which classification based on a range of other tools was available. There was a tendency for the diatom tool classifications to be more relaxed than those using other tools, with 76% of lakes being placed in a higher status class than that indicated by the entire suite of biological metrics. The findings suggest that the reference community in low alkalinity lakes might be ‘buffered’ against change as the dominant taxa appear to be relatively tolerant to mild enrichment. 8. In an attempt to improve the predictions for low alkalinity lakes the response of surface sediment diatom assemblages along the nutrient gradient was explored, as these potentially contain a more diverse benthic diatom assemblage as well as planktonic taxa. However, a set of weighted averaging transfer functions offered no improvement over the diatom tool based on epilithic and epiphytic assemblages. 9. In conclusion, for low alkalinity lakes in particular, DALES (Diatoms for Assessing Lake/Loch Ecological Status) is more relaxed than other UK tools. However, DALES gives an accurate assessment of the condition of the littoral biofilm and thus provides a WFD-compliant tool to form part of the toolkit for classifying UK standing waters.
v
Acknowledgements Acknowledgements This work was funded by the Environment Agency of England and Wales and SNIFFER (Scotland and Northern Ireland Forum for Environmental Research). However, it does not necessarily represent the final or policy positions of the UK WFD Technical Advisory Groups or any of its partner agencies. Thanks are also due to representatives of the Scottish Environment Protection Agency, the Northern Ireland Environment Agency and the Environmental Protection Agency, Ireland, for their active roles on the project board and their constructive criticism during the drafting of this report.
Assessment of ecological status in UK lakes using diatoms vi
Contents 1 Introduction 1
2 Methods 2 2.1 Phytobenthos collection and identification 2 2.2 Environmental data 2 2.3 Sites 3 2.4 Defining reference lakes 6 2.5 Deriving a pressure metric: the Lake Trophic Diatom Index 8
3 Results 9 3.1 The Lake Trophic Diatom Index (LTDI) 9 3.2 Effect of season and substratum on LTDI 11 3.3 Calculation of expected LTDI at reference conditions and calculation of
EQR 12 3.4 Defining the class boundaries 12 3.5 Predicted class status 15 3.6 Validation using the Cumbrian lakes dataset 16 3.7 Surface sediment analysis 19
4 Discussion 21 4.1 Definition of reference sites and ‘high status’ 21 4.2 Measuring deviations from reference conditions 22 4.3 Definition of ‘good status’ and the good/moderate boundary 22
5 Conclusion 24
References 25
Appendices 30 Appendix A: Diatom full names and diatcodes 30 Appendix B: Classification of lakes using the diatom tool 31
1
1 Introduction This study forms part of the DARLEQ project (Diatom Assessment of River and Lake Ecological Quality). It builds on the earlier DARES (Diatoms for Assessing River Ecological Status) and DALES (Diatoms for Assessing Lake/Loch Ecological Status) projects, which aimed at producing predictive models for evaluating ecological status based on benthic diatoms in UK rivers and lakes, respectively, as required by the European Union’s Water Framework Directive (WFD) (European Union 2000). The overall objective of both projects was to develop a robust operational tool to enable the prediction of ecological status based on the diatom community present at any river or standing water site in the UK. More specifically, both projects set out to: • gather existing and new data covering benthic diatoms and associated environmental
data across the complete range of still and running waters in the UK into a database;
• define the expected (reference condition) diatom community at any (river/lake/loch) site;
• develop a model for assessing ecological status (expressed in terms of quantitative deviation from the reference condition) along a nutrient/organic pollution gradient;
• develop a rationale for placing status class boundaries along this gradient;
• develop estimates of uncertainty associated with status class assessments;
• combine all of the above into a package that can be used for routine assessment of water bodies by the Environment Agency, Environment Agency Wales, the Scottish Environment Protection Agency (SEPA) and the Northern Ireland Environment Agency (NIEA).
This section provides an overview of the diatom-based tool for assessing ecological status in lakes. Phase 1 of this work (DALES) was the first attempt to define the benthic diatom flora of UK lakes that is expected in the absence of significant anthropogenic activity. It provides a foundation upon which the statutory agencies could start monitoring to assess the status of UK freshwaters, and a statistically sound basis for determining the need or otherwise of Programmes of Measures. However, the study highlighted a number of areas where this work could be developed including addition of further samples and refinement and improvement of the model itself (Kelly et al. 2007), and it is these developments that are reported here. The definition of ecological status in Article 2 of the WFD refers to ‘structure’ and ‘functioning’ (European Union 2000). However, Annex V refers only to taxonomic composition and abundance for macrophytes and phytobenthos. Weighted-average metrics such as the Trophic Diatom Index (TDI: Kelly and Whitton 1995) and Indice de Polluosensibilité (IPS: Coste in CEMAGREF 1982) offer a convenient means of summarising information required about taxonomic change into a single value. Although the TDI was developed for rivers, the same concept can, with recalibration, also be applied to lakes. This is considered preferable to the use of a diatom-based total phosphorus (TP) transfer function, which is already available for UK lakes (e.g. Bennion et al. 1996) as the latter does not express results in terms that are compatible with the ecological concepts at the heart of the WFD.
Assessment of ecological status in UK lakes using diatoms 2
2 Methods
2.1 Phytobenthos collection and identification Five cobbles were collected from the littoral zone of each lake away from inflow streams and obvious human impacts. The cobbles were placed into a tray with a little lake water and the top surface of each was brushed with a clean toothbrush in order to remove the biofilm (Kelly et al. 1998, CEN 2003). Where cobbles were absent or where the bottom sediments were dominated by fine sediments with only a few larger stones, five submerged stems of a single emergent plant species such as Phragmites australis, Sparganium erectum, Glyceria maxima or Typha spp. were collected (King et al. 2006). The resulting suspension was collected in a plastic bottle, fixed with Lugol’s iodine and stored prior to analysis. Samples were either digested in a saturated solution of potassium permanganate and concentrated hydrochloric acid (after Hendey 1974) or digested with hydrogen peroxide in order to remove organic material, and permanent slides were prepared using Naphrax (refractive index = 1.74) as a mountant (after Battarbee et al. 2001). At least 300 undamaged valves of non-planktonic taxa were identified and counted using 1000× magnification (CEN 2004). The primary floras and identification guides used in this study were Krammer and Lange-Bertalot (1986, 1997, 2000, 2004) and Hartley et al. (1996). All nomenclature was adjusted to that used by Whitton et al. (1998), which follows conventions in Round et al. (1990) and Fourtanier and Kociolek (1999). All taxa were identified to the highest resolution possible (usually species or variety). Infraspecific taxa were merged for those species where a preliminary examination of taxon–environment scatterplots suggested that the response of infraspecific taxa were not distinguishable from that of the species. For example, Frustulia rhomboides varieties were merged; Cocconeis placentula varieties were merged; Fragilaria capucina var. capucina, var. rumpens and var. gracilis were merged to F. capucina; Synedra tenera was merged to S. nana; fine and coarse forms of Fragilaria vaucheriae were merged; all forms of Tabellaria flocculosa were merged; all Planothidium species that were formerly varieties and subspecies of Achnanthes lanceolata were merged to P. lanceolatum; Gomphonema angustum and G. pumilum were merged. Small or benthic Fragilaria (sensu lato) refers to those Fragilaria spp. now considered to be separate genera: Pseudostaurosira, Staurosira and Staurosirella.
2.2 Environmental data Environmental data linked to the diatom samples were extracted from databases held by the Environment Agency and SEPA. Ideally, the diatom data should have been matched with environmental data collected over the corresponding time periods. However, for some sites/samples the timing of environmental data collection did not correspond with the timing of biological sampling and, therefore, environmental data were substituted from the nearest available time period. For some sites data were available for 2005, whereas for other sites the nearest available data were from 2000, or, at worst, from as far back as 1996. The environmental dataset comprises mean annual values. Annual averages were considered more robust than seasonal values because seasonal data were absent or patchy for a large number of lakes. The number of individual seasonal measurements from which annual means have been calculated range from 1 to 45 (average 8). Both the number of individual samples and the seasonal distribution of these samples will affect the robustness of annual mean values calculated for individual lakes. For the majority of lakes and
3
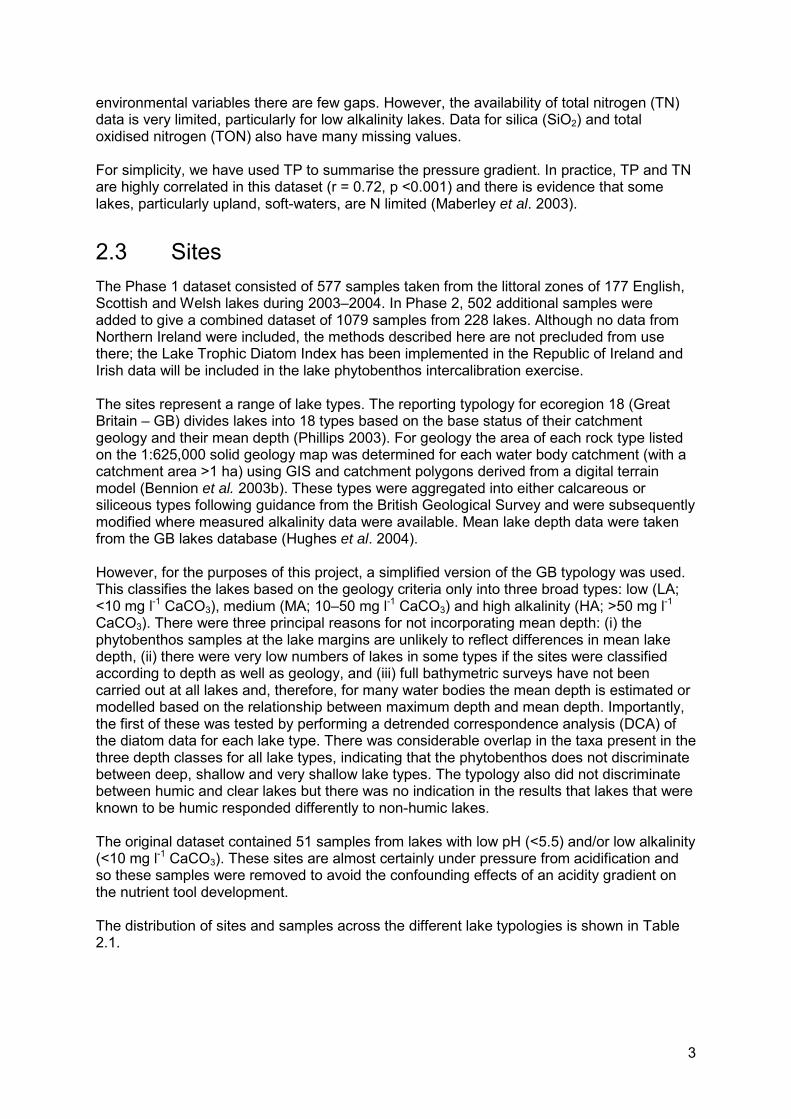
environmental variables there are few gaps. However, the availability of total nitrogen (TN) data is very limited, particularly for low alkalinity lakes. Data for silica (SiO2) and total oxidised nitrogen (TON) also have many missing values. For simplicity, we have used TP to summarise the pressure gradient. In practice, TP and TN are highly correlated in this dataset (r = 0.72, p <0.001) and there is evidence that some lakes, particularly upland, soft-waters, are N limited (Maberley et al. 2003).
2.3 Sites The Phase 1 dataset consisted of 577 samples taken from the littoral zones of 177 English, Scottish and Welsh lakes during 2003–2004. In Phase 2, 502 additional samples were added to give a combined dataset of 1079 samples from 228 lakes. Although no data from Northern Ireland were included, the methods described here are not precluded from use there; the Lake Trophic Diatom Index has been implemented in the Republic of Ireland and Irish data will be included in the lake phytobenthos intercalibration exercise. The sites represent a range of lake types. The reporting typology for ecoregion 18 (Great Britain – GB) divides lakes into 18 types based on the base status of their catchment geology and their mean depth (Phillips 2003). For geology the area of each rock type listed on the 1:625,000 solid geology map was determined for each water body catchment (with a catchment area >1 ha) using GIS and catchment polygons derived from a digital terrain model (Bennion et al. 2003b). These types were aggregated into either calcareous or siliceous types following guidance from the British Geological Survey and were subsequently modified where measured alkalinity data were available. Mean lake depth data were taken from the GB lakes database (Hughes et al. 2004). However, for the purposes of this project, a simplified version of the GB typology was used. This classifies the lakes based on the geology criteria only into three broad types: low (LA; <10 mg l-1 CaCO3), medium (MA; 10–50 mg l-1 CaCO3) and high alkalinity (HA; >50 mg l-1 CaCO3). There were three principal reasons for not incorporating mean depth: (i) the phytobenthos samples at the lake margins are unlikely to reflect differences in mean lake depth, (ii) there were very low numbers of lakes in some types if the sites were classified according to depth as well as geology, and (iii) full bathymetric surveys have not been carried out at all lakes and, therefore, for many water bodies the mean depth is estimated or modelled based on the relationship between maximum depth and mean depth. Importantly, the first of these was tested by performing a detrended correspondence analysis (DCA) of the diatom data for each lake type. There was considerable overlap in the taxa present in the three depth classes for all lake types, indicating that the phytobenthos does not discriminate between deep, shallow and very shallow lake types. The typology also did not discriminate between humic and clear lakes but there was no indication in the results that lakes that were known to be humic responded differently to non-humic lakes. The original dataset contained 51 samples from lakes with low pH (<5.5) and/or low alkalinity (<10 mg l-1 CaCO3). These sites are almost certainly under pressure from acidification and so these samples were removed to avoid the confounding effects of an acidity gradient on the nutrient tool development. The distribution of sites and samples across the different lake typologies is shown in Table 2.1.
Assessment of ecological status in UK lakes using diatoms 4
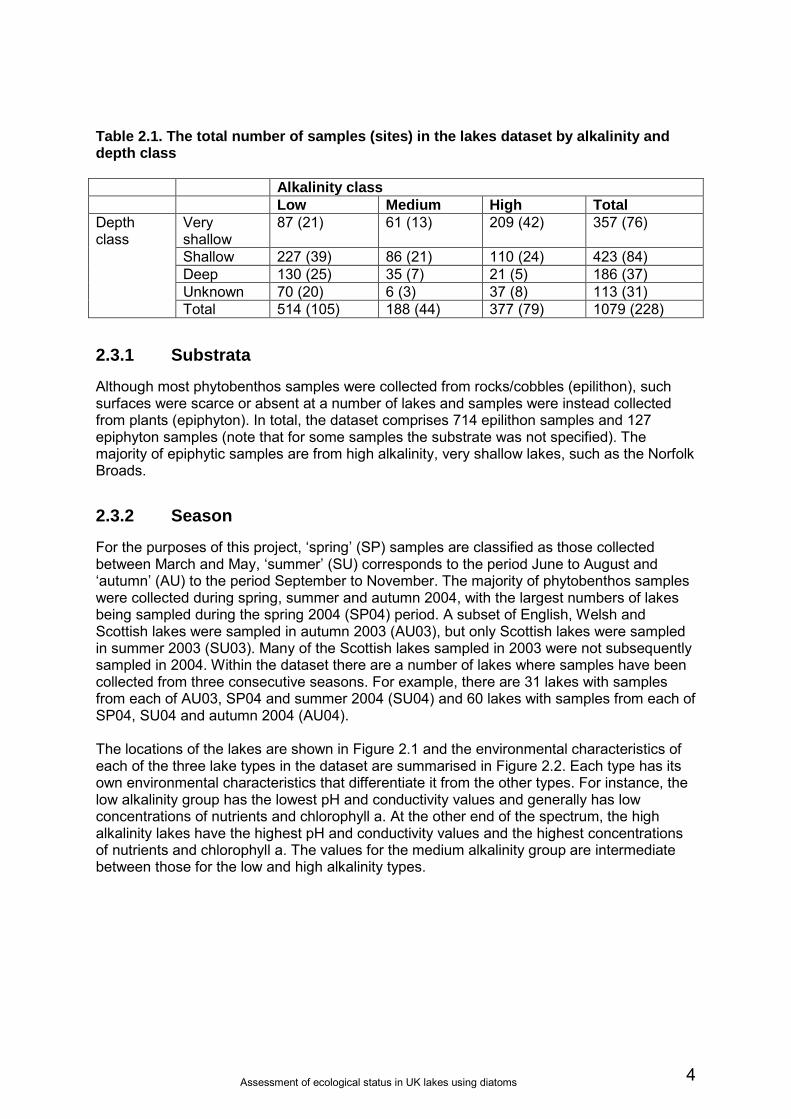
Table 2.1. The total number of samples (sites) in the lakes dataset by alkalinity and depth class Alkalinity class Low Medium High Total Depth class
Very shallow
87 (21) 61 (13) 209 (42) 357 (76)
Shallow 227 (39) 86 (21) 110 (24) 423 (84) Deep 130 (25) 35 (7) 21 (5) 186 (37) Unknown 70 (20) 6 (3) 37 (8) 113 (31) Total 514 (105) 188 (44) 377 (79) 1079 (228)
2.3.1 Substrata
Although most phytobenthos samples were collected from rocks/cobbles (epilithon), such surfaces were scarce or absent at a number of lakes and samples were instead collected from plants (epiphyton). In total, the dataset comprises 714 epilithon samples and 127 epiphyton samples (note that for some samples the substrate was not specified). The majority of epiphytic samples are from high alkalinity, very shallow lakes, such as the Norfolk Broads.
2.3.2 Season
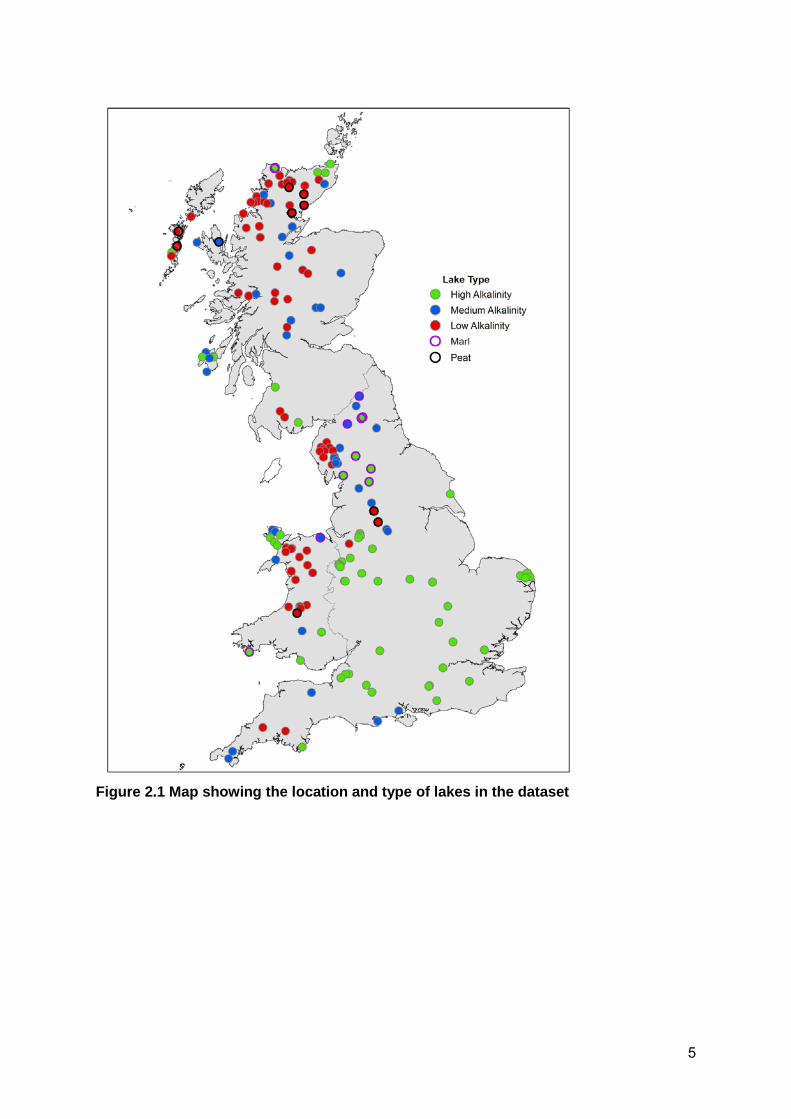
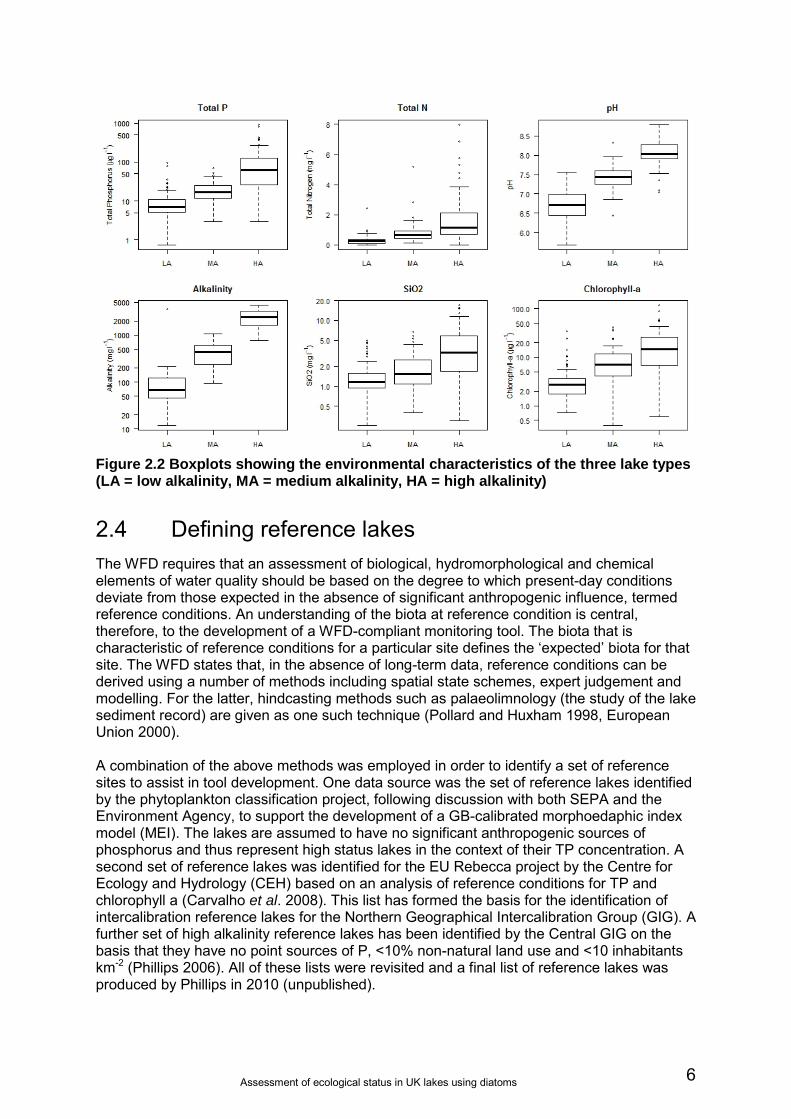
For the purposes of this project, ‘spring’ (SP) samples are classified as those collected between March and May, ‘summer’ (SU) corresponds to the period June to August and ‘autumn’ (AU) to the period September to November. The majority of phytobenthos samples were collected during spring, summer and autumn 2004, with the largest numbers of lakes being sampled during the spring 2004 (SP04) period. A subset of English, Welsh and Scottish lakes were sampled in autumn 2003 (AU03), but only Scottish lakes were sampled in summer 2003 (SU03). Many of the Scottish lakes sampled in 2003 were not subsequently sampled in 2004. Within the dataset there are a number of lakes where samples have been collected from three consecutive seasons. For example, there are 31 lakes with samples from each of AU03, SP04 and summer 2004 (SU04) and 60 lakes with samples from each of SP04, SU04 and autumn 2004 (AU04). The locations of the lakes are shown in Figure 2.1 and the environmental characteristics of each of the three lake types in the dataset are summarised in Figure 2.2. Each type has its own environmental characteristics that differentiate it from the other types. For instance, the low alkalinity group has the lowest pH and conductivity values and generally has low concentrations of nutrients and chlorophyll a. At the other end of the spectrum, the high alkalinity lakes have the highest pH and conductivity values and the highest concentrations of nutrients and chlorophyll a. The values for the medium alkalinity group are intermediate between those for the low and high alkalinity types.
5
Figure 2.1 Map showing the location and type of lakes in the dataset
Assessment of ecological status in UK lakes using diatoms 6
Figure 2.2 Boxplots showing the environmental characteristics of the three lake types (LA = low alkalinity, MA = medium alkalinity, HA = high alkalinity)
2.4 Defining reference lakes The WFD requires that an assessment of biological, hydromorphological and chemical elements of water quality should be based on the degree to which present-day conditions deviate from those expected in the absence of significant anthropogenic influence, termed reference conditions. An understanding of the biota at reference condition is central, therefore, to the development of a WFD-compliant monitoring tool. The biota that is characteristic of reference conditions for a particular site defines the ‘expected’ biota for that site. The WFD states that, in the absence of long-term data, reference conditions can be derived using a number of methods including spatial state schemes, expert judgement and modelling. For the latter, hindcasting methods such as palaeolimnology (the study of the lake sediment record) are given as one such technique (Pollard and Huxham 1998, European Union 2000). A combination of the above methods was employed in order to identify a set of reference sites to assist in tool development. One data source was the set of reference lakes identified by the phytoplankton classification project, following discussion with both SEPA and the Environment Agency, to support the development of a GB-calibrated morphoedaphic index model (MEI). The lakes are assumed to have no significant anthropogenic sources of phosphorus and thus represent high status lakes in the context of their TP concentration. A second set of reference lakes was identified for the EU Rebecca project by the Centre for Ecology and Hydrology (CEH) based on an analysis of reference conditions for TP and chlorophyll a (Carvalho et al. 2008). This list has formed the basis for the identification of intercalibration reference lakes for the Northern Geographical Intercalibration Group (GIG). A further set of high alkalinity reference lakes has been identified by the Central GIG on the basis that they have no point sources of P, <10% non-natural land use and <10 inhabitants km-2 (Phillips 2006). All of these lists were revisited and a final list of reference lakes was produced by Phillips in 2010 (unpublished).
7
A further body of data for identifying potential reference lakes is the palaeoecological database held by the Environmental Change Research Centre (ECRC). Data were collated from all UK lakes where palaeoecological diatom studies have been undertaken. The ‘top and bottom’ approach was adopted whereby the top and bottom samples of a sediment core are assumed to represent the present-day and reference conditions, respectively (Cumming et al. 1992). This methodology has been successfully applied by the US Environmental Protection Agency’s (USEPA) Environmental Monitoring and Assessment Program for Surface Waters (EMAP-SW: Dixit et al. 1999) in Canada to infer changes in south-eastern Ontario lakes (Reavie et al. 2002) and to assess ecological change in UK lakes (Bennion 2004, Bennion et al. 2004, Bennion and Simpson 2011). For the UK, it is generally agreed that approximately AD 1850 is a suitable date against which to assess impacts for lakes as this represents a period prior to major industrialisation and agricultural intensification (Battarbee 1999, Fozzard et al. 1999). However, because aquatic systems have been subjected to anthropogenic impacts over much longer time-scales, these reference conditions are unlikely to equate to a natural or pristine state. Nevertheless, the core sample dated to about AD 1850 for each lake was taken to represent the reference sample and for undated cores the lowermost (i.e. oldest) sample was selected (e.g. Burgess et al. 2005). The degree of floristic change between the reference and present-day sample for each site was assessed using a squared chord distance coefficient (Overpeck et al. 1985) implemented in the statistical software R (R Development Core Team 2004). This is preferred to other dissimilarity measures as it maximises the signal to noise ratio, it performs well with percentage data and has sound mathematical properties (Overpeck et al. 1985). The scores range from 0 to 2 whereby 0 indicates that two samples are exactly the same and 2 that they are completely different. Scores less than 0.29, 0.39, 0.48 and 0.58 indicate insignificant floristic change at the 1st, 2.5th, 5th and 10th percentiles, respectively (Simpson 2005, Simpson et al. 2005). The 2.5th percentile (score <0.39) was used to define sites with low floristic change between the bottom and top sample and thereby to identify a reference site. This is more stringent than the 5th percentile (score <0.48) used in previous similar studies (e.g. Bennion et al. 2004) and reflects revised thinking on the use of the chord distance statistic. This revision follows closer examination of sediment sample data from over 200 UK lake cores held in the ECRC’s in-house database whereby unimpacted sites typically have chord distance values of <0.4 (in many cases <0.3) between core top and bottom samples (e.g. Bennion 2004).The chord distance measure is useful for estimating degree of change. However, it should not be used in isolation but instead as part of a suite of tools for identifying potential reference lakes, as here. In a number of cases the sediment cores were relatively short (<30 cm) and in the absence of dating it cannot be guaranteed that the base of the core is sufficiently old to represent pre-impact conditions. The sediments of shallow, high alkalinity lakes are often dominated by non-planktonic Fragilaria taxa and, in these cases, the chord distance may underestimate broader ecological change at the site, so caution should be exercised when using this measure for defining reference sites for this lake type. The chord distance scores applied here are based on floristic change in the diatom community alone and therefore may not reflect the degree of change in other biological groups. A summary of the reference sites in the lakes dataset identified using the various datasets above is given in Appendix B. A total of 35, 13 and 7 reference sites were generated for low, medium and high alkalinity lakes, respectively. Unfortunately, there are few examples of high alkalinity reference lakes but this might be expected given the long history of impacts and productive nature of their catchments. These data were used to develop an a priori status classification for the lakes in the dataset, such that lakes were classed either as reference, non-reference or unknown, the latter referring to lakes where insufficient data were available to determine their status.
Assessment of ecological status in UK lakes using diatoms 8
2.5 Deriving a pressure metric: the Lake Trophic Diatom Index The Trophic Diatom Index (TDI) developed for rivers (Kelly and Whitton 1995) was taken as the starting point for deriving a pressure metric for lakes as it is an existing expert system for phytobenthos in UK waters, it is sensitive to the pressure of interest (nutrients), it does not require calibration with the Environment Agency–SEPA environmental datasets, and it is more in keeping with the ecological structure and function concepts of the WFD than diatom transfer function models which focus on inference of chemical variables (e.g. Bennion et al. 1996). As a first step, a rescaling algorithm similar to those described by Hill et al. (2000) and Walley et al. (2001) was used to assign scores to any lake taxa absent from the rivers dataset and to ‘adjust’ taxa to the DALES gradient. The resulting index is termed the Lake Trophic Diatom Index (LTDI). As for rivers, five groups of taxa were derived and allocated to one of five sensitivity groups using the rescaling algorithm described above. The taxon TDI scores are numbered from 1 (low nutrient tolerance) to 5 (high nutrient tolerance).
9
3 Results
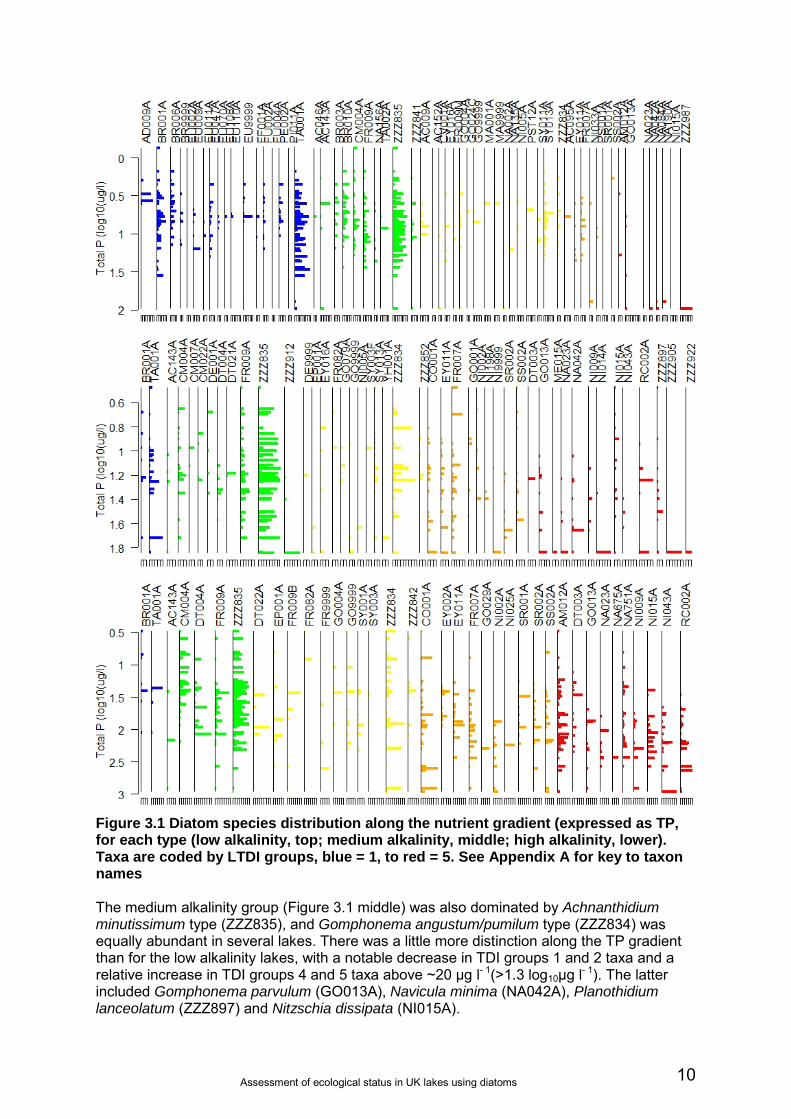
3.1 The Lake Trophic Diatom Index (LTDI) The assumption is that if the primary gradient in the DALES dataset is a nutrient pressure then this should be reflected by the LTDI scores. In order to test this assumption a canonical correspondence analysis (CCA) was performed on the whole dataset with nutrient parameters as the only environmental variables. A comparison of axis 1 species scores and sample scores with LTDI scores provides an assessment of how well the new metric reflects the nutrient pressure. Results show a strong correlation (r = 0.81) between the CCA axis 1 species scores and LTDI species indicator values. Furthermore, there is a very strong correlation (r = 0.95) between the CCA axis 1 sample scores and LTDI scores for individual lake samples. These high correlations suggest that LTDI does reflect the nutrient pressure gradient across the dataset as a whole and validates its use as a nutrient pressure metric. The next step was to explore the relationship between the LTDI groups and the nutrient gradient for each lake type separately to determine whether the metric reflected a nutrient pressure at the type-specific scale. In Figure 3.1, the relative abundances of the major taxa in the five LTDI groups are plotted along the nutrient gradient for each lake type which, for simplicity, is expressed as TP. Figure 3.1 (top) illustrates that for the low alkalinity group the diatoms exhibit little response along the TP gradient. Achnanthidium minutissimum type (ZZZ835) was abundant across the whole gradient. Brachysira vitrea (BR001A) and Tabellaria flocculosa (TA001A) also occurred in high relative abundances particularly at TP concentrations >2 μg l- 1 (>0.3 log10μg l- 1). However, there were no taxa with a strong preference for higher TP values. The benthic diatoms, therefore, do not appear to be sensitive to changes in TP at relatively low concentrations (<50 μg TP l- 1 or <1.7 log10μg l- 1). Palaeoecological work at low alkalinity lakes such as Lochs Lomond and Awe indicates that it is subtle shifts in the diatom plankton that suggest enrichment and there are not marked changes in the non-planktonic forms (Bennion et al. 2004). Similarly in diatom surface sediment training sets the main response along the TP gradient is in habitat shifts (i.e. a switch from benthic to planktonic forms) or in composition of the planktonic community such as a decrease in oligotrophic and an increase in mesotrophic taxa (e.g. Bennion 1995). It is possible that there may be shifts in composition within the A. minutissimum and other species complexes that were masked by the merged taxonomy adopted here; however, the large number of inocula taxa with relatively broad niches in a lake littoral zone serve to ‘buffer’ the community against change. Moreover, low alkalinity lakes within the DALES dataset do not cover a long enough nutrient gradient for us to see any marked species turnover. The result is that, for some lakes, the DALES classification tool based on the benthic diatom community is likely to underestimate degree of ecological change attributed to nutrient enrichment. The palaeoecological studies and other ecological data suggest that Loweswater (LOWS), Bassenthwaite (BASS), Bala (BALA) and Grasmere (GRAS), for example, are not in their former oligotrophic state and have experienced enrichment (e.g. Bennion et al. 2000a, b, 2003a). However, this impact is not reflected in the benthic diatom community.
Assessment of ecological status in UK lakes using diatoms 10
Figure 3.1 Diatom species distribution along the nutrient gradient (expressed as TP, for each type (low alkalinity, top; medium alkalinity, middle; high alkalinity, lower). Taxa are coded by LTDI groups, blue = 1, to red = 5. See Appendix A for key to taxon names The medium alkalinity group (Figure 3.1 middle) was also dominated by Achnanthidium minutissimum type (ZZZ835), and Gomphonema angustum/pumilum type (ZZZ834) was equally abundant in several lakes. There was a little more distinction along the TP gradient than for the low alkalinity lakes, with a notable decrease in TDI groups 1 and 2 taxa and a relative increase in TDI groups 4 and 5 taxa above ~20 μg l- 1(>1.3 log10μg l- 1). The latter included Gomphonema parvulum (GO013A), Navicula minima (NA042A), Planothidium lanceolatum (ZZZ897) and Nitzschia dissipata (NI015A).
11
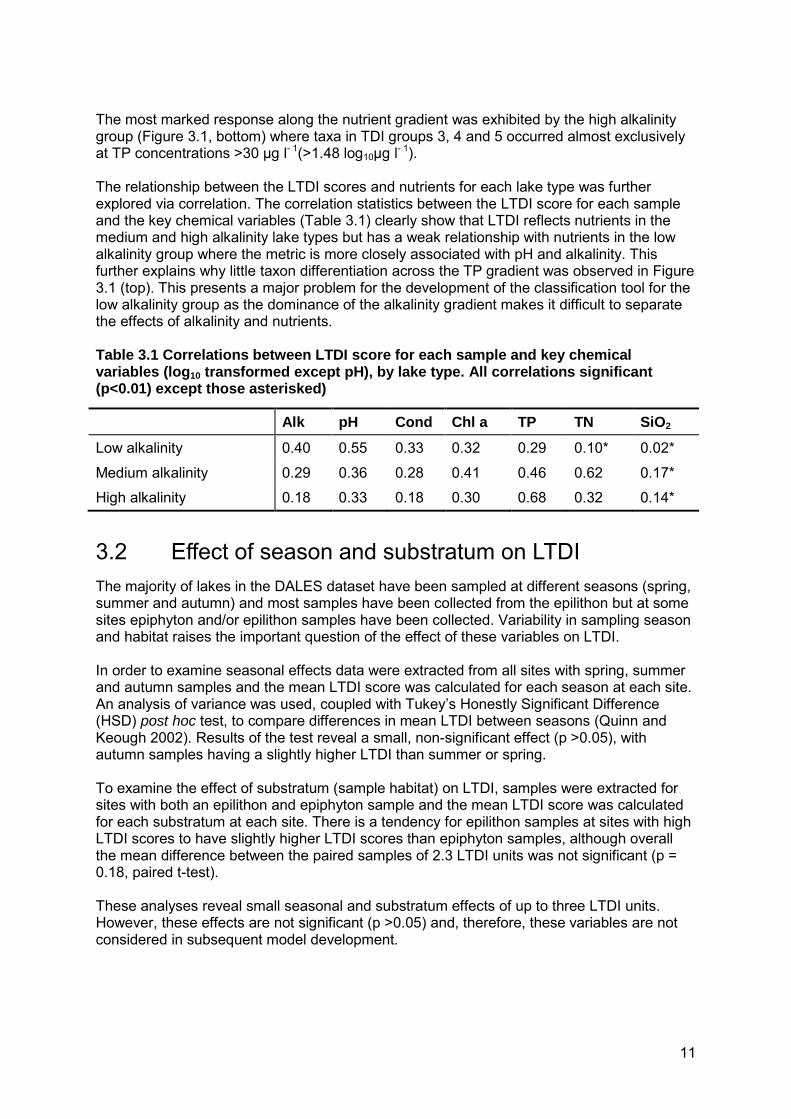
The most marked response along the nutrient gradient was exhibited by the high alkalinity group (Figure 3.1, bottom) where taxa in TDI groups 3, 4 and 5 occurred almost exclusively at TP concentrations >30 μg l- 1(>1.48 log10μg l- 1). The relationship between the LTDI scores and nutrients for each lake type was further explored via correlation. The correlation statistics between the LTDI score for each sample and the key chemical variables (Table 3.1) clearly show that LTDI reflects nutrients in the medium and high alkalinity lake types but has a weak relationship with nutrients in the low alkalinity group where the metric is more closely associated with pH and alkalinity. This further explains why little taxon differentiation across the TP gradient was observed in Figure 3.1 (top). This presents a major problem for the development of the classification tool for the low alkalinity group as the dominance of the alkalinity gradient makes it difficult to separate the effects of alkalinity and nutrients. Table 3.1 Correlations between LTDI score for each sample and key chemical variables (log10 transformed except pH), by lake type. All correlations significant (p<0.01) except those asterisked)
Alk pH Cond Chl a TP TN SiO2
Low alkalinity 0.40 0.55 0.33 0.32 0.29 0.10* 0.02*
Medium alkalinity 0.29 0.36 0.28 0.41 0.46 0.62 0.17*
High alkalinity 0.18 0.33 0.18 0.30 0.68 0.32 0.14*
3.2 Effect of season and substratum on LTDI The majority of lakes in the DALES dataset have been sampled at different seasons (spring, summer and autumn) and most samples have been collected from the epilithon but at some sites epiphyton and/or epilithon samples have been collected. Variability in sampling season and habitat raises the important question of the effect of these variables on LTDI. In order to examine seasonal effects data were extracted from all sites with spring, summer and autumn samples and the mean LTDI score was calculated for each season at each site. An analysis of variance was used, coupled with Tukey’s Honestly Significant Difference (HSD) post hoc test, to compare differences in mean LTDI between seasons (Quinn and Keough 2002). Results of the test reveal a small, non-significant effect (p >0.05), with autumn samples having a slightly higher LTDI than summer or spring. To examine the effect of substratum (sample habitat) on LTDI, samples were extracted for sites with both an epilithon and epiphyton sample and the mean LTDI score was calculated for each substratum at each site. There is a tendency for epilithon samples at sites with high LTDI scores to have slightly higher LTDI scores than epiphyton samples, although overall the mean difference between the paired samples of 2.3 LTDI units was not significant (p = 0.18, paired t-test). These analyses reveal small seasonal and substratum effects of up to three LTDI units. However, these effects are not significant (p >0.05) and, therefore, these variables are not considered in subsequent model development.
Assessment of ecological status in UK lakes using diatoms 12
3.3 Calculation of expected LTDI at reference conditions and calculation of EQR
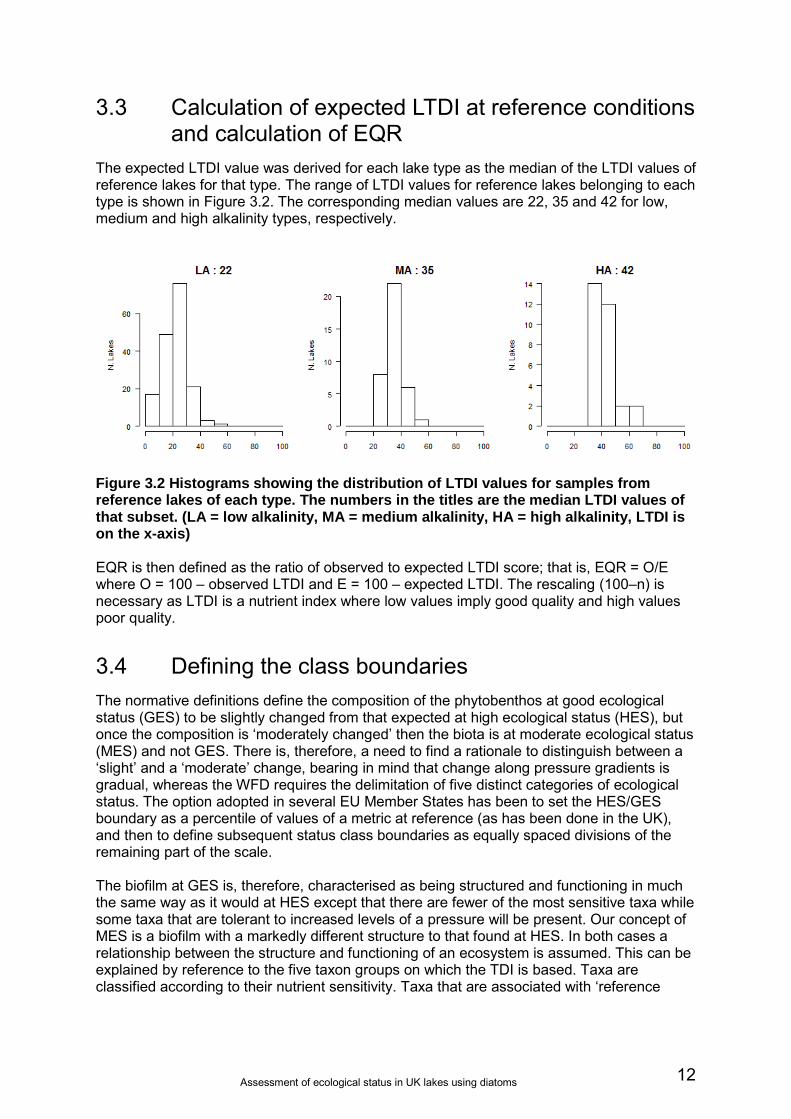
The expected LTDI value was derived for each lake type as the median of the LTDI values of reference lakes for that type. The range of LTDI values for reference lakes belonging to each type is shown in Figure 3.2. The corresponding median values are 22, 35 and 42 for low, medium and high alkalinity types, respectively.
Figure 3.2 Histograms showing the distribution of LTDI values for samples from reference lakes of each type. The numbers in the titles are the median LTDI values of that subset. (LA = low alkalinity, MA = medium alkalinity, HA = high alkalinity, LTDI is on the x-axis) EQR is then defined as the ratio of observed to expected LTDI score; that is, EQR = O/E where O = 100 – observed LTDI and E = 100 – expected LTDI. The rescaling (100–n) is necessary as LTDI is a nutrient index where low values imply good quality and high values poor quality.
3.4 Defining the class boundaries The normative definitions define the composition of the phytobenthos at good ecological status (GES) to be slightly changed from that expected at high ecological status (HES), but once the composition is ‘moderately changed’ then the biota is at moderate ecological status (MES) and not GES. There is, therefore, a need to find a rationale to distinguish between a ‘slight’ and a ‘moderate’ change, bearing in mind that change along pressure gradients is gradual, whereas the WFD requires the delimitation of five distinct categories of ecological status. The option adopted in several EU Member States has been to set the HES/GES boundary as a percentile of values of a metric at reference (as has been done in the UK), and then to define subsequent status class boundaries as equally spaced divisions of the remaining part of the scale. The biofilm at GES is, therefore, characterised as being structured and functioning in much the same way as it would at HES except that there are fewer of the most sensitive taxa while some taxa that are tolerant to increased levels of a pressure will be present. Our concept of MES is a biofilm with a markedly different structure to that found at HES. In both cases a relationship between the structure and functioning of an ecosystem is assumed. This can be explained by reference to the five taxon groups on which the TDI is based. Taxa are classified according to their nutrient sensitivity. Taxa that are associated with ‘reference
13
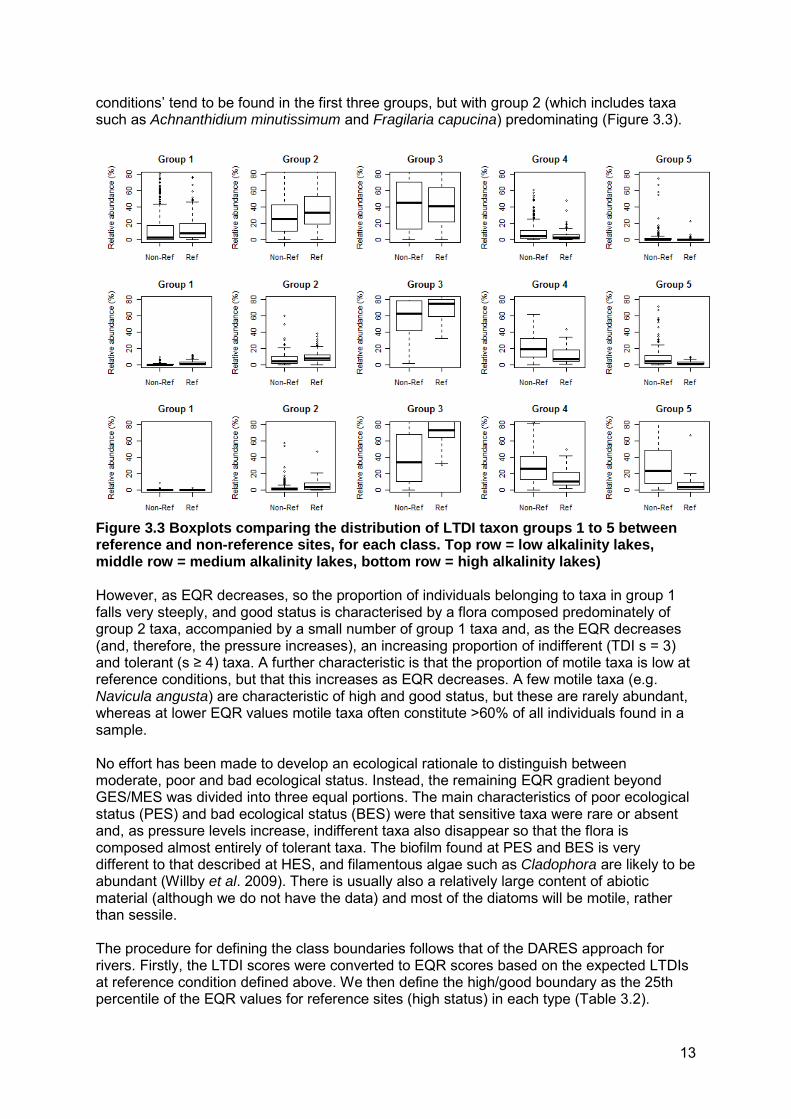
conditions’ tend to be found in the first three groups, but with group 2 (which includes taxa such as Achnanthidium minutissimum and Fragilaria capucina) predominating (Figure 3.3).
Figure 3.3 Boxplots comparing the distribution of LTDI taxon groups 1 to 5 between reference and non-reference sites, for each class. Top row = low alkalinity lakes, middle row = medium alkalinity lakes, bottom row = high alkalinity lakes) However, as EQR decreases, so the proportion of individuals belonging to taxa in group 1 falls very steeply, and good status is characterised by a flora composed predominately of group 2 taxa, accompanied by a small number of group 1 taxa and, as the EQR decreases (and, therefore, the pressure increases), an increasing proportion of indifferent (TDI s = 3) and tolerant (s ≥ 4) taxa. A further characteristic is that the proportion of motile taxa is low at reference conditions, but that this increases as EQR decreases. A few motile taxa (e.g. Navicula angusta) are characteristic of high and good status, but these are rarely abundant, whereas at lower EQR values motile taxa often constitute >60% of all individuals found in a sample. No effort has been made to develop an ecological rationale to distinguish between moderate, poor and bad ecological status. Instead, the remaining EQR gradient beyond GES/MES was divided into three equal portions. The main characteristics of poor ecological status (PES) and bad ecological status (BES) were that sensitive taxa were rare or absent and, as pressure levels increase, indifferent taxa also disappear so that the flora is composed almost entirely of tolerant taxa. The biofilm found at PES and BES is very different to that described at HES, and filamentous algae such as Cladophora are likely to be abundant (Willby et al. 2009). There is usually also a relatively large content of abiotic material (although we do not have the data) and most of the diatoms will be motile, rather than sessile. The procedure for defining the class boundaries follows that of the DARES approach for rivers. Firstly, the LTDI scores were converted to EQR scores based on the expected LTDIs at reference condition defined above. We then define the high/good boundary as the 25th percentile of the EQR values for reference sites (high status) in each type (Table 3.2).
Assessment of ecological status in UK lakes using diatoms 14
Setting the boundary at the 25th percentile allows for the possibility that some of the sites identified as reference may be slightly impacted and so may have lower EQRs than true reference sites. Table 3.2 Quantiles of EQRs for reference sites in each alkalinity type 0 25 50 75 100
Low 0.58 0.93 1.0 1.09 1.29
Medium 0.61 0.93 1.0 1.08 1.27
High 0.26 0.81 1.0 1.12 1.44 For the good/moderate boundary the DARES approach is also followed and is set at the cross-over between sensitive and tolerant taxon groups as described above. Inspection of the boxplots in Figure 3.3 (and more detailed scatterplots not shown) indicates that for the low and medium alkalinity types, LTDI species groups 1 and 2 differentiate reference from non-reference sites and can be considered sensitive taxa in these systems. Likewise, LTDI species groups 4 and 5 can be considered tolerant taxa indicative of disturbance. However, LTDI group 1 and 2 taxa are rare for the high alkalinity type, and in this type LTDI group 3 taxa can be considered sensitive. The good/moderate boundary is, therefore, defined as the cross-over between combined groups 1 and 2 (nutrient sensitive), and combined groups 4 and 5 (nutrient tolerant) for both the low and medium alkalinity types and as the cross-over between combined groups 1, 2, and 3, and combined groups 4 and 5 for the high alkalinity type.
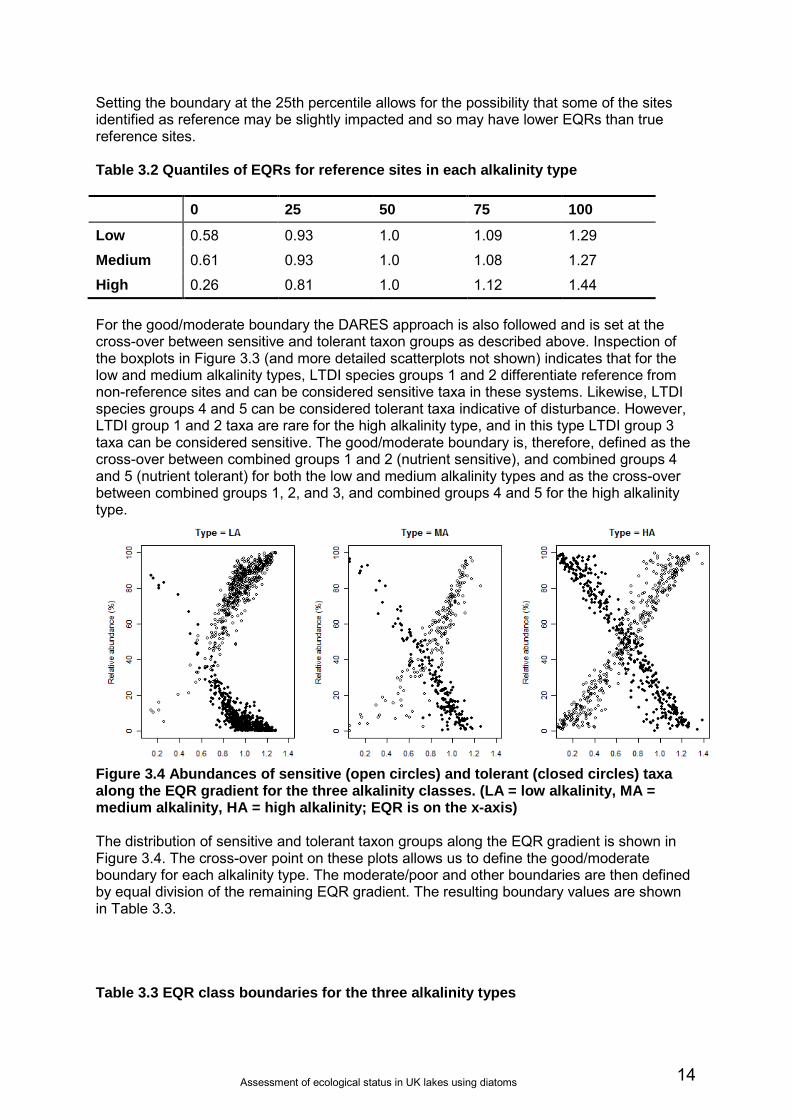
Figure 3.4 Abundances of sensitive (open circles) and tolerant (closed circles) taxa along the EQR gradient for the three alkalinity classes. (LA = low alkalinity, MA = medium alkalinity, HA = high alkalinity; EQR is on the x-axis) The distribution of sensitive and tolerant taxon groups along the EQR gradient is shown in Figure 3.4. The cross-over point on these plots allows us to define the good/moderate boundary for each alkalinity type. The moderate/poor and other boundaries are then defined by equal division of the remaining EQR gradient. The resulting boundary values are shown in Table 3.3. Table 3.3 EQR class boundaries for the three alkalinity types
15
H/G G/M M/P P/B
Low 0.92 0.70 0.46 0.23†
Medium 0.93* 0.66** 0.46 0.23†
High 0.92 0.70 0.46 0.23† * 0.95 prior to intercalibration with other European Member States ** 0.70 prior to intercalibration with other European Member States † The Poor/Bad boundary is not applied in UK classification. Sites are classified only as High, Good, Moderate and Poor for diatom status
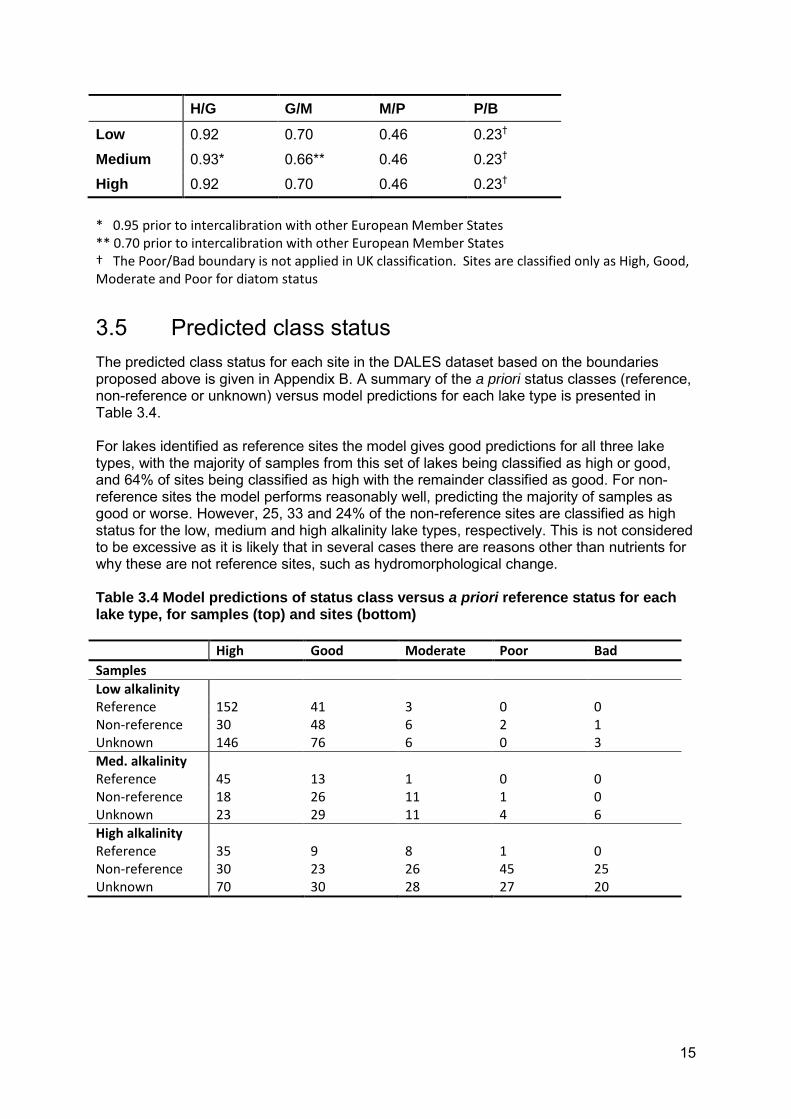
3.5 Predicted class status The predicted class status for each site in the DALES dataset based on the boundaries proposed above is given in Appendix B. A summary of the a priori status classes (reference, non-reference or unknown) versus model predictions for each lake type is presented in Table 3.4. For lakes identified as reference sites the model gives good predictions for all three lake types, with the majority of samples from this set of lakes being classified as high or good, and 64% of sites being classified as high with the remainder classified as good. For non-reference sites the model performs reasonably well, predicting the majority of samples as good or worse. However, 25, 33 and 24% of the non-reference sites are classified as high status for the low, medium and high alkalinity lake types, respectively. This is not considered to be excessive as it is likely that in several cases there are reasons other than nutrients for why these are not reference sites, such as hydromorphological change. Table 3.4 Model predictions of status class versus a priori reference status for each lake type, for samples (top) and sites (bottom) High Good Moderate Poor Bad Samples Low alkalinity Reference 152 41 3 0 0 Non-reference Unknown
30 146
48 76
6 6
2 0
1 3
Med. alkalinity Reference 45 13 1 0 0 Non-reference Unknown
18 23
26 29
11 11
1 4
0 6
High alkalinity Reference 35 9 8 1 0 Non-reference Unknown
30 70
23 30
26 28
45 27
25 20
Assessment of ecological status in UK lakes using diatoms 16
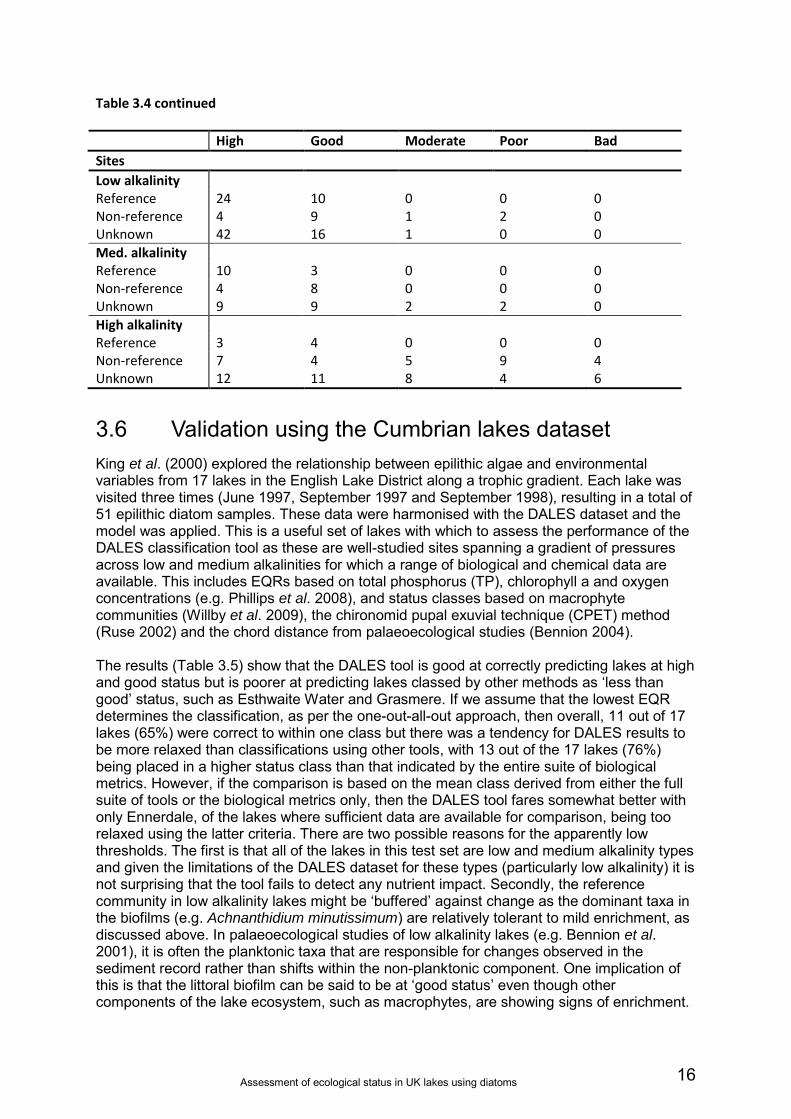
Table 3.4 continued High Good Moderate Poor Bad Sites Low alkalinity Reference 24 10 0 0 0 Non-reference Unknown
4 42
9 16
1 1
2 0
0 0
Med. alkalinity Reference 10 3 0 0 0 Non-reference Unknown
4 9
8 9
0 2
0 2
0 0
High alkalinity Reference 3 4 0 0 0 Non-reference Unknown
7 12
4 11
5 8
9 4
4 6
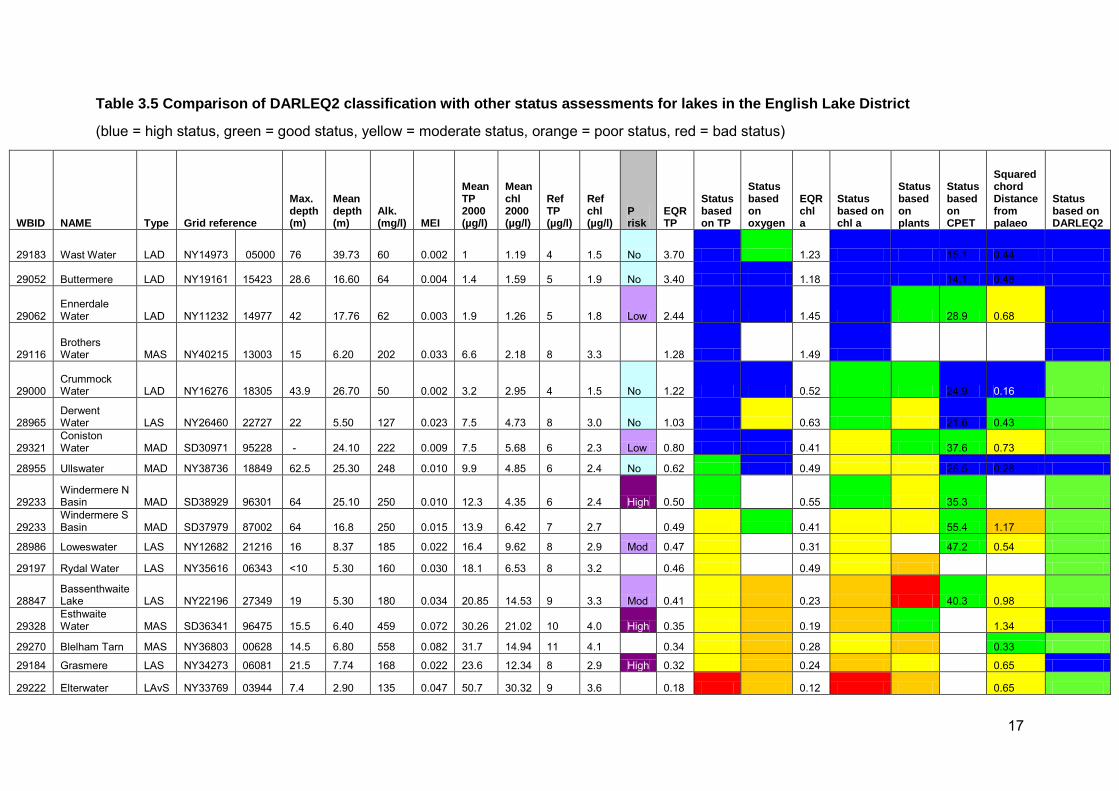
3.6 Validation using the Cumbrian lakes dataset King et al. (2000) explored the relationship between epilithic algae and environmental variables from 17 lakes in the English Lake District along a trophic gradient. Each lake was visited three times (June 1997, September 1997 and September 1998), resulting in a total of 51 epilithic diatom samples. These data were harmonised with the DALES dataset and the model was applied. This is a useful set of lakes with which to assess the performance of the DALES classification tool as these are well-studied sites spanning a gradient of pressures across low and medium alkalinities for which a range of biological and chemical data are available. This includes EQRs based on total phosphorus (TP), chlorophyll a and oxygen concentrations (e.g. Phillips et al. 2008), and status classes based on macrophyte communities (Willby et al. 2009), the chironomid pupal exuvial technique (CPET) method (Ruse 2002) and the chord distance from palaeoecological studies (Bennion 2004). The results (Table 3.5) show that the DALES tool is good at correctly predicting lakes at high and good status but is poorer at predicting lakes classed by other methods as ‘less than good’ status, such as Esthwaite Water and Grasmere. If we assume that the lowest EQR determines the classification, as per the one-out-all-out approach, then overall, 11 out of 17 lakes (65%) were correct to within one class but there was a tendency for DALES results to be more relaxed than classifications using other tools, with 13 out of the 17 lakes (76%) being placed in a higher status class than that indicated by the entire suite of biological metrics. However, if the comparison is based on the mean class derived from either the full suite of tools or the biological metrics only, then the DALES tool fares somewhat better with only Ennerdale, of the lakes where sufficient data are available for comparison, being too relaxed using the latter criteria. There are two possible reasons for the apparently low thresholds. The first is that all of the lakes in this test set are low and medium alkalinity types and given the limitations of the DALES dataset for these types (particularly low alkalinity) it is not surprising that the tool fails to detect any nutrient impact. Secondly, the reference community in low alkalinity lakes might be ‘buffered’ against change as the dominant taxa in the biofilms (e.g. Achnanthidium minutissimum) are relatively tolerant to mild enrichment, as discussed above. In palaeoecological studies of low alkalinity lakes (e.g. Bennion et al. 2001), it is often the planktonic taxa that are responsible for changes observed in the sediment record rather than shifts within the non-planktonic component. One implication of this is that the littoral biofilm can be said to be at ‘good status’ even though other components of the lake ecosystem, such as macrophytes, are showing signs of enrichment.
17
Table 3.5 Comparison of DARLEQ2 classification with other status assessments for lakes in the English Lake District
(blue = high status, green = good status, yellow = moderate status, orange = poor status, red = bad status)
WBID NAME Type Grid reference
Max. depth (m)
Mean depth (m)
Alk. (mg/l) MEI
Mean TP 2000 (µg/l)
Mean chl 2000 (µg/l)
Ref TP (µg/l)
Ref chl (µg/l)
P risk
EQR TP
Status based on TP
Status based on oxygen
EQR chl a
Status based on chl a
Status based on plants
Status based on CPET
Squared chord Distance from palaeo
Status based on DARLEQ2
29183 Wast Water LAD NY14973 05000 76 39.73 60 0.002 1 1.19 4 1.5 No 3.70 1.23 15.1 0.44
29052 Buttermere LAD NY19161 15423 28.6 16.60 64 0.004 1.4 1.59 5 1.9 No 3.40 1.18 14.1 0.48
29062 Ennerdale Water LAD NY11232 14977 42 17.76 62 0.003 1.9 1.26 5 1.8 Low 2.44 1.45 28.9 0.68
29116 Brothers Water MAS NY40215 13003 15 6.20 202 0.033 6.6 2.18 8 3.3 1.28 1.49
29000 Crummock Water LAD NY16276 18305 43.9 26.70 50 0.002 3.2 2.95 4 1.5 No 1.22 0.52 24.9 0.16
28965 Derwent Water LAS NY26460 22727 22 5.50 127 0.023 7.5 4.73 8 3.0 No 1.03 0.63 21.6 0.43
29321 Coniston Water MAD SD30971 95228 - 24.10 222 0.009 7.5 5.68 6 2.3 Low 0.80 0.41 37.6 0.73
28955 Ullswater MAD NY38736 18849 62.5 25.30 248 0.010 9.9 4.85 6 2.4 No 0.62 0.49 26.5 0.28
29233 Windermere N Basin MAD SD38929 96301 64 25.10 250 0.010 12.3 4.35 6 2.4 High 0.50 0.55 35.3
29233 Windermere S Basin MAD SD37979 87002 64 16.8 250 0.015 13.9 6.42 7 2.7 0.49 0.41 55.4 1.17
28986 Loweswater LAS NY12682 21216 16 8.37 185 0.022 16.4 9.62 8 2.9 Mod 0.47 0.31 47.2 0.54
29197 Rydal Water LAS NY35616 06343 <10 5.30 160 0.030 18.1 6.53 8 3.2 0.46 0.49
28847 Bassenthwaite Lake LAS NY22196 27349 19 5.30 180 0.034 20.85 14.53 9 3.3 Mod 0.41 0.23 40.3 0.98
29328 Esthwaite Water MAS SD36341 96475 15.5 6.40 459 0.072 30.26 21.02 10 4.0 High 0.35 0.19 1.34
29270 Blelham Tarn MAS NY36803 00628 14.5 6.80 558 0.082 31.7 14.94 11 4.1 0.34 0.28 0.33
29184 Grasmere LAS NY34273 06081 21.5 7.74 168 0.022 23.6 12.34 8 2.9 High 0.32 0.24 0.65
29222 Elterwater LAvS NY33769 03944 7.4 2.90 135 0.047 50.7 30.32 9 3.6 0.18 0.12 0.65
Assessment of ecological status in UK lakes using diatoms 18
3.7 Surface sediment analysis In the current lakes tool, the ecological status predictions for several low alkalinity lakes provide a poor match with the a priori classification. For example 25 samples (three sites) are classed as high status but were deemed to be non-reference in the a priori classification. Similarly, in the application of the tool to the Cumbrian lakes dataset the diatom score gave a higher class prediction than those of other classification tools in a number of cases. This appears to be largely due to the apparent lack of sensitivity of the benthic diatoms to the nutrient gradient in this lake type and additionally to the confounding effects of alkalinity as discussed in Section 3.1. For example, the Achnanthidium-dominated assemblages found at high and good ecological status in these lakes is tolerant of a moderate amount of enrichment before it shows significant changes and consequently the tool itself is relatively insensitive to change at low and moderate pressure levels. The situation is complicated by the small number of low alkalinity lakes at moderate, poor or bad status.
In an attempt to improve the predictions for low alkalinity lakes an alternative approach was investigated based on the surface sediment samples collected at the same time as the littoral samples in 2005. This task explored whether the surface sediment diatom assemblages respond along the nutrient gradient and hence whether they can be employed to produce a more robust classification tool for nutrient pressure, particularly in low alkalinity lakes.
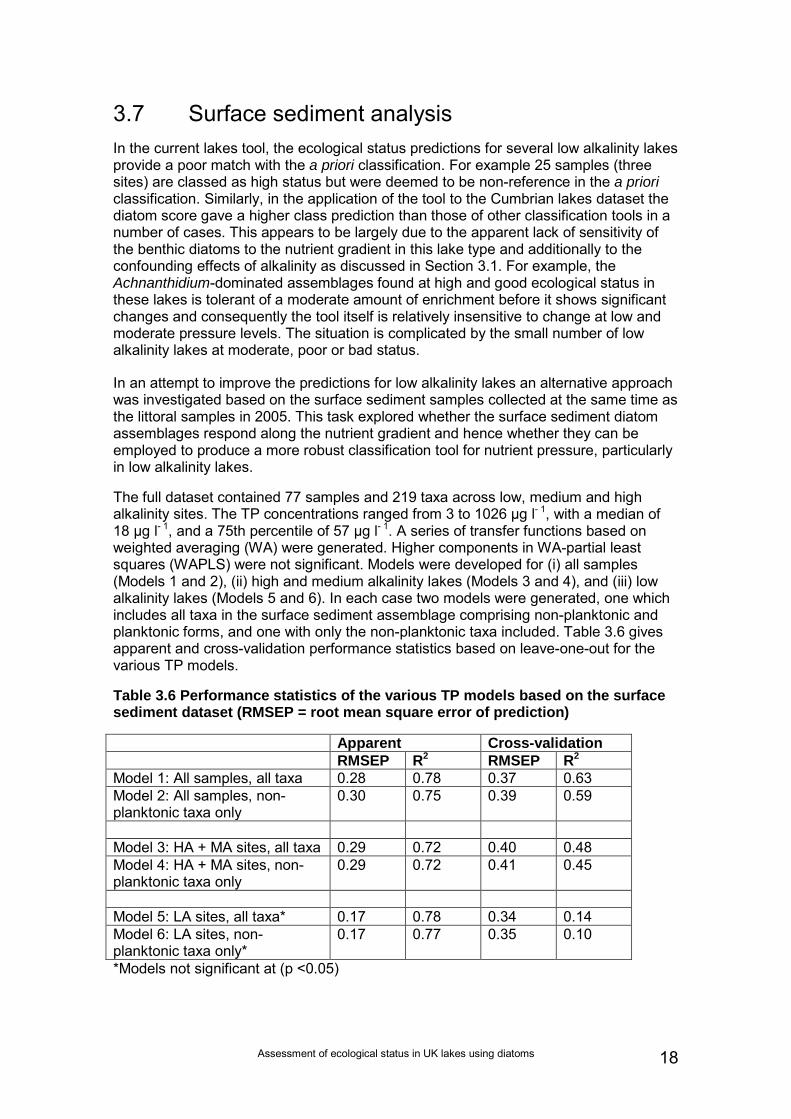
The full dataset contained 77 samples and 219 taxa across low, medium and high alkalinity sites. The TP concentrations ranged from 3 to 1026 μg l- 1, with a median of 18 μg l- 1, and a 75th percentile of 57 μg l- 1. A series of transfer functions based on weighted averaging (WA) were generated. Higher components in WA-partial least squares (WAPLS) were not significant. Models were developed for (i) all samples (Models 1 and 2), (ii) high and medium alkalinity lakes (Models 3 and 4), and (iii) low alkalinity lakes (Models 5 and 6). In each case two models were generated, one which includes all taxa in the surface sediment assemblage comprising non-planktonic and planktonic forms, and one with only the non-planktonic taxa included. Table 3.6 gives apparent and cross-validation performance statistics based on leave-one-out for the various TP models.
Table 3.6 Performance statistics of the various TP models based on the surface sediment dataset (RMSEP = root mean square error of prediction)
Apparent Cross-validation RMSEP R2 RMSEP R2 Model 1: All samples, all taxa 0.28 0.78 0.37 0.63 Model 2: All samples, non-planktonic taxa only
0.30 0.75 0.39 0.59
Model 3: HA + MA sites, all taxa 0.29 0.72 0.40 0.48 Model 4: HA + MA sites, non-planktonic taxa only
0.29 0.72 0.41 0.45
Model 5: LA sites, all taxa* 0.17 0.78 0.34 0.14 Model 6: LA sites, non-planktonic taxa only*
0.17 0.77 0.35 0.10
*Models not significant at (p <0.05)
19
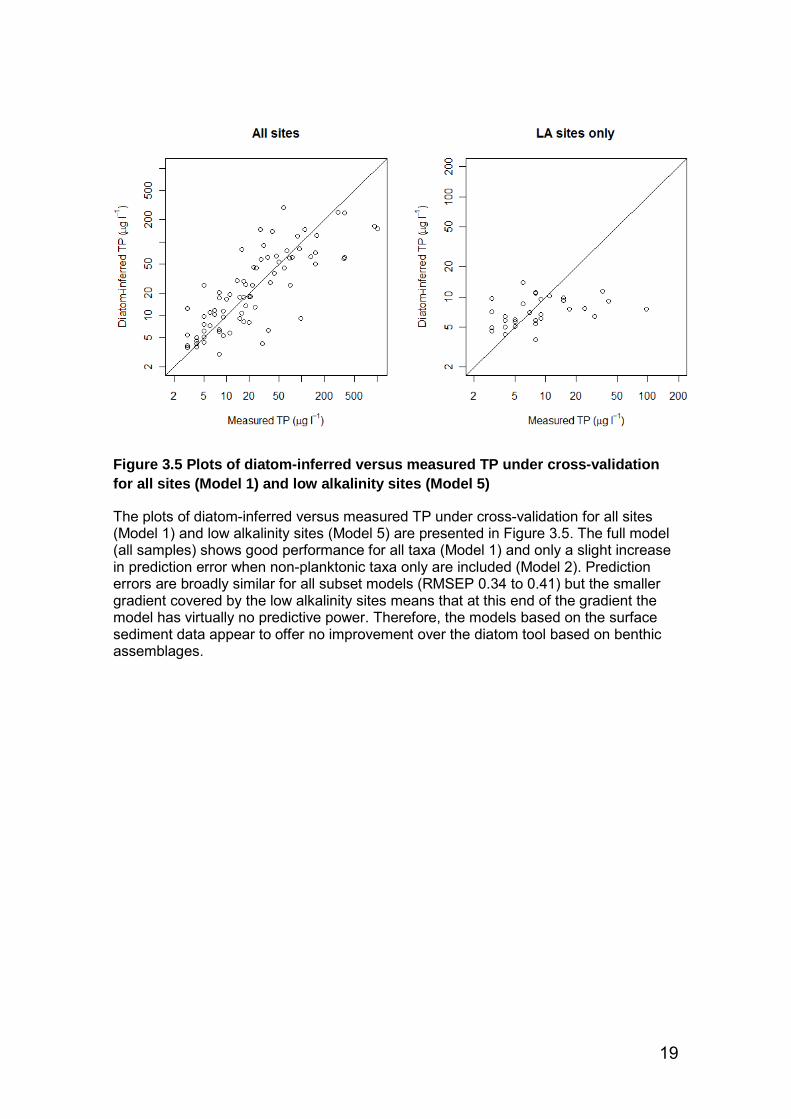
Figure 3.5 Plots of diatom-inferred versus measured TP under cross-validation for all sites (Model 1) and low alkalinity sites (Model 5)
The plots of diatom-inferred versus measured TP under cross-validation for all sites (Model 1) and low alkalinity sites (Model 5) are presented in Figure 3.5. The full model (all samples) shows good performance for all taxa (Model 1) and only a slight increase in prediction error when non-planktonic taxa only are included (Model 2). Prediction errors are broadly similar for all subset models (RMSEP 0.34 to 0.41) but the smaller gradient covered by the low alkalinity sites means that at this end of the gradient the model has virtually no predictive power. Therefore, the models based on the surface sediment data appear to offer no improvement over the diatom tool based on benthic assemblages.
Assessment of ecological status in UK lakes using diatoms 20
4 Discussion In contrast to rivers, modern periphyton communities have not been widely used in bioassessment of lakes. However, the advent of the WFD in 2000 required the development of lake classification tools based on phytobenthos. Several studies have employed existing diatom indices developed for rivers in order to classify lakes. For example, Ács et al. (2005) applied a range of benthic diatom indices to epiphyton (reed) samples from Lake Velence, a shallow lake in Hungary, using Omnidia software (Lecointe et al. 1993, 2008). The authors concluded that the index Indice Biologique Diatomées (IBD) (Lenoir and Coste 1996) was the best suited for classifying the ecological status of the lake and showed a significant (p <0.01) negative correlation with TP. Similarly, Blanco et al. (2004) applied existing river indices to determine the trophic and saprobic state of six shallow Spanish lakes. A significant correlation was found between total nitrogen concentration and the diatom indices Specific Polluosensitivity Index (SPI) (Coste in CEMAGREF 1982) and IBD. They concluded that the two diatom indices were suitable for biomonitoring purposes in these lentic systems. It should be noted, however, that indices such as IBD and SPI are designed to indicate ‘general pollution’ and are optimised to saprobic and organic pollution. Recent experience from the lake diatom classification tool EU Member State intercalibration process suggests that only about half of the nutrient gradient is covered when these indices are applied to lakes. Furthermore, there is no apparent underlying ecological rationale for index selection; rather the index that has the highest correlation coefficient with measured nutrient variables is considered to be the most suitable. While a number of authors have examined the relationships between taxonomic composition of benthic algal communities and measured environmental variables in lakes (e.g. King et al. 2000, Schoenfelder et al. 2002, Kitner and Poulíčková 2003, DeNicola et al. 2004, Denys 2004, 2006, 2007, Poulíčková et al. 2004), these studies were not specifically designed to produce indices for WFD purposes. More recently, several countries have produced WFD-compliant phytobenthos tools specifically for lakes and several more are in development. Schaumburg et al. (2004, 2007) employed a variety of substrates from 100 lakes to develop a diatom index for four German lake types, known as the Diatom Index for Lakes (DISeen) which combined the Trophic-Index (TI) developed by Hofmann (1994) with a Quotient of Reference Species (RAQ). They subsequently combined the diatom metric with one developed for macrophytes to give an overall assessment of lakes for the biological element macrophytes and phytobenthos. Stenger-Kovacs et al. (2007) developed the Trophic Diatom Index for Lakes (TDIL) in Hungary, applicable to ten lake types, using epiphytic diatom samples from 83 lowland, shallow lakes and weighted averaging methods. The TDIL was applied to a number of lakes which classified the ecological status as excellent (4), good (25), medium (21), tolerable (21) and bad (12) status. Bolla et al. (2010) analysed the applicability of different river and lake diatom indices for assessing the ecological status of Lake Balaton in Hungary. They concluded that IBD and TDIL were the best methods for assessing the water quality of Lake Balaton as determined by correlation between the various indices and measured chemical parameters. They subsequently developed a multimetric index from the two (Multimetric Index for Lake Balaton, MIB = (IBD+TDIL)/2).
4.1 Definition of reference sites and ‘high status’ Some of the studies described above do not define the reference condition or explain how reference sites are selected, yet this is fundamental to WFD compliance. A notable exception is Denys (2003), who compared the present-day variation in
21
sedimentary and epiphytic diatoms of coastal dune wetlands with that of similar habitats occurring between c. 1850 and 1930 using diatom assemblages from recent samples and historical counterparts obtained from herbarium specimens of macrophytes. While this study was not designed to fulfil the requirements of the WFD, it does address the definition of reference conditions and illustrates the value of collection material as a valid and easily accessible source of historical information. In DALES, reference sites were defined using a range of methods including spatial state schemes, palaeoecology, modelling and to a lesser extent expert judgement. Unlike rivers, lakes have the benefit of a sedimentary record that can be used to establish historical conditions directly (e.g. Bennion et al. 2004, Bennion and Simpson 2011) or can be used to assess whether lakes have undergone change in response to pressures, such as eutrophication, and thereby to determine which lakes might be considered as reference sites (e.g. Leira et al. 2006). For the purposes of this classification tool, a total of 35, 13 and 7 reference sites were generated for low, medium and high alkalinity lakes, respectively. While the number of reference sites was considered adequate for the former two lake types, unfortunately, there are few examples of high alkalinity reference lakes in the UK owing to the long history of impacts in lowland Britain and the productive nature of the lake catchments (e.g. Bennion et al. 2004). We must accept, therefore, that our definition of reference condition for the latter lake type is less robust than for the low and medium alkalinity sites.
4.2 Measuring deviations from reference conditions A modification of the TDI (Kelly and Whitton 1995) termed the Lake TDI (LTDI) was developed as the basis for the lakes diatom tool. This well established weighted-average metric has the advantage of easy conversion to an EQR. Nonetheless the approach is limited in that only a single pressure gradient has been considered. While the concept of reference conditions is more-or-less universal, only deviations from reference that are caused by nutrients are assessed by the present EQR. This reflects the primary concerns of the UK regulatory agencies, and the underlying principles used to develop the present model provides a framework from which separate metrics could be developed for assessing other pressures, such as acidity. It is anticipated that the Diatom Acidification Metric (DAM) tool recently developed for streams (Environment Agency, SC070034/TR2) will be tested on a set of soft water lakes in the near future.
4.3 Definition of ‘good status’ and the good/moderate boundary Defining good status is, in many ways, more problematic than defining high status, largely because the normative definitions for good and moderate status allow a wide scope for interpretation. ‘Good status’ allows slight changes in the composition and abundance of macrophytic and phytobenthic taxa compared to type-specific communities while communities at moderate status differ moderately. The point at which the community ceases to be slightly changed and becomes moderately changed is the critical point beyond which a water body needs remedial measures in order to achieve good ecological status, but the terms of the WFD must be translated into objective and defensible concepts. There is no absolute justification for placement of the good/moderate boundary at any point on the ecological status gradient; however, in terms of the taxonomic composition, this is the point at which the numbers of taxa that are tolerant to nutrients (and which are, consequently, scarce in pristine environments) become relatively more abundant than the numbers of those that are sensitive to nutrients (and which tend to be most common in pristine environments). This, in turn,
Assessment of ecological status in UK lakes using diatoms 22
reflects structural and ecophysiological changes in the phytobenthos (insofar as these can be inferred from the taxonomic composition of benthic diatoms: see Kelly et al. 2008b, 2009). The group of ‘sensitive’ taxa in the lakes dataset, and similarly in rivers (Kelly et al. 2008a) is dominated largely by Achnanthidium minutissimum and Fragilaria capucina, while the tolerant category is dominated by Amphora pediculus, Navicula and Nitzschia. At the lower end of ‘good status’, therefore, a number of pollution-tolerant taxa are found. Such taxa are, in low numbers, a natural part of the biota and a concept of ‘good status’ can embrace the possibility of short-term, low impact pollution events that affect the flora but from which recovery can be rapid. A switch to a biofilm dominated by more ‘nutrient demanding’ species will occur with increasing enrichment of key nutrients and these species will proliferate, outcompeting the more sensitive species. In thicker biofilms, therefore, species diversity will probably be reduced (Tilman 1982, Fairchild and Lowe 1984). The marked increase in motile species (e.g. Navicula gregaria and Nitzschia dissipata) at the good/moderate interface may be explained by their ability to exploit resources unavailable to those occupying a fixed position within thick biofilms. The success of adnate (attached) species, such as Achnanthidium minutissimum and Cocconeis placentula, may also be compromised as they experience light and nutrient limitation. However, these species can still occur as epiphytes on filamentous algae such as Cladophora. This alternative strategy removes them from the constraints that develop within thicker biofilms. Under enriched conditions, the most prolific of the sessile diatoms are often those commonly assumed to be ‘epiphytes’ (e.g. Cocconeis pediculus, Rhoicosphenia abbreviata). The lack of response of the low alkalinity models deserves closer examination. One possibility is that the pressure–response relationship was compromised by the merging of taxa to form aggregates such as Achnanthidium minutissimum sensu lato. There is evidence that taxa within the A. minutissimum complex have distinct ecological preferences (Potapova and Hamilton 2007) and, therefore, greater taxonomic discrimination may have given a stronger relationship with the pressure gradient than was observed here. Another possibility is that the scarcity of impacted low alkalinity lakes, a lake type that tends to occur in areas where agricultural productivity is low and where there are few settlements, means that we have been unable to capture the full gradient of response. Over the range we have studied, a ‘generalist’ taxon such as A. minutissimum is not outcompeted by nutrient-tolerant taxa. The results of the Cumbrian lakes validation exercise (Table 3.5) indicates that, for low alkalinity lakes in particular, DALES is more relaxed than other UK tools. Rather than reflecting an inadequacy in the DALES model, it is considered that this is more likely to reflect an accurate assessment of the condition of the littoral biofilm which is, essentially, a robust assemblage of organisms that can adapt to slightly increased levels of pressure. Assemblages dominated by Achnanthidium minutissimum often indicate disturbance and/or grazing (Biggs et al. 1998), and hence the persistence of this taxon suggests that slightly increased levels of pressure do not lead to fundamental alterations in the energy flow through the ecosystem and ecological functioning, in this part of the biota at least, has not measurably changed. When viewed on a wider scale, a method based on littoral phytobenthos will only give a partial view of the status of the whole lake ecosystem and lake management will be based on data from more than one biological quality element.
23
5 Conclusion The project has successfully developed a diatom model, the LTDI, for assessing ecological status of lakes along a nutrient gradient and a rationale for placing status class boundaries along this gradient for three lake types. Two-thirds of all lakes identified as reference sites were classified as high with the remainder classified as good, while for non-reference lakes the model predicted the majority of sites to be good or worse. The model, therefore, performs well. However, for low alkalinity lakes in particular, DALES appears to be more relaxed than other UK tools, but this may be largely due to the apparent lack of sensitivity of the benthic diatoms to nutrient pressure in this lake type, and additionally to the confounding effect of their relationship with alkalinity. Furthermore, the scarcity of impacted low alkalinity lakes makes it difficult to capture the full gradient of response. Nevertheless, DALES gives a reasonable assessment of the condition of the littoral biofilm and makes a valuable contribution to the classification toolkit for UK standing waters.
Assessment of ecological status in UK lakes using diatoms 24
References Ács, E., Reskóné, N.M., Szabó, K., Taba, Gy. and Kiss, K.T. 2005. Application of epiphytic diatoms in water quality monitoring of Lake Velence – recommendations and assignments. Acta Botanica Hungarica, 47, 211–223. Battarbee, R.W. 1999. The importance of paleolimnology to lake restoration. Hydrobiologia, 395/396, 149–159. Battarbee, R.W., Jones, V.J., Flower, R.J., Cameron, N.G., Bennion, H., Carvalho, L. and Juggins, S. 2001. Diatoms. In: Tracking Environmental Change Using Lake Sediments. Volume 3: Terrestrial, Algal and Siliceous Indicators, edited by J.P. Smol., H.J.B. Birks and W.M. Last, pp. 155–202. Dordrecht: Kluwer. Bennion, H. 1995. Surface-sediment diatom assemblages in shallow, artificial, enriched ponds, and implications for reconstructing trophic status. Diatom Research, 10, 1–19. Bennion, H. (ed.) 2004. Identification of Reference Lakes and Evaluation of Palaeoecological Approaches to Define Reference Conditions for UK (England, Wales, Scotland & Northern Ireland) Ecotypes. Final report to the Scotland and Northern Ireland Forum for Environmental Research, Project WFD08. Bennion, H. and Simpson, G.L. 2011. The use of diatom records to establish reference conditions for UK lakes subject to eutrophication. Journal of Paleolimnology, 45(4) 469–488. Bennion, H., Juggins, S. and Anderson, N.J. 1996. Predicting epilimnetic phosphorus concentrations using an improved diatom-based transfer function and its application to lake eutrophication management. Environmental Science and Technology, 30, 2004–2007. Bennion, H., Monteith, D. and Appleby, P. 2000a. Temporal and geographical variation in lake trophic status in the English Lake District: evidence from (sub)fossil diatoms and aquatic macrophytes. Freshwater Biology, 45, 394–412. Bennion, H., Appleby, P., Boyle, J., Carvalho, L., Luckes, S. and Henderson, A. 2000b. Water Quality Investigation of Loweswater, Cumbria. Final Report to the Environment Agency by the Environmental Change Research Centre, University College London, 80pp. Bennion, H., Fluin, J., Appleby, P. and Ferrier, B. 2001. Palaeolimnological Investigation of Scottish Freshwater Lochs. Final report to SNIFFER No. SR(00)02 by ENSIS Ltd, University College London. Bennion, H., Shilland, E. and Appleby, P.G. 2003a. An assessment of recent environmental change in Llyn Tegid using the sediment record. In: The Ecology, Conservation and Environmental History of the Largest Natural Lake in Wales, edited by R.H. Gritten, C.A. Duigan and H. Millband, pp. 153–168. University of Liverpool. Bennion, H. et al. 2003b. Development of a Risk Based Prioritisation Protocol for Standing Waters in Great Britain Based on a Georeferenced Inventory – Phase 2. Environment Agency R&D Technical Report P2-260/2/TR1.
25
Bennion, H., Fluin, J. and Simpson, G.L. 2004. Assessing eutrophication and reference conditions for Scottish freshwater lochs using subfossil diatoms. Journal of Applied Ecology, 41, 124–138. Biggs, B.J.F., Stevenson, R.J. and Lowe, R.L. 1998. A habitat matrix conceptual model for stream periphyton. Archiv für Hydrobiologie, 143, 21–56. Blanco, S., Ector, L. and Bécares, E. 2004. Epiphytic diatoms as water quality indicators in Spanish shallow lakes. Vie et Milieu, 54, 71–79. Bolla, B., Borics, G., Kiss, K.T., Reskóné, N.M., Várbíró, G. and Ács, É. 2010. Recommendations for ecological status assessment of Lake Balaton (largest shallow lake of Central Europe), based on benthic diatom communities Vie et Milieu – Life and Environment, 60, 197–208. Burgess, A., Bennion, H. and Clarke, G. 2005. Assessing Reference Conditions and Ecological Status for Lakes Using Subfossil Diatoms. Final Report to the Environment Agency under contract no. SC030103. ECRC Research Report No. 105 and Environment Agency Science Report No. SC030103/SR3. Carvalho, L., Solimini, A., Phillips, G., van den Berg, M., Pietilainen, O.-P., Lyche Solheim, A., Poikane, S. and Mischke, U. 2008. Chlorophyll reference conditions for European lake types used for intercalibration of ecological status. Aquatic Ecology, 42, 203–211. CEMAGREF, 1982. Etude de Méthodes Biologiques Quantitatives d’Appreciation de la Qualité des Eaux. Rapport Q.E. Lyon-A.F.B. Rhône-Mediterrannée-Corse. CEN, 2003. Water Quality – Guidance Standard for the Routine Sampling and Pretreatment of Benthic Diatoms from Rivers. EN 13946:2003. Geneva: Comité European de Normalisation. CEN, 2004. Water Quality – Guidance Standard for the Identification, Enumeration and Interpretation of Benthic Diatom Samples from Running Waters. EN 14407:2004. Geneva: Comité European de Normalisation. Cumming, B.F., Smol, J.P., Kingston, J.C., Charles, D.F., Birks, H.J.B., Camburn, K.E., Dixit, S.S., Uutala, A.J. and Selle, A.R. 1992. How much acidification has occurred in Adirondack region lakes (New York, USA) since preindustrial times? Canadian Journal of Fisheries and Aquatic Sciences, 49, 128–141. DeNicola, D.M., de Eyto, E., Wemaere, A. and Irvine, K. 2004. Using epilithic algal communities to assess trophic status in Irish lakes. Journal of Phycology, 40, 481–495. Denys, L. 2003. Environmental changes in man-made coastal dune pools since 1850 as indicated by sedimentary and epiphytic assemblages (Belgium). Aquatic Conservation: Marine and Freshwater Ecosystems, 13, 191–211. Denys, L. 2004. Relation of abundance-weighted averages of diatom indicator values to measured environmental conditions in standing freshwaters. Ecological Indicators, 4, 255–275. Denys, L. 2006. Calibration of littoral diatoms to water chemistry in standing fresh waters (Flanders, lower Belgium): inference models for historical sediment assemblages. Journal of Paleolimnology, 35, 763–787.
Assessment of ecological status in UK lakes using diatoms 26
Denys, L. 2007. Water-chemistry transfer functions for epiphytic diatoms in standing freshwaters and a comparison with models based on littoral sediment assemblages (Flanders, Belgium). Journal of Paleolimnology, 38, 97–116. Dixit, S.S., Smol, J.P., Charles, D.F., Hughes, R.M., Paulsen, S.G. and Collins, G.B. 1999. Assessing water quality changes in the lakes of the northeastern United States using sediment diatoms. Canadian Journal of Fisheries and Aquatic Sciences, 56, 131–152. European Union, 2000. Directive 2000/60/EC of the European Parliament and of the Council of 23 October 2000 establishing a framework for Community action in the field of water policy. Official Journal of the European Communities, L327, 1–73. Fairchild, G.W. and Lowe, R.L. 1984. Artificial substrates which release nutrients: effects on periphyton and invertebrate succession. Hydrobiologia, 114, 29–37. Fourtanier, E. and Kociolek, J.P. 1999. Catalogue of the diatom genera. Diatom Research, 14, 1–190. Fozzard, I.R., Doughty, C.R., Ferrier, R.C., Leatherland, T.M. and Owen, R. 1999. A quality classification for management of Scottish standing waters. Hydrobiologia, 395/396, 433–453. Hartley, B., Barber, H.G. and Carter, J.R. 1996. An Atlas of British Diatoms, edited by P.A. Sims. Bristol: Biopress. Hendey, N.I. 1974. The permanganate method for cleaning freshly gathered diatoms. Microscopy, 32, 423–426. Hill, M., Mountford, J., Troy, D. and Bunce, R. 2000. Extending Ellenberg’s indicator values to a new area: an algorithmic approach. Journal of Applied Ecology, 37, 3–15. Hofmann, G. 1994. Aufwuchs-Diatomeen in Seen und ihre Eignung als Indikatoren der Trophie. J. Cramer, Berlin, Bibliotheca Diatomologica, 30, 241pp. Hughes, M., Hornby, D., Bennion, H., Kernan, M., Hilton, J., Phillips, G. and Thomas, R. 2004. The development of a GIS-based inventory of standing waters in Great Britain together with a risk-based prioritisation protocol. Water, Air and Soil Pollution: Focus, 4, 73–84. Kelly, M.G. and Whitton, B.A. 1995. The Trophic Diatom Index: a new index for monitoring eutrophication in rivers. Journal of Applied Phycology, 7, 433–444. Kelly, M.G., Cazaubon, A., Coring, E., Dell’uomo, A., Ector, L., Goldsmith, B., Guasch, H., Hürlimann, J., Jarlman, A., Kawecka, B., Kwandrans, J., Laugaste, R., Lindstrøm, E.-A., Leitao, M., Marvan, P., Padisák, J., Pipp, E., Prygiel, J., Rott, E., Sabater, S., Van Dam, H. and Vizinet, J. 1998. Recommendations for the routine sampling of diatoms for water quality assessments in Europe. Journal of Applied Phycology, 10, 215–224. Kelly, M.G., Juggins, S., Bennion, H., Burgess, A., Yallop, M., Hirst, H., King, L., Jamieson, J., Guthrie, R. and Rippey, B. 2007. Use of Diatoms for Evaluating Ecological Status in UK Freshwaters. Environment Agency Science Report No. SC030103, Environment Agency, Bristol: 171pp. Kelly, M., Juggins, S., Guthrie, R., Pritchard, S., Jamieson, J., Rippey, B., Hirst, H. and
27
Yallop, M. 2008a. Assessment of ecological status in U.K. rivers using diatoms. Freshwater Biology, 53, 403–422. Kelly, M.G., King, L., Jones, R.I., Barker, P.A. and Jamieson, B.J. 2008b. Validation of diatoms as proxies for phytobenthos when assessing ecological status in lakes. Hydrobiologia, 610, 125–129. Kelly, M.G., King, L. and ní Chatháin, B. 2009. The conceptual basis of ecological status assessments using diatoms. Proceedings of the Royal Irish Academy: Biology and Environment, 109B, 175–189. King, L., Barker, P. and Jones, R.I. 2000. Epilithic algal communities and their relationship to environmental variables in lakes of the English Lake District. Freshwater Biology, 45, 425–442. King, L., Clarke, G., Bennion, H., Kelly, M.G. and Yallop, M.L. 2006. Recommendations for sampling littoral diatoms in lakes for ecological status assessments. Journal of Applied Phycology, 18, 15–25. Kitner, M. and Poulíčková, A. 2003. Littoral diatoms as indicators for the eutrophication of shallow lakes. Hydrobiologia, 506/509, 519–524. Krammer, K. and Lange-Bertalot, H. 1986. Die Süsswasserflora von Mitteleuropa 2: Bacillariophyceae. 1 Teil: Naviculaceae. Stuttgart: Gustav Fischer-Verlag. Krammer, K. and Lange-Bertalot, H. 1997. Die Süßwasserflora von Mitteleuropa,II:2. Bacillariophyceae. 2 Teil: Bacillariaceae, Epithemiaceae, Surirellaceae. 2nd edition, mit einem neuen Anhang. Stuttgart: Gustav Fischer-Verlag. Krammer, K. and Lange-Bertalot, H. 2000. Die Süsswasserflora von Mitteleuropa 2: Bacillariophyceae. 3 Teil: Centrales, Fragilariaceae, Eunotiaceae. 2nd edition. Stuttgart: Gustav Fischer Verlag. Krammer, K. and Lange-Bertalot, H. 2004. Süsswasserflora von Mitteleuropa 2, Bacillariophyceae. 4 Teil: Achnanthaceae. Kritische Ergänzungen zu Achnanthes s.l., Navicula s. str., Gomphonema. Stuttgart: Gustav Fischer Verlag. Lecointe C., Coste M. and Prygiel J. 1993. OMNIDIA software for taxonomy, calculation of diatom indices and inventories management. Hydrobiologia, 269/270, 509–513. Lecointe, C., Coste, M. and Prygiel, J. 2008. OMNIDIA Version 5.2 Software for Diatom-Based Water Quality Assessment. CD-ROM. Leira, M., Jordan, P., Taylor, D., Dalton, C., Bennion, H., Rose, N. and Irvine, K. 2006. Assessing the ecological status of candidate reference lakes in Ireland using palaeolimnology. Journal of Applied Ecology, 43, 816–827. Lenoir, A. and Coste, M. 1996. Development of a practical diatom index of overall water quality applicable to the French National Water Board network. In: Use of Algae for Monitoring Rivers II, Innsbruck, Austria, 17–19 September 1995, edited by B.A. Whitton and E. Rott, pp. 29–43. Innsbruck: Studia Student, GmbH. Maberley, S.C., King, L., Gibson, C.E., May, L., Jones, R.I., Dent, M.M. and Jordan, C. 2003. Linking nutrient limitation and water chemistry in upland lakes to catchment characteristics. Hydrobiologia, 506–509, 83–91.
Assessment of ecological status in UK lakes using diatoms 28
Overpeck, J.T., Webb, T. and Prentice, I.C. 1985. Quantitative interpretation of fossil pollen spectra – dissimilarity coefficients and the method of modern analogs. Quaternary Research, 23, 87–108. Phillips, G. 2003. Reporting Typology for Ecoregion 18, Great Britain. TAG/LTT 43, March 2003. Phillips, G. 2006. Record of Reference Lakes. TAG/LTT 106, 31 March 2006. Phillips, G., Pietilainen, O.-P., Carvalho, L., Solimini, A., Lyche Solheim, A. and Cardoso, A.C. 2008. Chlorophyll–nutrient relationships of different lake types using a large European dataset. Aquatic Ecology, 42, 213–226. Pollard, P. and Huxham, M. 1998. The European Water Framework Directive: a new era in the management of aquatic ecosystem health? Aquatic Conservation: Marine and Freshwater Ecosystems, 8, 773–792. Potapova, M. and Hamilton, P.B. 2007. Morphological and ecological variation within the Achnanthidium minutissimum (Bacillariophyceae) species complex. Journal of Phycology, 45, 561–575. Poulíčková, A., Ducholav, M. and Dokulil, M. 2004. Littoral diatom assemblages as bioindicators of lake trophic status: a case study from perialpine lakes in Austria. European Journal of Phycology, 39, 143–152. Quinn, G. and Keough, M. 2002. Experimental Design and Data Analysis for Biologists. Cambridge: Cambridge University Press. R Development Core Team, 2004. R: A Language and Environment for Statistical Computing. Vienna, Austria: R Foundation for Statistical Computing. ISBN 3-900051-00-3, http://www.R-project.org. Reavie, E.D., Smol, J.P. and Dillon, P.J. 2002. Inferring long-term nutrient changes in southeastern Ontario lakes: comparing paleolimnological and mass-balance models. Hydrobiologia, 481, 61–74. Round, F.E., Crawford, R.M. and Mann, D.G. 1990. The Diatoms: Biology and Morphology of the Genera. Cambridge: Cambridge University Press. Ruse, L.P. 2002. Chironomid pupal exuviae as indicators of lake status. Archiv für Hydrobiologie, 153, 367–390. Schaumburg, J., Schranz, C., Hofmann, G., Stelzer, D., Schneider, S. and Schmedtje, U. 2004. Macrophytes and phytobenthos as indicators of ecological status in German lakes – a contribution to the implementation of the Water Framework Directive. Limnologica, 34, 302–314. Schaumburg, J., Schranz, C., Stelzer, D. and Hofmann, G. 2007. Action Instructions For the Ecological Evaluation of Lakes for Implementation of the EU Water Framework Directive: Makrophytes and Phytobenthos. Bavarian Environment Agency. Schoenfelder, I., Gelbrecht, J., Schoenfelder, J. and Steinberg, C.E.W. 2002. Relationships between littoral diatoms and their chemical environment in northeastern German lakes and rivers. Journal of Phycology, 38, 66–82.
29
Simpson, G.L. 2005. Defining Restoration Targets for Acidified Upland Lakes Using Diatom and Cladoceran Sub-Fossil Remains and the Modern Analogue Approach. Unpublished PhD Thesis, University of London. Simpson, G.L., Shilland, E.M., Winterbottom, J.M. and Keay, J. 2005. Defining reference conditions for acidified waters using a modern analogue approach. Environmental Pollution, 137, 119–133. Stenger-Kovacs, C., Buczko, K., Hajnal, E. and Padisák, J. 2007. Epiphytic, littoral diatoms as bioindicators of shallow lake trophic status: Trophic Diatom Index for Lakes (TDIL) developed in Hungary. Hydrobiologia, 589, 141–154. Tilman, D. 1982. Resource Competition and Community Structure. Princeton: Princeton University Press. Walley, W.J., Grbovic, J. and Dzeroski, S. 2001. A reappraisal of saprobic values and indicator weights based on Slovenian river quality data. Water Research, 35, 4285–4292. Whitton, B.A., John, D.M., Johnson, L.R., Boulton, P.N.G., Kelly, M.G. and Haworth, E.Y. 1998. A Coded List of Freshwater Algae of the British Isles, iv + 274pp. LOIS publication number 222. Wallingford: Institute of Hydrology. Willby, N., Pitt, J.-A. and Phillips, G. 2009. The Ecological Classification of UK Lakes Using Aquatic Macrophytes. Science Report – SC010080/SR2. Bristol: Environment Agency.
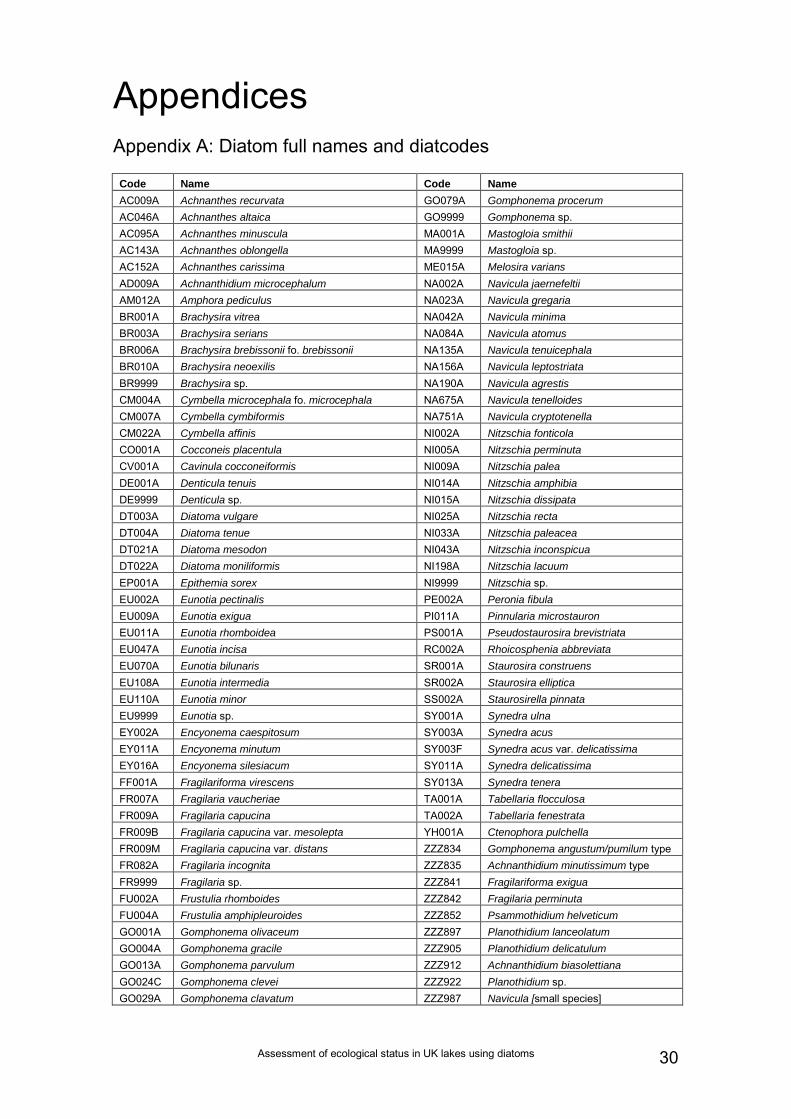
Assessment of ecological status in UK lakes using diatoms 30
Appendices Appendix A: Diatom full names and diatcodes
Code Name Code Name AC009A Achnanthes recurvata GO079A Gomphonema procerum AC046A Achnanthes altaica GO9999 Gomphonema sp. AC095A Achnanthes minuscula MA001A Mastogloia smithii AC143A Achnanthes oblongella MA9999 Mastogloia sp. AC152A Achnanthes carissima ME015A Melosira varians AD009A Achnanthidium microcephalum NA002A Navicula jaernefeltii AM012A Amphora pediculus NA023A Navicula gregaria BR001A Brachysira vitrea NA042A Navicula minima BR003A Brachysira serians NA084A Navicula atomus BR006A Brachysira brebissonii fo. brebissonii NA135A Navicula tenuicephala BR010A Brachysira neoexilis NA156A Navicula leptostriata BR9999 Brachysira sp. NA190A Navicula agrestis CM004A Cymbella microcephala fo. microcephala NA675A Navicula tenelloides CM007A Cymbella cymbiformis NA751A Navicula cryptotenella CM022A Cymbella affinis NI002A Nitzschia fonticola CO001A Cocconeis placentula NI005A Nitzschia perminuta CV001A Cavinula cocconeiformis NI009A Nitzschia palea DE001A Denticula tenuis NI014A Nitzschia amphibia DE9999 Denticula sp. NI015A Nitzschia dissipata DT003A Diatoma vulgare NI025A Nitzschia recta DT004A Diatoma tenue NI033A Nitzschia paleacea DT021A Diatoma mesodon NI043A Nitzschia inconspicua DT022A Diatoma moniliformis NI198A Nitzschia lacuum EP001A Epithemia sorex NI9999 Nitzschia sp. EU002A Eunotia pectinalis PE002A Peronia fibula EU009A Eunotia exigua PI011A Pinnularia microstauron EU011A Eunotia rhomboidea PS001A Pseudostaurosira brevistriata EU047A Eunotia incisa RC002A Rhoicosphenia abbreviata EU070A Eunotia bilunaris SR001A Staurosira construens EU108A Eunotia intermedia SR002A Staurosira elliptica EU110A Eunotia minor SS002A Staurosirella pinnata EU9999 Eunotia sp. SY001A Synedra ulna EY002A Encyonema caespitosum SY003A Synedra acus EY011A Encyonema minutum SY003F Synedra acus var. delicatissima EY016A Encyonema silesiacum SY011A Synedra delicatissima FF001A Fragilariforma virescens SY013A Synedra tenera FR007A Fragilaria vaucheriae TA001A Tabellaria flocculosa FR009A Fragilaria capucina TA002A Tabellaria fenestrata FR009B Fragilaria capucina var. mesolepta YH001A Ctenophora pulchella FR009M Fragilaria capucina var. distans ZZZ834 Gomphonema angustum/pumilum type FR082A Fragilaria incognita ZZZ835 Achnanthidium minutissimum type FR9999 Fragilaria sp. ZZZ841 Fragilariforma exigua FU002A Frustulia rhomboides ZZZ842 Fragilaria perminuta FU004A Frustulia amphipleuroides ZZZ852 Psammothidium helveticum GO001A Gomphonema olivaceum ZZZ897 Planothidium lanceolatum GO004A Gomphonema gracile ZZZ905 Planothidium delicatulum GO013A Gomphonema parvulum ZZZ912 Achnanthidium biasolettiana GO024C Gomphonema clevei ZZZ922 Planothidium sp. GO029A Gomphonema clavatum ZZZ987 Navicula [small species]
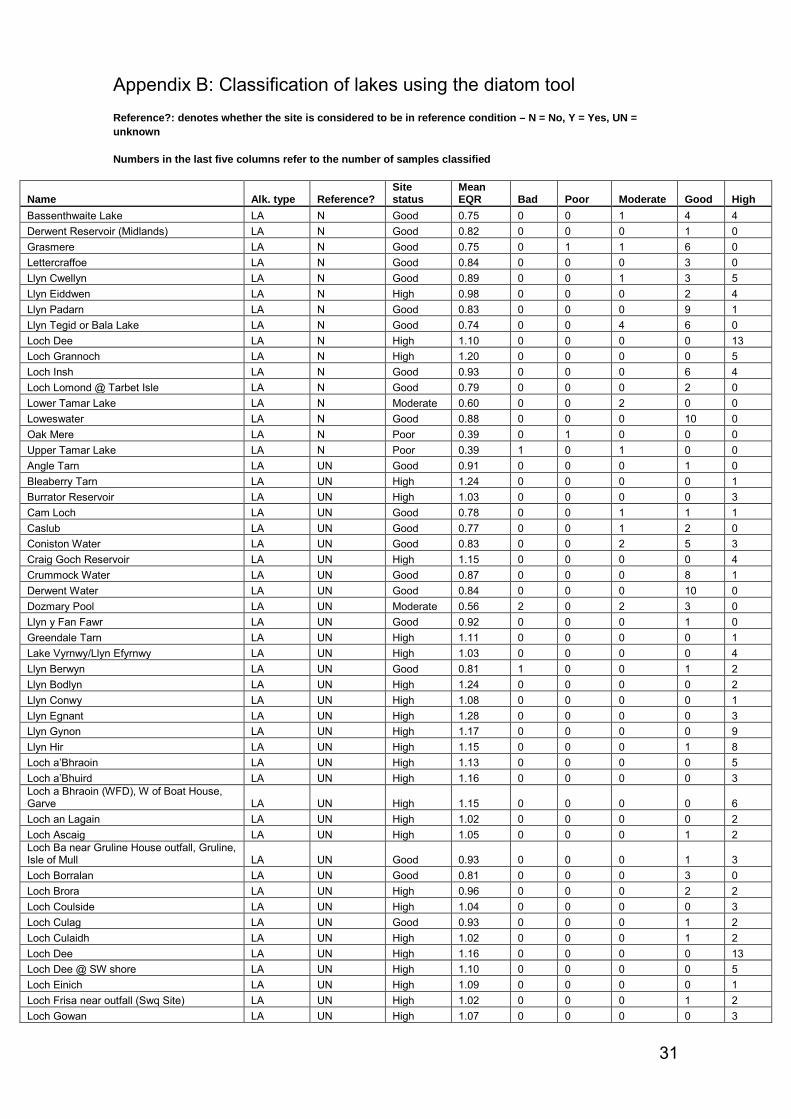
31
Appendix B: Classification of lakes using the diatom tool Reference?: denotes whether the site is considered to be in reference condition – N = No, Y = Yes, UN = unknown
Numbers in the last five columns refer to the number of samples classified
Name Alk. type Reference? Site status
Mean EQR Bad Poor Moderate Good High
Bassenthwaite Lake LA N Good 0.75 0 0 1 4 4 Derwent Reservoir (Midlands) LA N Good 0.82 0 0 0 1 0 Grasmere LA N Good 0.75 0 1 1 6 0 Lettercraffoe LA N Good 0.84 0 0 0 3 0 Llyn Cwellyn LA N Good 0.89 0 0 1 3 5 Llyn Eiddwen LA N High 0.98 0 0 0 2 4 Llyn Padarn LA N Good 0.83 0 0 0 9 1 Llyn Tegid or Bala Lake LA N Good 0.74 0 0 4 6 0 Loch Dee LA N High 1.10 0 0 0 0 13 Loch Grannoch LA N High 1.20 0 0 0 0 5 Loch Insh LA N Good 0.93 0 0 0 6 4 Loch Lomond @ Tarbet Isle LA N Good 0.79 0 0 0 2 0 Lower Tamar Lake LA N Moderate 0.60 0 0 2 0 0 Loweswater LA N Good 0.88 0 0 0 10 0 Oak Mere LA N Poor 0.39 0 1 0 0 0 Upper Tamar Lake LA N Poor 0.39 1 0 1 0 0 Angle Tarn LA UN Good 0.91 0 0 0 1 0 Bleaberry Tarn LA UN High 1.24 0 0 0 0 1 Burrator Reservoir LA UN High 1.03 0 0 0 0 3 Cam Loch LA UN Good 0.78 0 0 1 1 1 Caslub LA UN Good 0.77 0 0 1 2 0 Coniston Water LA UN Good 0.83 0 0 2 5 3 Craig Goch Reservoir LA UN High 1.15 0 0 0 0 4 Crummock Water LA UN Good 0.87 0 0 0 8 1 Derwent Water LA UN Good 0.84 0 0 0 10 0 Dozmary Pool LA UN Moderate 0.56 2 0 2 3 0 Llyn y Fan Fawr LA UN Good 0.92 0 0 0 1 0 Greendale Tarn LA UN High 1.11 0 0 0 0 1 Lake Vyrnwy/Llyn Efyrnwy LA UN High 1.03 0 0 0 0 4 Llyn Berwyn LA UN Good 0.81 1 0 0 1 2 Llyn Bodlyn LA UN High 1.24 0 0 0 0 2 Llyn Conwy LA UN High 1.08 0 0 0 0 1 Llyn Egnant LA UN High 1.28 0 0 0 0 3 Llyn Gynon LA UN High 1.17 0 0 0 0 9 Llyn Hir LA UN High 1.15 0 0 0 1 8 Loch a’Bhraoin LA UN High 1.13 0 0 0 0 5 Loch a’Bhuird LA UN High 1.16 0 0 0 0 3 Loch a Bhraoin (WFD), W of Boat House, Garve LA UN High 1.15 0 0 0 0 6 Loch an Lagain LA UN High 1.02 0 0 0 0 2 Loch Ascaig LA UN High 1.05 0 0 0 1 2 Loch Ba near Gruline House outfall, Gruline, Isle of Mull LA UN Good 0.93 0 0 0 1 3 Loch Borralan LA UN Good 0.81 0 0 0 3 0 Loch Brora LA UN High 0.96 0 0 0 2 2 Loch Coulside LA UN High 1.04 0 0 0 0 3 Loch Culag LA UN Good 0.93 0 0 0 1 2 Loch Culaidh LA UN High 1.02 0 0 0 1 2 Loch Dee LA UN High 1.16 0 0 0 0 13 Loch Dee @ SW shore LA UN High 1.10 0 0 0 0 5 Loch Einich LA UN High 1.09 0 0 0 0 1 Loch Frisa near outfall (Swq Site) LA UN High 1.02 0 0 0 1 2 Loch Gowan LA UN High 1.07 0 0 0 0 3
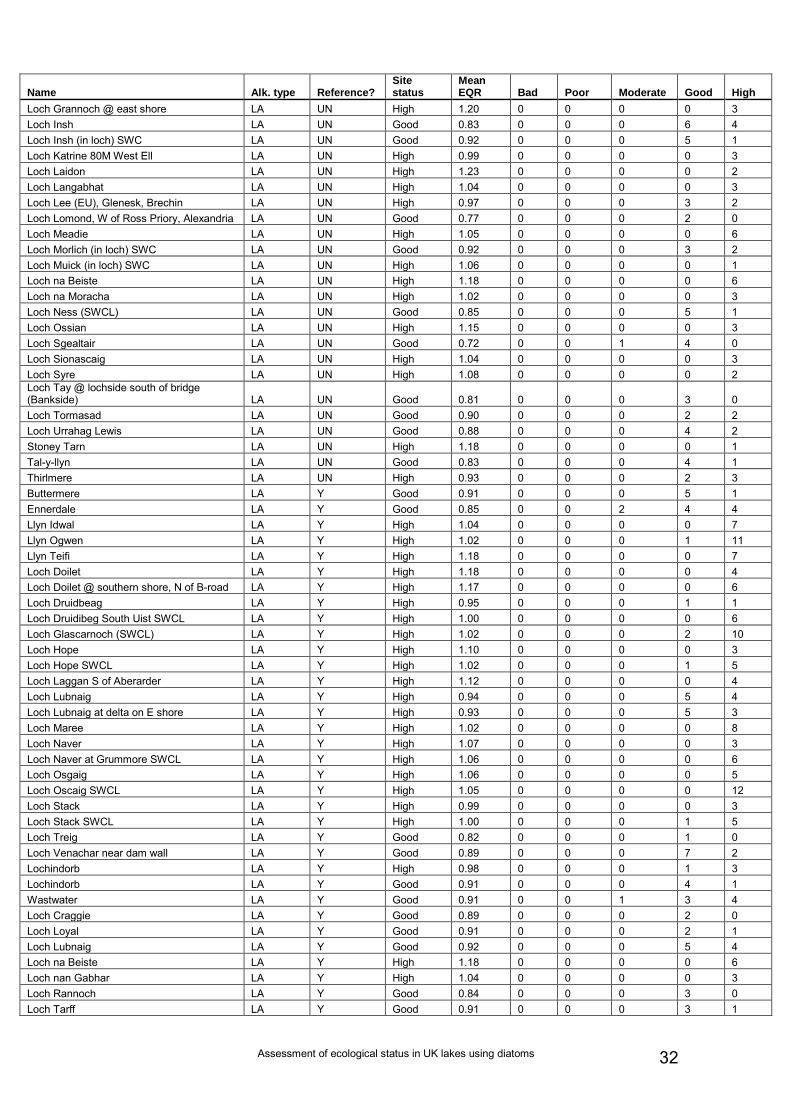
Assessment of ecological status in UK lakes using diatoms 32
Name Alk. type Reference? Site status
Mean EQR Bad Poor Moderate Good High
Loch Grannoch @ east shore LA UN High 1.20 0 0 0 0 3 Loch Insh LA UN Good 0.83 0 0 0 6 4 Loch Insh (in loch) SWC LA UN Good 0.92 0 0 0 5 1 Loch Katrine 80M West Ell LA UN High 0.99 0 0 0 0 3 Loch Laidon LA UN High 1.23 0 0 0 0 2 Loch Langabhat LA UN High 1.04 0 0 0 0 3 Loch Lee (EU), Glenesk, Brechin LA UN High 0.97 0 0 0 3 2 Loch Lomond, W of Ross Priory, Alexandria LA UN Good 0.77 0 0 0 2 0 Loch Meadie LA UN High 1.05 0 0 0 0 6 Loch Morlich (in loch) SWC LA UN Good 0.92 0 0 0 3 2 Loch Muick (in loch) SWC LA UN High 1.06 0 0 0 0 1 Loch na Beiste LA UN High 1.18 0 0 0 0 6 Loch na Moracha LA UN High 1.02 0 0 0 0 3 Loch Ness (SWCL) LA UN Good 0.85 0 0 0 5 1 Loch Ossian LA UN High 1.15 0 0 0 0 3 Loch Sgealtair LA UN Good 0.72 0 0 1 4 0 Loch Sionascaig LA UN High 1.04 0 0 0 0 3 Loch Syre LA UN High 1.08 0 0 0 0 2 Loch Tay @ lochside south of bridge (Bankside) LA UN Good 0.81 0 0 0 3 0 Loch Tormasad LA UN Good 0.90 0 0 0 2 2 Loch Urrahag Lewis LA UN Good 0.88 0 0 0 4 2 Stoney Tarn LA UN High 1.18 0 0 0 0 1 Tal-y-llyn LA UN Good 0.83 0 0 0 4 1 Thirlmere LA UN High 0.93 0 0 0 2 3 Buttermere LA Y Good 0.91 0 0 0 5 1 Ennerdale LA Y Good 0.85 0 0 2 4 4 Llyn Idwal LA Y High 1.04 0 0 0 0 7 Llyn Ogwen LA Y High 1.02 0 0 0 1 11 Llyn Teifi LA Y High 1.18 0 0 0 0 7 Loch Doilet LA Y High 1.18 0 0 0 0 4 Loch Doilet @ southern shore, N of B-road LA Y High 1.17 0 0 0 0 6 Loch Druidbeag LA Y High 0.95 0 0 0 1 1 Loch Druidibeg South Uist SWCL LA Y High 1.00 0 0 0 0 6 Loch Glascarnoch (SWCL) LA Y High 1.02 0 0 0 2 10 Loch Hope LA Y High 1.10 0 0 0 0 3 Loch Hope SWCL LA Y High 1.02 0 0 0 1 5 Loch Laggan S of Aberarder LA Y High 1.12 0 0 0 0 4 Loch Lubnaig LA Y High 0.94 0 0 0 5 4 Loch Lubnaig at delta on E shore LA Y High 0.93 0 0 0 5 3 Loch Maree LA Y High 1.02 0 0 0 0 8 Loch Naver LA Y High 1.07 0 0 0 0 3 Loch Naver at Grummore SWCL LA Y High 1.06 0 0 0 0 6 Loch Osgaig LA Y High 1.06 0 0 0 0 5 Loch Oscaig SWCL LA Y High 1.05 0 0 0 0 12 Loch Stack LA Y High 0.99 0 0 0 0 3 Loch Stack SWCL LA Y High 1.00 0 0 0 1 5 Loch Treig LA Y Good 0.82 0 0 0 1 0 Loch Venachar near dam wall LA Y Good 0.89 0 0 0 7 2 Lochindorb LA Y High 0.98 0 0 0 1 3 Lochindorb LA Y Good 0.91 0 0 0 4 1 Wastwater LA Y Good 0.91 0 0 1 3 4 Loch Craggie LA Y Good 0.89 0 0 0 2 0 Loch Loyal LA Y Good 0.91 0 0 0 2 1 Loch Lubnaig LA Y Good 0.92 0 0 0 5 4 Loch na Beiste LA Y High 1.18 0 0 0 0 6 Loch nan Gabhar LA Y High 1.04 0 0 0 0 3 Loch Rannoch LA Y Good 0.84 0 0 0 3 0 Loch Tarff LA Y Good 0.91 0 0 0 3 1
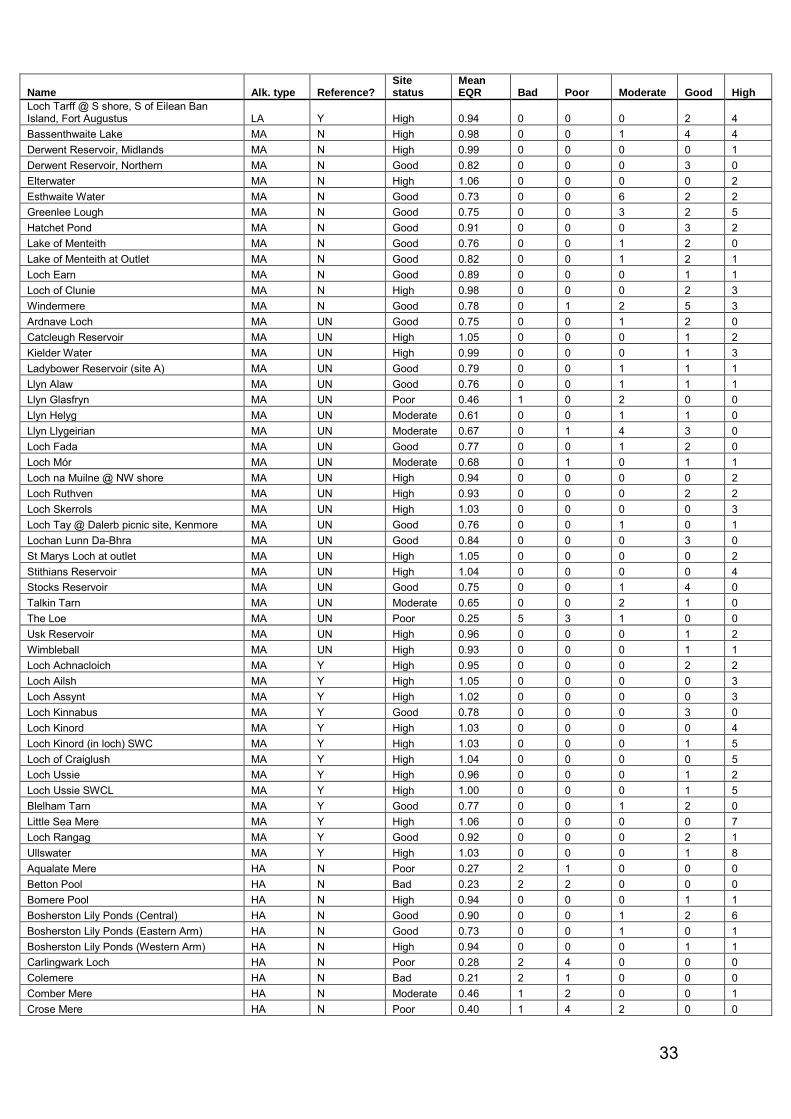
33
Name Alk. type Reference? Site status
Mean EQR Bad Poor Moderate Good High
Loch Tarff @ S shore, S of Eilean Ban Island, Fort Augustus LA Y High 0.94 0 0 0 2 4 Bassenthwaite Lake MA N High 0.98 0 0 1 4 4 Derwent Reservoir, Midlands MA N High 0.99 0 0 0 0 1 Derwent Reservoir, Northern MA N Good 0.82 0 0 0 3 0 Elterwater MA N High 1.06 0 0 0 0 2 Esthwaite Water MA N Good 0.73 0 0 6 2 2 Greenlee Lough MA N Good 0.75 0 0 3 2 5 Hatchet Pond MA N Good 0.91 0 0 0 3 2 Lake of Menteith MA N Good 0.76 0 0 1 2 0 Lake of Menteith at Outlet MA N Good 0.82 0 0 1 2 1 Loch Earn MA N Good 0.89 0 0 0 1 1 Loch of Clunie MA N High 0.98 0 0 0 2 3 Windermere MA N Good 0.78 0 1 2 5 3 Ardnave Loch MA UN Good 0.75 0 0 1 2 0 Catcleugh Reservoir MA UN High 1.05 0 0 0 1 2 Kielder Water MA UN High 0.99 0 0 0 1 3 Ladybower Reservoir (site A) MA UN Good 0.79 0 0 1 1 1 Llyn Alaw MA UN Good 0.76 0 0 1 1 1 Llyn Glasfryn MA UN Poor 0.46 1 0 2 0 0 Llyn Helyg MA UN Moderate 0.61 0 0 1 1 0 Llyn Llygeirian MA UN Moderate 0.67 0 1 4 3 0 Loch Fada MA UN Good 0.77 0 0 1 2 0 Loch Mór MA UN Moderate 0.68 0 1 0 1 1 Loch na Muilne @ NW shore MA UN High 0.94 0 0 0 0 2 Loch Ruthven MA UN High 0.93 0 0 0 2 2 Loch Skerrols MA UN High 1.03 0 0 0 0 3 Loch Tay @ Dalerb picnic site, Kenmore MA UN Good 0.76 0 0 1 0 1 Lochan Lunn Da-Bhra MA UN Good 0.84 0 0 0 3 0 St Marys Loch at outlet MA UN High 1.05 0 0 0 0 2 Stithians Reservoir MA UN High 1.04 0 0 0 0 4 Stocks Reservoir MA UN Good 0.75 0 0 1 4 0 Talkin Tarn MA UN Moderate 0.65 0 0 2 1 0 The Loe MA UN Poor 0.25 5 3 1 0 0 Usk Reservoir MA UN High 0.96 0 0 0 1 2 Wimbleball MA UN High 0.93 0 0 0 1 1 Loch Achnacloich MA Y High 0.95 0 0 0 2 2 Loch Ailsh MA Y High 1.05 0 0 0 0 3 Loch Assynt MA Y High 1.02 0 0 0 0 3 Loch Kinnabus MA Y Good 0.78 0 0 0 3 0 Loch Kinord MA Y High 1.03 0 0 0 0 4 Loch Kinord (in loch) SWC MA Y High 1.03 0 0 0 1 5 Loch of Craiglush MA Y High 1.04 0 0 0 0 5 Loch Ussie MA Y High 0.96 0 0 0 1 2 Loch Ussie SWCL MA Y High 1.00 0 0 0 1 5 Blelham Tarn MA Y Good 0.77 0 0 1 2 0 Little Sea Mere MA Y High 1.06 0 0 0 0 7 Loch Rangag MA Y Good 0.92 0 0 0 2 1 Ullswater MA Y High 1.03 0 0 0 1 8 Aqualate Mere HA N Poor 0.27 2 1 0 0 0 Betton Pool HA N Bad 0.23 2 2 0 0 0 Bomere Pool HA N High 0.94 0 0 0 1 1 Bosherston Lily Ponds (Central) HA N Good 0.90 0 0 1 2 6 Bosherston Lily Ponds (Eastern Arm) HA N Good 0.73 0 0 1 0 1 Bosherston Lily Ponds (Western Arm) HA N High 0.94 0 0 0 1 1 Carlingwark Loch HA N Poor 0.28 2 4 0 0 0 Colemere HA N Bad 0.21 2 1 0 0 0 Comber Mere HA N Moderate 0.46 1 2 0 0 1 Crose Mere HA N Poor 0.40 1 4 2 0 0
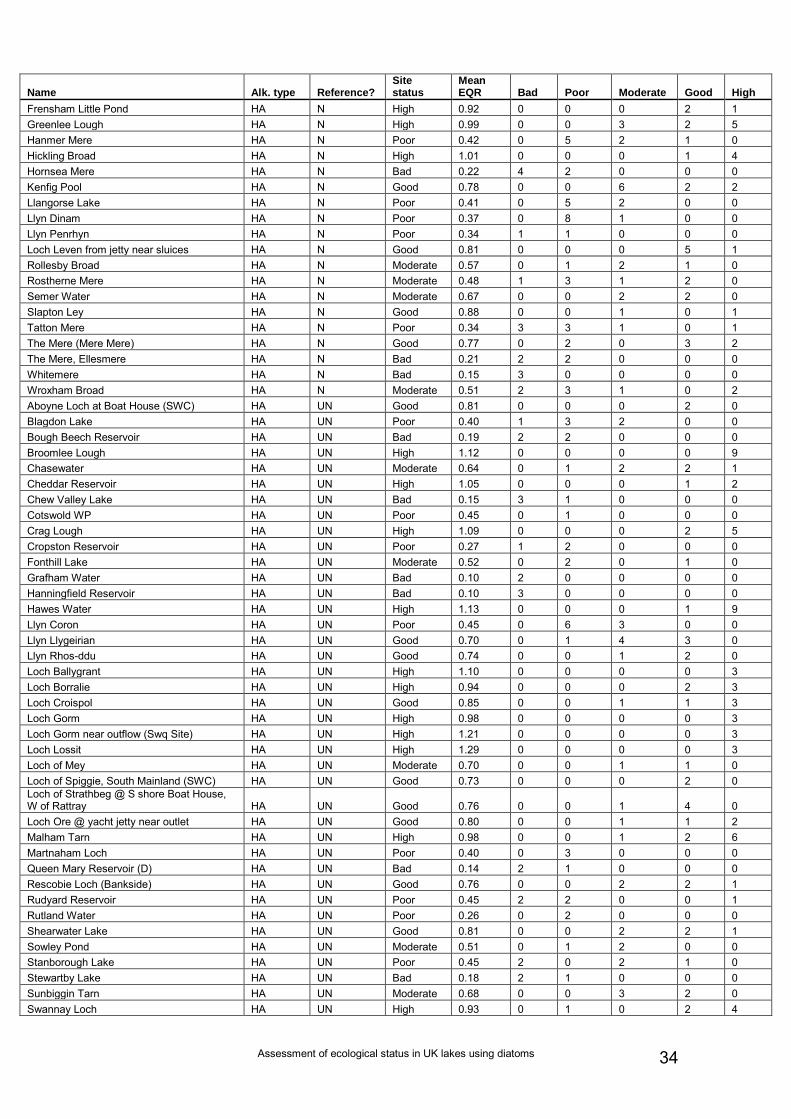
Assessment of ecological status in UK lakes using diatoms 34
Name Alk. type Reference? Site status
Mean EQR Bad Poor Moderate Good High
Frensham Little Pond HA N High 0.92 0 0 0 2 1 Greenlee Lough HA N High 0.99 0 0 3 2 5 Hanmer Mere HA N Poor 0.42 0 5 2 1 0 Hickling Broad HA N High 1.01 0 0 0 1 4 Hornsea Mere HA N Bad 0.22 4 2 0 0 0 Kenfig Pool HA N Good 0.78 0 0 6 2 2 Llangorse Lake HA N Poor 0.41 0 5 2 0 0 Llyn Dinam HA N Poor 0.37 0 8 1 0 0 Llyn Penrhyn HA N Poor 0.34 1 1 0 0 0 Loch Leven from jetty near sluices HA N Good 0.81 0 0 0 5 1 Rollesby Broad HA N Moderate 0.57 0 1 2 1 0 Rostherne Mere HA N Moderate 0.48 1 3 1 2 0 Semer Water HA N Moderate 0.67 0 0 2 2 0 Slapton Ley HA N Good 0.88 0 0 1 0 1 Tatton Mere HA N Poor 0.34 3 3 1 0 1 The Mere (Mere Mere) HA N Good 0.77 0 2 0 3 2 The Mere, Ellesmere HA N Bad 0.21 2 2 0 0 0 Whitemere HA N Bad 0.15 3 0 0 0 0 Wroxham Broad HA N Moderate 0.51 2 3 1 0 2 Aboyne Loch at Boat House (SWC) HA UN Good 0.81 0 0 0 2 0 Blagdon Lake HA UN Poor 0.40 1 3 2 0 0 Bough Beech Reservoir HA UN Bad 0.19 2 2 0 0 0 Broomlee Lough HA UN High 1.12 0 0 0 0 9 Chasewater HA UN Moderate 0.64 0 1 2 2 1 Cheddar Reservoir HA UN High 1.05 0 0 0 1 2 Chew Valley Lake HA UN Bad 0.15 3 1 0 0 0 Cotswold WP HA UN Poor 0.45 0 1 0 0 0 Crag Lough HA UN High 1.09 0 0 0 2 5 Cropston Reservoir HA UN Poor 0.27 1 2 0 0 0 Fonthill Lake HA UN Moderate 0.52 0 2 0 1 0 Grafham Water HA UN Bad 0.10 2 0 0 0 0 Hanningfield Reservoir HA UN Bad 0.10 3 0 0 0 0 Hawes Water HA UN High 1.13 0 0 0 1 9 Llyn Coron HA UN Poor 0.45 0 6 3 0 0 Llyn Llygeirian HA UN Good 0.70 0 1 4 3 0 Llyn Rhos-ddu HA UN Good 0.74 0 0 1 2 0 Loch Ballygrant HA UN High 1.10 0 0 0 0 3 Loch Borralie HA UN High 0.94 0 0 0 2 3 Loch Croispol HA UN Good 0.85 0 0 1 1 3 Loch Gorm HA UN High 0.98 0 0 0 0 3 Loch Gorm near outflow (Swq Site) HA UN High 1.21 0 0 0 0 3 Loch Lossit HA UN High 1.29 0 0 0 0 3 Loch of Mey HA UN Moderate 0.70 0 0 1 1 0 Loch of Spiggie, South Mainland (SWC) HA UN Good 0.73 0 0 0 2 0 Loch of Strathbeg @ S shore Boat House, W of Rattray HA UN Good 0.76 0 0 1 4 0 Loch Ore @ yacht jetty near outlet HA UN Good 0.80 0 0 1 1 2 Malham Tarn HA UN High 0.98 0 0 1 2 6 Martnaham Loch HA UN Poor 0.40 0 3 0 0 0 Queen Mary Reservoir (D) HA UN Bad 0.14 2 1 0 0 0 Rescobie Loch (Bankside) HA UN Good 0.76 0 0 2 2 1 Rudyard Reservoir HA UN Poor 0.45 2 2 0 0 1 Rutland Water HA UN Poor 0.26 0 2 0 0 0 Shearwater Lake HA UN Good 0.81 0 0 2 2 1 Sowley Pond HA UN Moderate 0.51 0 1 2 0 0 Stanborough Lake HA UN Poor 0.45 2 0 2 1 0 Stewartby Lake HA UN Bad 0.18 2 1 0 0 0 Sunbiggin Tarn HA UN Moderate 0.68 0 0 3 2 0 Swannay Loch HA UN High 0.93 0 1 0 2 4
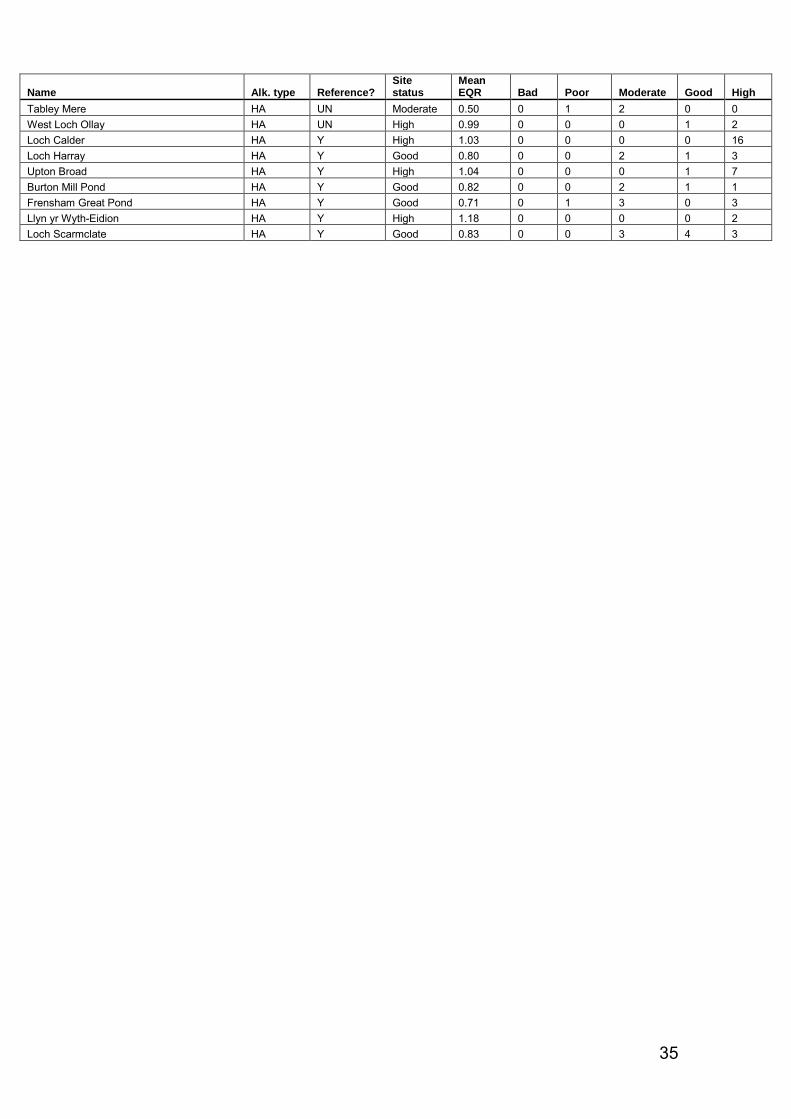
35
Name Alk. type Reference? Site status
Mean EQR Bad Poor Moderate Good High
Tabley Mere HA UN Moderate 0.50 0 1 2 0 0 West Loch Ollay HA UN High 0.99 0 0 0 1 2 Loch Calder HA Y High 1.03 0 0 0 0 16 Loch Harray HA Y Good 0.80 0 0 2 1 3 Upton Broad HA Y High 1.04 0 0 0 1 7 Burton Mill Pond HA Y Good 0.82 0 0 2 1 1 Frensham Great Pond HA Y Good 0.71 0 1 3 0 3 Llyn yr Wyth-Eidion HA Y High 1.18 0 0 0 0 2 Loch Scarmclate HA Y Good 0.83 0 0 3 4 3

Assessment of ecological status in UK lakes using diatoms 36
We are The Environment Agency. It’s our job to look after your environment and make it a better place – for you, and for future generations.
Your environment is the air you breathe, the water you drink and the ground you walk on. Working with business, Government and society as a whole, we are making your environment cleaner and healthier.
The Environment Agency. Out there, making your environment a better place.
