assessment of federal and non-federal land mobile radio ... · efficiency in the federal land...
TRANSCRIPT

NTIA Report 07-447
Assessment of Federal and Non-Federal Land Mobile Radio Frequency
Assignment Methodologies
technical report
U.S. DEPARTMENT OF COMMERCE - National Telecommunications and Information Administration


NTIA Report 07-447
Assessment of Federal and Non-Federal Land
Mobile Radio Frequency Assignment Methodologies
Bernard Joiner
Alakananda Paul Kim Cai
Edward F. Drocella
U.S. DEPARTMENT OF COMMERCE Carlos M. Gutierrez, Secretary
John M. R. Kneuer, Assistant Secretary
for Communications and Information
May 2007

ii
Preface
This report describes how the current frequency assignment process influences spectrum efficiency in the federal land mobile radio frequency bands. In light of the increasing demands for land mobile radio communications, federal spectrum managers must use frequency assignment methods that accurately represent interference to and from systems in the environment to ensure that spectrum is used efficiently. The results of this report will be used to support the implementation of an interference-based frequency assignment process that will improve spectrum efficiency. Standardizing the interference analysis methodologies used in identifying interference-free frequencies in the land mobile radio bands will also improve the overall effectiveness of the federal agencies in performing their missions. This report is one of a series of studies being performed by the National Telecommunications and Information Administration to develop techniques for evaluating and improving the efficiency and effectiveness of federal spectrum use in response to the President’s Spectrum Policy Initiative. The results of these studies will be considered as a whole in setting future policies to improve federal spectrum efficiency.
iii

Acknowledgments
The authors would like to acknowledge Craig Scammon, Thomas Sullivan, Suzette Williams, the members of the Interdepartment Radio Advisory Committee, the Joint Spectrum Center, and Alion Science and Technology for their assistance in preparing this report.
iv
Executive Summary
In May 2003, President Bush established the Spectrum Policy Initiative to promote the development and implementation of a United States spectrum policy for the 21st century. In response to the Spectrum Policy Initiative, the Secretary of Commerce established a Federal Government Spectrum Task Force and initiated a series of public meetings to address policies affecting spectrum use by the federal government, state, and local governments, and the private sector. The recommendations resulting from these activities were included in two reports released by the Secretary of Commerce in June 2004. Based on the recommendations contained in these reports, the President directed the federal agencies on November 30, 2004, to plan the implementation of the 24 recommendations contained in the reports. In March 2006, the Department of Commerce released the Plan to Implement Recommendations of the President’s Spectrum Policy Initiative. One of the recommendations directed the National Telecommunications and Information Administration (NTIA) to develop analytic approaches, software tools, and engineering techniques for evaluating and improving the efficiency of federal spectrum use. This report describes how the current frequency assignment process influences spectrum efficiency in the land mobile radio frequency bands and proposes potential improvements in spectrum management practices, standards, and polices that will affect efficiency.
NTIA periodically reviews and revises its frequency assignment procedures and the
supporting software tools in order to improve federal spectrum efficiency and effectiveness. In this report, NTIA investigates and compares two methodologies used in the land mobile frequency bands to identify frequencies for a proposed system, considering potential interference to and from the existing systems operating in the same geographical area. The two methodologies investigated are the Spectrum XXI interference analysis algorithm and an algorithm based on the Telecommunications Industry Association (TIA) Telecommunications Systems Bulletin 88-B (TSB-88-B).
Spectrum XXI was originally developed by the Department of Defense (DOD) as a
capability to rapidly identify and assign interference-free frequencies in a military tactical environment. Over the past ten years, NTIA has worked with the DOD to implement the Spectrum XXI frequency assignment techniques in non-tactical environments. TSB-88-B was developed by the TIA and is primarily used by non-federal frequency coordinators for calculating interference and assigning land mobile frequencies. As part of the investigation documented in this report, a technical analysis was performed comparing the interference analysis methodologies used in Spectrum XXI and TSB-88-B. The analysis considered the following technical areas: interference criteria, propagation models, noise models, transmitter and receiver filter models, and antenna models. Based on this comparative analysis, NTIA determined that for each of the technical areas examined the approach used in the Spectrum XXI interference analysis algorithm tended to be more conservative than that used in the TSB-88-B based program.
The current Spectrum XXI interference analysis algorithm is driven by the availability of
information in the NTIA Government Master File (GMF) frequency assignment database. In the absence of critical technical information, such as transmitter emission spectra curves, receiver
v

filter selectivity curves, antenna patterns, and receiver noise figures, the Spectrum XXI interference analysis algorithm makes conservative estimates for these equipment characteristics resulting in predicted interference levels that are higher then the actual levels. The TSB-88-B methodology uses significantly more technical information for the equipment and service requirements. If this technical information is not available, representative commercial equipment characteristics are used. The TSB-88-B methodology also uses additional information from databases and industry practice in a manner that reduces the simplifying assumptions for the equipment characteristics. These simplifying assumptions lead to an over-estimation of co-channel and adjacent channel interfering signal levels found when the Spectrum XXI interference analysis algorithm is employed. By using more representative equipment characteristics, the TSB-88-B methodology can more accurately compute interference levels to and from environmental systems resulting in the identification of more available frequencies. The GMF is in the process of being replaced with a frequency assignment database defined by the NTIA Office of Spectrum Management Data Dictionary. The new frequency assignment database will contain considerably more detailed information facilitating the use of interference analysis methodologies such as those recommended in TSB-88-B.
There are also differences in the interference analysis algorithms and criteria used by
Spectrum XXI and TSB-88-B. Spectrum XXI uses an interference analysis algorithm based on interference-to-noise criteria that do not consider performance objectives or predicted performance. In contrast, TSB-88-B uses an interference analysis algorithm based on carrier-to-interference-plus-noise criteria that directly correspond to specific performance objectives. Using the interference analysis algorithm and criteria as specified in TSB-88-B can result in the identification of more available frequencies in spectrally congested areas.
A case study comparing Spectrum XXI and a commercially developed model employing
the TSB-88-B methodology was performed as part of NTIA’s analysis. The results of the case study indicate that the existing TSB-88-B based programs will generally produce a greater list of available interference-free frequencies as compared to Spectrum XXI. The TSB-88-B methodology predicted fewer cases of interference and identified over three times the number of frequencies as compared to the Spectrum XXI interference analysis algorithm.
Greater frequency re-use among federal land mobile systems could be achieved by
transitioning from the use of the current Spectrum XXI interference analysis algorithm towards the methodology recommended in TSB-88-B. Increasing frequency re-use by identifying more interference-free frequencies that can be assigned enables a more efficient use of the land mobile radio frequency bands. In light of the increasing demands for land mobile radio communications spectrum, and to improve spectrum efficiency, federal spectrum managers must use frequency assignment methods that accurately represent interference to and from systems in the environment. To achieve this goal, NTIA recommends that federal agencies use software based on the methodology described in TSB-88-B for assigning frequencies in the land mobile frequency bands. Implementation of the TSB-88-B methodology will help avert imminent future land mobile radio spectrum shortages faced by federal agencies, particularly in spectrally congested environments.
vi
Although this report did not specifically address effectiveness, it is believed that standardizing the interference analysis methodologies used in identifying more interference-free frequencies in the land mobile radio bands will increase the overall effectiveness of the federal agencies in performing their missions.
vii
This Page Intentionally Left Blank
viii

Table of Contents
Preface iii
Acknowledgments iv
Executive Summary v
Table of Contents ix
Glossary xi
Section 1 Introduction 1-1
Section 2 Land Mobile Radio Frequency Assignment Practices 2-1
Section 3 Assessment of the Spectrum XXI Interference Analysis Algorithm 3-1
3.1 General 3-1
3.2 Analysis Overview 3-1
3.3 Spectrum XXI Interference Criteria 3-3
3.4 Spectrum XXI Propagation Model 3-4
3.5 Spectrum XXI Noise Model 3-6
3.6 Spectrum XXI Frequency Dependent Rejection 3-7
3.7 Spectrum XXI Antenna Patterns 3-9
3.8 Summary of the Spectrum XXI Interference Analysis Algorithm 3-11
Section 4 Assessment of TIA TSB-88-B Interference Analysis Procedures 4-1
4.1 General 4-1
4.2 Analysis Overview 4-1
4.3 TSB-88-B Interference Criteria 4-3
4.4 TSB-88-B Propagation Model 4-5
4.5 TSB-88-B Noise Model 4-6
4.6 TSB-88-B Frequency Dependent Rejection 4-7
4.7 TSB-88-B Antenna Patterns 4-8
4.8 Summary of TSB-88-B 4-9
Section 5 Comparison of the Spectrum XXI and TSB-88-B Interference Analysis Algorithms 5-1
5.1 Introduction 5-1
5.2 General Methodology 5-1
5.3 Interference Criteria 5-2
5.4 Propagation Models 5-2
ix
5.5 Noise Models 5-3
5.6 Frequency Dependent Rejection 5-3
5.7 Antenna Modeling 5-4
5.8 Results of Case Study Using Spectrum XXI and TSB-88-B 5-5
5.9 Summary Comparison 5-5
Section 6 Recommendations 6-1
Annex A Case Study Results A-1
x

Glossary AIDP Assignment Interference Determination Program BER Bit Error Rate BLOS Beyond Line of Sight C /(ΣI+ΣN) Median measured or predicted level of a fading carrier to the sum of the
interference plus the sum of the noise sources ratio Cf /(ΣI+ΣN) Minimum value of fading carrier to the some of interference plus noise required to
provide a given audio quality or level of performance C/N Carrier-to-noise ratio Cf Fading carrier level required for a specified performance CPC Channel Performance Criteria Cs Static carrier sensitivity to produce a defined audio quality DAQ Digital Audio Quality dB Decibels DOD Department of Defense EMC Electromagnetic Compatibility ENBW Effective Noise Bandwidth FCC Federal Communications Commission FDR Frequency Dependent Rejection FM Frequency Modulation G Antenna gain GMF Government Master File GR Antenna gain of the receiver in the direction of the desired signal GRI Antenna gain of the victim receiver in the direction of the interference source
antenna GT Antenna gain of the desired transmitter in the direction of the desired receiver GTI Antenna gain of the potentially interfering transmitter in the direction of the
victim receiving antenna I Received interference power ICM Interference Conflict Margin IEEE Institute of Electrical and Electronics Engineers (I/N)max Maximum acceptable value of interference-to-noise ratio IF Intermediate Frequency IRAC Interdepartment Radio Advisory Committee ITM Irregular Terrain Model ITU-R International Telecommunication Union-Radiocommunication Sector k Boltzmann’s constant LBuild Building loss LClutter Clutter loss LComb Combiner loss LCR Cable/insertion loss of the receiver system LCT Cable/insertion loss of the desired transmitter system LCTI Cable/insertion loss of the potentially interfering transmitter system LMR Land Mobile Radio
xi

LOS Line of Sight LP Propagation loss over the desired path LPI Propagation loss over the interfering path LPOL Antenna polarization mismatch loss of the desired signal LPOLI Antenna polarization mismatch loss of the interfering signal LULC Land Use Land Clutter MHz Megahertz N System noise power NBS National Bureau of Standards ne Absolute value of environmental noise nf Absolute value of the receiver noise figure NLCD National Land Clutter Dataset NTIA National Telecommunications and Information Administration OFR Off-Frequency Rejection OTR On-Tune Rejection PT Transmitter power of the desired signal source PTI Transmitter power of the interfering signal source R Radius of operation RF Radio Frequency SEM Smooth Earth Model SINAD Signal-plus-Noise-plus-Distortion to Noise-plus-Distortion ratio T Receiver interference threshold TIA Telecommunications Industry Association TIREM Terrain Integrated Rough Earth Model TSB Telecommunications Systems Bulletin TSB-88-B Telecommunications Industry Association Telecommunications Systems Bulletin
TSB-88-B TSystem System noise temperature UHF Ultra High Frequency (300 to 3000 MHz) USGS United States Geological Survey VHF Very High Frequency (30 to 300 MHz)
xii
Section 1 Introduction
The National Telecommunications and Information Administration (NTIA) is the
Executive Branch agency principally responsible for developing and articulating domestic and international telecommunications policy. NTIA acts as the principal advisor to the President on telecommunications policies pertaining to the Nation’s economic and technological advancement and to the regulation of the telecommunications industry. NTIA is also responsible for managing the federal use of the radio spectrum. Accordingly, NTIA conducts studies and makes recommendations regarding telecommunications policies and presents Executive Branch views on telecommunications matters to the Congress, the Federal Communications Commission (FCC), and the public.
In May 2003, President Bush established the Spectrum Policy Initiative to promote the
development and implementation of a United States spectrum policy for the 21st century. In response to the Spectrum Policy Initiative, the Secretary of Commerce established a Federal Government Spectrum Task Force and initiated a series of public meetings to address policies affecting spectrum use by the federal, state, and local governments, and the private sector. The recommendations resulting from these activities were included in a two reports released by the Secretary of Commerce in June 2004.1 Based on the recommendations contained in these reports, the President directed the federal agencies on November 30, 2004, to plan the implementation of the recommendations contained in the reports.2 In March 2006, The Department of Commerce released the Plan to Implement Recommendations of the President’s Spectrum Policy Initiative.3 One of the recommendations directed the NTIA to develop analytic approaches, software tools, and engineering techniques for evaluating and improving the efficiency of federal spectrum use. In this report, NTIA describes how the current frequency assignment process influences spectrum efficiency in the land mobile radio frequency bands and proposes potential improvements in spectrum management practices, standards, and polices that will affect efficiency.4
1. Spectrum Policy for the 21st Century – The President’s Spectrum Policy Initiative: Report 1, Department of Commerce (June 2004). This report is available on-line at: http://www.ntia.doc.gov/reports/specpolini/presspecpolini_report1_06242004.htm; Spectrum Policy for the 21st Century – The President’s Spectrum Policy Initiative: Report 2, Department of Commerce (June 2004). This report is available on-line at: http://www.ntia.doc.gov/reports/specpolini/presspecpolini_report2_06242004.htm. 2. White House Executive Memorandum, Subject: Improving Spectrum Management for the 21st Century (November 23, 2004). 3. Spectrum Management for the21st Century – Plan to Implement Recommendations of the President’s Spectrum Policy Initiative, Department of Commerce (March 2006). This report is available on-line at: http://www.ntia.doc.gov/osmhome/reports/ImplementationPlan2006.htm. 4. This report only addresses the interference analysis portion of the frequency assignment process. It does not address other areas such as allotments, special notes, etc.
1-1

Twenty percent of federal frequency assignments are in the Very High Frequency (VHF) and Ultra High Frequency (UHF) bands allocated to the land mobile radio (LMR) service.5 Effective and efficient use of the land mobile radio frequency spectrum requires the accommodation of as many frequency assignment requests as possible within the available spectrum. In recent years, the demand for land mobile assignments, both in the federal and the non-federal sector, has increased significantly. NTIA and the FCC, as well as non-federal frequency assignment and coordination service providers, have found it increasingly difficult to meet the growing demand for land mobile assignments. Federal agencies place great emphasis on mission effectiveness and the attendant requirements for high levels of radio system reliability.6 Accordingly, when establishing frequency assignments for land mobile systems, emphasis has been placed on ensuring that federal land mobile systems using the same frequency band will not interfere with each other. In order to manage spectrum in a way that facilitates more efficient and effective use of the spectrum, NTIA and the non-federal coordinating entities have reviewed their frequency management processes with the intention of accommodating more assignments in the existing spectrum while limiting interference between users consistent with established performance objectives.
This report examines the frequency assignment process used in the federal land mobile
frequency bands. The frequency assignment techniques used by the Federal Government and by non-federal frequency coordinators are considered to identify frequency assignment methods that promote more efficient and effective use of the land mobile frequency bands as directed by the President’s Spectrum Policy Initiative. The criteria for comparing these different frequency assignment methods are the accuracy of the interference analyses and how many frequencies each method can identify as “assignable” in a geographic area given the same input data. These criteria were chosen because greater accuracy in the interference analyses enables more efficient frequency use by allowing more users to operate within the same geographical area using the same frequency band.7 The different engineering algorithms employed by each method are evaluated and compared to determine their strengths and weaknesses. A case study in a representative spectrally congested land mobile radio environment is also performed to assess the assignment capabilities of each method.
5. In this report, VHF refers to the 162-174 MHz band and UHF refers to the 406.1-420 MHz band. 6. The federal land mobile frequency bands are used by agencies such as the Departments of Justice, the Treasury, and Homeland Security to perform critical missions related to public safety and emergency response. 7. In this context, a geographic area refers to the area where a fixed assignment or mobile area of operation could cause interference to, or receive interference from, another assignment.
1-2
Section 2 Land Mobile Radio Frequency Assignment Practices
NTIA allots to the federal agencies channels in the land mobile radio frequency bands in
accordance with a negotiated distribution documented in the Manual of Regulations and Procedures for Federal Radio Frequency Management (NTIA Manual).8 In addition, there is an allotment for “all government agencies,” a pool of frequencies from which any federal agency may select frequencies when they cannot find a suitable frequency using their agency allotment. NTIA relies on the individual user agencies to coordinate assignments and use of their respective allotted frequencies. NTIA also depends on the agencies to share these frequencies among each other to maximize spectrum utilization efficiency and minimize interference. This reduces the need for NTIA staff resources. When an agency finds a potential frequency that it believes will not cause or suffer unacceptable interference, it submits the request to NTIA’s Frequency Assignment Branch for consideration. This request is posted on the Interdepartment Radio Advisory Committee (IRAC) Frequency Assignment Subcommittee agenda for two weeks to allow for coordination among the federal agencies and the FCC.9 If no agency objects to the request, NTIA grants the assignment. If an agency objects to the request, the agencies are responsible for resolving the disagreement. Until the disagreements are resolved, the assignment is tabled.10 Also, when situations dictate the need for an agency to use a channel allotted to another agency, the two agencies can directly arrange for the provision of the frequency.
Federal agencies are not required to use a standardized method to determine the potential
for interference in the course of planning and coordinating land mobile frequency assignments applications. The three methods primarily used by the agencies are: the Spectrum XXI interference analysis algorithm, Annex I of the NTIA Manual (Annex I), and the Assignment Interference Determination Program (AIDP).11
The Spectrum XXI interference analysis algorithm performs a two-way interference
analysis between a proposed system (transmitter and receiver) and the existing systems (transmitters and receivers) in the environment. The analysis, based on noise degradation, provides a list of potential interference-free frequencies for the proposed system. The Spectrum XXI interference analysis algorithm performs an interference-to-noise analysis and does not consider the desired signal level. The interference analysis performed by the Spectrum XXI interference analysis algorithm uses radio wave propagation loss, transmitter power, transmit and 8. NTIA Manual of Regulations and Procedures for Federal Radio Frequency Management, (NTIA Manual) (May 2003, Revised May 2006) Supplement, Part A, National Telecommunications and Information Administration (Supplement) (September 2001). 9. The IRAC, consisting of representatives of 20 federal agencies, serves in an advisory capacity to the Assistant Secretary of Commerce for Communications and Information. 10. Aside from recording land mobile assignments agreed among the affected agencies, NTIA is only directly involved in cross-border (Mexico and Canada) coordination and when the federal agencies are not able to resolve their coordination difficulties. 11. Spectrum XXI, Federal Training Manual, Version 4.2 (Spectrum XXI) Alion Science and Technology (2005) and NTIA Manual, Annex I.
2-1
receive antenna gain, off-axis antenna gain, transmitter and receiver antenna height, transmitter and receiver filter characteristics, distance separation, and frequency separation. The Spectrum XXI interference analysis algorithm is addressed in Section 3 of this report.
Annex I of the NTIA Manual is a model used to evaluate frequency proposals of fixed
and/or mobile stations in the VHF and UHF land mobile bands. The model performs a one-way analysis that provides an estimate of the interference potential from a proposed system. The analysis performed using Annex I takes into account radio wave propagation loss, transmit and receive antenna gains, transmitter and receiver antenna heights, transmitter output power, distance separation, frequency separations, and transmitter and receiver filter characteristics. The procedures of Annex I are included in NTIA’s Microwave Spectrum Analysis Models (MSAM) program.12 However, the Annex I procedures do not include a complete two-way interference analysis such as is required in congested land mobile use areas. Therefore, further analysis of its methodology is not included in this report.
AIDP does not perform an interference analysis to assign frequencies. AIDP produces a
listing of all Government Master File (GMF) records having a spectrum overlap with the proposed station within a defined radius of the proposed site. The size of this radius depends on the frequency band and the proposed transmit power. This establishes the minimum distance at which frequencies can be re-used. As such, it provides an initial list of assignments that require further analysis. It should not be used for actual frequency assignment except in extremely remote areas. Therefore, further analysis of its methodology is not included in this report.
Non-federal frequency assignments are coordinated in a similar manner as in the Federal
Government, except that for each band there are FCC recognized independent frequency coordinators that are responsible for performing interference analyses and recommending frequency assignments.13 Although independent, the various coordinators share information, including incoming requests for coordination. Generally, in the land mobile radio bands, these coordinators use analyses based on the Telecommunications Industry Association (TIA) Telecommunications Systems Bulletin-88-B (TSB-88-B) methodology.14 Once coordination is completed, a license application and other documentation is submitted to the FCC. The license application is put on public notice for a period of time, and if there are no objections, the license is granted.
Software based on the TSB-88-B methodology performs an automated two-way
interference analysis between a proposed system (transmitter and receiver) and an existing environment of systems (transmitters and receivers) to assign interference-free frequencies for
12. For information on MSAM, see http://ntiacsd.ntia.doc.gov/msam. The procedures in Annex I are in the process of being updated within the IRAC Technical Subcommittee. The Beta version of the updated procedures are also available on this web site. 13. For example, two of these coordinators are the Association of Public-Safety Communications Officials International (APCO), and the United Telecom Council (UTC). 14. Wireless Communications Systems – Performance in Noise and Interference – Limited Situations, Recommended Methods for Technology Independent Modeling, Simulation, and Verification, Telecommunications Systems Bulletin, TSB-88-B-1, (TSB-88-B) Telecommunications Industry Association (2005).
2-2
the proposed system. It performs a carrier-to-interference plus noise analysis so the permitted amount of interference is dependent on the level of the desired carrier at any location. The interference analysis takes into account desired audio quality, radio wave propagation loss, transmitter output power, transmit and receive antenna gain, off-axis antenna gain, and transmitter and receive antenna height, transmitter and receiver filter characteristics, distance separation, and frequency separation. The TSB-88-B methodology is flexible in that it permits the user to input other factors when appropriate (e.g., building and clutter losses). Finally, the TSB-88-B results are based on a statistical analysis and can be displayed on a map so the user can see the probability and locations of potential interference.
Comparing the federal and non-federal frequency assignment methodologies used in the
land mobile radio frequency bands reveals several differences and similarities.15 The Spectrum XXI interference analysis algorithm and the TSB-88-B frequency assignment methodologies both perform a two-way interference analysis between a proposed system and an environment of systems. Both take into account most of the same factors, the differences being primarily in the manner in which the factors are calculated, and in the interference criteria. The remainder of this report will assess the engineering algorithms employed by Spectrum XXI and TSB-88-B to determine their strengths and weaknesses. The results of this assessment identify an interference analysis methodology that will allow NTIA to maximize the number of assignments that it can make on a frequency in a geographic area without decreasing mission effectiveness in the federal land mobile frequency bands.
15. TSB-88-B based procedures are used by some federal agencies, such as the Departments of Justice, Homeland Security, and State, the Coast Guard, the Air Force, and the Federal Aviation Administration.
2-3

2-4

Section 3 Assessment of the Spectrum XXI Interference Analysis Algorithm
3.1 General
Spectrum XXI was originally developed by the Department of Defense (DOD) as a capability to rapidly assign interference free frequencies in a tactical environment. Over the past ten years, NTIA has worked with the DOD to implement Spectrum XXI in non-tactical environments.
Spectrum XXI provides an end-to-end mechanism to prepare frequency proposals,
process proposals within the federal spectrum management hierarchy, automatically track the status for proposals, and provide automated notification of new frequency assignments. It also contains various engineering tools and report generators. NTIA has implemented a Spectrum XXI server infrastructure supporting both classified and unclassified proposal processing. Additionally, NTIA has updated Spectrum XXI to automate the coordination of proposals across the federal agencies. More than 1900 federal employees, supporting contractors, and coalition forces have been formally trained in Spectrum XXI operations. Many agencies that do not use the interference analysis algorithm for assigning frequencies still use Spectrum XXI for many of these other functions.
The evaluation in this report addresses the current Spectrum XXI interference analysis
algorithm only and does not evaluate the other capabilities. The Spectrum XXI interference analysis algorithm can be used to estimate interfering
signal levels generated by a proposed system and existing systems in a defined geographic area. The user can either nominate a proposed frequency and the program will determine whether or not interference exists, or the user can enter a frequency range and the program will attempt to find one or more frequencies in an allotment table that would not cause or suffer interference. Should unacceptable interference be predicted, the program declares a conflict. Specifically, conflicts are declared when the interfering signal power level from a proposed transmitter exceeds the receiver interference threshold (T).16
3.2 Analysis Overview Spectrum XXI, being a program used primarily by federal agencies, has the capability to
access the GMF to obtain system parameters for the existing transmitters. These parameters include: latitude and longitude for base stations; latitude, longitude, and radius of operation for mobile stations; emission designator; transmitter power; antenna gain; and antenna height. For analysis parameters that are not contained in the GMF, the Spectrum XXI interference analysis algorithm uses default values. Many of the conservative estimates used in the Spectrum XXI interference analysis algorithm can be directly attributed to the use of the conservative default values due to unavailability of analysis data in the GMF. The implementation of the OSM Data
16. Spectrum XXI at C-5.
3-1
Dictionary, which will contain additional data, as part of the Federal Spectrum Management System should eliminate some of this bias.17
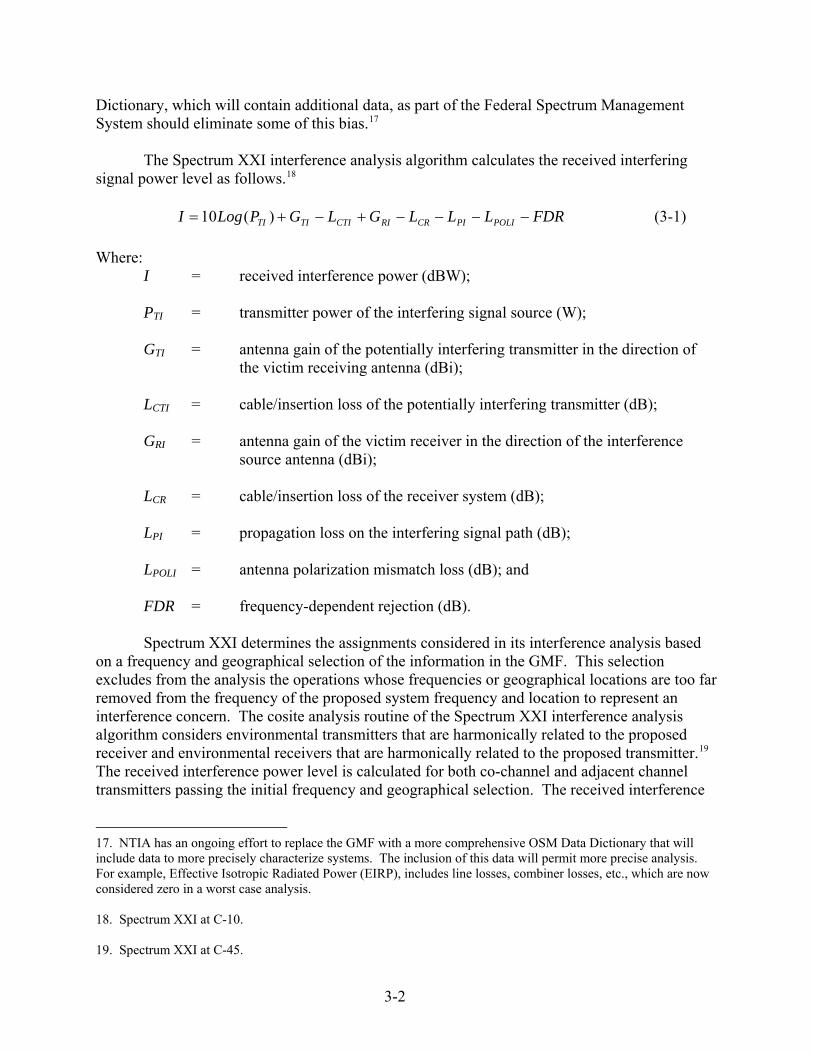
The Spectrum XXI interference analysis algorithm calculates the received interfering
signal power level as follows.18
FDRLLLGLGPLogI POLIPICRRICTITITI −−−−+−+= )(10 (3-1)
Where: I = received interference power (dBW); PTI = transmitter power of the interfering signal source (W); GTI = antenna gain of the potentially interfering transmitter in the direction of the victim receiving antenna (dBi); LCTI = cable/insertion loss of the potentially interfering transmitter (dB); GRI = antenna gain of the victim receiver in the direction of the interference source antenna (dBi); LCR = cable/insertion loss of the receiver system (dB); LPI = propagation loss on the interfering signal path (dB); LPOLI = antenna polarization mismatch loss (dB); and FDR = frequency-dependent rejection (dB).
Spectrum XXI determines the assignments considered in its interference analysis based on a frequency and geographical selection of the information in the GMF. This selection excludes from the analysis the operations whose frequencies or geographical locations are too far removed from the frequency of the proposed system frequency and location to represent an interference concern. The cosite analysis routine of the Spectrum XXI interference analysis algorithm considers environmental transmitters that are harmonically related to the proposed receiver and environmental receivers that are harmonically related to the proposed transmitter.19 The received interference power level is calculated for both co-channel and adjacent channel transmitters passing the initial frequency and geographical selection. The received interference
17. NTIA has an ongoing effort to replace the GMF with a more comprehensive OSM Data Dictionary that will include data to more precisely characterize systems. The inclusion of this data will permit more precise analysis. For example, Effective Isotropic Radiated Power (EIRP), includes line losses, combiner losses, etc., which are now considered zero in a worst case analysis. 18. Spectrum XXI at C-10. 19. Spectrum XXI at C-45.
3-2
power is calculated between the proposed transmitter and existing receivers and the existing transmitters and the proposed receiver. Some of the parameters shown in Equation 3-1 are not used depending on the radio service being considered. For example, since the mobile stations can have random polarization, the antenna polarization mismatch loss (LPOL) is not used in land mobile radio interference analysis.
The interference criteria used to compute the receiver interference threshold, the
propagation loss model, noise model, FDR model, and antenna patterns models used in the Spectrum XXI interference analysis algorithm are discussed below.
3.3 Spectrum XXI Interference Criteria
The Spectrum XXI interference analysis algorithm is based on a noise degradation analysis and uses an Interference Conflict Margin (ICM), defined as the ratio of the received interference power to receiver interference threshold, to determine the potential interference. The ICM is related to interference-to-noise (I/N) as shown below.
ICM = I – T (3-2)
T = N + (I/N)max (3-3) Where: ICM = interference conflict margin (dB); I = received interference power (dBW); T = receiver interference threshold (dBW); N = system noise power level (dBW); and (I/N)max= maximum acceptable value of interference-to-noise ratio (dB). The default values of (I/N)max used by the Spectrum XXI interference analysis algorithm are 0 dB for analog land mobile radio systems and -6 dB for digital land mobile radio systems. This results in an increase in the resulting noise floor (I+N) of 3 dB for analog systems and 1 dB for digital systems.
The noise power level of the receiver includes external environmental noise, transmission line noise, and internal receiver noise. Assuming an appropriate interference threshold (T) is used, a negative ICM indicates that a proposed system will not receive or cause unacceptable interference, with a margin equal to at least the value of the ICM. Conversely, a positive ICM indicates a channel may receive or cause unacceptable interference, with a negative margin equal to the value of the ICM.
3-3
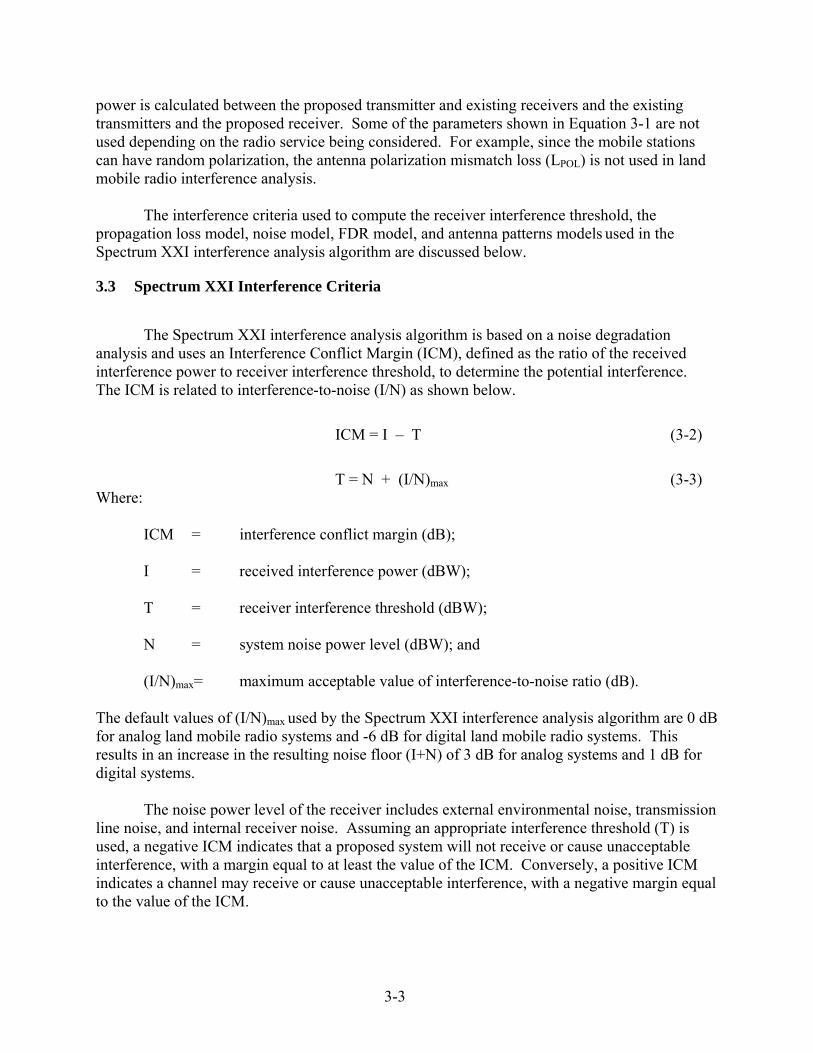
Figure 3-1 illustrates the derivation of the receiver interference threshold. In the example, the system noise, N, is -150 dBW. For a digital land mobile radio system, the allowable increase in noise due to interference is 1 dB for a I + N of -149 dBW, which requires an I/N of -6 dB. This would give a maximum allowable interference threshold, T, of -156 dBW from Equation 3-3.
System Noise Power Level N Minimum Acceptable I/N
Resulting I + N Level
Interference Threshold T (Maximum Allowable Interference Level)
-150 dBW -6 dB
-149 dBW
Example Values
Permissible increase in noise due to interference 1 dB
-156 dBW
Figure 3-1. Interference Threshold Diagram The analysis approach used in the Spectrum XXI interference analysis algorithm assumes the receiver performance is limited by the receiver noise level (e.g., noise limited). In a noise-limited situation, the carrier-to-noise ratio is slightly greater than the minimum required value for acceptable performance. This approach will predict unacceptable interference in any case where the interference raises the noise level significantly without considering the carrier level. For land mobile radio systems where the carrier level can be significantly higher than the noise, for instance to provide for building penetration, an analysis approach based on an I/N criteria tends to overestimate the effect of the interference power level resulting in conservative analysis results.
3.4 Spectrum XXI Propagation Model
The Spectrum XXI interference analysis algorithm propagation loss calculations are performed using the Terrain Integrated Rough Earth Model (TIREM).20 TIREM is a semi-empirical, site-specific propagation model that considers propagation modes and data that were presented in the National Bureau of Standards (NBS) Technical Note 101 (Tech Note 101).21 Using a terrain database, TIREM performs a point-to-point analysis to predict median
20. TIREM/SEM Handbook, Department of Defense, Electromagnetic Compatibility Analysis Center, ECAC-HDBK-93-076 (March 1994, Change 1 October 1994). 21. Transmission Loss Predictions for Tropospheric Communications Circuits, Technical Note No. 101, Revised, U.S. Department of Commerce, National Bureau of Standards, (Tech Note 101) (1967). This report is available on-line at: http://www.its.bldrdoc.gov/pub/ntia-rpt/tn101/.
3-4
propagation loss from 1 MHz to 20 GHz considering the following factors: free-space spreading, reflection, diffraction, surface-wave, troposhperic-scatter, long-term fading statistics, and above 10 GHz, atmospheric absorption. TIREM also uses a smooth earth propagation mode when site-specific information is not available.
The separation distance is calculated based on the great circle distance between the
transmitter and receiver using the latitudes and longitudes from the GMF. The Spectrum XXI interference analysis algorithm uses different procedures to calculate
propagation loss for three different cases: between two base stations; between a base station and a mobile station; and between two mobile stations.
3.4.1 Base Station to Base Station
In cases of potential interference between base stations, the Spectrum XXI interference analysis algorithm uses TIREM in the point-to-point mode accessing a terrain database to compute the propagation loss. Based on the geometry of the profile, TIREM selects all appropriate modes of propagation for paths with end points that are either within line-of-sight (LOS) or beyond-line-of-sight (BLOS).
3.4.2 Base Station to Mobile Station
If either the transmitter or receiver is a mobile station, the Spectrum XXI interference analysis algorithm uses the Smooth-Earth propagation Model (SEM), included in TIREM, since the actual locations of the mobile stations are not known, thus the actual terrain between the mobile station and the base station cannot be determined.
For a mobile station where the base station of one system (proposed or environment)
could interfere with a mobile station of a second system (proposed or environment), SEM calculates the propagation loss between the base station of the first system and the mobile station the second system using a separation distance that places the mobile station at the closest point in the area of operation to the base station of the first system. For example, if the separation distance between the base station of the first system and a base station of the second system is 10,000 meters, and the mobile station of the second system has a radius of operation (R) of 4,000 meters, then a separation distance of 6,000 meters would be used in calculating the propagation loss.
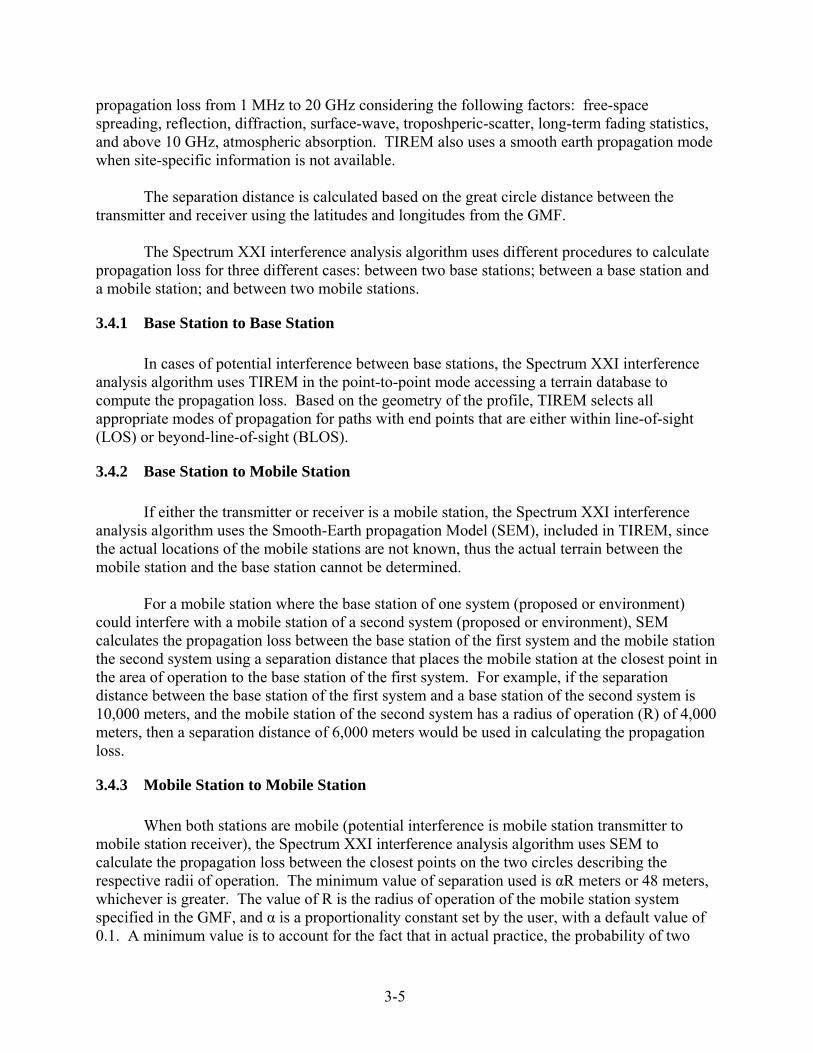
3.4.3 Mobile Station to Mobile Station When both stations are mobile (potential interference is mobile station transmitter to
mobile station receiver), the Spectrum XXI interference analysis algorithm uses SEM to calculate the propagation loss between the closest points on the two circles describing the respective radii of operation. The minimum value of separation used is αR meters or 48 meters, whichever is greater. The value of R is the radius of operation of the mobile station system specified in the GMF, and α is a proportionality constant set by the user, with a default value of 0.1. A minimum value is to account for the fact that in actual practice, the probability of two
3-5

mobile stations operating at the closest points of their radii of operation is low, and acknowledges that some interference in such cases must be accepted to achieve a reasonable probability of finding a frequency assignment. Spectrum XXI has the capability of bypassing the mobile station-to-mobile station interference calculation, as often this is the only way to find an assignment.
3.5 Spectrum XXI Noise Model
The system noise power used in the interference analysis performed by Spectrum XXI includes external environmental noise, transmission line noise, and internal receiver noise. The method used by the Spectrum XXI interference analysis algorithm for computing the total system noise power is to find the equivalent system noise temperature (TSystem), which is equal to the noise temperature of the antenna plus the noise temperature of the receiver. The total system noise power (N), in dBW is given by:
N = 10 Log (k TSystem B) (3-4)
Where: k = 1.38 x 10⁻²³ J/K (Boltzmann’s constant); TSystem = system noise temperature in Kelvin (K); and B = the receiver effective noise bandwidth (Hz). The Spectrum XXI interference analysis algorithm uses the necessary bandwidth
contained in the emission designator extracted from the GMF since the effective noise bandwidth information is not available in the GMF.
To compute the system noise temperature, a value for the receiver noise figure is
necessary. The receiver noise figure is not contained in the GMF. Therefore, the Spectrum XXI interference analysis algorithm uses default values based on the emission designator and the frequency of operation that are contained in the GMF. The system noise temperature also includes the antenna noise temperature, taking into account cable loss and external environmental noise. The environmental noise is the frequency dependent environmental noise. Spectrum XXI uses data derived from International Telecommunication Union Radiocommunication Sector (ITU-R) Recommendation P.372, which contains measured data for worst times/worst locations (noisy/urban), best times/best locations (quiet/rural) and a median range (average/suburban). The environmental noise data in ITU-R. P.372 takes into account atmospheric (lightening) man-made (urban, suburban, and rural), and galactic noise sources.
There are several factors in the method employed by the Spectrum XXI interference
analysis algorithm that could overestimate the receiver system noise power used in computing the receiver interference threshold (T). The Spectrum XXI interference analysis algorithm uses the necessary bandwidth taken from the emission designator in the GMF. The necessary bandwidth is by definition the -20 dB bandwidth, whereas the system noise should be calculated
3-6
using the effective noise bandwidth, which is usually close to the 3 dB bandwidth. A review of the noise figure values used by the Spectrum XXI interference analysis algorithm indicates they may be based on older systems with higher noise figures than many of the land mobile radio systems deployed today. As the allowable interference is related to the system noise power, overestimating the system noise will result in higher receiver interference thresholds. This overestimation could result in an increase in the calculated allowable interference for proposed and existing land mobile radio systems. Higher calculated allowable interference could produce a less conservative result for an I/N analysis approach, although generally still more conservative than an analysis based on a carrier-to-interference ratio.
3.6 Spectrum XXI Frequency Dependent Rejection The FDR term accounts for transmitter emission spectra and receiver filtering which are
not matched and/or have differing center frequencies. It consists of on-tune rejection (OTR) and off-frequency rejection (OFR). OTR is used to account for the fraction of the total input power that is accepted by the receiver, assuming the receiver and transmitter are tuned to the same frequency. OFR is used to account for the reduction in power that is passed by a receive filter that is off-tuned from a transmitter. The Spectrum XXI interference analysis algorithm uses a piecewise-linear integration and the characteristics of the transmit spectrum and the receive selectivity to compute the FDR.22
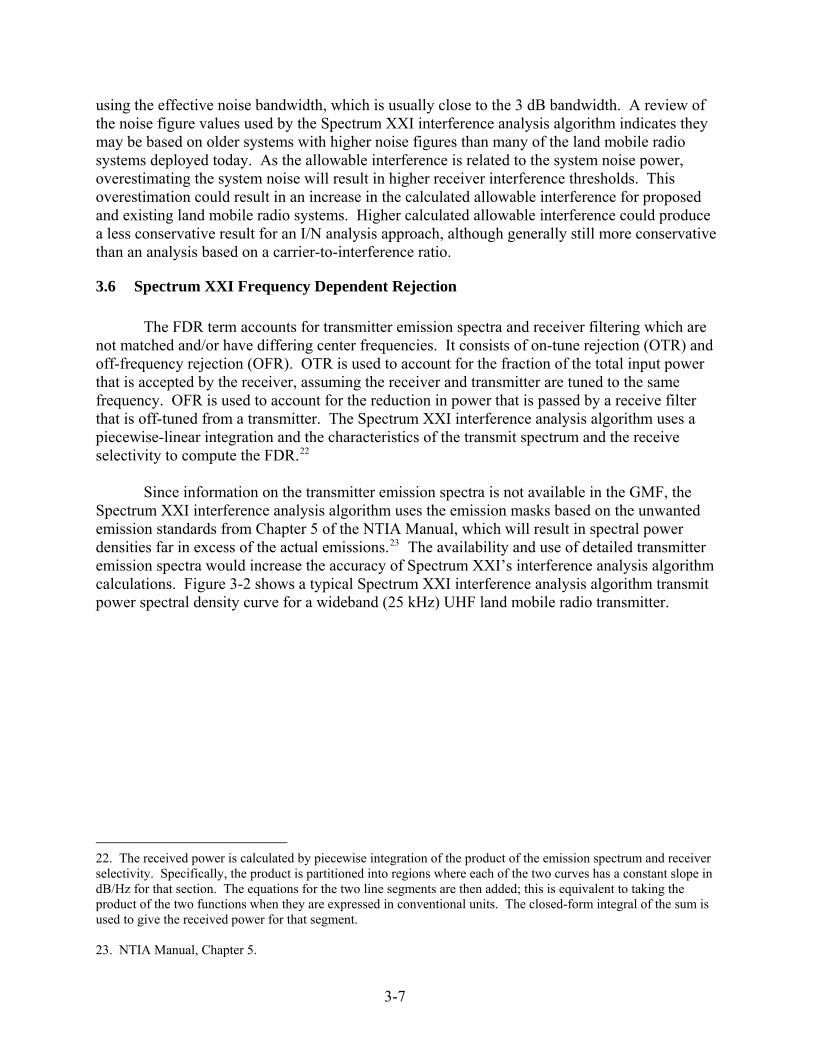
Since information on the transmitter emission spectra is not available in the GMF, the
Spectrum XXI interference analysis algorithm uses the emission masks based on the unwanted emission standards from Chapter 5 of the NTIA Manual, which will result in spectral power densities far in excess of the actual emissions.23 The availability and use of detailed transmitter emission spectra would increase the accuracy of Spectrum XXI’s interference analysis algorithm calculations. Figure 3-2 shows a typical Spectrum XXI interference analysis algorithm transmit power spectral density curve for a wideband (25 kHz) UHF land mobile radio transmitter.
22. The received power is calculated by piecewise integration of the product of the emission spectrum and receiver selectivity. Specifically, the product is partitioned into regions where each of the two curves has a constant slope in dB/Hz for that section. The equations for the two line segments are then added; this is equivalent to taking the product of the two functions when they are expressed in conventional units. The closed-form integral of the sum is used to give the received power for that segment. 23. NTIA Manual, Chapter 5.
3-7
-100
-90
-80
-70
-60
-50
-40
-30
-20
-10
0
-50 -40 -30 -20 -10 0 10 20 30 40 50Frequency Offset (kHz)
Nor
mal
ized
Pow
er S
pect
ral D
ensi
ty (
dB)
Figure 3-2. Typical Spectrum XXI Transmit Spectral Density Curve 25 kHz UHF LMR
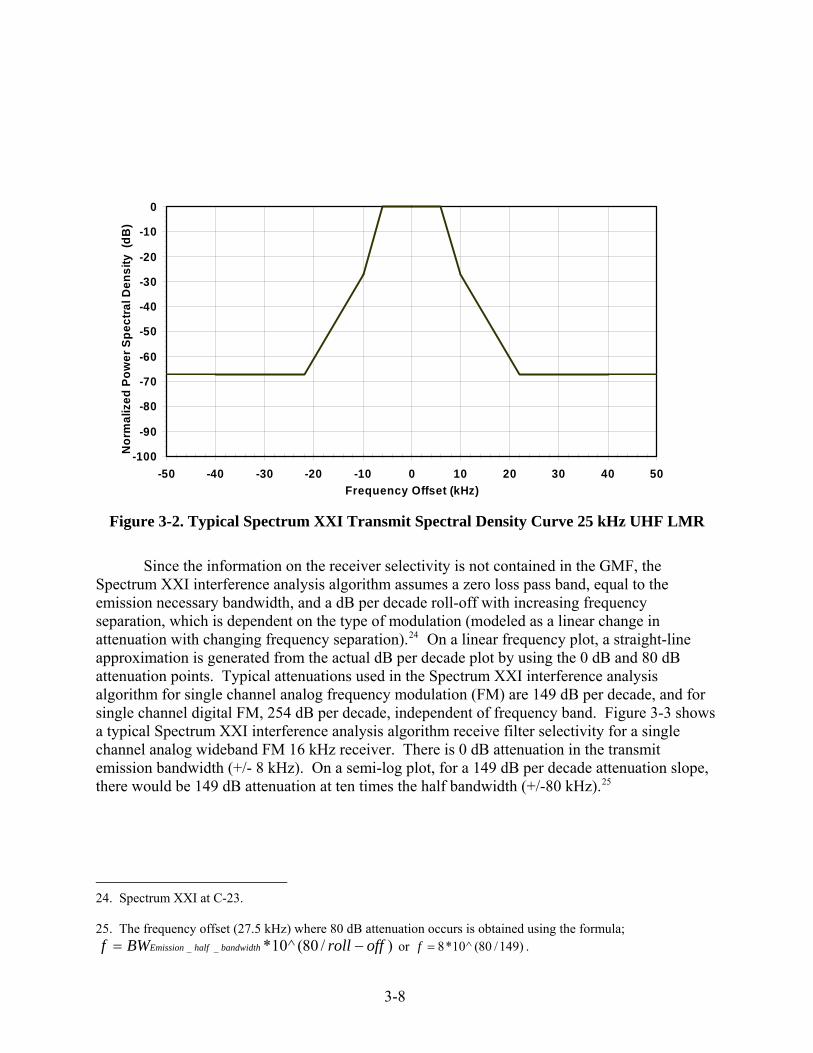
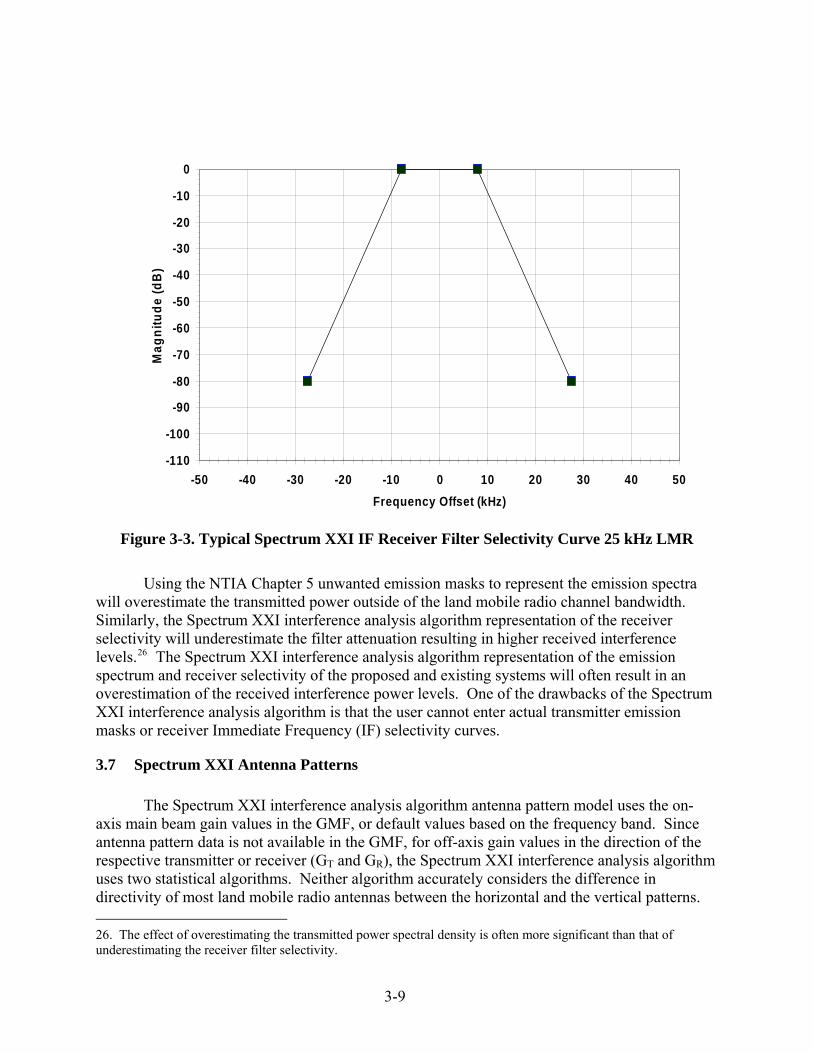
Since the information on the receiver selectivity is not contained in the GMF, the
Spectrum XXI interference analysis algorithm assumes a zero loss pass band, equal to the emission necessary bandwidth, and a dB per decade roll-off with increasing frequency separation, which is dependent on the type of modulation (modeled as a linear change in attenuation with changing frequency separation).24 On a linear frequency plot, a straight-line approximation is generated from the actual dB per decade plot by using the 0 dB and 80 dB attenuation points. Typical attenuations used in the Spectrum XXI interference analysis algorithm for single channel analog frequency modulation (FM) are 149 dB per decade, and for single channel digital FM, 254 dB per decade, independent of frequency band. Figure 3-3 shows a typical Spectrum XXI interference analysis algorithm receive filter selectivity for a single channel analog wideband FM 16 kHz receiver. There is 0 dB attenuation in the transmit emission bandwidth (+/- 8 kHz). On a semi-log plot, for a 149 dB per decade attenuation slope, there would be 149 dB attenuation at ten times the half bandwidth (+/-80 kHz).25
24. Spectrum XXI at C-23. 25. The frequency offset (27.5 kHz) where 80 dB attenuation occurs is obtained using the formula;
)/80(^10*__ offrollBWf bandwidthhalfEmission −= or )149/80(^10*8=f .
3-8
-110
-100
-90
-80
-70
-60
-50
-40
-30
-20
-10
0
-50 -40 -30 -20 -10 0 10 20 30 40 50Frequency Offset (kHz)
Mag
nitu
de (d
B)
Figure 3-3. Typical Spectrum XXI IF Receiver Filter Selectivity Curve 25 kHz LMR
Using the NTIA Chapter 5 unwanted emission masks to represent the emission spectra
will overestimate the transmitted power outside of the land mobile radio channel bandwidth. Similarly, the Spectrum XXI interference analysis algorithm representation of the receiver selectivity will underestimate the filter attenuation resulting in higher received interference levels.26 The Spectrum XXI interference analysis algorithm representation of the emission spectrum and receiver selectivity of the proposed and existing systems will often result in an overestimation of the received interference power levels. One of the drawbacks of the Spectrum XXI interference analysis algorithm is that the user cannot enter actual transmitter emission masks or receiver Immediate Frequency (IF) selectivity curves.
3.7 Spectrum XXI Antenna Patterns The Spectrum XXI interference analysis algorithm antenna pattern model uses the on-
axis main beam gain values in the GMF, or default values based on the frequency band. Since antenna pattern data is not available in the GMF, for off-axis gain values in the direction of the respective transmitter or receiver (GT and GR), the Spectrum XXI interference analysis algorithm uses two statistical algorithms. Neither algorithm accurately considers the difference in directivity of most land mobile radio antennas between the horizontal and the vertical patterns. 26. The effect of overestimating the transmitted power spectral density is often more significant than that of underestimating the receiver filter selectivity.
3-9
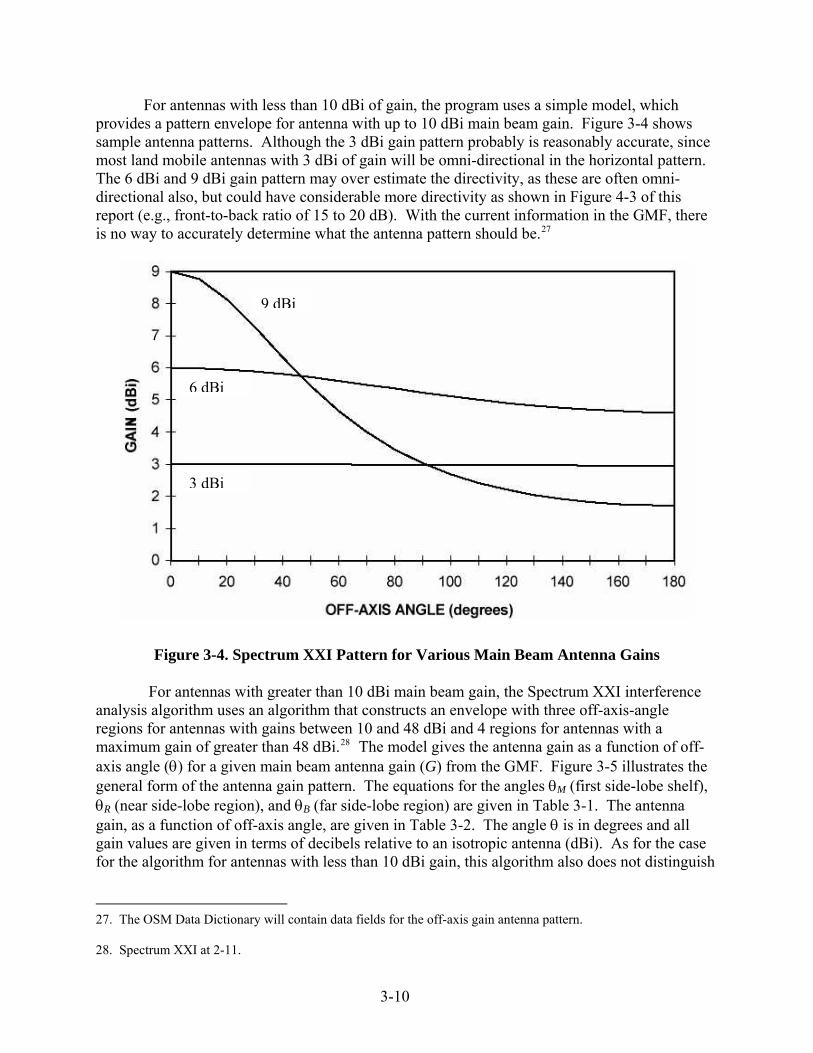
For antennas with less than 10 dBi of gain, the program uses a simple model, which provides a pattern envelope for antenna with up to 10 dBi main beam gain. Figure 3-4 shows sample antenna patterns. Although the 3 dBi gain pattern probably is reasonably accurate, since most land mobile antennas with 3 dBi of gain will be omni-directional in the horizontal pattern. The 6 dBi and 9 dBi gain pattern may over estimate the directivity, as these are often omni-directional also, but could have considerable more directivity as shown in Figure 4-3 of this report (e.g., front-to-back ratio of 15 to 20 dB). With the current information in the GMF, there is no way to accurately determine what the antenna pattern should be.27
9 dBi
3 dBi
6 dBi
Figure 3-4. Spectrum XXI Pattern for Various Main Beam Antenna Gains
For antennas with greater than 10 dBi main beam gain, the Spectrum XXI interference analysis algorithm uses an algorithm that constructs an envelope with three off-axis-angle regions for antennas with gains between 10 and 48 dBi and 4 regions for antennas with a maximum gain of greater than 48 dBi.28 The model gives the antenna gain as a function of off-axis angle (θ) for a given main beam antenna gain (G) from the GMF. Figure 3-5 illustrates the general form of the antenna gain pattern. The equations for the angles θM (first side-lobe shelf), θR (near side-lobe region), and θB (far side-lobe region) are given in Table 3-1. The antenna gain, as a function of off-axis angle, are given in Table 3-2. The angle θ is in degrees and all gain values are given in terms of decibels relative to an isotropic antenna (dBi). As for the case for the algorithm for antennas with less than 10 dBi gain, this algorithm also does not distinguish
B
27. The OSM Data Dictionary will contain data fields for the off-axis gain antenna pattern. 28. Spectrum XXI at 2-11.
3-10

between the antenna directivity in the horizontal and vertical directions. For antennas with more than 10 dBi gain, this difference could often be very significant.
Figure 3-5. Spectrum XXI Pattern for Antennas with Main beam Gains Exceeding 10 dBi
Table 3-1. Angle Definitions
θM = 50 (0.25 G + 7)0.5/10G/20
θR = 250/10G/20
θB = 48
Table 3-2. Equations for Antenna Gain
Angular interval (degrees)
Gain (dBi)
0 to θM
θM to θR
θR to θB
θB to 180
G – 4 × 10⁻⁴ (10G/10) θ2
0.75 G – 7 53 – (G/2) – 25 log (θ)
11 – G/2
3.8 Summary of the Spectrum XXI Interference Analysis Algorithm The Spectrum XXI interference analysis algorithm uses the above procedures to compare
a predicted interfering signal power level at receive locations with the receiver interference threshold value. This approach to electromagnetic capability (EMC) is essentially an I/N
3-11

analysis approach, with no consideration of the desired receive carrier power level at the receive locations. Based on the results of this comparison, there is either a negative ICM, denoting acceptable interference risk, or a positive ICM, denoting potentially unacceptable interference risk. The algorithms and parameters used by the Spectrum XXI interference analysis algorithm tend to be worst case, and ensure that there is little risk of unacceptable interference for frequencies with a negative ICM. However, this conservative approach often results in positive ICM values in cases where a more precise analysis would result in a negative ICM value, indicating a lower risk of interference. For instance, the I/N interference criteria will show unacceptable interference in any case where the interference raises the noise level significantly without considering the level of the carrier or the significance of interference in a particular area to the operations of an agency. Likewise, the calculations for FDR tend to provide a level that is low (i.e., the receiver does not offer much rejection the interfering transmitter). Using the SEM for computing the propagation loss when mobile stations are analyzed ignores any of the effects of terrain shielding. Using the SEM in conjunction with the worst-case minimum separation distance along with the FDR will result in a conservative estimate of the received interference power, thereby reducing the potential number of assignable frequencies. However, this may be partially offset in some cases by the higher than actual level of assumed receiver noise. The simplifications in off-axis antenna gain could tend to increase or decrease the estimate of the received interference power, depending on the actual antenna used. With additional information available in the new OSM Data Dictionary, and with less conservative, but more typical parameters and assumptions, the Spectrum XXI interference analysis algorithm could be modified to provide results that are more precise.
3-12
Section 4 Assessment of TIA TSB-88-B Interference Analysis Procedures
4.1 General
TIA is an industry organization devoted to setting standards in the telecommunications industry. TSB-88-B contains a compilation of engineering data and information useful to the technical community and represents engineering practices that are recommended by committees comprised of equipment manufacturers, frequency coordinators, and users. TSB-88-B contains standardized definitions and methodologies and a process for determining when various wireless communications configurations are compatible. TSB-88-B is intended to serve as a reference and provide a formal structure and quantitative technical parameters from which automated design and spectrum management tools can be developed. TSB-88-B contains procedures and options with recommended parameter values, but these can be changed by the user. TSB-88-B does not present an exact step-by-step procedure, but presents the user with a number of choices for performing the interference analysis, and guidance for making these choices. Some of the annexes present sample procedures and summarize the choices to be made. The detailed procedures are quite complex, and the explanations provided in this report are greatly simplified. A complete description of the methodology is provided in the TSB-88-B documentation.
TSB-88-B provides methods that are especially appropriate for the closer channel spacing
enabled by modern narrow-band modulation techniques, and the migration to narrow-band channel assignments. In a high usage environment, the procedures could be quite computationally intensive. To facilitate the process, a first order selection can be performed using distance, received signal contours or other methods to develop a short list of potential interferers for which calculations that are more detailed need to be performed. The TSB-88-B methodologies were selected to achieve a balance in what was practical and what could theoretically be performed to arrive at a reliable prediction of interference.
4.2 Analysis Overview The interference analysis described in TSB-88-B is based on a performance analysis that
considers the desired power level of the RF carrier, a component for FDR, the combined effects of single or multiple sources of degradation, and a signal environment where both the desired and undesired signals are undergoing Rayleigh fading.29 TSB-88-B, being a methodology rather than an exact procedure, specifies factors that should be included in calculating the power of the desired and interfering signals, but does not specify exact procedures and equations. The primary benefit of the TSB-88-B analysis approach lies primarily in the way it treats the interference criteria, the propagation loss (LP), noise levels, transmit emission spectra and receiver selectivity used to calculate the FDR, and antenna patterns.
The service area for a base station considered by TSB-88-B should be the actual service
area required for the service, often a geographical boundary (e.g., state or county boundary), or 29. TSB-88-B at 2. The carrier (C ) used in the carrier-to-interference ratio in TSB-88-B is the hourly median of a Rayleigh fading carrier.
4-1

other non-circular area. In performing initial calculations for interferers whose actual service area is not known, a maximum service area can often be determined from a received signal contour. TSB-88-B divides the service area into square blocks referred to as “tiles.” Grid or radial methods may also be used.30 Propagation losses are calculated from each selected desired and undesired (proposed and existing) station to the center of each tile in the service area.
Using the calculated propagation loss, the expected desired and interfering received
signal levels are calculated, including the effects of base station and mobile station antenna gain, line losses, building penetration loss, clutter loss, polarization mismatch, obstruction loss, miscellaneous losses, and any other pertinent factors. These signal strengths are used as a basis for comparing the desired signal to the combination of undesired signals and noise and calculating a ratio of the carrier to the sum of the interference sources plus the sum of the noise sources (C/(ΣI+ΣN)).
TSB-88-B does not expressly give equations for directly defining the received level of
the desired carrier and interferer, but implicitly the following equations, or similar ones, would be used in determining the acceptability of interference following the methodology.
The level of the desired received carrier is calculated as follows.
ClutterBuildPRCombCTTT LLLGLLGPLogC −−−+−−+= )(10 (4-1)
Where: C = median level of the desired receive carrier power (dBW); PT = transmitter power of the desired signal source (W); GT = transmit antenna gain (dBi); LCT = transmit cable/insertion loss (dB); LComb = combiner, diplexer and related losses in the transmission system (dB); GR = gain of the receive antenna, usually the mobile station, which includes other factors affecting the effective gain, including body loss, antenna inefficiencies, etc. (dBi); LP = median propagation loss on the desired signal path (dB); LBuild = building loss (dB); and LClutter = clutter loss (trees, vegetation, foliage, etc.) (dB).
30. TSB-88-B at 98.
4-2
The levels of the interfering signals are calculated the same as for the desired carrier, with the addition of the FDR as follows.
FDRLLLGLLGPLogI ClutterBuildPIRICombCTITITI −−−−+−−+= )(10 (4-2)
In this calculation, PTI, LCTI and LComb refer to the interfering signal, GTI and GRI refer to the transmit and receive antenna gains in the direction of the interfering path and LPI refers to the interfering signal path loss.
For combining interference from multiple base stations, two methods can be employed: Monte Carlo simulation and the Equivalent Interferer. The former uses an average of randomly chosen values of propagation loss based on the statistical parameters of the calculations. The latter calculates the mean and standard deviation of each interferer, which are used to determine joint statistics of the aggregate interfering signal. This procedure can be extended to include partial overlapping interferers as well as second adjacent channel interferers. The thermal and environmental noise (N) is added to the aggregate interference. (Thermal and environmental noise levels are calculated as shown in Section 4.5.) Using the statistics of the desired signal, the C/(ΣI+ΣN) is calculated, which is compared with the Channel Performance Criteria (CPC) to determine the margin. Using statistical methods, the probability of exceeding the required CPC is calculated. These calculations are performed for each tile in the service area.31
As TSB-88-B was designed primarily for the non-federal sector, whose bands are
segmented with the repeater transmit frequencies and the mobile transmitter frequencies in separate parts of the bands. Therefore there is very little likelihood of direct mobile station to mobile station interference; it does not directly consider this case. With some modifications, however, this case of mobile transmitter to mobile receiver could be accommodated.
4.3 TSB-88-B Interference Criteria
TSB-88-B uses CPC Service Area Reliability as the primary criteria for adequacy of channel performance. CPC is defined as the ratio of the median level of a Rayleigh fading carrier (Cf) signal required to provide the specified output quality to the combined sum of all noise and interfering-sources (Cf/(ΣI+ΣN)) necessary to produce a defined performance level.
CPC = Cf /(ΣI+ΣN) (4-3)
Where:
CPC = Channel Performance Criteria; Cf = Median level of a Rayleigh fading carrier which will provide the desired output quality;
31. TSB-88-B at 19.
4-3
ΣI = Sum of all interfering carrier powers; and ΣN = Sum of all noise powers. The Cf/(ΣI+ΣN) determines the faded sensitivity requirement. The faded sensitivity
requires an absolute power reference. The faded sensitivity can be computed from the known reference sensitivity and the static desired carrier-to-noise (Cs/N) determined from bench testing, which provides the absolute power requirement for the (Cs/N) criterion. The faded sensitivity for a given CPC is:
Cf = Cs + (Cf /N - Cs /N) (4-4)
Where:
Cs = Static Reference Sensitivity. Typical output signal criteria are a 5% bit error rate (BER) or a 12 dB signal-plus-noise-
plus-distortion to noise-plus-distortion (SINAD), or a Delivered Audio Quality (DAQ) of 3.0.32 Many public safety agencies use a DAQ of 3.4; however, the user can change these values. Suggested CPC values are included in TSB-88-B for various DAQ levels and different modulation types obtained from various manufacturers. An excerpt from TSB-88-B is included as Table 4-1. However, the user may apply data obtained from other sources (e.g., a specific manufacturer’s model or type measurements). As an example from Table 4-1, the required CPC for narrow band, analog FM +/- 2.5 kHz modulation to provide a DAQ of 3.4 is 26 dB.
Table 4-1. Sample CPC Values for Various Modulations and DAQs
Modulation Type (channel spacing)
Static
refCN
s/ DAQ-3.0
( )BER
CI N
f% /+
DAQ-3.4
( )BER
CI N
f% /+
DAQ-4.0
( )BER
CI N
f% /+
Analog FM ± 5kHz (25 kHz) 12 dBS/4dB N/A/17 dB N/A/20 dB N/A/27 dB Analog FM ± 4kHz (25 kHz) 12 dBS/5dB N/A/19 dB N/A/22 dB N/A/29 dB Analog FM ± 2.5kHz (12.5 kHz) 12 dBS/7dB N/A/23 dB N/A/26 dB N/A/33 dB C4FM (IMBE) (12.5 kHz) 5%/5.4 dB 2.6%/15.2 dB 2.0%/16.2 dB 1.0%/20.0 dB C4FM (IMBE) (12.5 kHz) 5%/7.6 dB 2.6%/16.5 dB 2.0%/17.7 dB 1.0%/21.2 dB CQPSK (IMBE) (12.5 kHz) 5%/5.4 dB 2.6%/15.2 dB 2.0%/16.2 dB 1.0%/20.0 dB CQPSK (IMBE) (12.5 kHz) 5%/7.6 dB 2.6%/16.5 dB 2.0%/17.7 dB 1.0%/21.2 dB CQPSK (IMBE) (6.25 kHz) 5%/7.6 dB 2.6%/16.5 dB 2.0%/17.7 dB 1.0%/21.2 dB C4FM – Compatible Four Level Frequency Modulation CQPSK – Compatible Quadrature Phase Shift Keying IMBE – Improved Multi Band Excitation N/A – Not Applicable
The calculated C/(ΣI+ΣN) is then compared to the CPC for each tile in the service area.
CPC service area reliability is the probability that the required CPC will exist over the defined 32. DAQ for digital systems and its SINAD equivalent for analog systems, are subjective evaluation methods using understandability, minimizing repetition and degradation due to noise to establish scores.
4-4
service area. As TSB-88-B considers the effects of Rayleigh fading in the determination of CPC, there is no additional time variability considered. Likewise, since it uses terrain data in the point-to-point calculations, the only location variability is within the tile and is generally not significant. For variability due to location, as well as general algorithm and database imperfections, TSB-88-B recommends including a 1 dB margin. The remaining principal variability is situational variability caused by clutter. It assumes that the clutter loss has a lognormal distribution whose mean is a function of frequency and land use and has a standard deviation of 5.6 dB, although other values can be used. A margin for clutter variability is included depending on the reliability required. Reliabilities of 90%, 95%, and 97% are used as examples with recommendations of 97% for public safety and 90% for other land mobile applications, but the user can define any percentage desired.
4.4 TSB-88-B Propagation Model
Two propagation models are recommended in TSB-88-B. The Okumura/Hata/Davidson model, an empirical model for calculation of propagation loss, is based on extensive measurements done by Okumura and others in Japan for different environments and terrain.33 TSB-88-B recommends the use of this model when terrain data is not available but the operating environment is known (i.e., large or small city, suburban, or open environment). Okumura’s measurement results were given in terms of a set of curves of basic median attenuation relative to free space in an urban area over semi-smooth terrain as a function of frequency and distance for a base antenna height of 200 meters and a mobile station antenna height of 3 meters. Okumura also developed correction curves for other environments, terrain, and antenna heights. The Okumura/Hata Model is a computer model based on equations derived from Okumura’s findings by Hata, for limited ranges of frequency, distance and antenna heights for four types of environment, large and small city, suburban and open. The Okumura/Hata/Davidson model uses equations extending ranges of frequency, distance and base antenna height.34
For detailed predictions using terrain data, TSB-88-B recommends the use of a two-ray model for line-of-sight paths, and the Anderson 2D model for obstructed paths. As this model is not widely available, in some applications of TSB-88-B, other more widely used models, such as Longley-Rice, based on NBS Technical Note 101, or Epstein-Peterson is also used. TSB-88-B recommends that attenuation due to clutter be included where appropriate. Clutter losses are implicit in the Okumura/Hata/Davidson model, whereas clutter must be added to the other propagation models. The clutter losses are based on the United States Geological Survey (USGS), Land Use Land Cover (LULC) data and the National Land Cover Dataset (NLCD).35
33. Y. Okumura et al., Field strength and its variability in UHF and VHF land-mobile radio service, Review of the Electrical Communication Laboratory, vol. 16, (1968) no. 9-10, at 825-873 and M. Hata, Empirical formula for propagation loss in land mobile radio services, IEEE Transactions on Vehicular Technology, Volume VT-29, no. 3 (August 1980) at 317-325. 34. The Okumura-Hata-Davidson model is valid for a frequency range of 30 MHz to 1500 MHz, antenna heights of 20 meters to 2500 meters, and ranges up to 300 kilometers. 35. TSB-88-B at 91.
4-5
Building and other expected losses or margins can be included in the interference analysis with any of the propagation models.36 TSB-88-B recommends using 30-meter terrain data, re-sampled at three arc second resolution. This is superior to the original three arc second terrain data, as the re-sampled data has much better vertical accuracy than the original three arc second data.
4.5 TSB-88-B Noise Model TSB-88-B computes the thermal noise in dBm using Boltzmann’s constant and an assumed room temperature of 290 K, corrected for the receiver’s Equivalent Noise Bandwidth (ENBW)37 in Hz and NF in dB, using the following equation:
NT = -174 + 10 Log (ENBW) + NF. (4-5)
To determine the total noise level of the receiver, it is essential that the level of
environmental noise (NE) be accurately estimated. This is particularly true for systems operating below 400 MHz. To represent environmental noise in the interference analysis, TSB-88-B uses noise measurements that correlate environmental noise levels with USGS LULC categories at 162 MHz. These measurements should be applicable over the entire 138-174 MHz frequency range. If environmental noise data is not available, TSB-88-B reverts to the Spaulding and Disney measurements of 1974 for other bands and cautions that these values may be low.38 Any radio noise data, including measured data, may be substituted by the user and included in the TSB-88-B interference calculations.
Thermal noise and environmental noise are then combined by adding an adjustment to
the thermal noise calculated above. The adjustment is calculated using the absolute value of the noise figure (nf) and the absolute value of the environmental noise (ne).39 The thermal noise level calculated above is then adjusted, using the absolute levels nf and ne of the levels calculated in Equation 4-5.
36. TSB-88-B at 116. 37. ENBW is defined by the frequency span of an ideal filter whose area equals the area under the actual power transfer function curve and whose gain equals the peak gain of the actual power transfer function. In many cases the ENBW is close to the 3 dB bandwidth. However, there exist situations where the use of the 3 dB bandwidth can lead to erroneous answers. 38. Clutter Losses and Environmental Noise Characteristics Associated with Various LULC Categories, The Institute of Electrical and Electronics Engineers Transactions on Broadcasting, 44(3) (September 1998) pp. 286-93; TSB-88-B at 45. 39. nf =10^(NF/10) and ne = 10^(Ne/10).
4-6
N = NT + )1(10fn
nLog e+ (4-6)
The noise level calculated in Equation 4-6 is used in the C f /(ΣI+ΣN) calculations for each tile in the service area.40
4.6 TSB-88-B Frequency Dependent Rejection
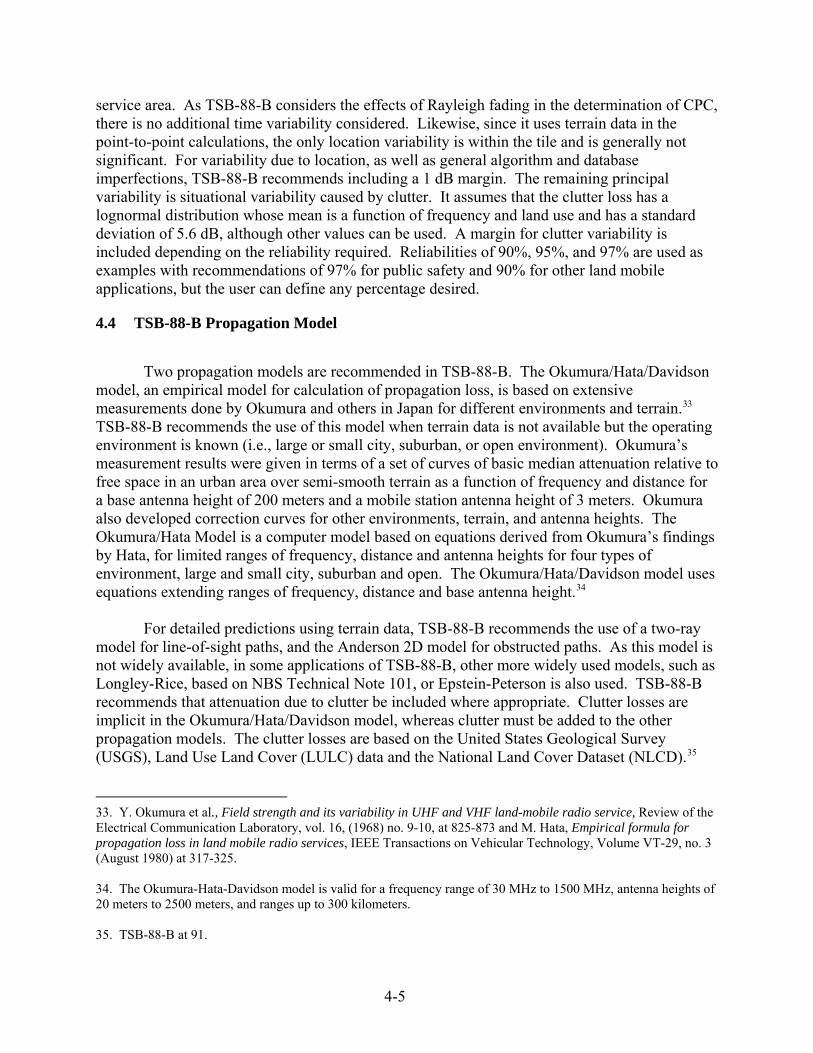
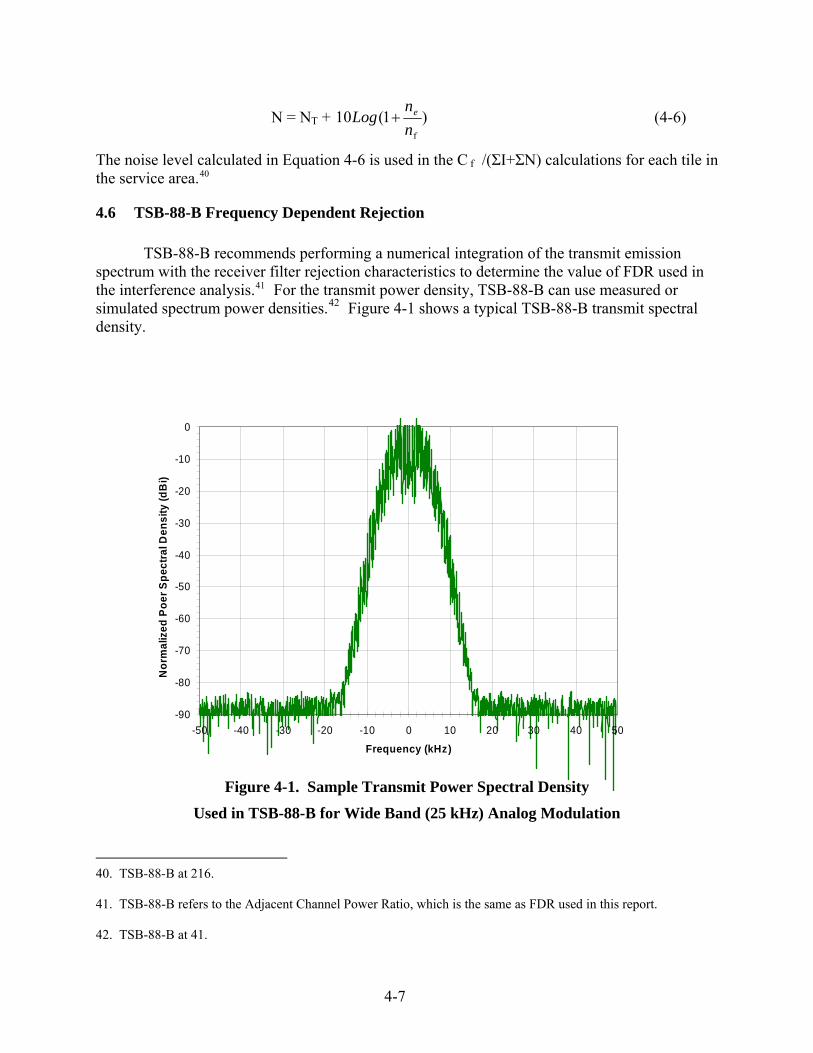
TSB-88-B recommends performing a numerical integration of the transmit emission spectrum with the receiver filter rejection characteristics to determine the value of FDR used in the interference analysis.41 For the transmit power density, TSB-88-B can use measured or simulated spectrum power densities.42 Figure 4-1 shows a typical TSB-88-B transmit spectral density.
-90
-80
-70
-60
-50
-40
-30
-20
-10
0
-50 -40 -30 -20 -10 0 10 20 30 40 50
Frequency (kHz)
Nor
mal
ized
Poe
r Spe
ctra
l Den
sity
(dB
i)
Figure 4-1. Sample Transmit Power Spectral Density
Used in TSB-88-B for Wide Band (25 kHz) Analog Modulation
40. TSB-88-B at 216. 41. TSB-88-B refers to the Adjacent Channel Power Ratio, which is the same as FDR used in this report. 42. TSB-88-B at 41.
4-7
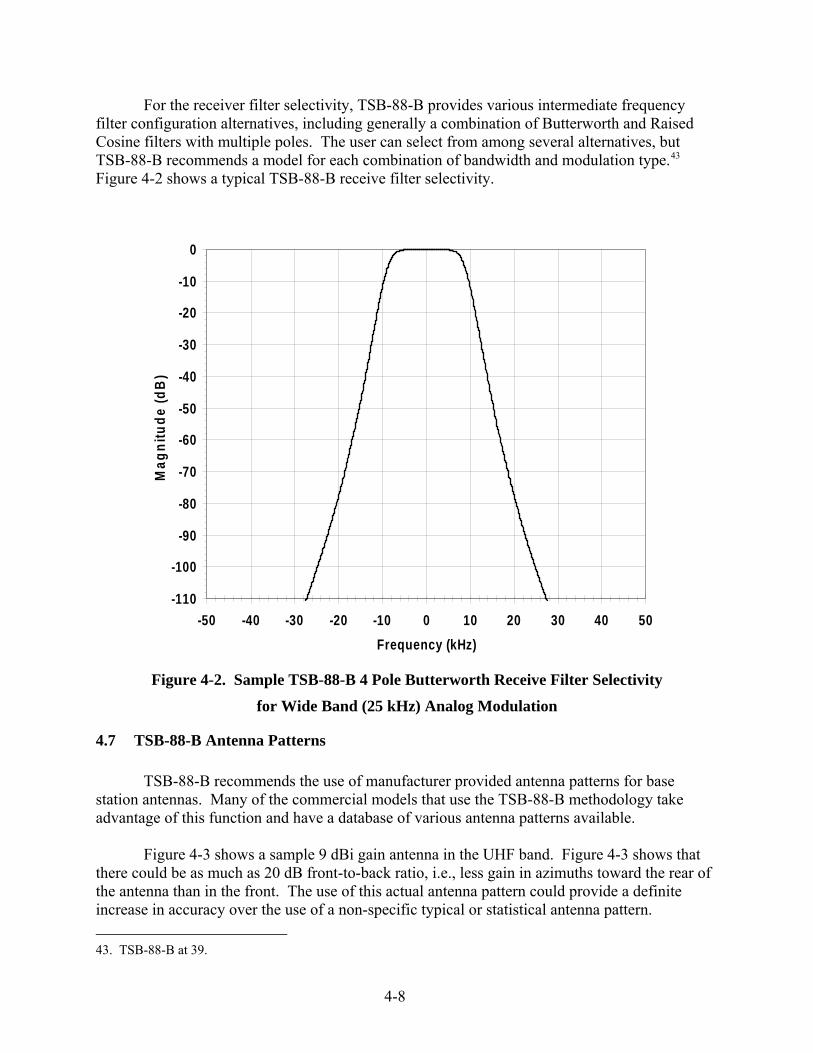
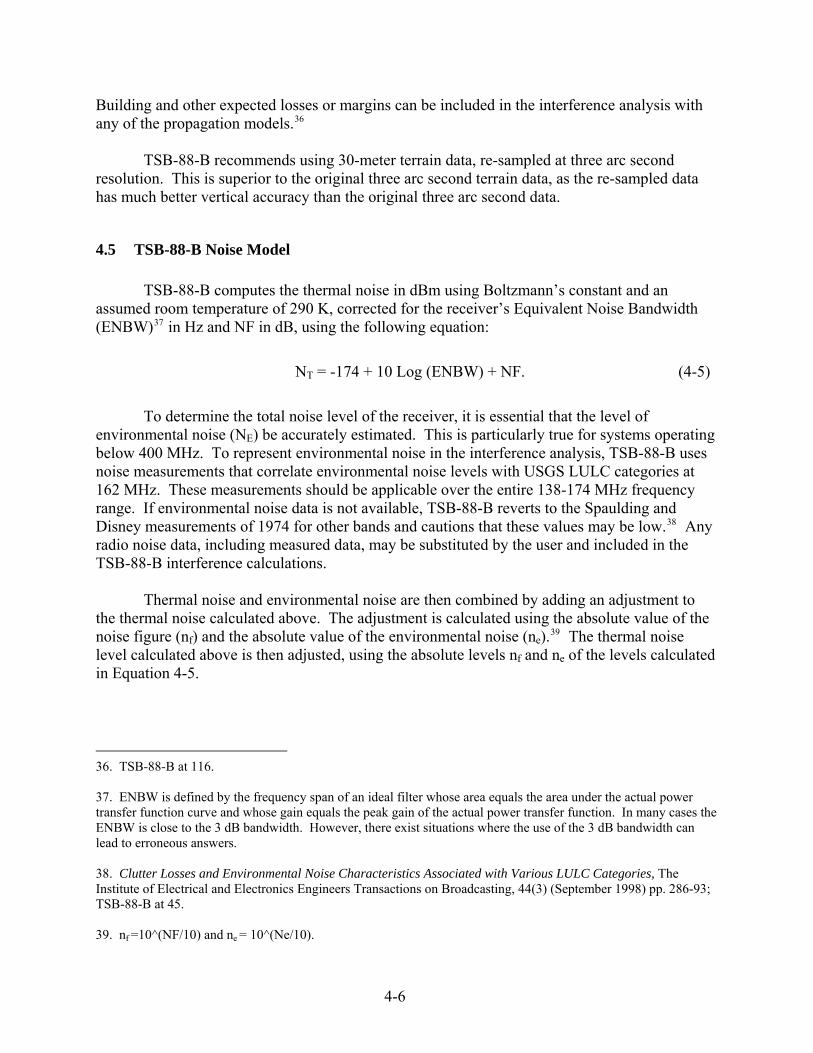
For the receiver filter selectivity, TSB-88-B provides various intermediate frequency filter configuration alternatives, including generally a combination of Butterworth and Raised Cosine filters with multiple poles. The user can select from among several alternatives, but TSB-88-B recommends a model for each combination of bandwidth and modulation type.43 Figure 4-2 shows a typical TSB-88-B receive filter selectivity.
-110
-100
-90
-80
-70
-60
-50
-40
-30
-20
-10
0
-50 -40 -30 -20 -10 0 10 20 30 40 50Frequency (kHz)
Mag
nitu
de (d
B)
Figure 4-2. Sample TSB-88-B 4 Pole Butterworth Receive Filter Selectivity
for Wide Band (25 kHz) Analog Modulation
4.7 TSB-88-B Antenna Patterns
TSB-88-B recommends the use of manufacturer provided antenna patterns for base station antennas. Many of the commercial models that use the TSB-88-B methodology take advantage of this function and have a database of various antenna patterns available.
Figure 4-3 shows a sample 9 dBi gain antenna in the UHF band. Figure 4-3 shows that
there could be as much as 20 dB front-to-back ratio, i.e., less gain in azimuths toward the rear of the antenna than in the front. The use of this actual antenna pattern could provide a definite increase in accuracy over the use of a non-specific typical or statistical antenna pattern. 43. TSB-88-B at 39.
4-8
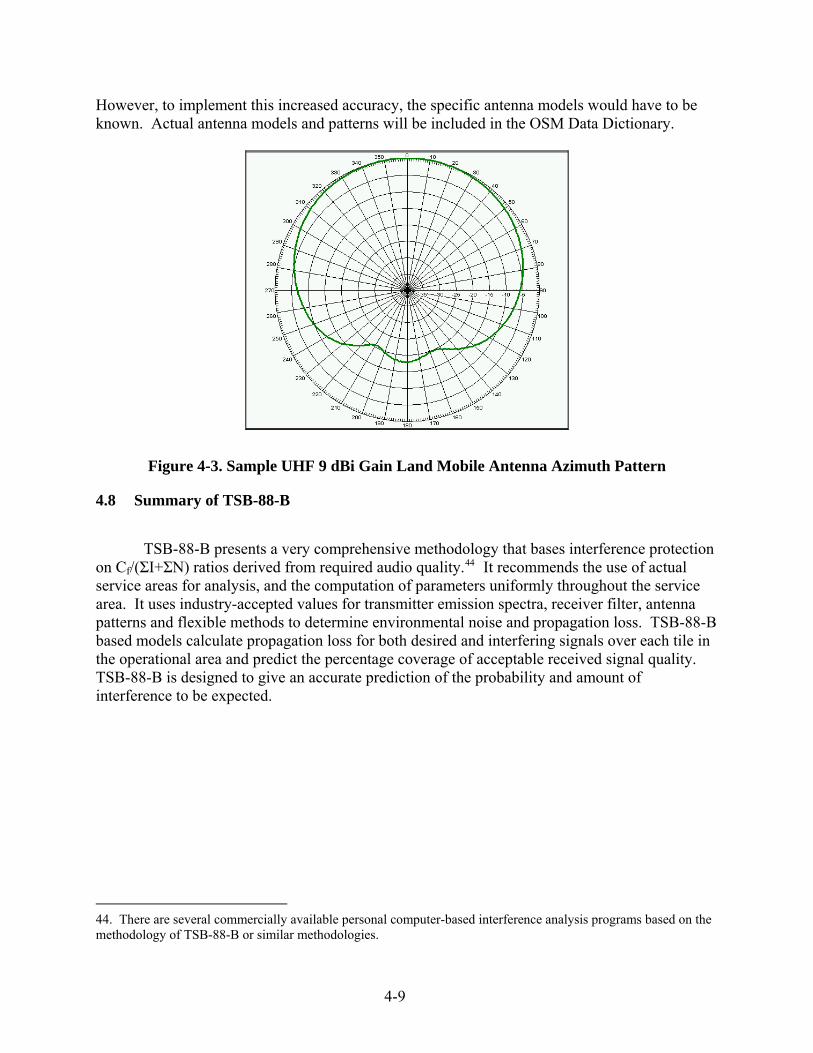
However, to implement this increased accuracy, the specific antenna models would have to be known. Actual antenna models and patterns will be included in the OSM Data Dictionary.
Figure 4-3. Sample UHF 9 dBi Gain Land Mobile Antenna Azimuth Pattern
4.8 Summary of TSB-88-B
TSB-88-B presents a very comprehensive methodology that bases interference protection on Cf/(ΣI+ΣN) ratios derived from required audio quality.44 It recommends the use of actual service areas for analysis, and the computation of parameters uniformly throughout the service area. It uses industry-accepted values for transmitter emission spectra, receiver filter, antenna patterns and flexible methods to determine environmental noise and propagation loss. TSB-88-B based models calculate propagation loss for both desired and interfering signals over each tile in the operational area and predict the percentage coverage of acceptable received signal quality. TSB-88-B is designed to give an accurate prediction of the probability and amount of interference to be expected.
44. There are several commercially available personal computer-based interference analysis programs based on the methodology of TSB-88-B or similar methodologies.
4-9

4-10
Section 5 Comparison of the Spectrum XXI and TSB-88-B Interference
Analysis Algorithms
5.1 Introduction
A discussion comparing the general methodologies, interference criteria, propagation models, noise models, antenna modeling, frequency dependent rejection, and GMF data limitations, of the Spectrum XXI interference analysis algorithm and TSB-88-B is provided in this section.
In addition, the results of a case study using the interference analysis algorithms contained within Spectrum XXI and TSB-88-B are also discussed in this section.
5.2 General Methodology
The interference calculation module in Spectrum XXI is considered a conservative method of calculating degradation and estimating whether interference might occur. Generally, it tends to overestimate interference power levels. This is due to a lack of detailed information in the GMF, and the use of conservative or worst-case assumptions for the missing information. For example, with a lack of transmitter emission spectrum, receiver selectivity information, and antenna patterns forces the Spectrum XXI interference analysis algorithm to make assumptions of their values. Likewise, the Spectrum XXI interference analysis algorithm takes a worst-case scenario approach where the mobile station is assumed to be located at its closest location in the designated area of operation to the interfering base station or mobile station and then performs a single calculation for this path to determine whether interference exists. This is assumed to be a worst-case scenario approach since it does not permit the user to consider the locations where the interference is likely. In general, Spectrum XXI results in a very low likelihood of the occurrence of interference, but the user is given little information on the probability and nature of interference (e.g., percentage of time and location of coverage area where interference may be unacceptable). This may be acceptable in some applications where the spectrum is not being heavily used. Employing detailed equipment characteristics and service information within the Spectrum XXI interference analysis algorithm would substantially improve its prediction of interference and selection of available channels.
TSB-88-B uses a methodology that is more detailed, and thus, is considered more
realistic in predicting land mobile radio interference. To fully implement it, additional information not in the GMF, such as antenna patterns, transmit spectra, receiver characteristics, would have to be available. Much of this information is planned to be in the new OSM Data Dictionary. However, even without the additional information, using many of the recommendations in the TSB-88-B methodology will identify frequencies available for assignment where the probability of interference is sufficiently low. TSB-88-B performs an area analysis, performs calculations throughout the area of operation, and displays them so the user can evaluate whether the areas where interference is likely to occur impact an agency’s mission.
5-1
The approach used by the Spectrum XXI interference analysis algorithm for this scenario results in a frequency being rejected if any interference is calculated anywhere in the area of operation. The TSB-88-B permits the user to visually see the areas where interference is likely to occur, the amount expected, and, considering the area of the user’s operation, to make a determination as to whether it is acceptable.
5.3 Interference Criteria There are several differences in the methodologies recommended by TSB-88-B and those
used by the Spectrum XXI interference analysis algorithm with respect to interference criteria. One difference is that Spectrum XXI uses an I/N criteria in performing a noise degradation analysis. These I/N thresholds are based on generalized situations and do not consider performance objectives or predicted performance. Degradation analyses cannot reliably predict whether interference will occur, but as in the Spectrum XXI interference analysis algorithm implementation, the I/N values can be selected to ensure that interference will not occur.
In contrast, TSB-88-B recommends using Cf /(ΣI+ΣN) that directly corresponds with
specific performance objectives that include statistical allowances for signal fading. Specifically, TSB-88-B considers the statistics of desired and interfering signal power levels and bases the amount of allowable interference on statistical performance criteria. This performance analysis generally has the effect of permitting much greater levels of interfering signal power, especially in areas where the desired signal is strong. Currently there are no universal performance criteria for federal systems, and such criteria may have to be developed.
5.4 Propagation Models
Several differences in the methodologies for the propagation models used by Spectrum XXI and TSB-88-B are discussed below. First, there is a significant difference between the Spectrum XXI interference analysis algorithm and TSB-88-B when calculating propagation loss for mobile stations. The Spectrum XXI interference analysis algorithm uses SEM to estimate propagation loss if a radius of operation is associated with either the transmitter or the receiver station. SEM considers spherical earth diffraction but does not include clutter, building or other losses when appropriate. TSB-88-B uses the empirical Okumura-Hata-Davidson model for preliminary analysis but recommends the use of a terrain-based model for the final analysis of selected sites. TSB-88-B recommends that clutter, building, and other appropriate losses be included. Another difference is that the Spectrum XXI interference analysis algorithm computes interfering signal power levels between a base station of one system and a mobile station located on the closest point of its radius of operation, or in the case of mobile station-to-mobile station interference, to and from the two mobile stations (one from each system) located closest to each other. Since the Spectrum XXI interference analysis algorithm uses the SEM to compute the propagation loss, this is considered worst-case since this will result in the lowest loss and the largest received interfering signal level.
5-2

TSB-88-B calculates desired and interfering signal levels at each tile in the service area of each system. This permits a more comprehensive study to determine where interference is most likely to occur and its effect on the missions involved. Furthermore, using TSB-88-B to compare performance achieved (with and without interference) provides a much more precise and detailed interference analysis. TSB-88-B is written primarily for the non-federal land mobile radio bands where the mobile transmit and receive frequencies are segmented into different parts of the band, so it does not fully account for mobile station-to-mobile station interference in un-segmented bands such as many federal land mobile radio bands. A modification to the TSB-88-B methods may be necessary to accommodate this situation.
5.5 Noise Models
The noise data used in the TSB-88-B methodology can be more refined than that assumed in the Spectrum XXI interference analysis algorithm as the latter uses only frequency and general environmental classifications. The TSB-88-B methodology, however, relates the expected values of noise to NLCD and LULC categories.
5.6 Frequency Dependent Rejection To compute the FDR used in the interference analysis, both Spectrum XXI and TSB-88-B integrate the transmit spectrum and receiver selectivity. However, due to the lack of transmitter emission spectra in the GMF, the Spectrum XXI interference analysis algorithm uses a transmit spectrum based on the unwanted emission masks contained in the NTIA Manual, which will tend to overestimate the resulting interfering signal power levels. TSB-88-B uses measured or simulated actual transmit power densities, which eliminates most of the potential error bias from this part of the analysis. For the receiver selectivity, the Spectrum XXI interference analysis algorithm uses a mask based on zero loss within the necessary bandwidth of the system transmitters and a constant linear frequency roll-off. The roll-off is dependent on the modulation type. TSB-88-B provides receiver selectivity characteristics based on expected reasonable rejection characteristics for receivers for different bandwidths and modulation types.
Since the methodology within TSB-88-B uses more realistic transmitter emission spectra and receiver filter data, a more realistic FDR for adjacent and second adjacent channel rejection is calculated as compared to that calculated by the Spectrum XXI interference analysis algorithm. Most of the difference appears to be due to the Spectrum XXI interference analysis algorithm transmit spectrum emission mask floor. Additional FDR loss permits a more accurate calculation of the interference power and predicts overall less interference power as well. Figure 5-1 gives an example of the differences in parameters used to compute FDR using 25 kHz wide-band analog FM for second adjacent channel interference. This figure is a composite of Figure 3-2, Figure 3-3, Figure 4-1, and Figure 4-2. Figure 5-1 shows the respective transmit power spectral density and receive filtering used by Spectrum XXI and TSB-88-B in computing FDR. The resulting FDR calculated by the TSB-88-B methodology was 80 dB, while that calculated using the Spectrum XXI interference analysis algorithm was 68 dB. This could be especially significant in areas where the land mobile radio spectrum is heavily used.
5-3
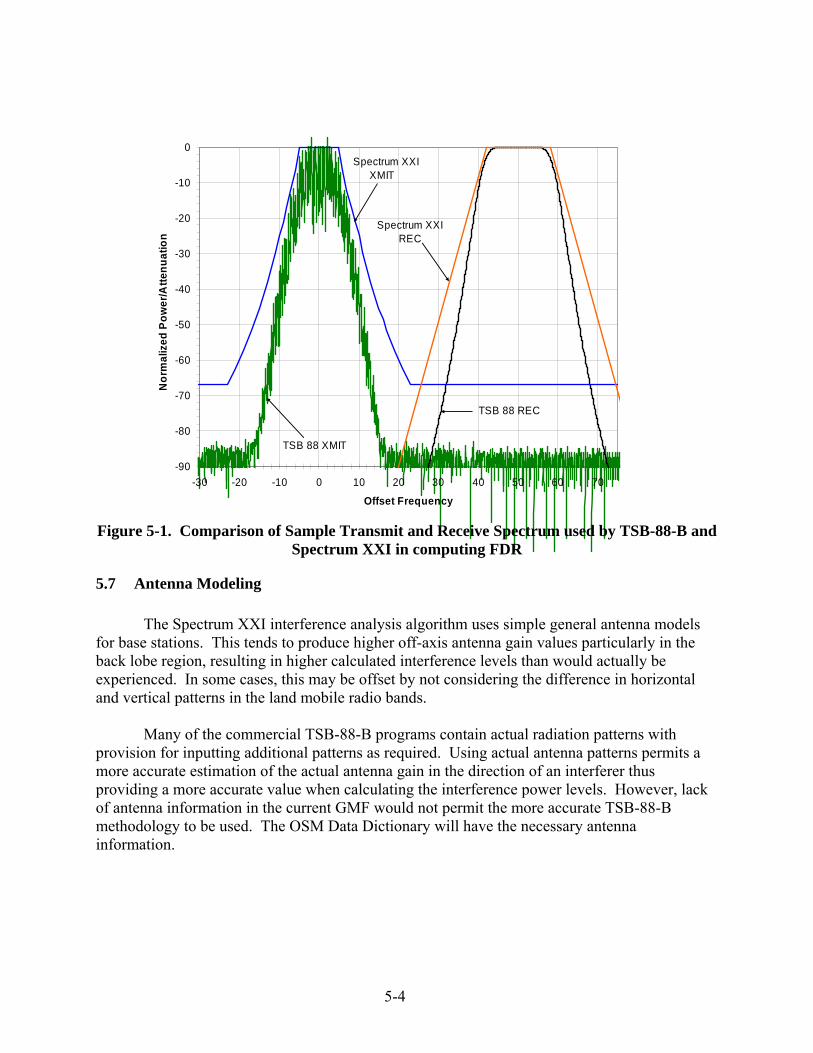
-90
-80
-70
-60
-50
-40
-30
-20
-10
0
-30 -20 -10 0 10 20 30 40 50 60 70
Offset Frequency
Nor
mal
ized
Pow
er/A
ttenu
atio
nSpectrum XXI XMIT
TSB 88 XMIT
Spectrum XXI REC
TSB 88 REC
Figure 5-1. Comparison of Sample Transmit and Receive Spectrum used by TSB-88-B and Spectrum XXI in computing FDR
5.7 Antenna Modeling The Spectrum XXI interference analysis algorithm uses simple general antenna models for base stations. This tends to produce higher off-axis antenna gain values particularly in the back lobe region, resulting in higher calculated interference levels than would actually be experienced. In some cases, this may be offset by not considering the difference in horizontal and vertical patterns in the land mobile radio bands.
Many of the commercial TSB-88-B programs contain actual radiation patterns with provision for inputting additional patterns as required. Using actual antenna patterns permits a more accurate estimation of the actual antenna gain in the direction of an interferer thus providing a more accurate value when calculating the interference power levels. However, lack of antenna information in the current GMF would not permit the more accurate TSB-88-B methodology to be used. The OSM Data Dictionary will have the necessary antenna information.
5-4
5.8 Results of Case Study Using Spectrum XXI and TSB-88-B A comparison study using the methodologies contained within TSB-88-B and Spectrum XXI for a land mobile radio frequency assignment exercise in the Washington, D.C. area in the 162 - 174 MHz band was performed. Both Spectrum XXI and a commercial implementation of TSB-88-B were used. There were some understandable differences in the results that can be attributed to the way the federal government represents some assignments, like those with an MO station class (Mobile, including aeronautical mobile). The TSB-88-B program performs the analysis in several steps. The results of the first step, which shows frequencies that can be assigned without any further analysis, were used.
The results of the study showed that Spectrum XXI found eight interference-free frequencies available for assignment, whereas a TSB-88-B program found over 40. This result clearly shows the benefits of the TSB-88-B analysis methodology.
Although the actual selection of frequencies for assignment would entail additional analysis, including such factors as co-site intermodulation, transmit/receive separations, special restrictions, it is clear that programs based on the TSB-88-B methodology will provide the user with a larger pool of frequencies from which to choose. Even in cases where insufficient frequencies are provided from the first step, TSB-88-B provides the user with additional analysis capabilities to further examine those frequencies not passing the first selection, to further evaluate whether the possible interference is acceptable. Details of this case study are given in Annex A.
5.9 Summary Comparison
Table 5-1 provides a comparison the various analysis parameters used in the Spectrum XXI interference analysis algorithm and TSB-88-B methodologies.
5-5
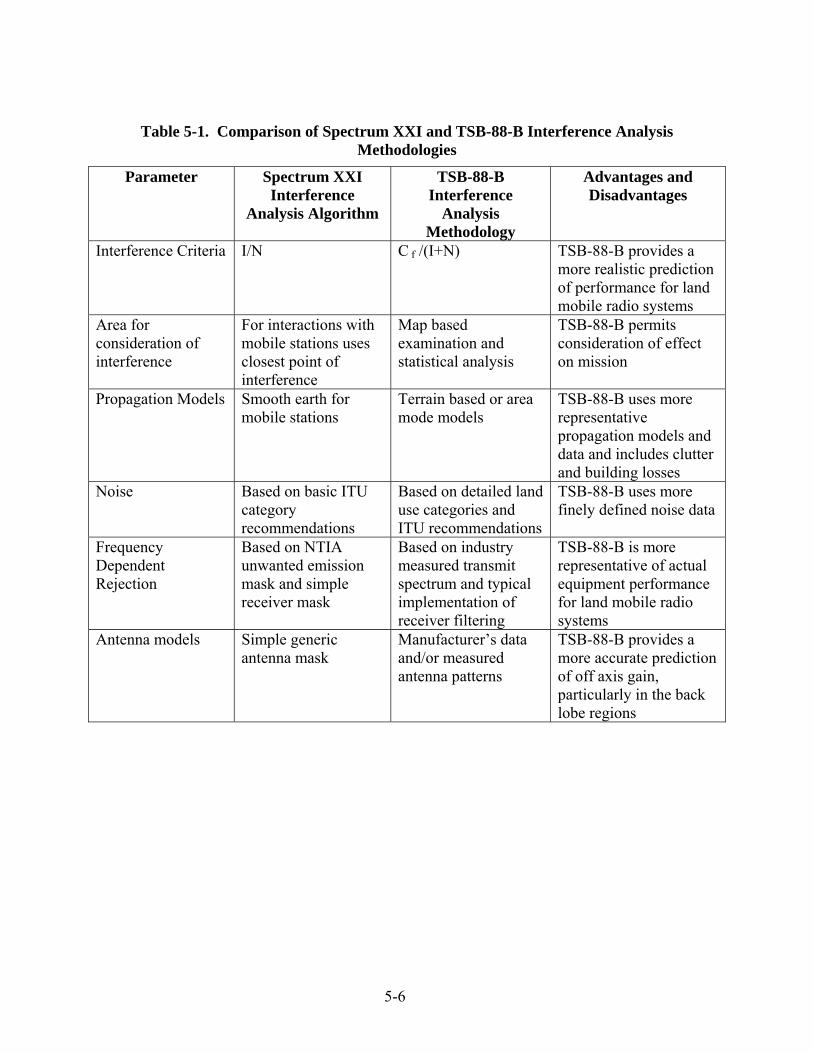
Table 5-1. Comparison of Spectrum XXI and TSB-88-B Interference Analysis Methodologies
Parameter Spectrum XXI Interference
Analysis Algorithm
TSB-88-B Interference
Analysis Methodology
Advantages and Disadvantages
Interference Criteria I/N C f /(I+N) TSB-88-B provides a more realistic prediction of performance for land mobile radio systems
Area for consideration of interference
For interactions with mobile stations uses closest point of interference
Map based examination and statistical analysis
TSB-88-B permits consideration of effect on mission
Propagation Models Smooth earth for mobile stations
Terrain based or area mode models
TSB-88-B uses more representative propagation models and data and includes clutter and building losses
Noise Based on basic ITU category recommendations
Based on detailed land use categories and ITU recommendations
TSB-88-B uses more finely defined noise data
Frequency Dependent Rejection
Based on NTIA unwanted emission mask and simple receiver mask
Based on industry measured transmit spectrum and typical implementation of receiver filtering
TSB-88-B is more representative of actual equipment performance for land mobile radio systems
Antenna models Simple generic antenna mask
Manufacturer’s data and/or measured antenna patterns
TSB-88-B provides a more accurate prediction of off axis gain, particularly in the back lobe regions
5-6

Section 6 Recommendations
In light of the increasing requirements for land mobile radio frequencies, federal
spectrum managers should apply interference calculation and frequency assignment/coordination techniques that are as detailed as possible. To achieve this goal, NTIA recommends that federal agencies use interference analysis programs for assigning frequencies in the land mobile radio frequency bands based on the methodology of TSB-88-B or a similar methodology. Some of the advantages of TSB-88-B require information not in the GMF, and, where possible, industry common practice or typical equipment characteristics should be used. In other cases, the complete implementation of some of the algorithms may have to await the implementation of the OSM Data Dictionary. As a minimum, the interference analysis methodology should include the following:
• A performance analysis that is based on C f/(I+N), rather than a degradation analysis based on I/N. (Where possible, use a graphical replication of an agency’s actual operational area and statistical methods to analyze areas where interference is calculated to determine the effect on the agency’s mission.);
• Terrain-based propagation models where terrain data is available, otherwise use the Okumura/Hata/Davidson model for urban areas or a terrain based model in the area mode in which a general roughness parameter is included to represent a class of terrain; 45
• One arc second terrain data where available;46 • Clutter loss values that are available from USGS in terms of LULC or the NLCD.
(However, they are finely granulated and NTIA recommends the ten clutter categories as defined in TSB-88-B are adequate in most cases.);
• Transmitter power spectral density curves and receiver filter selectivity curves
that more accurately represent actual equipment performance;
45. The most recent deterministic model is the version of the Longley-Rice model, the Irregular Terrain Model, (ITM) developed at the Institute for Telecommunication Sciences (ITS) of NTIA. ITM version 1.2.2 of the model in MS-DOS as well as the C++ version, developed at the Office of Spectrum Management (OSM), is available on-line at: http://flattop.its.bldrdoc.gov/itm.html. Otherwise, the versions of Longley-Rice used in most current automated software programs will be adequate. 46. One arc-second (approximately 30 meters in the middle and lower latitudes) terrain data is available from the United States Geological Survey. In order to save computation time, except where it is apparent that this terrain exactness is required, it is suggested that this data be sampled every 3 arc-seconds. These data are also available at http://ntiacsd.ntia.doc.gov/msam/TOPO/USGS_CDED/ and are included in many of the automated programs.
6-1
• Antenna models that are based on actual antenna pattern data, either measured or provided by manufacturers;
• Building penetration loss for indoor coverage. (The building penetration loss for a specific scenario may be added to the propagation loss.); and
• For VHF systems, environmental noise levels related to the LULC or NLCD categories. (Environmental noise is generally not an issue for UHF systems.)
6-2

Annex A Case Study Results
A.1 Background NTIA performed a comparison between the TSB-88-B methodology and that of Spectrum XXI interference analysis algorithm. NTIA chose a location near the Commerce Building in Washington, D.C. for the sample comparison. An operational radius of 16 kilometers, which approximately covers the area within the Capitol Beltway, I-495, was used. The 162-174 MHz land mobile radio band was chosen. Both the Spectrum XXI interference analysis algorithm and one of the TSB-88-B commercial programs were used to provide a list of interference free frequencies. For this sample analysis, the parameters in Table A-1 for the proposed assignment were used.
Table A-1. Proposed Station Assignment for Case Study
Parameter Base Station Mobile Station State DC Same City Washington Same
Latitude 38o 53’ 35” N Varied Longitude 77o 01’ 58” W Varied
Antenna gain and type 5 dBi 0 dBi Terrain elevation 8 meters Varied Antenna height 40 meters 2 meters
Polarization Vertical Same Emission 8K10F1E Same Emission 8K10F1D Same
Power 50 watts Same Operational Area Radius 16 kilometers Same
The December 2004 GMF database was used to identify the assignments on record for the test area. Allotments, area assignments, and assignment notes were not considered, as they would have the same affect on both methodologies.
A.2 Spectrum XXI Interference Analysis Algorithm Results The Spectrum XXI interference analysis algorithm initially found four frequencies without an interference conflict. However, upon closer examination of the analyses results, it was found that some frequencies were being eliminated under constraints that generally were not appropriate. For instance, the GMF has some records used for wireless microphones, which operate in the band on a non-interfering basis and
A-1

should not be considered in an interference analysis.1 The Spectrum XXI interference analysis algorithm, however, considers these assignments in its interference analysis. For this test, these assignments were removed from the database. In addition, the Spectrum XXI interference analysis algorithm adds 10,000 feet to any assignment with a MO (Mobile) station class, as these frequency assignments could be used by personnel in aircraft. Protecting these frequency assignments for this use places a severe restraint on frequency reuse; therefore, these assignments were also eliminated for this test. With these two modifications, the Spectrum XXI interference analysis algorithm was able to find eight available frequency assignments as listed in Table A-2.
Table A-2. Results of the Spectrum XXI interference analysis algorithm Assignable Frequency Search
Frequency (MHz) 167.325 167.3375 167.35 173.325 173.3375 173.35 173.3625 173.375
A.3 TSB-88-B Results The TSB-88-B based programs typically follow a multi-stage process. The first stage ranks frequencies according to their potential for interference based on distances between stations, frequency dependent rejection, and a contour analysis, with a score of 100 given to those where the potential is negligible. Other frequencies are given lower scores, and they can be further evaluated considering the actual C /(ΣI+ΣN) in required coverage areas and other factors. The TSB-88-B program found 40 frequencies with a score of 100. The 40 assignable frequencies that showed negligible interference are given in Table A-3.
Table A-3. Results TSB-88-B Based Assignable Frequency Search
Frequency (MHz) 162.175 165.475 165.4875 166.075 166.675 166.8 168.2 168.5 168.55 169.7 169.8 169.85 170.4 170.4125 170.4625 171.575 171.875 172.4 172.4125 172.425 172.5875 172.6 173.2 173.2125 173.225 173.2375 173.25 173.2625 173.275 173.2875 173.3 173.3125 173.325 173.3375 173.5 173.3625 173.375 173.3875 173.6875 173.7625
1. National Telecommunications and Information Administration, U.S. Department of Commerce, Manual of Regulations and Procedures for Federal Radio Frequency Management (May 2003 Edition, January 2006 Revision) at 4-169.
A-2
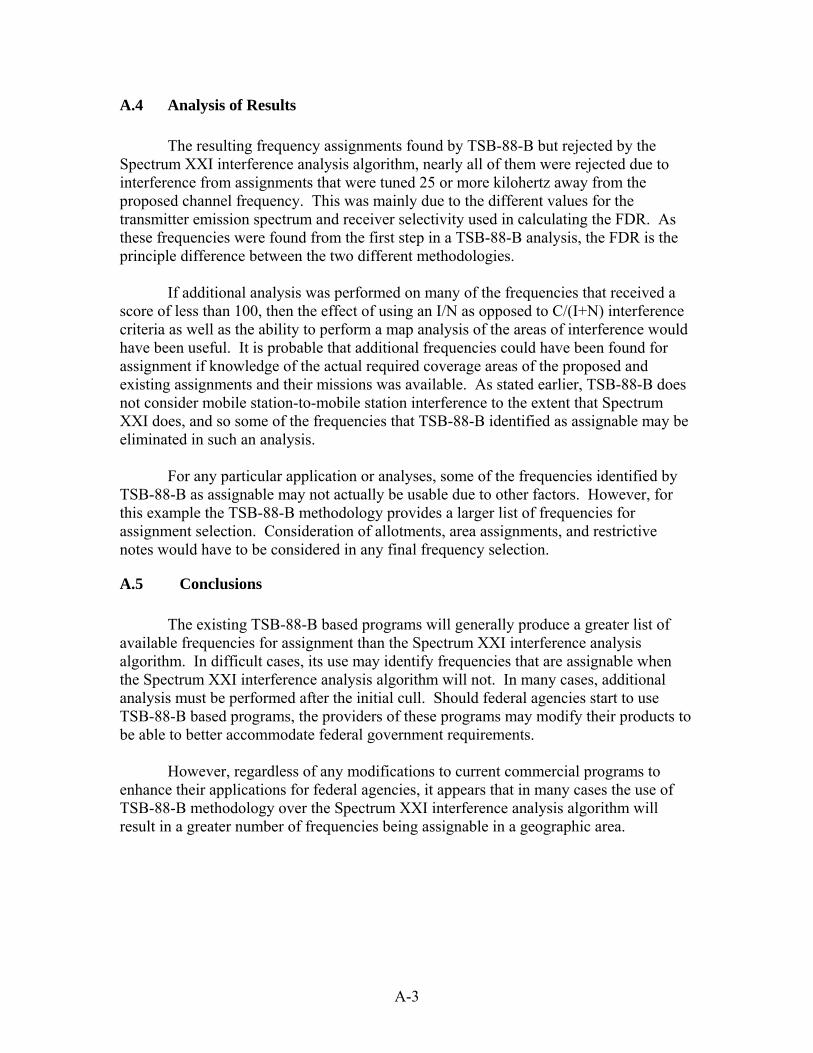
A.4 Analysis of Results The resulting frequency assignments found by TSB-88-B but rejected by the Spectrum XXI interference analysis algorithm, nearly all of them were rejected due to interference from assignments that were tuned 25 or more kilohertz away from the proposed channel frequency. This was mainly due to the different values for the transmitter emission spectrum and receiver selectivity used in calculating the FDR. As these frequencies were found from the first step in a TSB-88-B analysis, the FDR is the principle difference between the two different methodologies.
If additional analysis was performed on many of the frequencies that received a
score of less than 100, then the effect of using an I/N as opposed to C/(I+N) interference criteria as well as the ability to perform a map analysis of the areas of interference would have been useful. It is probable that additional frequencies could have been found for assignment if knowledge of the actual required coverage areas of the proposed and existing assignments and their missions was available. As stated earlier, TSB-88-B does not consider mobile station-to-mobile station interference to the extent that Spectrum XXI does, and so some of the frequencies that TSB-88-B identified as assignable may be eliminated in such an analysis. For any particular application or analyses, some of the frequencies identified by TSB-88-B as assignable may not actually be usable due to other factors. However, for this example the TSB-88-B methodology provides a larger list of frequencies for assignment selection. Consideration of allotments, area assignments, and restrictive notes would have to be considered in any final frequency selection.
A.5 Conclusions
The existing TSB-88-B based programs will generally produce a greater list of available frequencies for assignment than the Spectrum XXI interference analysis algorithm. In difficult cases, its use may identify frequencies that are assignable when the Spectrum XXI interference analysis algorithm will not. In many cases, additional analysis must be performed after the initial cull. Should federal agencies start to use TSB-88-B based programs, the providers of these programs may modify their products to be able to better accommodate federal government requirements.
However, regardless of any modifications to current commercial programs to
enhance their applications for federal agencies, it appears that in many cases the use of TSB-88-B methodology over the Spectrum XXI interference analysis algorithm will result in a greater number of frequencies being assignable in a geographic area.
A-3