assessment of future climate change impacts on …swat.tamu.edu/media/56803/f2-3-byul.pdfk o n k k o...
TRANSCRIPT

K O N K U K U N I V E R S I T Y K O N K U K U N I V E R S I T Y
19 July 2012
Assessment of Future Climate Change Impacts on Snowmelt and
the Stream Water Quality in a Mountainous Watershed
using SWAT
KIM, Saet-Byul* Graduate Student
SHIN, Hyung-Jin/ Park, Min-Ji
KIM, Seong-Joon
Professor
Dept. of Civil & Environmental System Eng. Konkuk University, South Korea

2012년 한국수자원학회 학술발표회 2012 International SWAT Conference
K O N K U K U N I V E R S I T Y
Earth Information Engineering Lab.
Contents
I. Introduction
II. Material and Methods Study watershed Terra MODIS data for snow cover detection SWAT model and the snowmelt theory Climate change scenarios
III. Results and Discussion SWAT snow depletion parameter SWAT calibration and validation Climate change impact on snowmelt and stream water quality
IV. Summary and Conclusion
2012년 한국수자원학회 학술발표회 2012 International SWAT Conference
K O N K U K U N I V E R S I T Y
Earth Information Engineering Lab.
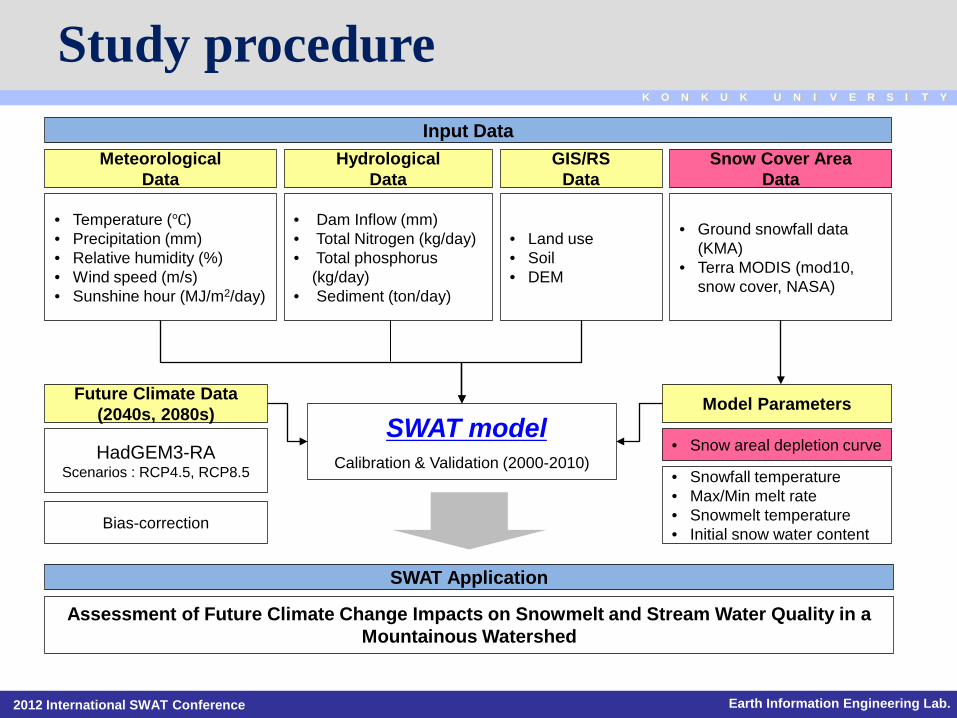
Study procedure
Meteorological Data
• Temperature (℃) • Precipitation (mm) • Relative humidity (%) • Wind speed (m/s) • Sunshine hour (MJ/m2/day)
Hydrological Data
• Dam Inflow (mm) • Total Nitrogen (kg/day) • Total phosphorus
(kg/day) • Sediment (ton/day)
GIS/RS Data
• Land use • Soil • DEM
Snow Cover Area Data
• Ground snowfall data (KMA)
• Terra MODIS (mod10, snow cover, NASA)
Input Data
SWAT model
Calibration & Validation (2000-2010)
Model Parameters
• Snow areal depletion curve
SWAT Application
Assessment of Future Climate Change Impacts on Snowmelt and Stream Water Quality in a Mountainous Watershed
Future Climate Data (2040s, 2080s)
HadGEM3-RA Scenarios : RCP4.5, RCP8.5
Bias-correction
• Snowfall temperature • Max/Min melt rate • Snowmelt temperature • Initial snow water content

2012년 한국수자원학회 학술발표회 2012 International SWAT Conference
K O N K U K U N I V E R S I T Y
Earth Information Engineering Lab.
Four Seasons
Korea seasons
Spring (March - May)
Summer (June - August) Autumn (October - November)
Winter (December - February)
Temperature -2.9 ℃ Precipitation 76.6 mm
Temperature 9.5 ℃ Precipitation 210.0 mm
Temperature 21.7 ℃ Precipitation 752.6 mm
Temperature 11.2 ℃ Precipitation 253.7 mm

2012년 한국수자원학회 학술발표회 2012 International SWAT Conference
K O N K U K U N I V E R S I T Y
Earth Information Engineering Lab.
Korea Seasons
Winter (December – February) Winter lasts from December to mid-March. It can be bitterly cold and dry during this time
due to the influx of cold Siberian air. Heavy snow in the northern and eastern parts of
Korea. Winters can be extremely cold with the minimum temperature dropping below
−20 °C in the inland region of the country: in Seoul, the average January temperature
range is −7 °C to 1 °C (19 °F to 33 °F). January is the coldest month. Snow piled up and
the snow is starting to melt in January especially in the mountain. It is a perfect time to
have fun in the snow. One of the most polular winter activities is skiing.

2012년 한국수자원학회 학술발표회 2012 International SWAT Conference
K O N K U K U N I V E R S I T Y
Earth Information Engineering Lab.
Study Watershed
Chungju Dam watershed
Watershed area : 6,642.0 km2 (heavy snowfall area : about 40%) Annual average snow depth : 80.9 cm Annual average precipitation : 1,359.5 mm Annual average temperature : 9.4 ℃ Forest area : 88.5 % (5573.1 km2) Latitude range : 36.8 °N ~ 37.8 °N Longitude range : 127.9 °E ~ 129.0 °E
Outlet / CD
YW#2
Legend
Legend
YW#1
Lake

2012년 한국수자원학회 학술발표회 2012 International SWAT Conference
K O N K U K U N I V E R S I T Y
Earth Information Engineering Lab.
SWAT Model Description
The hydrology cycle as simulated by SWAT is based on the water balance
equation:
)(
1
0 gwseepasurf
t
idayt QWEQRSWSW −−−−+= ∑
=
SWt = Final soil water content (mm)
SW0 = Initial soil water content on day i (mm)
Rday = Amount of precipitation on day i (mm)
Qsurf = Amount of surface runoff on day i (mm)
Ea = Amount of evapotranspiration on day i (mm)
Wseep = Amount of water entering the vadose zone from the soil profile on day i (mm)
Qgw = Amount of return flow on day i (mm)

2012년 한국수자원학회 학술발표회 2012 International SWAT Conference
K O N K U K U N I V E R S I T Y
Earth Information Engineering Lab.
SWAT Model Description Mass balance equation
In SWAT, snowmelt hydrology is realized on an HRU (Hydrologic
Response Unit) basis.
The mass balance for the snowpack is computed as:
SNO = The water content of the snow pack on a given day (mm H2O)
Rday = The amount of precipitation on a given day (mm H2O)
Esub = The amount of sublimation on a given day (mm H2O)
SNOmlt = The amount of snowmelt on a given day (mm H2O)
mltsubday SNOERSNOSNO −−+=

2012년 한국수자원학회 학술발표회 2012 International SWAT Conference
K O N K U K U N I V E R S I T Y
Earth Information Engineering Lab.
SWAT Model Description Snow depletion curve
The areal depletion curve is based on a natural logarithm
sno cov : the fraction of the HRU area covered by snow on the current day SNOCOVMX : the minimum snow water content that corresponds to 100% snow cover (mm H2O) cov1 and cov2 : the coefficients that define the shape of the curve
−+=
SNOCOVMXSNO
SNOCOVMXSNO
SNOCOVMXSNOsno iii
21cov covexp(cov
10% SNO100 = 50% coverage 30% SNO100 = 50% coverage 50% SNO100 = 50% coverage 70% SNO100 = 50% coverage 90% SNO100 = 50% coverage

2012년 한국수자원학회 학술발표회 2012 International SWAT Conference
K O N K U K U N I V E R S I T Y
Earth Information Engineering Lab.
Terra MODIS Snow Cover Area MODIS (Moderate Resolution Imaging Spectroradiometer)
MODIS data is to permit the regional to global study of the land, atmosphere, and ocean on a daily or near-daily basis (Salomonson et al., 1992)
NDSI (Normalized Difference Snow Index) The automated MODIS snow-mapping algorithm uses at satellite reflectance
in MODIS band 4 (0.545-0.565 ㎛) and band 6 (1.628-1.652 ㎛) to calculate the normalized difference snow index
6464
MODISMODISMODISMODISNDSI
+−
=
2004. 3. 7 MODIS image

2012년 한국수자원학회 학술발표회 2012 International SWAT Conference
K O N K U K U N I V E R S I T Y
Earth Information Engineering Lab.
09 Jan. 11 Jan. 24 Jan. 10 Dec. 13 Dec. 01 Jan.
Terra MODIS Snow Cover Area
12 Mar. 19 Mar. 22 Mar. 20 Jan. 24 Jan. 26 Jan.
17 Jan. 22 Jan. 28 Jan. 06 Mar. 13 Mar. 19 Mar.
10 Jan. 15 Jan. 17 Jan. 25 Feb. 27 Feb. 13 Mar.
The generated snow depth distribution using the MODIS snow cover extent and the
ground-measured snowfall data (2000-2010)
melt snow 2000
2001 2002-2003
2004 2005
2007 2005

2012년 한국수자원학회 학술발표회 2012 International SWAT Conference
K O N K U K U N I V E R S I T Y
Earth Information Engineering Lab.
Terra MODIS Snow Cover Area
09 Feb. 12 Feb. 21 Feb. 19 Dec. 21 Dec. 24 Dec.
09 Jan. 14 Jan. 18 Jan. 24 Jan. 26 Jan. 01 Feb.
06 Jan. 13 Jan. 17 Jan. 11 Mar. 12 Mar. 13 Mar.
2008
2005 2006
2007 2008
2010

2012년 한국수자원학회 학술발표회 2012 International SWAT Conference
K O N K U K U N I V E R S I T Y
Earth Information Engineering Lab.
0.0
0.2
0.4
0.6
0.8
1.0
0.0 0.2 0.4 0.6 0.8 1.0
Frac
tion
area
l cov
erag
e
Snow Volume (fraction of SNO100)
TOTAL
Snow Depletion Curve
0.47
2001-2002 2002-2003
2003-2004 2004-2005 2005-2006
2006-2007 2007-2008 2009-2010
0.7 0.4
0.45 0.7 0.42
0.7 0.48 0.7
2000-2001
0.7
The snow depletion curves from the fraction of snow cover area and snow volume
of each data set.
10% SNO100 = 50% coverage 30% SNO100 = 50% coverage 50% SNO100 = 50% coverage 70% SNO100 = 50% coverage 90% SNO100 = 50% coverage

2012년 한국수자원학회 학술발표회 2012 International SWAT Conference
K O N K U K U N I V E R S I T Y
Earth Information Engineering Lab.
Preparation of SWAT input data
Elevation : 115 – 1,559m (average : 609.1 m)
Soil : sandy loam (40 %), clay loam (45 %)
Land cover (2000)
Data Set Source Scale Data Description / Properties
Terrain Korea National Geography Institute 1:5,000 Digital Elevation Model (DEM) – 30 m
Soil Korea Rural Development Administration 1:25,000 Soil classifications and physical properties such as bulk
density, texture, and saturated conductivity.
Land use Landsat TM Satellite Image 30 m Land use classifications such as paddy, grass, and forest.
Weather Korea Meteorological Administration Daily precipitation, minimum and maximum temperature, mean
wind speed and relative humidity data from 1998 to 2010
Streamflow Han River Flood Control Office Daily streamflow data from 1998 to 2010
Water Quality Ministry of Environment Monthly Water quality (SS, T-N and T-P) data from 1998 to 2010

2012년 한국수자원학회 학술발표회 2012 International SWAT Conference
K O N K U K U N I V E R S I T Y
Earth Information Engineering Lab.
Snow Parameters
Parameter 2000 2001
2001 2002
2002 2003
2003 2004
2004 2005
2005 2006
2006 2007
2007 2008
2008 2009
2009 2010 Avg.
SFTMP 2.5 5 -2 5 -5 -5 -5 -5 7 1 -0.15
SMTMP 4.5 7 7 7 5 8 8 5 8 5 6.45
SNOCOVMX 1 1 1 1 1 1 1 1 1 1 1
SNO50COV 0.7 0.4 0.45 0.7 0.42 0.7 0.45 0.48 0.47 0.7 0.47
TIMP 1 1 1 1 1 1 1 1 1 1 1
SMFMX 1 8 5 1 1 1 4.5 4.5 1 4.5 3.39
SMFMN 4.5 4 5 4.5 4.5 4.5 4.5 4.5 4.5 4.5 4.5
The calibrated model parameters The 7 snowmelt parameters of SFTMP, SMTMP, SMFMX, SMFMN, TIMP,
SNOCOVMX and SNO50COV
SFTMP : Snowfall temperature (℃) SMTMP : Snow melt base temperature (℃) SNOCOVMX : Threshold depth of snow, above which
there is 100% cover [mm] SNO50COV : Fraction of SNOCOVMX that provides 50%
cover
TIMP : Snow pack temperature lag factor SMFMX : Maximum snow melt factor (mm H2O/ºC-
day) SMFMN : Minimum snow melt factor (mm H2O/ºC-
day)

2012년 한국수자원학회 학술발표회 2012 International SWAT Conference
K O N K U K U N I V E R S I T Y
Earth Information Engineering Lab.
Calibration and Validation Streamflow
Calibration period : 2000-2010
YW #1 / PR #3
YW #2 / DR
Chungju dam
R2: 0.74 / ME: 0.71
R2: 0.72 / ME: 0.61
R2: 0.88 / ME: 0.80

2012년 한국수자원학회 학술발표회 2012 International SWAT Conference
K O N K U K U N I V E R S I T Y
Earth Information Engineering Lab.
Calibration and Validation
Stream Water Quality (SS, T-N and T-P) (PR #3) (DR)
R2: 0.87 / ME: 0.72
R2: 0.74 / ME: 0.54
R2: 0.85 / ME: 0.70
R2: 0.61 / ME: 0.75
R2: 0.88 / ME: 0.85
R2: 0.62 / ME: 0.70
2012년 한국수자원학회 학술발표회 2012 International SWAT Conference
K O N K U K U N I V E R S I T Y
Earth Information Engineering Lab.
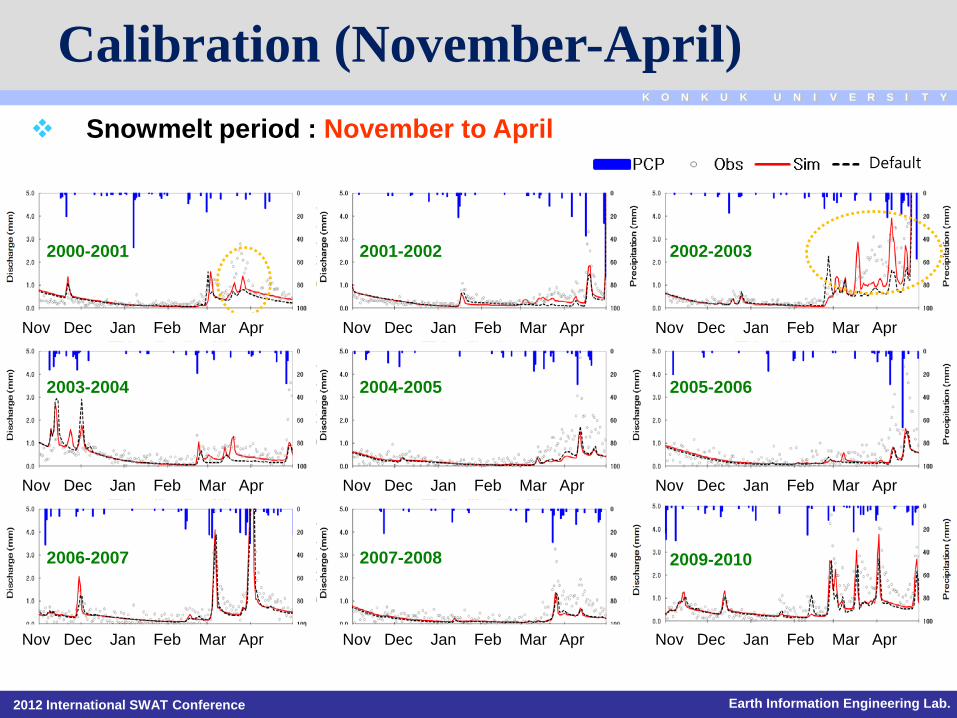
Calibration (November-April) Snowmelt period : November to April
2000-2001 2001-2002 2002-2003
2003-2004 2004-2005 2005-2006
2006-2007 2007-2008 2009-2010
Default
Nov Dec Jan Feb Mar Apr Nov Dec Jan Feb Mar Apr Nov Dec Jan Feb Mar Apr
Nov Dec Jan Feb Mar Apr Nov Dec Jan Feb Mar Apr Nov Dec Jan Feb Mar Apr
Nov Dec Jan Feb Mar Apr Nov Dec Jan Feb Mar Apr Nov Dec Jan Feb Mar Apr

2012년 한국수자원학회 학술발표회 2012 International SWAT Conference
K O N K U K U N I V E R S I T Y
Earth Information Engineering Lab.
Calibration and Validation
Year Period Snow depth PCP Q (mm) QR (%) RMSE
NSE QRA/ QRS (cm) (mm) Obs. Sim. Obs. Sim. (mm/day)
2000-2001 Annual
128.6 831.2 309.4 344.9 37.2 41.5 0.82 0.57
18.2 Snowmelt 177.2 90.7 62.6 51.2 35.3 0.49 0.37
2001-2002 Annual
56.5 1238.0 836.7 863.0 67.6 69.7 2.95 0.83
6.6 Snowmelt 242.0 83.5 56.8 34.5 23.5 0.41 0.96
2002-2003 Annual
129.7 1590.5 1032.2 1167.6 64.9 73.4 2.56 0.64
13.0 Snowmelt 270.0 191.6 151.8 71.0 56.2 0.66 0.92
2003-2004 Annual
59.6 1375.9 931.0 995.6 67.7 72.4 3.38 0.72
8.9 Snowmelt 187.9 103.5 88.8 55.1 47.3 0.48 0.95
2004-2005 Annual
86.9 1260.0 741.4 750.5 58.8 59.6 2.33 0.50
6.3 Snowmelt 175.0 101.3 46.9 57.9 26.8 0.68 0.83
2005-2006 Annual
52.2 1870.0 953.0 1015.9 51.0 54.3 5.50 0.64
5.6 Snowmelt 218.0 105.0 57.2 48.2 26.3 0.69 0.90
2006-2007 Annual
49.7 1538.0 1019.5 963.5 66.3 62.6 3.29 0.65
10.8 Snowmelt 265.0 131.3 103.6 49.6 39.1 0.54 0.95
2007-2008 Annual
80.5 1083.0 472.9 458.3 43.7 42.3 4.02 0.38
10.1 Snowmelt 162.0 83.0 46.4 51.3 28.6 0.44 0.80
2008-2009 Annual
33.1 1263.0 596.7 539.4 47.2 42.7 3.32 0.70
5.4 Snowmelt 202.0 55.3 29.4 27.4 14.5 0.29 0.95
2009-2010 Annual
92.5 1250.3 819.7 684.5 65.6 54.7 3.16 0.64
16.6 Snowmelt 260.3 181.4 113.6 69.7 43.7 0.80 0.76
Mean Annual
76.9 1330.0 76.9 771.2 57.3 57.0 3.10 0.60
10.1 Snowmelt 215.9 112.7 75.7 51.6 34.1 0.50 0.80
Q : Streamflow, QR : Runoff ratio, QRA : Runoff ratio for annual period (Nov-Oct) , QRS : Runoff ratio for snowmelt period (Nov-Apr) , and RMSE : Root mean square error.

2012년 한국수자원학회 학술발표회 2012 International SWAT Conference
K O N K U K U N I V E R S I T Y
Earth Information Engineering Lab.
General Circulation Model (GCM)
IPCC AR5 model
Model Center Country Scenario Grid size
HadGEM3-RA UKMO (UK Met. Office)
UK RCP 4.5 (540 ppm) RCP 8.5 (940 ppm)
12.5km × 12.5km (0.125° × 0.125°)
Weather station Rainfall station

2012년 한국수자원학회 학술발표회 2012 International SWAT Conference
K O N K U K U N I V E R S I T Y
Earth Information Engineering Lab.
Bias correction Before correction
After correction

2012년 한국수자원학회 학술발표회 2012 International SWAT Conference
K O N K U K U N I V E R S I T Y
Earth Information Engineering Lab.
Climate Scenarios
Temperature (℃)
Humidity (%)
Precipitation (mm)
Wind speed (m/s)

2012년 한국수자원학회 학술발표회 2012 International SWAT Conference
K O N K U K U N I V E R S I T Y
Earth Information Engineering Lab.
Climate Scenarios Period Scenario TMN (℃) TMN
difference (℃) TMP (℃) TMP difference (℃) TMX (℃) TMX
difference (℃) PCP (mm) PCP variation (%)
Annual (Nov – Oct)
Baseline (1987~2010) 5.33 - 10.58 - 15.83 - 1292.9 -
RCP 4.5 2040s 6.74 1.40 11.84 1.26 16.94 1.11 1544.6 16.3
2080s 7.77 2.43 12.80 2.22 17.87 2.04 1648.7 21.6
RCP8.5 2040s 7.31 1.98 12.40 1.82 17.48 1.66 1600.5 19.2
2080s 9.99 4.65 15.03 4.45 20.13 4.30 1524.8 15.2
Spring (Mar – May)
Baseline (1987~2010) 4.15 - 10.09 - 16.03 - 210.0 -
RCP 4.5 2040s 5.96 1.81 11.57 1.48 17.20 1.17 366.9 42.8
2080s 8.34 4.19 13.95 3.86 20.42 4.39 376.0 44.2
RCP8.5 2040s 6.56 2.42 12.17 2.08 17.78 1.75 387.3 45.8
2080s 9.03 4.88 14.64 4.55 20.22 4.19 384.1 45.3
Summer (Jun – Aug)
Baseline (1987~2010) 18.09 - 22.44 - 26.79 - 752.6 -
RCP 4.5 2040s 19.03 0.93 23.67 1.23 28.22 1.43 771.5 2.5
2080s 20.26 2.16 24.80 2.36 29.26 2.47 792.6 5.0
RCP8.5 2040s 19.82 1.73 24.52 2.08 29.11 2.32 745.5 -1.0
2080s 22.32 4.23 26.93 4.49 31.51 4.72 674.0 -11.7
Autumn (Sep –Nov)
Baseline (1987~2010) 6.55 - 12.04 - 17.54 - 253.7 -
RCP 4.5 2040s 8.33 1.78 13.56 1.51 18.83 1.30 270.2 6.1
2080s 9.42 2.86 14.54 2.49 19.74 2.20 308.6 17.8
RCP8.5 2040s 8.82 2.27 13.97 1.93 19.19 1.65 303.1 16.3
2080s 11.64 5.09 16.78 4.74 22.01 4.48 278.7 8.9
Winter (Dec – Feb)
Baseline (1987~2010) -7.46 - -2.26 - 2.95 - 76.6 -
RCP 4.5 2040s -6.37 1.09 -1.45 0.81 3.50 0.55 136.0 43.7
2080s -5.54 1.93 -0.69 1.56 4.26 1.31 147.3 48.0
RCP8.5 2040s -5.98 1.49 -1.09 1.17 3.85 0.90 164.7 53.5
2080s -3.04 4.42 1.76 4.01 6.78 3.83 188.0 59.3

2012년 한국수자원학회 학술발표회 2012 International SWAT Conference
K O N K U K U N I V E R S I T Y
Earth Information Engineering Lab.
Climate Change Impact on Snowmelt(Nov- Apr)
Change of future monthly snowmelt and streamflow
Snowmelt
Streamflow
• Big change in 2040 March • Advanced by the future
temperature increase
• Increased up to 55.4mm in 2040s
RCP8.5 and 55.9mm in 2080s
RCP8.5 scenario
RCP 4.5 RCP 8.5

2012년 한국수자원학회 학술발표회 2012 International SWAT Conference
K O N K U K U N I V E R S I T Y
Earth Information Engineering Lab.
Climate Change Impact on Water Quality
Runoff Characteristics of Nonpoint Source Pollution Loads
• The future sediment load showed general tendency of increase during snowmelt period. • The future T-N & T-P loads showed clear increase in November, March, and April. • Especially, the reason of future T-P decrease in Jan. and Feb. can be interpreted as follows: By the water temperature increase in the future, the soluble phosphorus concentration (solP)
in the stream may be decreased by the uptake of inorganic P by algae. In addition, the organic phosphorus mineralization rate and the organic phosphorus settling rate can be adjusted to the water temperature in the direction of decreasing solP.

2012년 한국수자원학회 학술발표회 2012 International SWAT Conference
K O N K U K U N I V E R S I T Y
Earth Information Engineering Lab.
Summary and Conclusion This study tried to determine the SWAT snow depletion characteristics and
assess future climate change impacts on snowmelt and the stream water quality for a mountainous watershed using SWAT
The average value of SWAT SNO50COV was 0.47 in Chungju Dam watershed.
The average runoff during snowmelt period (November-April) was 12.6 % for the full period (November to October).
The future snowmelt and streamflow increased up to 141.0%, 154.7% respectively, and the future melt was advanced compared to present.
The future SS, T-N, and T-P loads also increased except January and February of some scenarios.

For further information, please contact:
Kim, Saet-Byul Graduate student, Dept. of Civil & Environmental System Engineering, Konkuk University
Dr. Kim, Seong Joon Professor, Dept. of Civil & Environmental System Engineering, Konkuk University
“ Thank You “