assessment of genetic and nutritional diversity, and
TRANSCRIPT
Assessment of genetic and nutritional diversity, and salinity
tolerance of Kenyan guava (Psidium guajava L.): an
underutilized naturalized fruit species
Dissertation
to obtain the Ph. D. degree
in the International Ph. D. Program for Agricultural Sciences in
Goettingen (IPAG)
at the Faculty of Agricultural Sciences,
Georg-August-University Göttingen, Germany
presented by
Chiveu Chemulanga Josiah
born in Kenya
Göttingen, May, 2018

i
D7
1. Name of supervisor: Prof. Dr. Elke Pawelzik
2. Name of co-supervisor: Jun.-Prof. Dr. Michaela Dippold
Date of dissertation: 18.07.2018
ii
Table of contents
Chapter one .......................................................................................................................... 1
1. General introduction ...................................................................................................... 1
1.1. Overview of global tropical fruit production .......................................................... 1
1.2. Distribution and botanical description of guava ..................................................... 1
1.3. Nutritional properties and uses ............................................................................... 4
1.4. Salinity effect in plants ........................................................................................... 4
1.5. Effect of salinity in guava ....................................................................................... 5
1.6. Guava diversity and production status in Kenya .................................................... 6
Chapter two ........................................................................................................................ 10
2. Genetic diversity of common guava in Kenya: an underutilized naturalized fruit
species .................................................................................................................................. 10
Abstract ................................................................................................................................ 10
2.1. Introduction .............................................................................................................. 11
2.2. Materials and methods .............................................................................................. 12
2.2.1. Study site selection and sampling procedure ..................................................... 12
2.2.2. Leaf material sampling ...................................................................................... 14
2.2.3. DNA isolation and quantification ...................................................................... 14
2.2.4. Primer selection for polymerase chain reaction (PCR) amplification ............... 14
2.3. Data analysis ............................................................................................................. 15
2.4. Results ...................................................................................................................... 16
2.5. Discussion ................................................................................................................. 21
2.6. Conclusion ................................................................................................................ 24
2.7. Supplementary information ...................................................................................... 25
Chapter three ..................................................................................................................... 34
3. Variation in fruit chemical and mineral composition of guava (Psidium guajava L.):
Inferences from climatic conditions, soil nutrients, and fruit morphological traits ............ 34
Abstract ................................................................................................................................ 34
3.1. Introduction .............................................................................................................. 35
3.2. Materials and methods .............................................................................................. 37
3.2.1. Sampling ............................................................................................................ 37
3.2.2. Fruit morphological characterization ................................................................ 38
3.2.3. Determination of fruit chemical and mineral composition ................................ 40
3.2.4. Determination of soil pH and soil nutrients ...................................................... 42
3.3. Data analysis ............................................................................................................. 42
iii
3.4. Results ...................................................................................................................... 44
3.4.1. Fruit chemical and mineral composition based on region and climate ............. 44
3.4.2. Correlation of fruit chemical and mineral composition with soil nutrients ....... 48
3.4.3. Fruit chemical and mineral composition based on pulp colour ......................... 49
3.4.4. Guava fruit morphological traits and effect on chemical and mineral
composition ................................................................................................................. 50
3.5. Discussion ................................................................................................................. 53
3.5.1. The effect of temperature and precipitation on fruit chemical and mineral
composition ................................................................................................................. 53
3.5.2. Effect of soil nutrients on fruit chemical and mineral composition .................. 56
3.5.3. Pulp colour influences chemical and mineral composition of guava fruits ....... 56
3.5.4. Larger and heavier fruits negatively correlate with their chemical and mineral
composition ................................................................................................................. 58
3.6. Supplementary information ...................................................................................... 60
Chapter four ....................................................................................................................... 72
4. Partitioning of dry matter and minerals in guava (Psidium guajava L.) accessions
under salt stress: Implications for selection of adapted rootstocks for saline soils ............. 72
Abstract ................................................................................................................................ 72
4.1. Introduction .............................................................................................................. 73
4.2. Materials and Methods ............................................................................................. 74
4.2.1. Plant material sampling ..................................................................................... 74
4.2.2. Experimental design and data collection ........................................................... 75
4.2.3. Sample preparation and measurements ............................................................. 76
4.2.4. Plant mineral analysis ........................................................................................ 76
4.3. Statistical analysis .................................................................................................... 77
4.4. Results ...................................................................................................................... 77
4.4.1. Growth parameters ............................................................................................ 79
4.4.2. Plant dry matter ................................................................................................. 81
4.4.3. Mineral analysis ................................................................................................. 84
4.5. Discussion ................................................................................................................. 91
4.6. Conclusion ................................................................................................................ 97
4.7. Supplementary information ...................................................................................... 99
Chapter five ...................................................................................................................... 106
5. General discussion ..................................................................................................... 106
5.1. Conclusion .......................................................................................................... 110
References ......................................................................................................................... 111

iv
Summary .......................................................................................................................... 121
Acknowledgement ............................................................................................................ 123
Declaration ....................................................................................................................... 124
Curriculum vitae ............................................................................................................. 125
1
Chapter one
1. General introduction
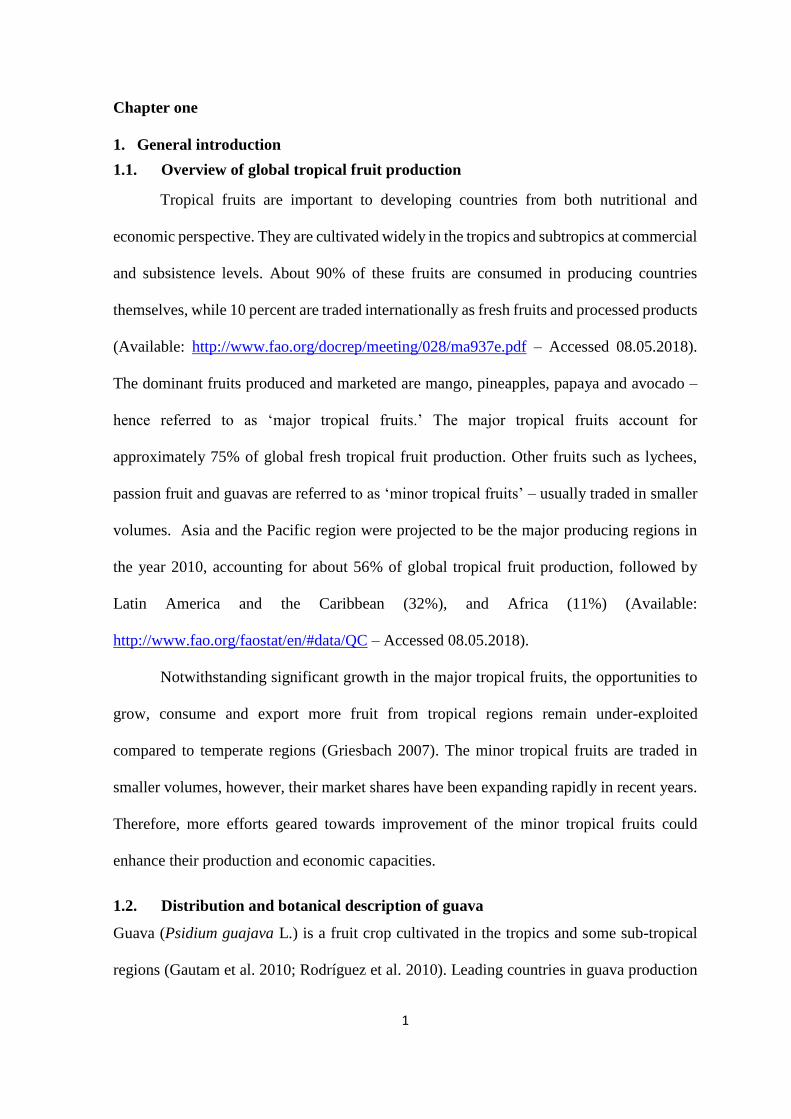
1.1. Overview of global tropical fruit production
Tropical fruits are important to developing countries from both nutritional and
economic perspective. They are cultivated widely in the tropics and subtropics at commercial
and subsistence levels. About 90% of these fruits are consumed in producing countries
themselves, while 10 percent are traded internationally as fresh fruits and processed products
(Available: http://www.fao.org/docrep/meeting/028/ma937e.pdf – Accessed 08.05.2018).
The dominant fruits produced and marketed are mango, pineapples, papaya and avocado –
hence referred to as ‘major tropical fruits.’ The major tropical fruits account for
approximately 75% of global fresh tropical fruit production. Other fruits such as lychees,
passion fruit and guavas are referred to as ‘minor tropical fruits’ – usually traded in smaller
volumes. Asia and the Pacific region were projected to be the major producing regions in
the year 2010, accounting for about 56% of global tropical fruit production, followed by
Latin America and the Caribbean (32%), and Africa (11%) (Available:
http://www.fao.org/faostat/en/#data/QC – Accessed 08.05.2018).
Notwithstanding significant growth in the major tropical fruits, the opportunities to
grow, consume and export more fruit from tropical regions remain under-exploited
compared to temperate regions (Griesbach 2007). The minor tropical fruits are traded in
smaller volumes, however, their market shares have been expanding rapidly in recent years.
Therefore, more efforts geared towards improvement of the minor tropical fruits could
enhance their production and economic capacities.
1.2. Distribution and botanical description of guava
Guava (Psidium guajava L.) is a fruit crop cultivated in the tropics and some sub-tropical
regions (Gautam et al. 2010; Rodríguez et al. 2010). Leading countries in guava production

2
include India, Pakistan, Mexico, Brazil, Egypt, Thailand, Columbia, and Indonesia (Pommer
and Murakami 2009). Guava belongs to the Myrtaceae family with about 150 genera and
more than 5,000 species (Govaerts et al. 2008). The common guava has several secondary
centres of diversity in the wet tropics, mainly in South America, Australia, and tropical Asia,
and also occurs in Africa and even South Europe (Grattapaglia et al. 2012). The fruit tree
has been cultivated for a long time, and its distribution has been promoted by man, birds and
other animals (Pommer and Murakami 2009). The tree has a good potential to grow on
wastelands, including soils with high pH levels (Gautam et al. 2010), explaining its wide
distribution.
The guava is a small (2-10 m tall) monoecious tree, with broad, spreading tops
branching freely close to the ground (Crane and Balerdi 2005) (Figure 1). The fruit is a
fleshy, pyriform or ovoid berry that can weigh up to 500 g (Orwa et al. 2009) and varies
greatly depending on the genotype and the environment (Babu et al. 2007; Patel et al. 2011).
The fruit requires about 120 days to mature after flowering (Crane and Balerdi 2005). The
skin colour of ripe fruits varies from light green to yellow, while the pulp may be red, white,
yellow or pink (Ecocrop 2015; Orwa et al. 2009). The fruit varies from having a thin
pericarp, with many seeds in the pulp, to a thick pericarp, with only a few seeds (Mehmood
et al. 2014). The flavour ranges from sweet to highly acidic, while the aroma may be strong
and penetrating, or even mild and pleasant (Mehmood et al. 2014).
Guava can be propagated by seeds and vegetative means (Kakon et al. 2008). Plants
propagated through seed generally take many years to come into bearing, and normally do
not produce true-to-type and often bear fruits of inferior quality (Kakon et al. 2008). Guava
is also propagated by air layering (Nyambo et al. 2005). Other methods include use of
cuttings, stooling, budding and micropropagation or recently by wedge grafting (Mishra et
al. 2005). Properly propagated and cultured trees may start to bear within two to four years.
3
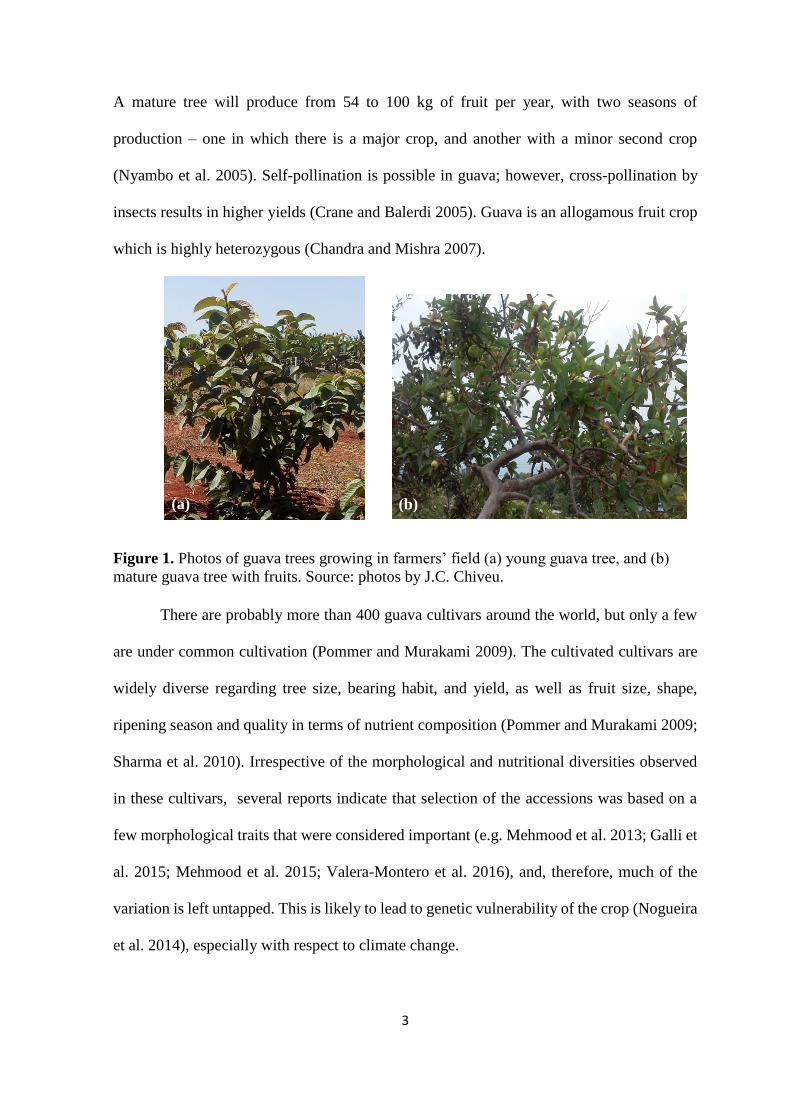
A mature tree will produce from 54 to 100 kg of fruit per year, with two seasons of
production – one in which there is a major crop, and another with a minor second crop
(Nyambo et al. 2005). Self-pollination is possible in guava; however, cross-pollination by
insects results in higher yields (Crane and Balerdi 2005). Guava is an allogamous fruit crop
which is highly heterozygous (Chandra and Mishra 2007).
Figure 1. Photos of guava trees growing in farmers’ field (a) young guava tree, and (b)
mature guava tree with fruits. Source: photos by J.C. Chiveu.
There are probably more than 400 guava cultivars around the world, but only a few
are under common cultivation (Pommer and Murakami 2009). The cultivated cultivars are
widely diverse regarding tree size, bearing habit, and yield, as well as fruit size, shape,
ripening season and quality in terms of nutrient composition (Pommer and Murakami 2009;
Sharma et al. 2010). Irrespective of the morphological and nutritional diversities observed
in these cultivars, several reports indicate that selection of the accessions was based on a
few morphological traits that were considered important (e.g. Mehmood et al. 2013; Galli et
al. 2015; Mehmood et al. 2015; Valera-Montero et al. 2016), and, therefore, much of the
variation is left untapped. This is likely to lead to genetic vulnerability of the crop (Nogueira
et al. 2014), especially with respect to climate change.
(a) (b)
4
1.3. Nutritional properties and uses
Guava fruit is mostly consumed fresh and has been reported to be rich in several
important nutrients. Recent studies have reported appreciable amount of vitamin C and other
antioxidants, calcium, potassium and phosphorus, as well as dietary fibres (Youssef and
Ibrahim 2016; Singh 2005; Prakash et al. 2002; Jiménez-Escrig et al. 2001). Lyophilized
extract of raw fruit peel has been experimentally shown to reduce low-density lipoprotein
(LDL) cholesterol and triglycerides (Rai et al. 2010; Setiawan et al. 2001). Furthermore, the
fruits, leaves, flowers, roots, bark, and stems are traditionally used for their medicinal
properties (Gutiérrez et al. 2008). Guava wood is useful for tool manufacturing, fencing and
use as firewood in the form of charcoal (Orwa et al. 2009). Guava processing yields 25%
by-products that can be used in animal feeding (Azevêdo et al. 2011). In recent years, the
guava fruit has gained popularity in the international trade due to its nutritional value and
the diversity of processed products including jam, jelly, and juice (Available:
http://pdf.usaid.gov/pdf_docs/PA00KP1Z.pdf. Accessed 30.11.2017).
Fruit chemical and mineral composition is affected by the climatic and soil factors
where the fruit tree grows (Wall 2006). Moreover, other factors such as climatic conditions,
cultivar, fruit size and maturity stage of the fruit also impact on its chemical and mineral
composition (Burlingame et al. 2009). There is however limited knowledge on the effect of
each of these factors on the chemical and mineral composition of guava.
1.4. Salinity effect in plants
Salinity is the concentration of dissolved mineral salts present in soils (soil solution)
and waters (Hu and Schmidhalter 2004). Salinity decreases the agricultural production of
most crops and also affects the physicochemical properties of the soil (Hu and Schmidhalter
2004). Soil salinity affects about 7% of the world’s total land area and 23% of arable land
(Flowers et al. 1997). In semiarid and arid areas, low precipitation, high level of evaporation
5
and existence of saline parent rock are the major causes of salinity. However, salinity also
results from poor techniques of irrigation, irrigation with salinized water and salt
accumulation from high doses of mineral fertilization (Bresler et al. 2012).
Mechanisms of salt stress and tolerance by plants are very complex (Kozlowski,
1997) and have been a topic in many baseline studies (Kozlowski 1997; Grattan and Grieve
1998; Hu and Schmidhalter 2004; Munns and Tester 2008). Salinity generally impairs plant
growth in a quick osmotic phase, during which development of young leaves is inhibited and
a tardy ionic phase in which senescence of older leaves is accelerated (Munns 2002). Plants
have developed different types of tolerance mechanisms, which include osmotic stress
tolerance, ion exclusion, and tissue tolerance to ion accumulation (Munns and Tester 2008).
Crop salt tolerance is the ability of plants to survive and produce economic yields
under adverse conditions of salinity (Hu and Schmidhalter 2004). It is usually determined
by the percentage of biomass production in saline versus control conditions over a period of
time (Martin et al. 1994). Tolerance can also be determined by uptake and accumulation of
sodium ions (Na+) in the above-ground biomass as genetic differences in Na+ exclusion from
the transpiration stream have been reported (Munns and James 2003). In addition, the
relationship between salinity tolerance and potassium/sodium ratio (K+/Na+) discrimination
by the plant is usually considered – with a higher K+/Na+ regarded as a means to reduce
Na+ toxicity in the plant (Munns 2005).
1.5. Effect of salinity in guava
Fruit trees are generally regarded as very sensitive to soil salinity (Ebert 1999).
However, a diversity in salt tolerance between plant species and between cultivars within a
crop species exist (Kozlowski 1997). Guava production faces salinity challenges in many
guava-producing countries, such as Brazil (Cavalcante et al. 2007), Australia (Noble and
West 1988), India (Singh et al. 2016), Kenya (Mugai 2004), and Sudan (Ali-Dinar et al.
6
1999). The tolerance threshold for most cultivated guava varieties is generally reported to
vary between 30 mM sodium chloride (NaCl) and 50 mM NaCl in the rhizosphere (Ali-
Dinar et al. 1999; Desai and Singh 1983). In fact, guava has been found to be more sensitive
to salinity during the seedling phase (Cavalcante et al. 2007), as shoot growth is impaired by
salinity in this stage. Some guava types have been reported to perform better under salinity
stress than others (Singh et al. 2016). Most studies on salinity tolerance of guava have mainly
focused on mechanisms to alleviate the effect of salt stress – consequently, their salinity
experiments comprised of treatments that could help plants tolerate salinity. For instance, by
application of nitrate fertilizers (Ali-Dinar et al. 1998), calcium nitrate (Ebert et al. 2002)
and organic manure (da Silva et al. 2008). There is therefore a need to provide uniform
growing conditions for salinity experiments in guava. This will enable selection of guava
genotypes to saline environments as the genotypes would only vary mainly due to the salt
treatments.
1.6. Guava diversity and production status in Kenya
Fruit and nut production offers tremendous opportunities for enhancing the incomes
of small-scale farming families in Kenya and elsewhere in Africa. It also helps in improving
the nutrition of the poor people who have been reported to suffer from deficiencies of
vitamins, minerals and other micronutrients as a consequence of their low consumption
(FAO 2003). For instance, it is estimated that about 50 million African children are at risk
of vitamin A deficiency as a result of its low intake, hence considered Africa’s third greatest
public health problem after HIV/AIDS and malaria (WHO 2002). In Kenya for instance,
35% of children under the age of five years are stunted, 16% are underweight and 7% are
wasted as a result of malnutrition (M.O.H.S 2012). To exacerbate the situation, reports also
indicate that East Africa has the least fruit consumption anywhere in the world. For example,
fruit consumption is generally low in Kenya and is with 36 g fruits per person and day far

7
below the World Health Organization (WHO) recommended minimum of 400 g fruits and
vegetables per person and day (WHO 2003, 2002).
Kenya has diverse agro-ecological zones that contribute to production of a wide
diversity of both exotic and indigenous fruits (Simitu et al. 2008). However, some of the
naturalized fruit species such as guava and many indigenous ones, are underutilized
(Chikamai et al. 2004). This implies that their potential in terms of health benefits,
contribution to food security and income generation is under-exploited. Fruit growing in
Kenya is mainly carried out by farmers with a low resource base and their level of fruit
species diversification is also low (Mbora et al. 2008). Moreover, little information
concerning the under-utilized fruit species limits their promotion along the fruits’ product
value chain with regard to utilization, production potential, processing, and effective and
efficient marketing (Mbora et al. 2008). Guava is found in all the agroecological regions in
Kenya apart from very arid areas and highlands. It is however not clear when it was
introduced in Kenya, but has been naturalized and occurs in the wild and on farmer’s fields.
Most guava fruits are collected for home consumption and the domestic market. According
to the Horticultural Crops Directorate, HCD (2014), the trees are mainly unattended,
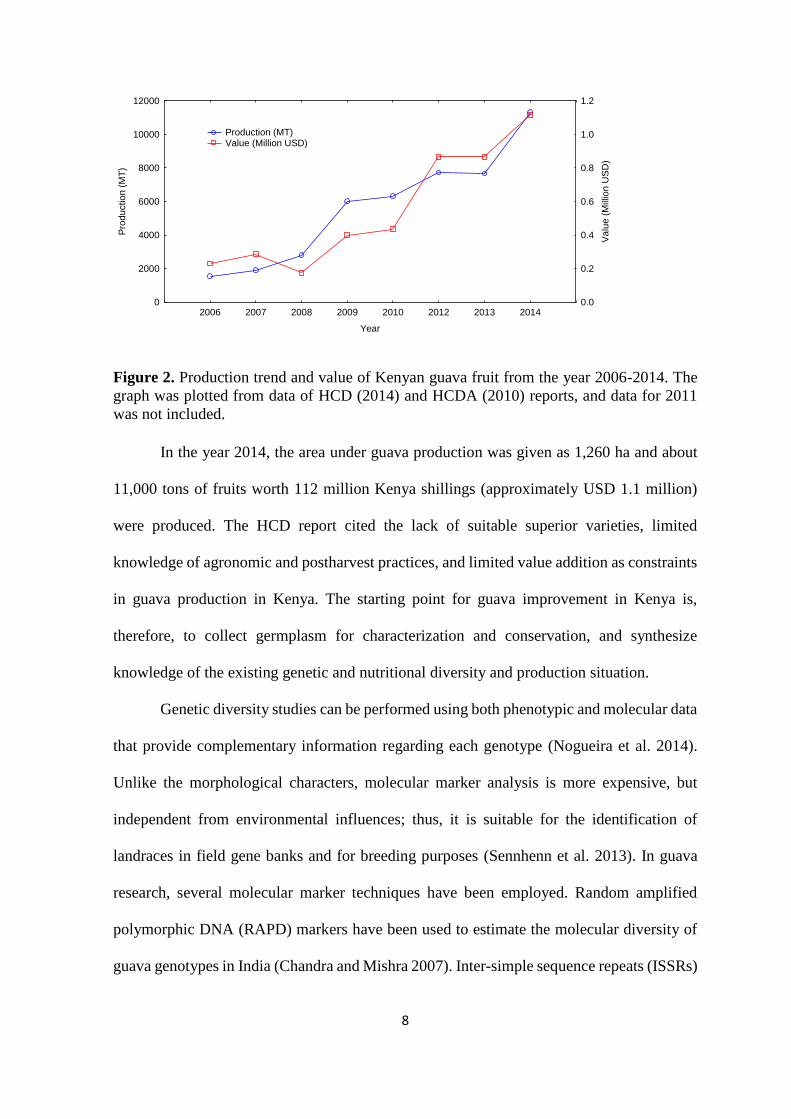
growing from seeds dispersed unintentionally. In spite of this, the HCD (2014) reported
increases in the acreage, production, productivity and value of Kenyan guava fruits over the
years (Figure 2).
8
2006 2007 2008 2009 2010 2012 2013 2014
Year
0
2000
4000
6000
8000
10000
12000
Pro
du
ctio
n (
MT
)
0.0
0.2
0.4
0.6
0.8
1.0
1.2
Va
lue
(M
illio
n U
SD
)
Production (MT) Value (Million USD)
Figure 2. Production trend and value of Kenyan guava fruit from the year 2006-2014. The
graph was plotted from data of HCD (2014) and HCDA (2010) reports, and data for 2011
was not included.
In the year 2014, the area under guava production was given as 1,260 ha and about
11,000 tons of fruits worth 112 million Kenya shillings (approximately USD 1.1 million)
were produced. The HCD report cited the lack of suitable superior varieties, limited
knowledge of agronomic and postharvest practices, and limited value addition as constraints
in guava production in Kenya. The starting point for guava improvement in Kenya is,
therefore, to collect germplasm for characterization and conservation, and synthesize
knowledge of the existing genetic and nutritional diversity and production situation.
Genetic diversity studies can be performed using both phenotypic and molecular data
that provide complementary information regarding each genotype (Nogueira et al. 2014).
Unlike the morphological characters, molecular marker analysis is more expensive, but
independent from environmental influences; thus, it is suitable for the identification of
landraces in field gene banks and for breeding purposes (Sennhenn et al. 2013). In guava
research, several molecular marker techniques have been employed. Random amplified
polymorphic DNA (RAPD) markers have been used to estimate the molecular diversity of
guava genotypes in India (Chandra and Mishra 2007). Inter-simple sequence repeats (ISSRs)

9
have been used to assess their association with the Vitamin C content in the Egyptian guava
genotypes (Youssef and Ibrahim 2016). Additionally, the ISSR markers have been used to
assess the genetic stability of micro-propagated guava (Liu and Yang 2012). Co-dominant
markers, such as simple sequence repeats (SSRs), have been used to study the genetic
diversity of guava in Cuba (Rodríguez et al. 2007), Mexico (Quiroz-Moreno et al. 2009) and
the United States (Sitther et al. 2014). SSRs have also been used for the mapping of
quantitative trait loci (QTLs) for vegetative and reproductive characters in guava (Rodríguez
et al. 2007).
The increasing prospect for the utilization of guava through commercialization,
particularly for processing and export, requires the use of a wide genetic base for selection
and breeding of most suitable varieties for different environments and purposes. Therefore,
to tap the genetic resource of this species, there is need to obtain knowledge on the existing
genotypes, their exact distribution within the countries agro-climatic zones, their level of
genetic diversity, nutritional value of their fruits and salinity tolerance of the genotypes.
This dissertation presents the findings of the three aims of our study. Chapter one
presents the genetic diversity of guava in Kenya based on SSR markers. Chapter two presents
the results of the nutritional and chemical diversity of guava fruit in relation to climatic, fruit
morphological traits and soil properties. In chapter three, genetically diverse accessions of
guava were tested for their level of salinity tolerance, and thus the implication for their
potential area of cultivation.
10
Chapter two
2. Genetic diversity of common guava in Kenya: an underutilized naturalized fruit
species
Abstract
Common guava (Psidium guajava L.) fruit has a significant nutritional and medicinal
potential besides its economic importance. Currently, the world guava fruit production is
based only on a few cultivars. It is not clear when guava was introduced in Kenya - but the
species is currently naturalized. There is no detailed study on guava diversity in Kenya to
enable a comparison with other guava producing countries for purposes of characterization
and improvement. Genetic diversity of 177 guava accessions collected in four regions of
Kenya (Coast, Eastern, Rift Valley and Western) was assessed using 13 simple sequence
repeat (SSR) markers. The neighbour-joining (NJ) phylogenetic tree revealed most
accessions generally clustering into multiple weakly supported groups. Only 46 out of 177
accessions were supported by bootstrap values above 50% and clustered in twenty two
groups, each comprising two or three individual accessions only. The principle coordinates
analysis (PCoA) did not reveal clear-cut clusters along geographic origins or fruit flesh
colour of the samples. The fixation index (FIS) was very high (FIS = 0.511) that could be due
to a high level of either inbreeding and/ or differentiation. The white-fleshed accessions were
clustered together with the red-fleshed types, indicative of some degree of genetic similarity,
but also pointing to a possibility of shared ancestry between them. For guava conservation,
selection and improvement in Kenya, we recommend sampling many individual accessions
covering the geographical range of the species.
11
2.1. Introduction
Common (also known as yellow or lemon) guava (Psidium guajava L.) is one of the
most important fruit crops domesticated in Mesoamerica and widely cultivated in the tropics
and some sub-tropical regions (Gautam et al. 2010; Rodríguez et al. 2010). The fruit is
consumed fresh and processed and is rich in several important nutrients. The fresh fruit pulp
is high in vitamins, particularly vitamin C, phosphorus, and potassium, as well as many
antioxidants and dietary fibres (Jiménez-Escrig et al. 2001; Lukmanji et al. 2008; Flores et
al. 2015). Furthermore, not only fruits, but leaves, flowers, roots and bark are traditionally
used also in medicine (Gutiérrez et al. 2008). In recent years, the guava fruit has gained
popularity in the international trade due to its nutritional value and the diversity of processed
products including jam, jelly, and juice (http://pdf.usaid.gov/pdf_docs/PA00KP1Z.pdf.
Accessed 30.11.2017).
There are probably more than 400 guava cultivars around the world, but only a few
are under common cultivation (Pommer and Murakami 2009). The cultivated cultivars are
widely diverse regarding tree size, bearing habit, and yield, as well as fruit size, shape,
ripening season and quality in terms of nutrient composition (Pommer and Murakami 2009;
Sharma et al. 2010). Irrespective of the morphological and chemical diversities observed in
these cultivars, several reports indicate that selection of the accessions was based on a few
traits considered important (Mehmood et al. 2013; Galli et al. 2015; Mehmood et al. 2015;
Valera-Montero et al. 2016), and, therefore, much of the variation is left untapped. This is
likely to lead to genetic vulnerability of the crop (Nogueira et al. 2014), especially with
respect to climate change.
With regard to Kenya, guava is found in all the agroecological regions apart from
very arid areas and highlands. It is however not clear when it was introduced in Kenya, but
has been naturalized and occurs in the wild and on farmer’s fields. Most guava fruits are
12
collected for home consumption, although lately fresh fruits could be found being marketed
in major Kenyan towns. According to the Horticultural Crops Directorate, HCD (2014), the
trees are mainly unattended, growing from seeds dispersed unintentionally. The HCD report
cited the lack of suitable superior varieties, limited knowledge of agronomic and postharvest
practices, and limited value addition as constraints in guava production in Kenya. The
starting point for guava improvement in Kenya is, therefore, to collect germplasm for
characterization and conservation, and synthesize knowledge of the existing genetic
diversity and production situation.
The objective was to analyse the genetic diversity and differentiation of guava
accessions collected in four different regions of Kenya. We hypothesized that due to diverse
range of agroecological conditions of guava, the accessions are highly differentiated. In
addition, white and red-fleshed accessions would cluster separately. Accurate knowledge of
the genetic diversity and the origin of the accessions would assist in the selection of parental
materials in breeding programmes. Such information will consequently eliminate the
possibility of redundant collection of identical individuals for conservation and
improvement, thereby enhancing cost effective use of land, space and time regarding field
gene bank establishment and breeding activities.
2.2. Materials and methods
2.2.1. Study site selection and sampling procedure
Four known major guava-producing regions in Kenya were selected for guava
sampling based on the horticulture-validated report data (HCD 2014). The sites for sampling
within these regions included Meru (Eastern region), Uasin-Gishu and Elgeyo-Marakwet
(Rift Valley region), Homabay, Siaya, Kakamega and Vihiga (Western region), and Kwale,
Kilifi, and Mombasa (Coastal region) (Figure 1). Most sampled trees were found on
individual farmer’s fields, but also one prison fruit farm and one commercial fruit farm were
13
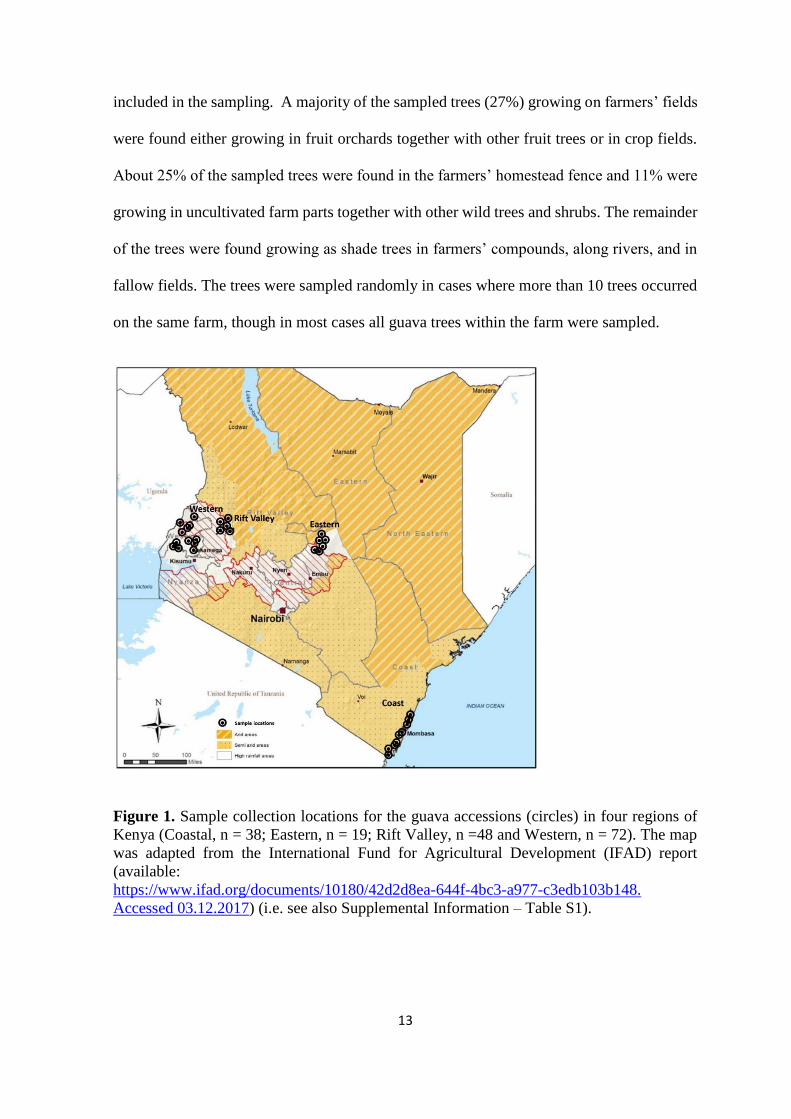
included in the sampling. A majority of the sampled trees (27%) growing on farmers’ fields
were found either growing in fruit orchards together with other fruit trees or in crop fields.
About 25% of the sampled trees were found in the farmers’ homestead fence and 11% were
growing in uncultivated farm parts together with other wild trees and shrubs. The remainder
of the trees were found growing as shade trees in farmers’ compounds, along rivers, and in
fallow fields. The trees were sampled randomly in cases where more than 10 trees occurred
on the same farm, though in most cases all guava trees within the farm were sampled.
Figure 1. Sample collection locations for the guava accessions (circles) in four regions of
Kenya (Coastal, n = 38; Eastern, n = 19; Rift Valley, n =48 and Western, n = 72). The map
was adapted from the International Fund for Agricultural Development (IFAD) report
(available:
https://www.ifad.org/documents/10180/42d2d8ea-644f-4bc3-a977-c3edb103b148.
Accessed 03.12.2017) (i.e. see also Supplemental Information – Table S1).
14
2.2.2. Leaf material sampling
Leaves from a total of 177 guava trees (here also referred to as accessions or sample)
were sampled (Supplemental Information - Table S1). At least five young fully developed
healthy leaves were picked at random from each of the 177 accessions (72 in Western, 48 in
Rift Valley, 38 in Coastal, and 19 in Eastern regions). The leaves were then briefly dried
under a shade in the field and placed in the sealable polythene bags containing silica gel for
complete drying and preservation. Afterwards, the leaf samples were taken to the laboratory
for DNA isolation and subsequent fragment analysis.
2.2.3. DNA isolation and quantification
Nuclear DNA from silica gel dried-leaf samples (about 300—500 mg) was extracted
using the DNeasy 96 Plant Kit (QIAGEN, Hilden, Germany). DNA quality and quantity
were checked on a 3% (w/v) agarose gel by comparing it with a known λ DNA concentration.
The stock DNA preps were diluted accordingly with molecular-grade water and then stored
at -20°C for eventual analyses.
2.2.4. Primer selection for polymerase chain reaction (PCR) amplification
We used the PCR primers that were previously designed for guava by Risterucci et
al. (2005) and had been proved successful in assessing guava diversity (Valdés-Infante et al.
2010; Sitther et al. 2014). We tested 20 primer pairs used by Risterucci et al. (2005) and
selected the best 13, which were also good for multiplexing. The primers were labelled with
fluorescent dyes; and those primers that amplified alleles with non-overlapping fragment
lengths were pooled to save on the PCR cost and time (Supplemental Information - Table
S2). Table S2 also shows the allele size ranges in base pairs (bp) observed for each primer
pair in our guava accessions.
The PCR amplification was conducted in a 14 µL volume containing 1 µL of
genomic DNA (20 ng/µL), 1.5 µL PCR buffer (0.8 M Tris–HCl pH 9.0, 0.2 M [NH4]2SO4,
15
0.2% w/v Tween-20; Solis BioDyne, Tartu, Estonia), 1.5 µL MgCl2, 1 µL dNTPs, 2 µL
fluorescent dye-labelled forward and reverse primers, 0.2 µL Taq DNA polymerase (HOT
FIREPol DNA Polymerase, Solis BioDyne, Tartu, Estonia), and 6.8 µL distilled water. The
amplification procedure included an initial denaturation step of 95°C for 15 min followed
by 35 cycles of 94°C for 1 min (denaturation), 50°C for 1 min (annealing), 72°C for 1 min
(extension), and a final extension step of 72°C for 20 min. The PCR reactions were
conducted in a T-Professional thermocycler (Biometra, Analytik Jena, Germany).
In preparation for fragment analysis, the PCR products were diluted with water in a
ratio of 1:100. Next, 2 µL of the diluted PCR product comprising of 12 µL of Hi-Di
formamide and 0.6 µL of internal size standard Genescan 500 Rox (Applied Biosystems
Inc.) was denatured at 95°C for 3 min in a thermocycler. The fragments were then analysed
in an ABI 3130xl Genetic Analyzer (Applied Biosystems, Waltham, MA USA). The sizes
of the microsatellite fragments were determined, and the microsatellite loci were genotyped
using the GeneMapper software v. 4.0 (Applied Biosystems Inc.).
2.3. Data analysis
The number of alleles per locus (Na), observed (Ho) and expected (He)
heterozygosities were computed using the GenAlEx 6.5 software (Peakall and Smouse
2012). The duplicates were checked by multi-locus matching. The fixation index (FIS) in the
entire sample was computed following the definition of Wright (1965) using Genepop
software v 4.0 (Rousset 2008). Nei’s chord distance (1983) matrix between accessions was
generated using microsatellite analyser (Dieringer and Schlötterer 2003) with 10,000
bootstrappings. The distances were then used to generate a phylogenetic tree using the
neighbour-joining (NJ) method of clustering (Saitou and Nei 1987) available in PHYLIP
(Felsenstein 1993), which was visualized using the Geneious software v. 10.1.3.
(www.geneious.com; Kearse et al. (2012).
16
A PCoA with covariance standardization available in GenAlEx 6.5 was used to
determine the spatial distribution of the samples based on their genetic distances. Moreover,
AMOVA was performed from a triangular distance matrix with 1000 permutations to
quantify genetic variation within and among regions. The SSR data was also subjected to a
Bayesian cluster analysis using the STRUCTURE software v. 2.3.2 (Pritchard et al. 2000)
in order to infer the most likely number of subpopulations or groups (clusters) in the sample.
The admixture model was applied without assigning individual trees to particular groups or
geographic regions a priori; and the samples were tested for number of potential clusters (K)
ranging from 1 to 10. Ten runs per each K were performed, each consisting of a burn-in of
100,000, followed by 1,000,000 Monte Carlo Markov Chain iterations. The ∆K value
approach (Evanno et al. 2005) was used to determine the most probable number of clusters
using the STRUCTURE Harvester program (Earl and von Holdt 2012).
2.4. Results
All the PCR primers were able to generate fragments in all our samples, and all the
amplified alleles were polymorphic. No samples with genotypes identical for all markers
(supposedly duplicates) were found in the collected 177 guava accessions. The 13 primer
pairs amplified 84 alleles in the studied guava accessions in total. The highest number of
alleles (13) was found in locus mPgCIR10, while the least number of alleles (four) – in loci
mPgCIR08, mPgCIR11, mPgCIR13 and mPgCIR21. The expected heterozygosity (He)
values ranged from 0.507 to 0.843 with an average of 0.630, while the observed
heterozygosity (Ho) values ranged from 0.192 to 0.497 with an average of 0.312. The fixation
index (FIS) among the accessions for the entire sample ranged from 0.410 to 0.621 for
different markers with an average of 0.511 (Table 1).
17
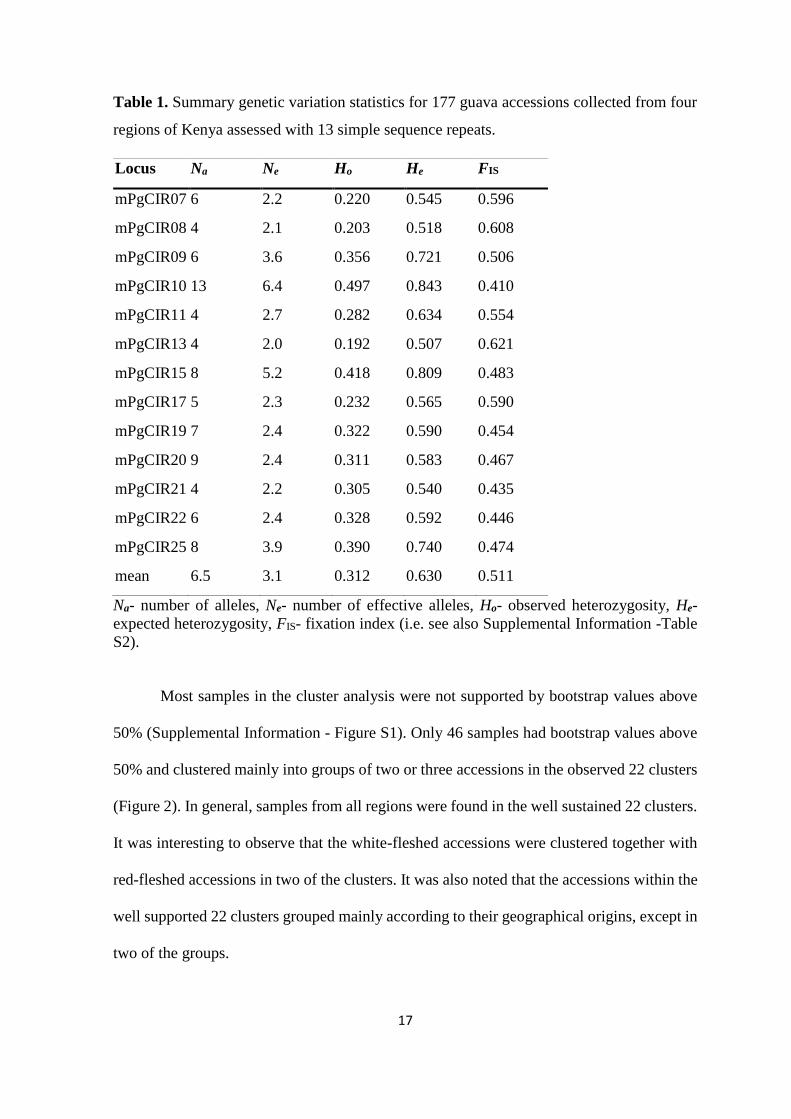
Table 1. Summary genetic variation statistics for 177 guava accessions collected from four
regions of Kenya assessed with 13 simple sequence repeats.
Locus Na Ne Ho He FIS
mPgCIR07 6 2.2 0.220 0.545 0.596
mPgCIR08 4 2.1 0.203 0.518 0.608
mPgCIR09 6 3.6 0.356 0.721 0.506
mPgCIR10 13 6.4 0.497 0.843 0.410
mPgCIR11 4 2.7 0.282 0.634 0.554
mPgCIR13 4 2.0 0.192 0.507 0.621
mPgCIR15 8 5.2 0.418 0.809 0.483
mPgCIR17 5 2.3 0.232 0.565 0.590
mPgCIR19 7 2.4 0.322 0.590 0.454
mPgCIR20 9 2.4 0.311 0.583 0.467
mPgCIR21 4 2.2 0.305 0.540 0.435
mPgCIR22 6 2.4 0.328 0.592 0.446
mPgCIR25 8 3.9 0.390 0.740 0.474
mean 6.5 3.1 0.312 0.630 0.511
Na- number of alleles, Ne- number of effective alleles, Ho- observed heterozygosity, He-
expected heterozygosity, FIS- fixation index (i.e. see also Supplemental Information -Table
S2).
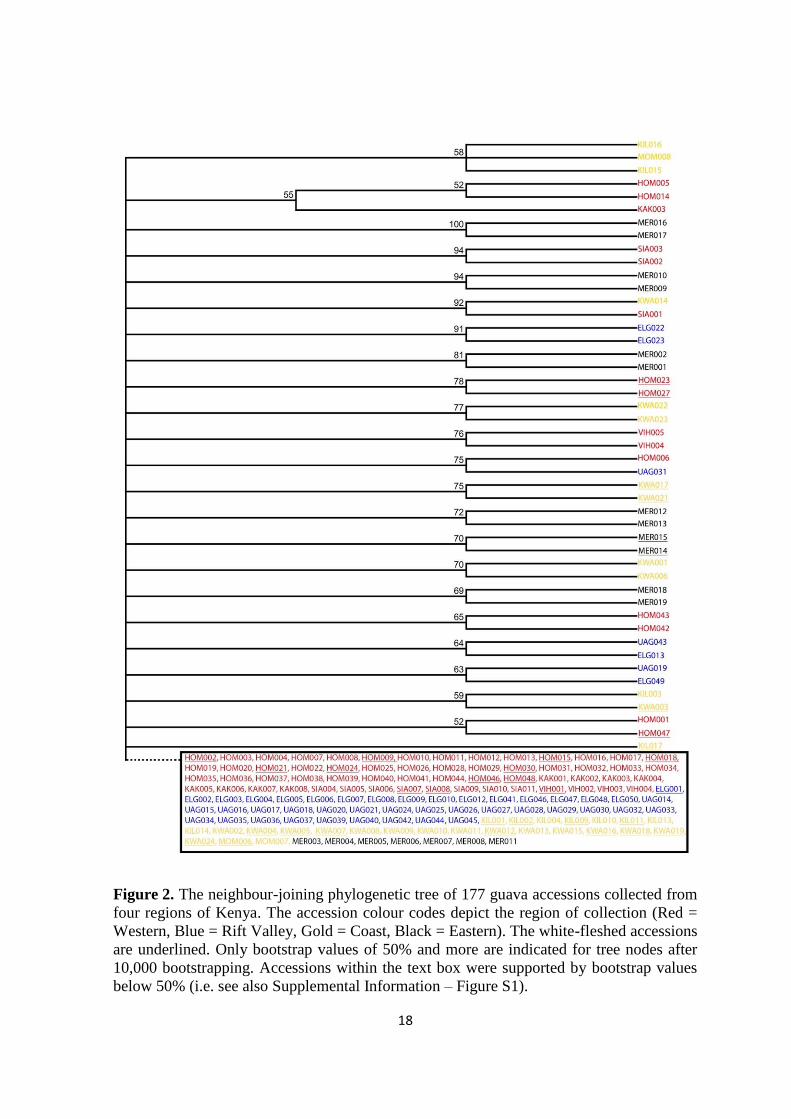
Most samples in the cluster analysis were not supported by bootstrap values above
50% (Supplemental Information - Figure S1). Only 46 samples had bootstrap values above
50% and clustered mainly into groups of two or three accessions in the observed 22 clusters
(Figure 2). In general, samples from all regions were found in the well sustained 22 clusters.
It was interesting to observe that the white-fleshed accessions were clustered together with
red-fleshed accessions in two of the clusters. It was also noted that the accessions within the
well supported 22 clusters grouped mainly according to their geographical origins, except in
two of the groups.
18
Figure 2. The neighbour-joining phylogenetic tree of 177 guava accessions collected from
four regions of Kenya. The accession colour codes depict the region of collection (Red =
Western, Blue = Rift Valley, Gold = Coast, Black = Eastern). The white-fleshed accessions
are underlined. Only bootstrap values of 50% and more are indicated for tree nodes after
10,000 bootstrapping. Accessions within the text box were supported by bootstrap values
below 50% (i.e. see also Supplemental Information – Figure S1).
19
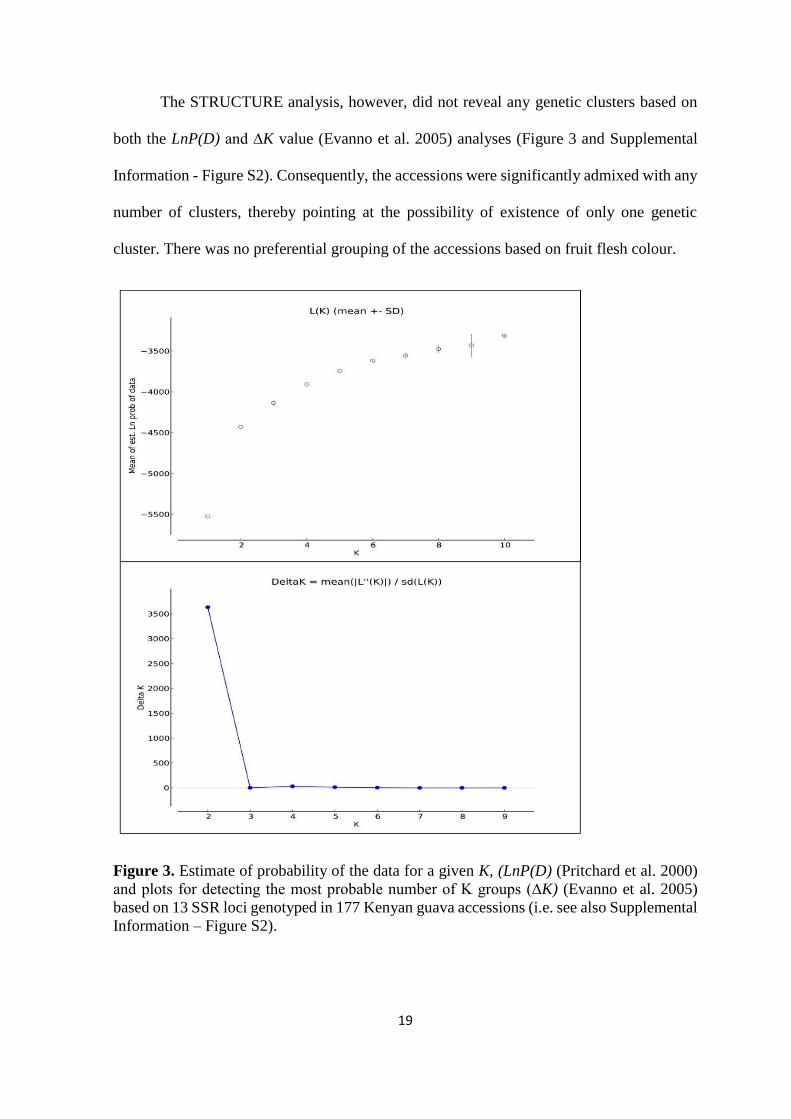
The STRUCTURE analysis, however, did not reveal any genetic clusters based on
both the LnP(D) and ∆K value (Evanno et al. 2005) analyses (Figure 3 and Supplemental
Information - Figure S2). Consequently, the accessions were significantly admixed with any
number of clusters, thereby pointing at the possibility of existence of only one genetic
cluster. There was no preferential grouping of the accessions based on fruit flesh colour.
Figure 3. Estimate of probability of the data for a given K, (LnP(D) (Pritchard et al. 2000)
and plots for detecting the most probable number of K groups (∆K) (Evanno et al. 2005)
based on 13 SSR loci genotyped in 177 Kenyan guava accessions (i.e. see also Supplemental
Information – Figure S2).
20
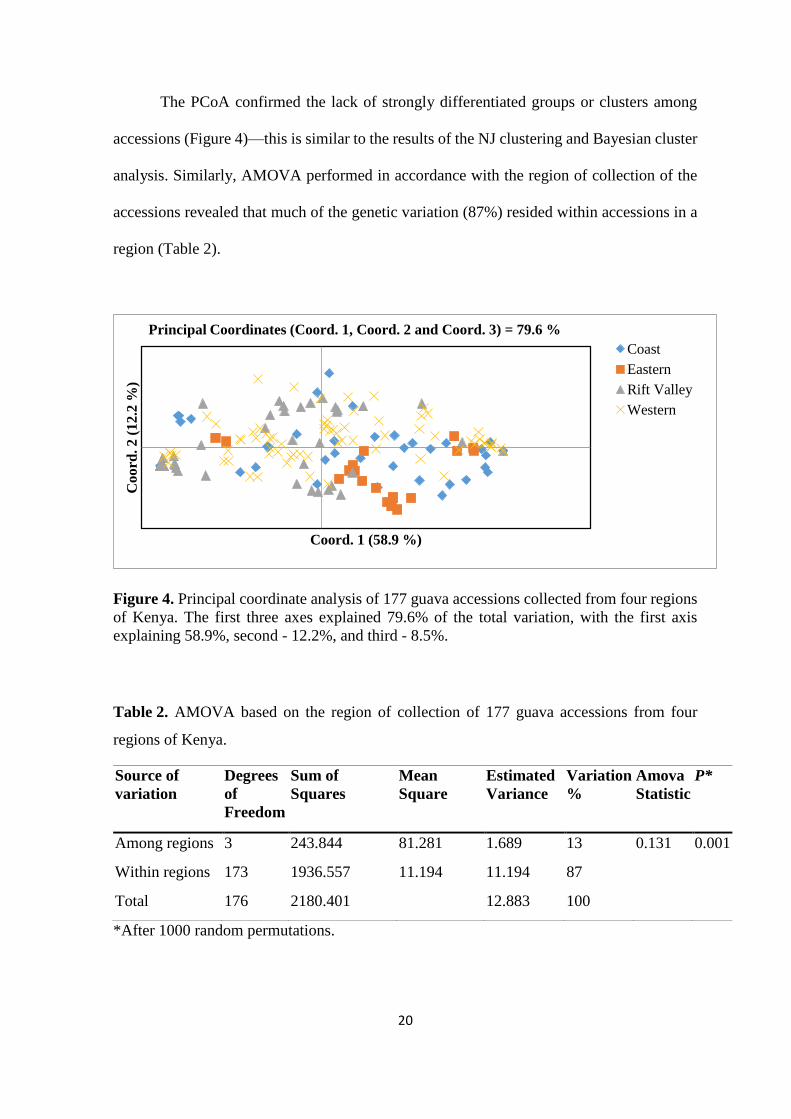
The PCoA confirmed the lack of strongly differentiated groups or clusters among
accessions (Figure 4)—this is similar to the results of the NJ clustering and Bayesian cluster
analysis. Similarly, AMOVA performed in accordance with the region of collection of the
accessions revealed that much of the genetic variation (87%) resided within accessions in a
region (Table 2).
Figure 4. Principal coordinate analysis of 177 guava accessions collected from four regions
of Kenya. The first three axes explained 79.6% of the total variation, with the first axis
explaining 58.9%, second - 12.2%, and third - 8.5%.
Table 2. AMOVA based on the region of collection of 177 guava accessions from four
regions of Kenya.
Source of
variation
Degrees
of
Freedom
Sum of
Squares
Mean
Square
Estimated
Variance
Variation
%
Amova
Statistic
P*
Among regions 3 243.844 81.281 1.689 13 0.131 0.001
Within regions 173 1936.557 11.194 11.194 87
Total 176 2180.401
12.883 100
*After 1000 random permutations.
Coord
. 2 (
12
.2 %
)
Coord. 1 (58.9 %)
Principal Coordinates (Coord. 1, Coord. 2 and Coord. 3) = 79.6 %
Coast
Eastern
Rift Valley
Western
21
2.5. Discussion
The comparison of the Kenyan guava germplasm multilocus SSR genotypes revealed
no identical or duplicate accessions; therefore, each accession was genetically distinct from
the others. The low levels of observed heterozygosity (mean = 0.312) with respect to
expected heterozygosity (mean = 0.630) likely indicates a high level of genetic
differentiation between accessions within identified groups, including those that existed
within the same geographical locations. Similar results were also reported using SSR
markers by Sitther et al. (2014), where the observed and expected heterozygosities were 0.2
and 0.7 on the average, respectively, in the guava germplasm found in the United States. The
expected heterozygosity was even much higher and varied between 0.392 and 0.961 with an
average of 0.824 in the Indian guava based on the SSR genotypes (Kanupriya et al. 2011),
while a much lower expected heterozygosity ranging from 0.027 to 0.172 with an average
of 0.085, was found in the Pakistan guava germplasm also based on the SSR markers
(Mehmood et al. 2015). Similarly, low to moderate levels of expected heterozygosity (0.057
to 0.568) were detected in the Cuban guava germplasm using microsatellites (Rodríguez et
al. 2007). The differences in the heterozygosity indices in the aforementioned studies were
attributed to the high inbreeding and a possibility of cross incompatibility occurring in
guava. The difference in the diversity among the mentioned studies, however, could be also
due to the different microsatellite loci used (Pommer and Murakami 2009), but it is more
likely that they were accession or sample specific (Belaj et al. 2003).
The average fixation index in our study was 0.511 (Table 1), implying a high genetic
substructure within our guava accessions or a high inbreeding rate. The Myrtaceae flower
has been reported to be hermaphrodite, which increases the possibility of selfing
(Grattapaglia et al. 2012). Nakasone and Paull (1998) estimated the outcrossing rate as only
35-40% in Psidium guajava, which is in agreement with our results. In contrast, very high
22
inbreeding coefficients of 0.8 and 0.85 have been reported in the SSR studies by Sitther et
al. (2014) and Mehmood et al. (2015), respectively. These very high values of an average
inbreeding coefficient point at the possibility of cross-incompatibility, which may hinder the
effectiveness of creating true hybrids and recombining favourable alleles from parental
clones in guava as reported by Mehmood et al. (2015).
Based on the NJ phylogenetic tree, some of the Kenyan guava accessions mainly
from one region were well supported by bootstrap values above 50% and grouped together
in clusters of two or three individuals (Fig. 2); although accessions from all the regions could
be found together in different small genetic clusters when lower than 50% bootstrap values
were considered (Supplemental Information - Figure S1). The PCoA, however, depicted an
overlap between these clusters and groups that was also supported by the observed
genetically admixed individuals based on the Bayesian clustering implemented in the
STRUCTURE software. This implies that some accessions are very similar and can form
genetic groups, while others are genetically distinct and admixed irrespective of their
existence within the same geographical environment. This high intra-regional genetic
heterogeneity was also supported by results of the AMOVA (Table 2). Population structure
is as a result of geographic adaptation and natural selection (Lehermeier et al. 2015). Thus
we expected that many individual guava accessions from one region rather than just two or
three would cluster together and form distinct groups based on their geographic origin, which
was not the case in our study. The lack of a robust sub-structuring in the Kenyan guava
accessions could therefore be attributed to the high inbreeding as reported in other studies
(Nakasone and Paull 1998) and plant material (seeds and seedlings) transfer across different
regions.
The white-fleshed guava accessions were found in groups together with the red-
fleshed types in the NJ phylogenetic tree. Therefore, the expectation based on previous
23
studies (Chen et al. 2007; Kanupriya et al. 2011) that all the white-fleshed accessions would
be clustered in the same one group was not confirmed in our study. Moreover, grouping
white- together with the red-fleshed types could be due to a shared ancestry of these
accessions at some point in time, as supported by the Bayesian clustering in our study.
However, the possibility of sympatric speciation cannot be ruled out in the Kenyan guava
germplasm, especially when few accessions with similar flesh colour cluster together with
higher bootstrap values. In a related study, Chen et al. (2007) identified two genetic groups
based on RAPD markers. The commercial and wild genotypes of guava were clustered
separately in their study, possibly depicting selection pressure on the traits of interest for the
commercial group. The latter group included two subgroups, which roughly clustered white-
and red-fleshed guavas separately. In Bajpai et al. (2008), 22 guava genotypes were clustered
according to their regions of origin based on the RAPD and directed amplification of
minisatellite DNA (DAMD) markers. Additionally, molecular data allowed Coser et al.
(2012) and Nogueira et al. (2014) to cluster most genotypes in accordance with their origins
in Brazil. Notably, although the genotypes were registered as cultivars having been highly
selected based on production quality traits, but they still clustered according to the initial
parental material origin with minimal segregation (Coser et al. 2012). In the Indian guava
germplasm, the pink flesh cultivars were reported to group separately from those with white
flesh (Kanupriya et al. 2011), probably pointing at their distinct evolutionary pathways.
Initial efforts to improve guava production in Kenya have only concentrated on the
conservation of the available germplasm through collection based on morphological
attributes such as leaf shape or fruit flesh colour, among others. A few of these genotypes
collected from various regions of the country have been conserved at the Kenya Agricultural
and Livestock Research Organization (KALRO). Therefore, guava farmers in Kenya rely on
the genetic variation existing in the wild populations on their farms and probably on limited
24
exchange of some genotypes they consider superior for production and quality traits between
individual farmers.
2.6. Conclusion
In conclusion, the SSRs markers were able to distinguish among the Kenyan guava
accessions. Much of the genetic variation resided within individual accessions found in
different geographical locations of the country, and therefore we reject the hypothesis that
the accessions would cluster according to their agroecological environments. In addition, the
white-fleshed guava accessions clustered together with the red-fleshed guava accessions,
hence suggesting a shared ancestry. Therefore, we recommend that sampling for
conservation and improvement should aim at including trees from different regions as well
as covering the full ecological range of the species. This data also forms a basis for
comparison of guava genetic diversity studies with other guava producing countries, and
therefore joint research aimed at guava improvement could be initiated.
25
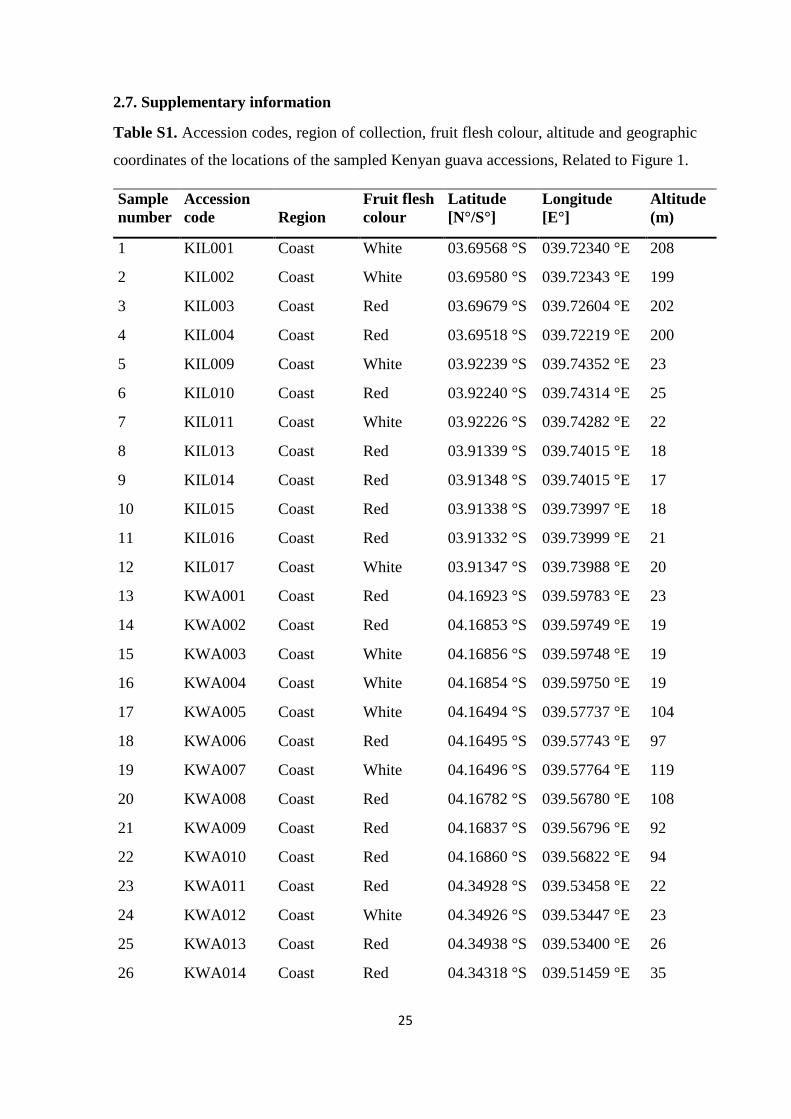
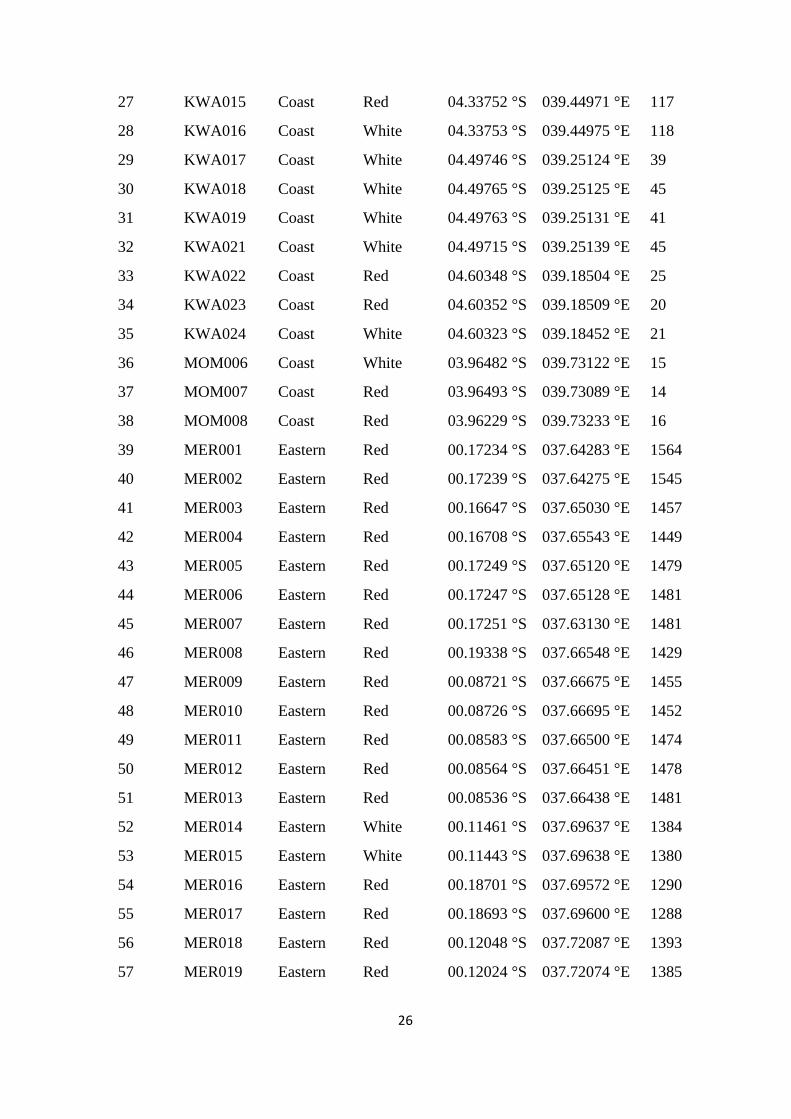
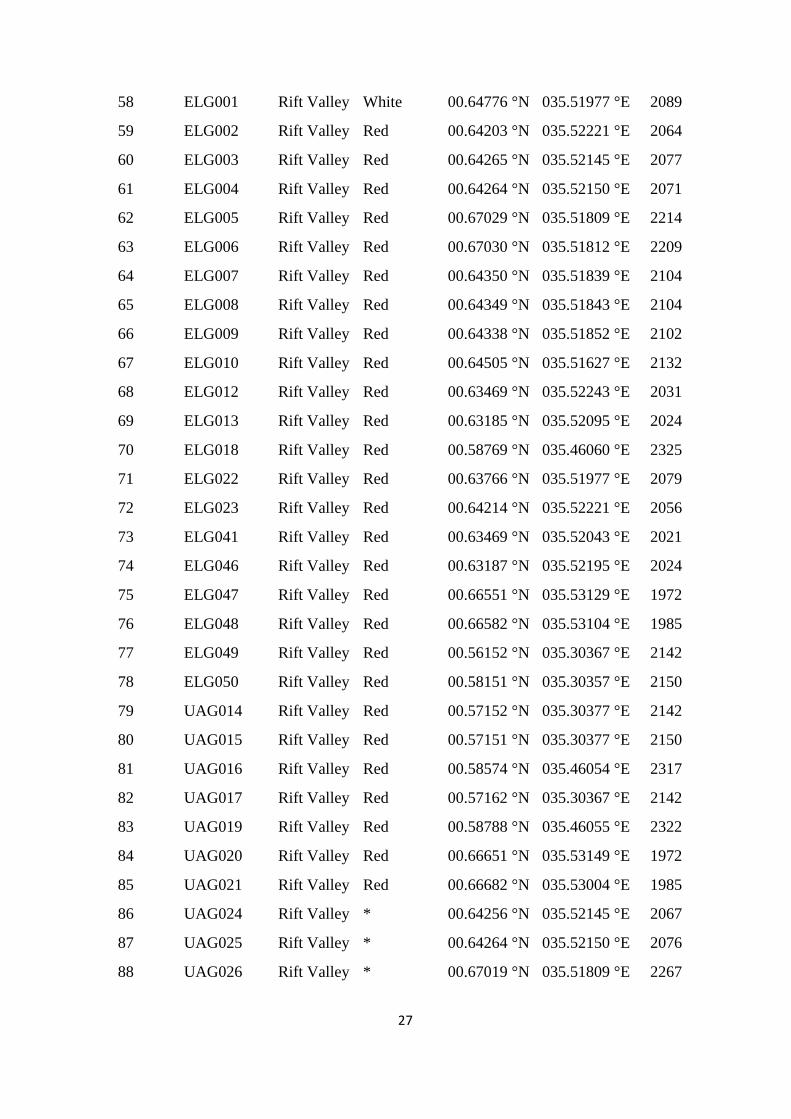
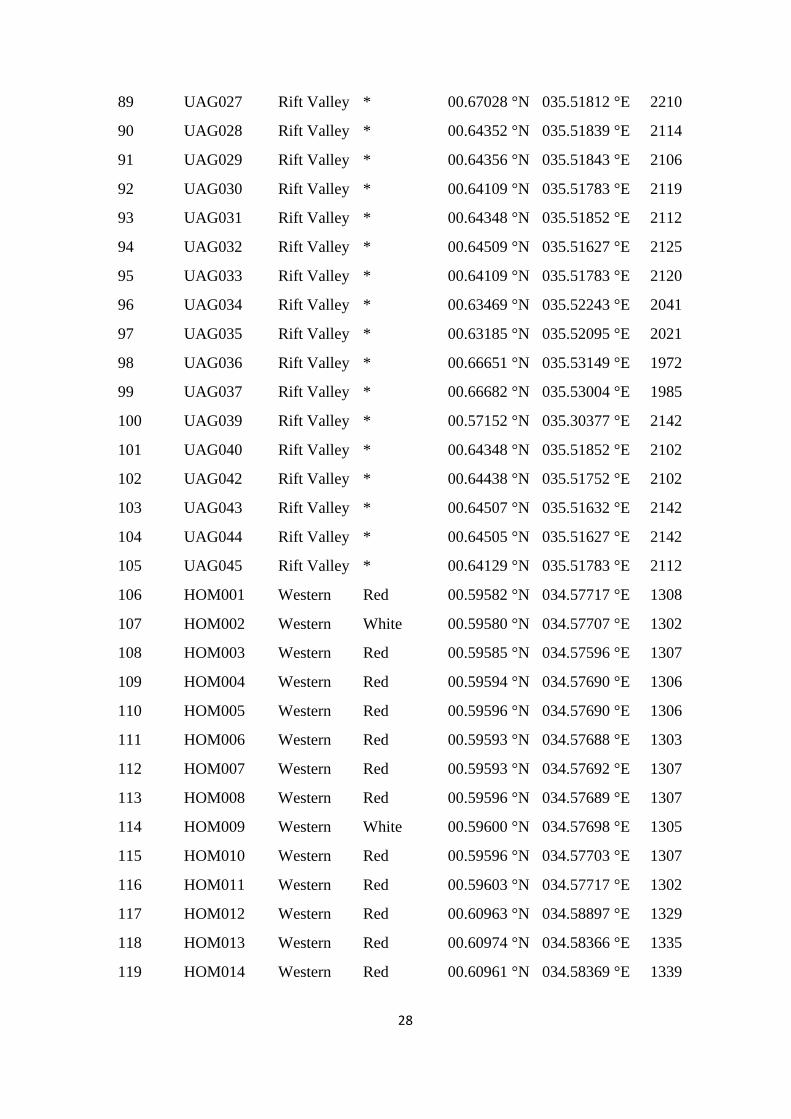
2.7. Supplementary information
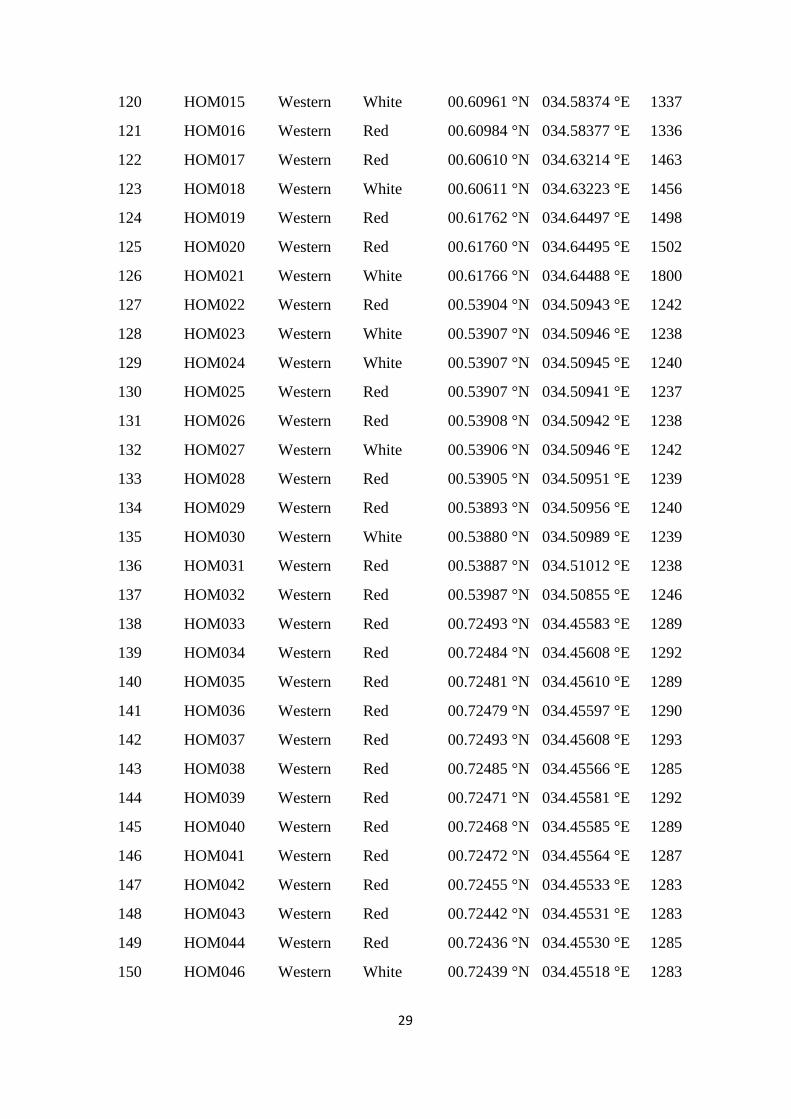
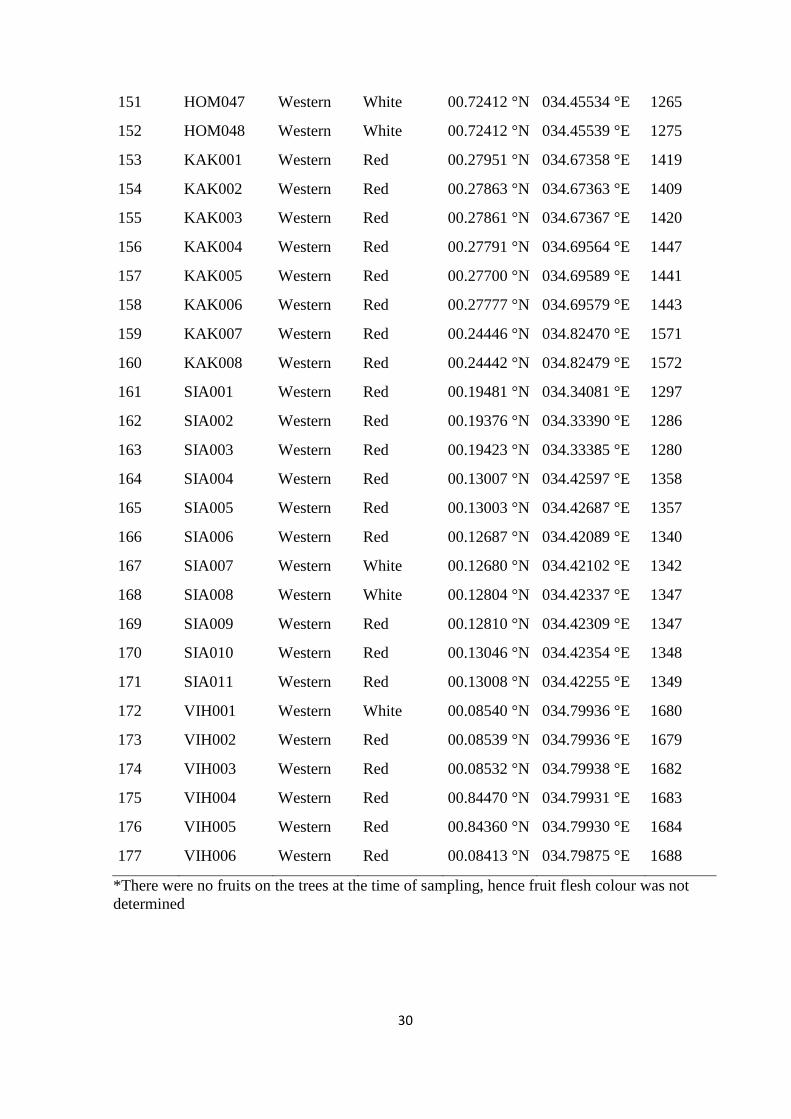
Table S1. Accession codes, region of collection, fruit flesh colour, altitude and geographic
coordinates of the locations of the sampled Kenyan guava accessions, Related to Figure 1.
Sample
number
Accession
code Region
Fruit flesh
colour
Latitude
[N°/S°]
Longitude
[E°]
Altitude
(m)
1 KIL001 Coast White 03.69568 °S 039.72340 °E 208
2 KIL002 Coast White 03.69580 °S 039.72343 °E 199
3 KIL003 Coast Red 03.69679 °S 039.72604 °E 202
4 KIL004 Coast Red 03.69518 °S 039.72219 °E 200
5 KIL009 Coast White 03.92239 °S 039.74352 °E 23
6 KIL010 Coast Red 03.92240 °S 039.74314 °E 25
7 KIL011 Coast White 03.92226 °S 039.74282 °E 22
8 KIL013 Coast Red 03.91339 °S 039.74015 °E 18
9 KIL014 Coast Red 03.91348 °S 039.74015 °E 17
10 KIL015 Coast Red 03.91338 °S 039.73997 °E 18
11 KIL016 Coast Red 03.91332 °S 039.73999 °E 21
12 KIL017 Coast White 03.91347 °S 039.73988 °E 20
13 KWA001 Coast Red 04.16923 °S 039.59783 °E 23
14 KWA002 Coast Red 04.16853 °S 039.59749 °E 19
15 KWA003 Coast White 04.16856 °S 039.59748 °E 19
16 KWA004 Coast White 04.16854 °S 039.59750 °E 19
17 KWA005 Coast White 04.16494 °S 039.57737 °E 104
18 KWA006 Coast Red 04.16495 °S 039.57743 °E 97
19 KWA007 Coast White 04.16496 °S 039.57764 °E 119
20 KWA008 Coast Red 04.16782 °S 039.56780 °E 108
21 KWA009 Coast Red 04.16837 °S 039.56796 °E 92
22 KWA010 Coast Red 04.16860 °S 039.56822 °E 94
23 KWA011 Coast Red 04.34928 °S 039.53458 °E 22
24 KWA012 Coast White 04.34926 °S 039.53447 °E 23
25 KWA013 Coast Red 04.34938 °S 039.53400 °E 26
26 KWA014 Coast Red 04.34318 °S 039.51459 °E 35
26
27 KWA015 Coast Red 04.33752 °S 039.44971 °E 117
28 KWA016 Coast White 04.33753 °S 039.44975 °E 118
29 KWA017 Coast White 04.49746 °S 039.25124 °E 39
30 KWA018 Coast White 04.49765 °S 039.25125 °E 45
31 KWA019 Coast White 04.49763 °S 039.25131 °E 41
32 KWA021 Coast White 04.49715 °S 039.25139 °E 45
33 KWA022 Coast Red 04.60348 °S 039.18504 °E 25
34 KWA023 Coast Red 04.60352 °S 039.18509 °E 20
35 KWA024 Coast White 04.60323 °S 039.18452 °E 21
36 MOM006 Coast White 03.96482 °S 039.73122 °E 15
37 MOM007 Coast Red 03.96493 °S 039.73089 °E 14
38 MOM008 Coast Red 03.96229 °S 039.73233 °E 16
39 MER001 Eastern Red 00.17234 °S 037.64283 °E 1564
40 MER002 Eastern Red 00.17239 °S 037.64275 °E 1545
41 MER003 Eastern Red 00.16647 °S 037.65030 °E 1457
42 MER004 Eastern Red 00.16708 °S 037.65543 °E 1449
43 MER005 Eastern Red 00.17249 °S 037.65120 °E 1479
44 MER006 Eastern Red 00.17247 °S 037.65128 °E 1481
45 MER007 Eastern Red 00.17251 °S 037.63130 °E 1481
46 MER008 Eastern Red 00.19338 °S 037.66548 °E 1429
47 MER009 Eastern Red 00.08721 °S 037.66675 °E 1455
48 MER010 Eastern Red 00.08726 °S 037.66695 °E 1452
49 MER011 Eastern Red 00.08583 °S 037.66500 °E 1474
50 MER012 Eastern Red 00.08564 °S 037.66451 °E 1478
51 MER013 Eastern Red 00.08536 °S 037.66438 °E 1481
52 MER014 Eastern White 00.11461 °S 037.69637 °E 1384
53 MER015 Eastern White 00.11443 °S 037.69638 °E 1380
54 MER016 Eastern Red 00.18701 °S 037.69572 °E 1290
55 MER017 Eastern Red 00.18693 °S 037.69600 °E 1288
56 MER018 Eastern Red 00.12048 °S 037.72087 °E 1393
57 MER019 Eastern Red 00.12024 °S 037.72074 °E 1385
27
58 ELG001 Rift Valley White 00.64776 °N 035.51977 °E 2089
59 ELG002 Rift Valley Red 00.64203 °N 035.52221 °E 2064
60 ELG003 Rift Valley Red 00.64265 °N 035.52145 °E 2077
61 ELG004 Rift Valley Red 00.64264 °N 035.52150 °E 2071
62 ELG005 Rift Valley Red 00.67029 °N 035.51809 °E 2214
63 ELG006 Rift Valley Red 00.67030 °N 035.51812 °E 2209
64 ELG007 Rift Valley Red 00.64350 °N 035.51839 °E 2104
65 ELG008 Rift Valley Red 00.64349 °N 035.51843 °E 2104
66 ELG009 Rift Valley Red 00.64338 °N 035.51852 °E 2102
67 ELG010 Rift Valley Red 00.64505 °N 035.51627 °E 2132
68 ELG012 Rift Valley Red 00.63469 °N 035.52243 °E 2031
69 ELG013 Rift Valley Red 00.63185 °N 035.52095 °E 2024
70 ELG018 Rift Valley Red 00.58769 °N 035.46060 °E 2325
71 ELG022 Rift Valley Red 00.63766 °N 035.51977 °E 2079
72 ELG023 Rift Valley Red 00.64214 °N 035.52221 °E 2056
73 ELG041 Rift Valley Red 00.63469 °N 035.52043 °E 2021
74 ELG046 Rift Valley Red 00.63187 °N 035.52195 °E 2024
75 ELG047 Rift Valley Red 00.66551 °N 035.53129 °E 1972
76 ELG048 Rift Valley Red 00.66582 °N 035.53104 °E 1985
77 ELG049 Rift Valley Red 00.56152 °N 035.30367 °E 2142
78 ELG050 Rift Valley Red 00.58151 °N 035.30357 °E 2150
79 UAG014 Rift Valley Red 00.57152 °N 035.30377 °E 2142
80 UAG015 Rift Valley Red 00.57151 °N 035.30377 °E 2150
81 UAG016 Rift Valley Red 00.58574 °N 035.46054 °E 2317
82 UAG017 Rift Valley Red 00.57162 °N 035.30367 °E 2142
83 UAG019 Rift Valley Red 00.58788 °N 035.46055 °E 2322
84 UAG020 Rift Valley Red 00.66651 °N 035.53149 °E 1972
85 UAG021 Rift Valley Red 00.66682 °N 035.53004 °E 1985
86 UAG024 Rift Valley * 00.64256 °N 035.52145 °E 2067
87 UAG025 Rift Valley * 00.64264 °N 035.52150 °E 2076
88 UAG026 Rift Valley * 00.67019 °N 035.51809 °E 2267
28
89 UAG027 Rift Valley * 00.67028 °N 035.51812 °E 2210
90 UAG028 Rift Valley * 00.64352 °N 035.51839 °E 2114
91 UAG029 Rift Valley * 00.64356 °N 035.51843 °E 2106
92 UAG030 Rift Valley * 00.64109 °N 035.51783 °E 2119
93 UAG031 Rift Valley * 00.64348 °N 035.51852 °E 2112
94 UAG032 Rift Valley * 00.64509 °N 035.51627 °E 2125
95 UAG033 Rift Valley * 00.64109 °N 035.51783 °E 2120
96 UAG034 Rift Valley * 00.63469 °N 035.52243 °E 2041
97 UAG035 Rift Valley * 00.63185 °N 035.52095 °E 2021
98 UAG036 Rift Valley * 00.66651 °N 035.53149 °E 1972
99 UAG037 Rift Valley * 00.66682 °N 035.53004 °E 1985
100 UAG039 Rift Valley * 00.57152 °N 035.30377 °E 2142
101 UAG040 Rift Valley * 00.64348 °N 035.51852 °E 2102
102 UAG042 Rift Valley * 00.64438 °N 035.51752 °E 2102
103 UAG043 Rift Valley * 00.64507 °N 035.51632 °E 2142
104 UAG044 Rift Valley * 00.64505 °N 035.51627 °E 2142
105 UAG045 Rift Valley * 00.64129 °N 035.51783 °E 2112
106 HOM001 Western Red 00.59582 °N 034.57717 °E 1308
107 HOM002 Western White 00.59580 °N 034.57707 °E 1302
108 HOM003 Western Red 00.59585 °N 034.57596 °E 1307
109 HOM004 Western Red 00.59594 °N 034.57690 °E 1306
110 HOM005 Western Red 00.59596 °N 034.57690 °E 1306
111 HOM006 Western Red 00.59593 °N 034.57688 °E 1303
112 HOM007 Western Red 00.59593 °N 034.57692 °E 1307
113 HOM008 Western Red 00.59596 °N 034.57689 °E 1307
114 HOM009 Western White 00.59600 °N 034.57698 °E 1305
115 HOM010 Western Red 00.59596 °N 034.57703 °E 1307
116 HOM011 Western Red 00.59603 °N 034.57717 °E 1302
117 HOM012 Western Red 00.60963 °N 034.58897 °E 1329
118 HOM013 Western Red 00.60974 °N 034.58366 °E 1335
119 HOM014 Western Red 00.60961 °N 034.58369 °E 1339
29
120 HOM015 Western White 00.60961 °N 034.58374 °E 1337
121 HOM016 Western Red 00.60984 °N 034.58377 °E 1336
122 HOM017 Western Red 00.60610 °N 034.63214 °E 1463
123 HOM018 Western White 00.60611 °N 034.63223 °E 1456
124 HOM019 Western Red 00.61762 °N 034.64497 °E 1498
125 HOM020 Western Red 00.61760 °N 034.64495 °E 1502
126 HOM021 Western White 00.61766 °N 034.64488 °E 1800
127 HOM022 Western Red 00.53904 °N 034.50943 °E 1242
128 HOM023 Western White 00.53907 °N 034.50946 °E 1238
129 HOM024 Western White 00.53907 °N 034.50945 °E 1240
130 HOM025 Western Red 00.53907 °N 034.50941 °E 1237
131 HOM026 Western Red 00.53908 °N 034.50942 °E 1238
132 HOM027 Western White 00.53906 °N 034.50946 °E 1242
133 HOM028 Western Red 00.53905 °N 034.50951 °E 1239
134 HOM029 Western Red 00.53893 °N 034.50956 °E 1240
135 HOM030 Western White 00.53880 °N 034.50989 °E 1239
136 HOM031 Western Red 00.53887 °N 034.51012 °E 1238
137 HOM032 Western Red 00.53987 °N 034.50855 °E 1246
138 HOM033 Western Red 00.72493 °N 034.45583 °E 1289
139 HOM034 Western Red 00.72484 °N 034.45608 °E 1292
140 HOM035 Western Red 00.72481 °N 034.45610 °E 1289
141 HOM036 Western Red 00.72479 °N 034.45597 °E 1290
142 HOM037 Western Red 00.72493 °N 034.45608 °E 1293
143 HOM038 Western Red 00.72485 °N 034.45566 °E 1285
144 HOM039 Western Red 00.72471 °N 034.45581 °E 1292
145 HOM040 Western Red 00.72468 °N 034.45585 °E 1289
146 HOM041 Western Red 00.72472 °N 034.45564 °E 1287
147 HOM042 Western Red 00.72455 °N 034.45533 °E 1283
148 HOM043 Western Red 00.72442 °N 034.45531 °E 1283
149 HOM044 Western Red 00.72436 °N 034.45530 °E 1285
150 HOM046 Western White 00.72439 °N 034.45518 °E 1283
30
151 HOM047 Western White 00.72412 °N 034.45534 °E 1265
152 HOM048 Western White 00.72412 °N 034.45539 °E 1275
153 KAK001 Western Red 00.27951 °N 034.67358 °E 1419
154 KAK002 Western Red 00.27863 °N 034.67363 °E 1409
155 KAK003 Western Red 00.27861 °N 034.67367 °E 1420
156 KAK004 Western Red 00.27791 °N 034.69564 °E 1447
157 KAK005 Western Red 00.27700 °N 034.69589 °E 1441
158 KAK006 Western Red 00.27777 °N 034.69579 °E 1443
159 KAK007 Western Red 00.24446 °N 034.82470 °E 1571
160 KAK008 Western Red 00.24442 °N 034.82479 °E 1572
161 SIA001 Western Red 00.19481 °N 034.34081 °E 1297
162 SIA002 Western Red 00.19376 °N 034.33390 °E 1286
163 SIA003 Western Red 00.19423 °N 034.33385 °E 1280
164 SIA004 Western Red 00.13007 °N 034.42597 °E 1358
165 SIA005 Western Red 00.13003 °N 034.42687 °E 1357
166 SIA006 Western Red 00.12687 °N 034.42089 °E 1340
167 SIA007 Western White 00.12680 °N 034.42102 °E 1342
168 SIA008 Western White 00.12804 °N 034.42337 °E 1347
169 SIA009 Western Red 00.12810 °N 034.42309 °E 1347
170 SIA010 Western Red 00.13046 °N 034.42354 °E 1348
171 SIA011 Western Red 00.13008 °N 034.42255 °E 1349
172 VIH001 Western White 00.08540 °N 034.79936 °E 1680
173 VIH002 Western Red 00.08539 °N 034.79936 °E 1679
174 VIH003 Western Red 00.08532 °N 034.79938 °E 1682
175 VIH004 Western Red 00.84470 °N 034.79931 °E 1683
176 VIH005 Western Red 00.84360 °N 034.79930 °E 1684
177 VIH006 Western Red 00.08413 °N 034.79875 °E 1688
*There were no fruits on the trees at the time of sampling, hence fruit flesh colour was not
determined
31
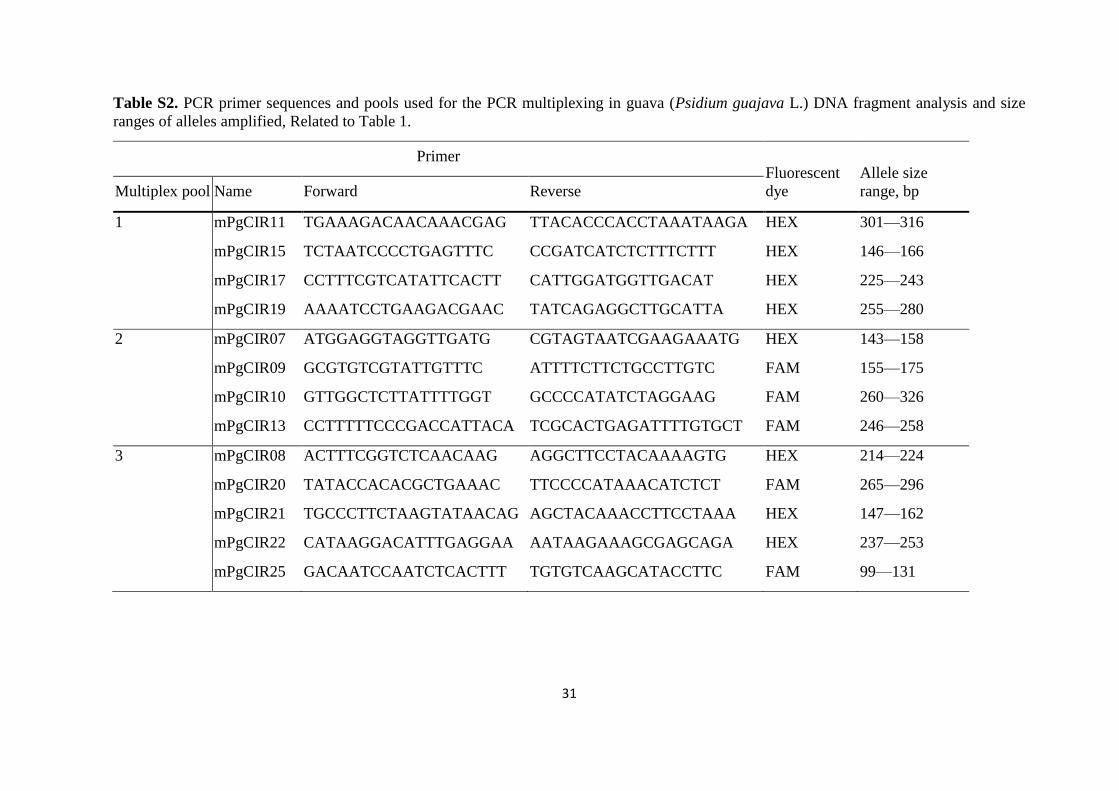
Table S2. PCR primer sequences and pools used for the PCR multiplexing in guava (Psidium guajava L.) DNA fragment analysis and size
ranges of alleles amplified, Related to Table 1.
Primer Fluorescent
dye
Allele size
range, bp Multiplex pool Name Forward Reverse
1 mPgCIR11 TGAAAGACAACAAACGAG TTACACCCACCTAAATAAGA HEX 301—316
mPgCIR15 TCTAATCCCCTGAGTTTC CCGATCATCTCTTTCTTT HEX 146—166
mPgCIR17 CCTTTCGTCATATTCACTT CATTGGATGGTTGACAT HEX 225—243
mPgCIR19 AAAATCCTGAAGACGAAC TATCAGAGGCTTGCATTA HEX 255—280
2 mPgCIR07 ATGGAGGTAGGTTGATG CGTAGTAATCGAAGAAATG HEX 143—158
mPgCIR09 GCGTGTCGTATTGTTTC ATTTTCTTCTGCCTTGTC FAM 155—175
mPgCIR10 GTTGGCTCTTATTTTGGT GCCCCATATCTAGGAAG FAM 260—326
mPgCIR13 CCTTTTTCCCGACCATTACA TCGCACTGAGATTTTGTGCT FAM 246—258
3 mPgCIR08 ACTTTCGGTCTCAACAAG AGGCTTCCTACAAAAGTG HEX 214—224
mPgCIR20 TATACCACACGCTGAAAC TTCCCCATAAACATCTCT FAM 265—296
mPgCIR21 TGCCCTTCTAAGTATAACAG AGCTACAAACCTTCCTAAA HEX 147—162
mPgCIR22 CATAAGGACATTTGAGGAA AATAAGAAAGCGAGCAGA HEX 237—253
mPgCIR25 GACAATCCAATCTCACTTT TGTGTCAAGCATACCTTC FAM 99—131
32
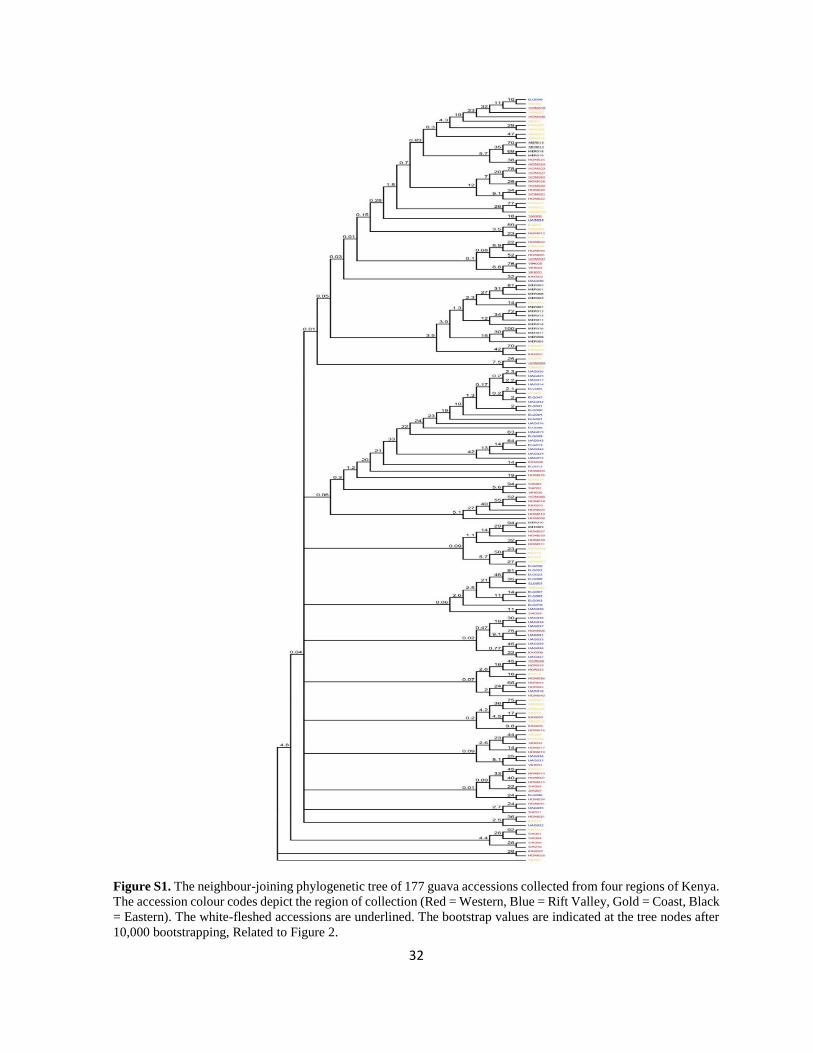
Figure S1. The neighbour-joining phylogenetic tree of 177 guava accessions collected from four regions of Kenya.
The accession colour codes depict the region of collection (Red = Western, Blue = Rift Valley, Gold = Coast, Black
= Eastern). The white-fleshed accessions are underlined. The bootstrap values are indicated at the tree nodes after
10,000 bootstrapping, Related to Figure 2.
33
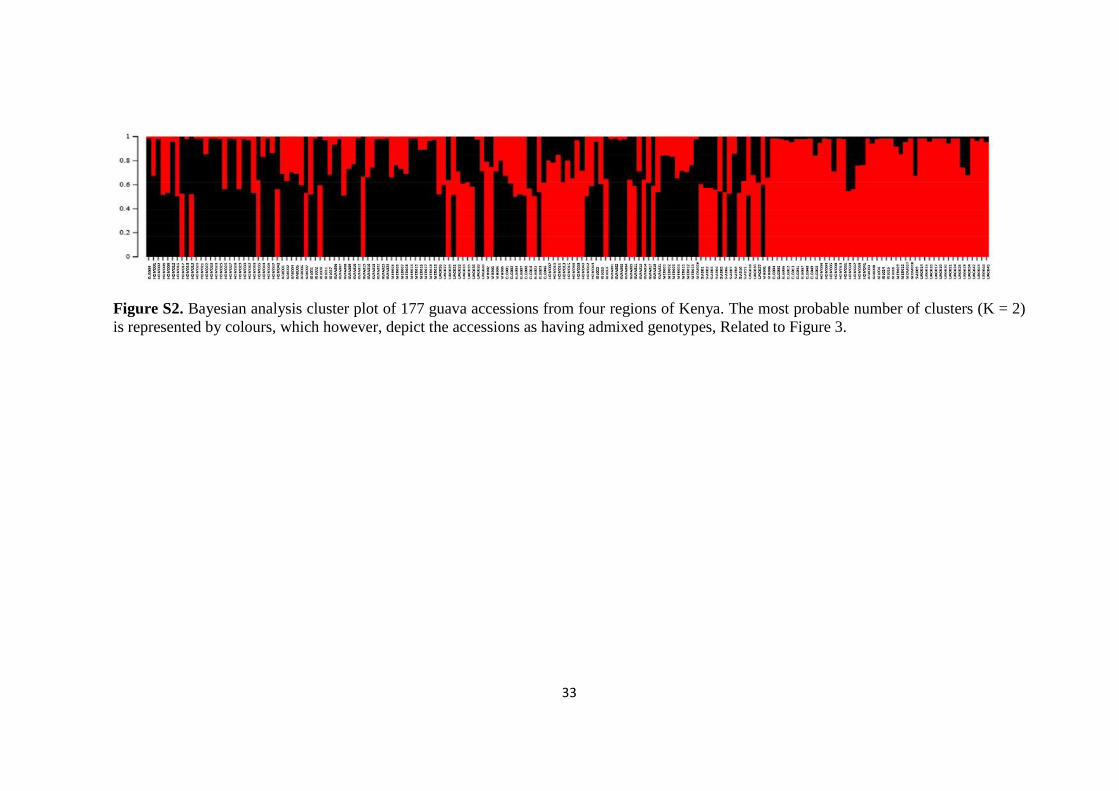
Figure S2. Bayesian analysis cluster plot of 177 guava accessions from four regions of Kenya. The most probable number of clusters (K = 2)
is represented by colours, which however, depict the accessions as having admixed genotypes, Related to Figure 3.
34
Chapter three
3. Variation in fruit chemical and mineral composition of guava (Psidium guajava L.):
Inferences from climatic conditions, soil nutrients, and fruit morphological traits
Abstract
There is limited knowledge about the impact of climatic conditions, soil nutrients, and fruit
morphological traits on the nutritional composition of guava fruits. Fruits were gathered
from 128 guava trees across four geographically diverse regions of Kenya and soils collected
under 50 trees of the 128 trees. The fruits were morphologically characterized, and analysed
for their chemical and mineral composition, and the soil nutrient content was also
determined. The ascorbic acid content correlated positively only with total annual
precipitation while the total soluble solids (TSS) correlated positively with mean annual
temperature. TSS also correlated positively with soil nutrients (P, Mg, and Zn) but negatively
with pulp weight, and was higher in white-fleshed fruits than in the red-fleshed types. The
mineral content of the fruits mainly correlated negatively with most of the fruit weight- and
size-based morphological traits and also with the total annual precipitation. This information
could act as a guide in the selection of specific regions for upscaling guava production, the
selection of accessions for improvement programmes, and the design of appropriate fertilizer
regimes that enhance guava fruit nutritional composition.
35
3.1. Introduction
Tropical fruits are important to developing countries from both nutritional and
economic perspective, with about 90% of these fruits being consumed in producing countries
themselves, while 10 percent are traded internationally as fresh fruits and processed products
(Available: http://www.fao.org/docrep/meeting/028/ma937e.pdf – Accessed 18.05.2018).
Besides some efforts seen in the production of tropical fruits such as mangoes and avocados,
the opportunities to grow, consume, and export more fruits from tropical regions remain
under-exploited compared to those in temperate regions (Griesbach 2007). For instance, the
supply of fruits and vegetables in lower income countries fall on average 58% short based
on nutritional recommendations (Siegel et al. 2014). Consequently, low-quality monotonous
diets are common in these regions, leading to high risks of nutrient deficiencies (Arimond et
al. 2010). Research to improve fruit production, therefore, offers tremendous opportunities
for raising the incomes of small-scale farming families in these regions, while also
improving their nutritional status as observed by Keding et al. (2017).
Guava (Psidium guajava L.) is an important tropical fruit tree that is grown mainly
for its edible fruits which are eaten raw or made into purée (pulp), jam, jelly, paste, juice,
syrup, chutney, and so on (Leite et al. 2006). The guava tree is cultivated in orchards and in
home gardens in many tropical countries (CABI 2013). In Kenya, for example, the guava
tree exists in all regions of the country (HCD 2014) and mainly grows unattended. Despite
the lack of attention devoted to guava tree husbandry, guava fruit production in Kenya has
recently shown an increase (HCD 2014). However, most of these guava fruits are collected
from the wild, and not much effort has been put to improve tree husbandry and the
production potential (Mbuvi and Boon 2009).
Most recent studies have reported an appreciable amount of ascorbic acid and other
antioxidants in guava fruit (Araújo et al. 2015; Flores et al. 2015; Gull et al. 2012), which
36
are essential dietary components (Flores et al. 2013). Guava fruit consumption has also been
observed to reduce low-density lipoprotein (LDL) cholesterol and triglyceride levels (Rai et
al. 2010; Setiawan et al. 2001). Besides, guava fruit has also been reported to contain
appreciable amounts of minerals such as K, P, and Ca (Ogoloma et al. 2013; Natale et al.
2007), which could significantly contribute towards meeting a person’s daily dietary
requirements.
The nutritional composition of a fruit is largely a reflection of the geographic region
where the fruits grows and the mineral composition of the soil there (Wall 2006; Forster et
al. 2002). The traits also vary with climate (Rodriguez-Amaya et al. 2008), fruit maturity
(Gull et al. 2012) and cultivar (Burlingame et al. 2009; Toledo and Burlingame 2006a). The
soil quality determines the sustainability and productivity of any agro-ecosystem (Forster et
al. 2002); hence, the growth and development of a plant is a function of soil–plant interaction
and the prevalent weather conditions (Haque et al. 2009). The nutritional composition of
fruits may therefore vary from one continent to another, from one country to another in the
same continent and in the same country, as well as from region to region due to changes in
climatic conditions (Haque et al. 2009) and soil quality parameters. However, there is limited
data on the nutrient content of tropical fruits in relation to these variables (Natale et al. 2007).
The objectives of this study were: (1) to characterize and correlate the variation in
the fruit chemical and mineral composition of guava with the climatic variables (temperature
and precipitation), (2) to determine the extent of correlation between soil nutrient content
and guava fruit chemical and mineral composition, and (3) to determine if the fruit
morphological traits (flesh colour and size- and weight-based traits) influence the chemical
and mineral composition of guava fruit and if they could be correlated. The assumption is
that variations in fruit chemical and mineral composition are correlated to each of the
climatic, soil nutrient content and fruit morphological traits which lead to their differences

37
in guava fruits. The information would help in establishing the species’ actual and potential
contributions to nutritional security, especially in relation to these factors.
3.2. Materials and methods
3.2.1. Sampling
The regions for sampling in Kenya were chosen based on their high guava fruit
production trends (HCD 2014). Fruit sampling was carried out between September and
November 2015. This coincided with the time when the fruits were available and ready for
harvesting in the specific regions. With the help of key informants and field guides, the main
guava-producing locations within the regions were identified. Households and institutions
were randomly selected within these locations and trees with ripe fruits targeted for fruit
collection. The geographical locations of the trees were recorded with a hand-held Global
Positioning System (GPS) (Table S1). The latitudes and longitudes also enabled the retrieval
of the mean annual temperature and annual precipitation data from WorldClim—Global
Climate Data: http://www.worldclim.org/bioclim; (Fick and Hijmans 2017) for individual
accessions (Table S1). The monthly meteorological data (temperature, relative humidity
[RH], and precipitation) based on the nearest meteorological station within the regions is
shown in Figure S1. Healthy and clean fruits and leaves from 128 trees were collected from
the Coast (36 trees), Eastern (12 trees), Rift Valley (19 trees), and Western (61 trees) regions
(Figure 1).
From the 128 trees selected for fruit nutrient and chemical characterization, 50 trees
were randomly selected (Coast = 19, Eastern = 7, Rift Valley =13, and Western = 11) for
soil sample collection under their crowns from two spots that were equidistant from the main
trunk. These spots were also in opposite directions to each other. The top five cm-layer
comprising the organic litter was first removed before collecting the soil. The soil was
collected using a soil auger and by drilling vertically, first 0–15 cm and then 15–30 cm. The
38
two collected soil samples from top- and subsoil from each tree were then mixed thoroughly
and air-dried before sieving through a two-mm-mesh.
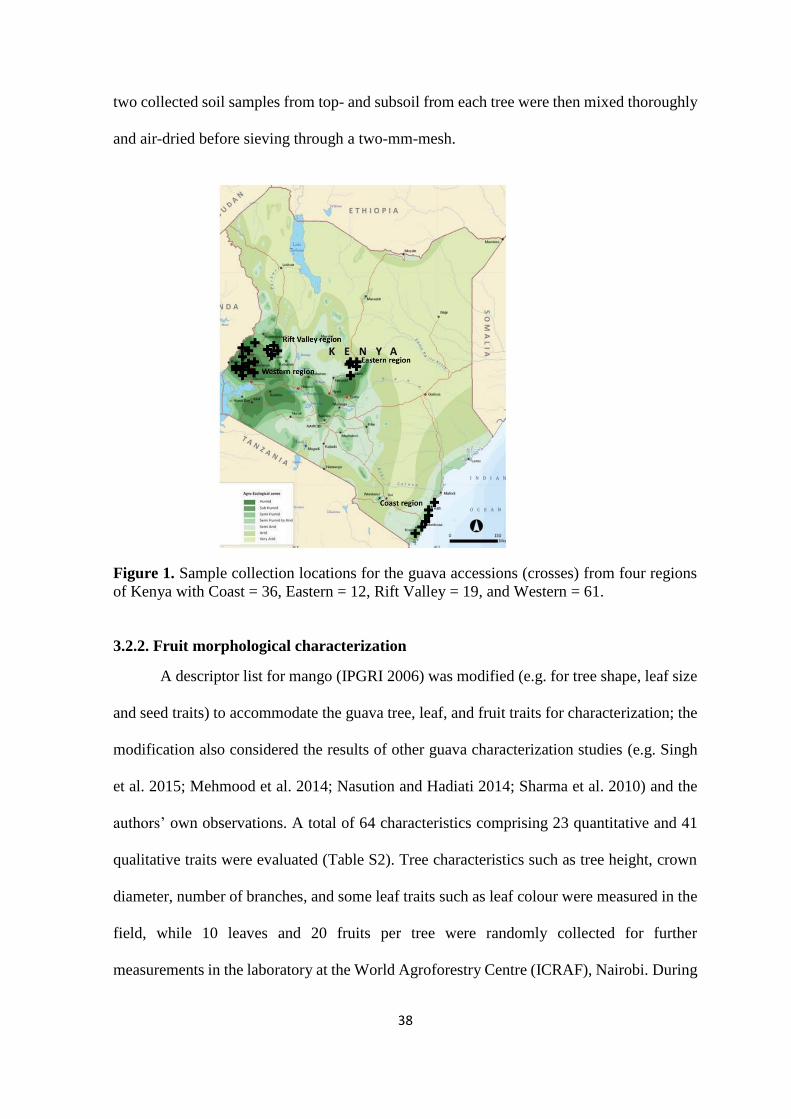
Figure 1. Sample collection locations for the guava accessions (crosses) from four regions
of Kenya with Coast = 36, Eastern = 12, Rift Valley = 19, and Western = 61.
3.2.2. Fruit morphological characterization
A descriptor list for mango (IPGRI 2006) was modified (e.g. for tree shape, leaf size
and seed traits) to accommodate the guava tree, leaf, and fruit traits for characterization; the
modification also considered the results of other guava characterization studies (e.g. Singh
et al. 2015; Mehmood et al. 2014; Nasution and Hadiati 2014; Sharma et al. 2010) and the
authors’ own observations. A total of 64 characteristics comprising 23 quantitative and 41
qualitative traits were evaluated (Table S2). Tree characteristics such as tree height, crown
diameter, number of branches, and some leaf traits such as leaf colour were measured in the
field, while 10 leaves and 20 fruits per tree were randomly collected for further
measurements in the laboratory at the World Agroforestry Centre (ICRAF), Nairobi. During
39
morphological fruit characterization, fruits which were found to be infested by maggots and
could only be discovered after longitudinal dissection were not characterized. This therefore
reduced the number of accessions for morphological characterization. As the minimum
number of fruits for size- and weight-based fruit morphological characterization was set to
be at least 20, the characterization was eventually carried out for fruits from 105 trees (Coast
= 23, Eastern = 12, Rift Valley = 17, and Western = 53), except for characterization of fruit
flesh colour of which at least one fruit per tree was used. Therefore, all the 128 trees were
used for determination of flesh colour. The fruit and the various fruit parts which were
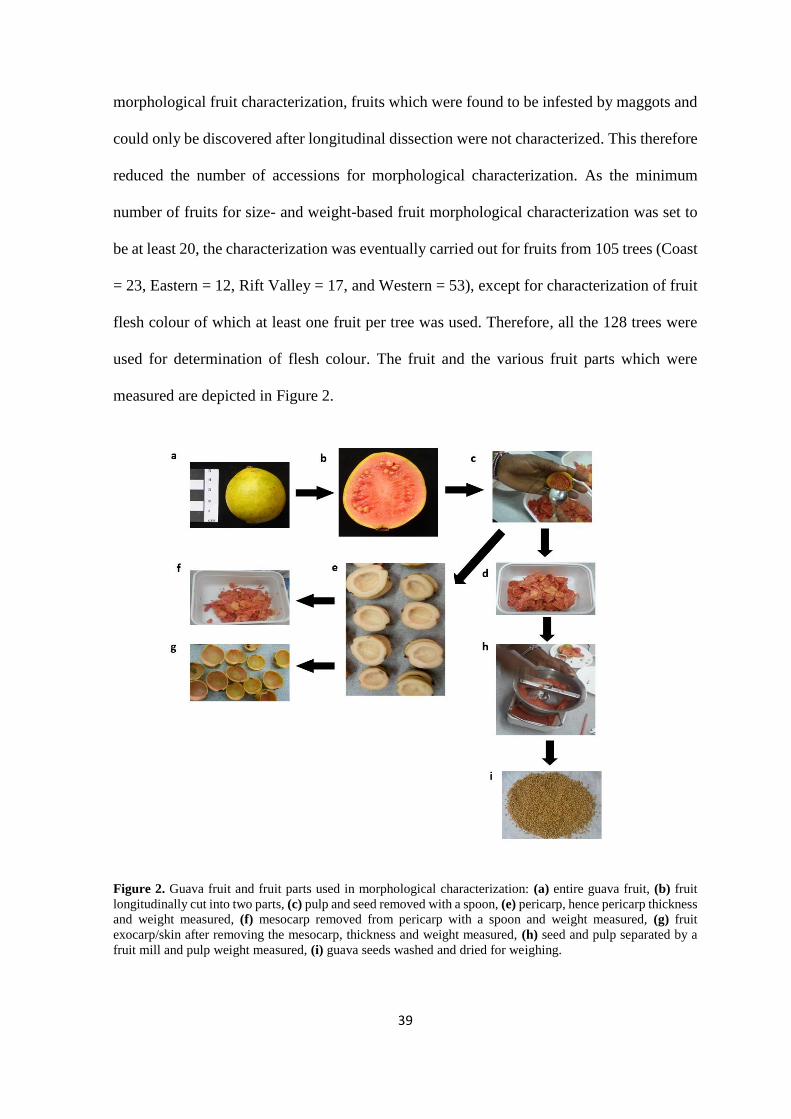
measured are depicted in Figure 2.
Figure 2. Guava fruit and fruit parts used in morphological characterization: (a) entire guava fruit, (b) fruit
longitudinally cut into two parts, (c) pulp and seed removed with a spoon, (e) pericarp, hence pericarp thickness
and weight measured, (f) mesocarp removed from pericarp with a spoon and weight measured, (g) fruit
exocarp/skin after removing the mesocarp, thickness and weight measured, (h) seed and pulp separated by a
fruit mill and pulp weight measured, (i) guava seeds washed and dried for weighing.
40
3.2.3. Determination of fruit chemical and mineral composition
Since chemical and mineral characterization of the fruits considered between five to
20 healthy and undamaged ripe fruits, fruits from all the 128 trees were characterized for
their chemical and mineral content. The ripeness of the fruits was determined as the yellow
colour of the skin based on the colour chart of The Royal Horticultural Society (RHS 2015)
in addition to the softness of the fruits to touch (Araújo et al. 2015; Gull et al. 2012). The
fruits were cleaned and separated into skin, pulp, and seeds, and the edible portion (pulp plus
skin) was divided into two sub-samples. One fresh sample was used for the analysis of
ascorbic acid content, TSS, and titratable acidity (TA) immediately after processing. The
other sub-sample was weighed and then freeze-dried. The freeze-dried sample was weighed
again to determine the water loss, which was expressed as %. The sample was later used to
analyse the protein, sugar, total phenolic compounds, and mineral contents. All the results
were expressed per fruit fresh weight (FW).
The ascorbic acid content was determined in fresh samples by reduction with 2,6-
dichloroindophenol solution to a colourless dye using the titration method according to the
procedure developed by Puwastien et al. (2011). To increase precision, the samples were
measured titrimetrically.
The total phenolic compounds were extracted from 0.25 g of freeze-dried sample by
adding 5 ml of 80% ethanol in a falcon tube. The tube was thoroughly vortexed and then
centrifuged at 5,000 g for 10 minutes. The supernatant was transferred to a 10 ml flask. The
extraction was repeated and the supernatants combined. The flask was then filled up to the
10 ml mark with 80% ethanol. Estimation of the total phenolic compounds was carried out
in triplicate photometrically at 735.8 nm, immediately after extraction with the Folin–
Ciocalteu reagent and expressed as mg per gallic acid equivalent (mg/GAE) according to the
protocol developed by Singleton and Rossi (1965).

41
TSS was measured by placing a few drops of the squeezed guava juice from fresh
fruits on a hand-held refractometer. The values were read directly as % brix.
TA was determined on extracted guava juice from fresh fruits by titrating to a pH of
8.1 by adding 0.1N NaOH according to the method by LMBG (1983). The result was
expressed as mg of citric acid per 100 g of sample.
Sugars (glucose and fructose) were extracted from 200 mg of freeze-dried and milled
guava fruit samples by adding 8 ml of pure water, vortexing, and then shaking the samples
for one hour. Then 0.5 ml of 0.25 M Carrez I (containing potassium hexacyanoferrate (II)
trihydrate, K4[Fe(CN)6].3H2O) and 0.5 ml of 0.09 M Carrez II (containing zinc sulphate
heptahydrate, ZnSO4.7H2O) were added to each sample and mixed by vortexing. The tubes
were then centrifuged at 5,000 rpm for 20 minutes and the supernatant transferred into 25
ml volumetric flasks. The extraction was repeated by adding 7 ml of pure water alone. The
volumetric flasks were then filled up to the 25 ml level and the extract filtered into
scintillation vessels. Soluble carbohydrates were separated according to the procedure used
by Keutgen and Pawelzik (2008), and the sugar content (glucose and fructose) detected by
High-Performance Liquid Chromatography (HPLC) (Jasco, 26600 Mary’s Court Easton,
MD 21601).
Proteins were extracted using the phenol protocol established by Faurobert et al.
(2007) on 200 mg of milled freeze-dried samples. The proteins were measured
photometrically, each in three replications, according to Bradford (1976).
Fruit mineral contents—that is, calcium (Ca), magnesium (Mg), potassium (K),
sodium (Na), phosphorus (P), sulphur (S), iron (Fe), boron (B), zinc (Zn), and copper (Cu)—
were extracted from 100 mg of each milled freeze-dried sample according to the procedure
by Wheal et al. (2011) and determined using inductively coupled plasma atomic emission
spectroscopy (ICP-AES) (Vista-RL ICP-OES, Varian Inc., USA).

42
3.2.4. Determination of soil pH and soil nutrients
The soil pH was determined according to the procedure by Jackson (1967). 25 ml of
0.01 M CaCl2 solution was added to 10 g of air-dried soil. The mixture was stirred thoroughly
using a glass rod and the pH was measured after 30 minutes using a pH metre.
Soil nutrients (P as P2O5, K as K2O, and Mg) were extracted using calcium acetate
lactate (C5H8CaO5) (commonly known as the CAL method) according to the procedure by
Schüller (1969). Na, Cu, Zn, B, Fe, and manganese (Mn) were extracted using calcium
chloride dehydrate (CaCl2.2H2O) and diethylenetriaminepentaacetic acid (C14H23N3O10),
which is commonly referred to as the CAT method (Schachtschabel 1954). The nutrient
composition of the soil was determined using ICP-AES (Vista-RL ICP-OES, Varian Inc.,
USA). Owing to the high concentrations of Mn in the samples, Mn was determined
separately by atomic absorption spectrophotometry. Soil Nitrogen (N) and Carbon (C) were
determined in sample weights of 35–40 mg of soil using the N analyzer (Verardo et al. 1990)
(Model NA 1500-R/AS 200, Thermo Quest, Fisons).
3.3. Data analysis
Analysis of variance, mean separation and correlation analyses for fruit traits and soil
nutrients were conducted using SPSS version 20.0 (IBM 2011). A Shapiro–Wilk test (p <
0.05) and the resulting histograms, normal Q-Q plots, and box plots showed that the data for
fruit chemical composition and soil properties was not normally distributed. The Welch test
of homogeneity of variance also depicted variance inhomogeneity. Therefore, these data sets
were analysed non-parametrically using the Kruskal–Wallis test for one-way analysis of
variance, Mann-Whitney U-test for comparison of two sample means, and Spearman’s rank
for correlations. Only correlations with r ≥ 0.3 at p ≤ 0.01 were considered as significant,
and hence presented in the results. The morphological data, however, was normally
distributed and analysed by analysis of variance (ANOVA) followed by a post hoc Tukey
43
test, and independent sample t-test for mean separation. Regarding the fruit traits (both
chemical and mineral, and morphological), analysis was first done per region to check if
regional variations existed. Next, mean annual temperature and annual precipitation data
obtained from WorldClim–Global Climate Data: http://www.worldclim.org/bioclim, (Fick
and Hijmans 2017) for individual accessions was correlated to the fruit chemical and mineral
composition data. Furthermore, the fruit chemical and mineral composition data was again
tested for variation based on the colour of the fruits’ pulp.
Due to the observed existence of variation in morphological characteristics within
the regions and even within tree sampling locations, the morphological data was processed
further to capture this variation more precisely. Field tree traits easily influenced by
horticultural practices, such as number of branches, crown diameter, and tree height, were
not included in the analysis. A combined cluster analysis of z-standardized qualitative and
quantitative morphological variables using Ward’s clustering method and Squared
Euclidean Distances was performed. Discriminant analysis was then performed on the
identified clusters to identify the most important variables responsible for the formation of
the observed clusters. These variables had higher loadings based on the Standardized
Canonical Discriminant Function coefficients. In addition, Principal Component Analysis
(PCA) was conducted using Statistica software (Statsoft.com 2016), considering several
clustering possibilities and to identify the variables responsible for their formation.
Eventually, the two methods—Discriminant analysis and PCA—depicted two clusters that
could be inferred by some variables which grouped consistently in the two methods.
ANOVA was then performed on these variables to check whether a significant difference
existed between the two clusters. Finally, a cluster analysis was repeated based only on the
identified key descriptors to check if sample distribution in the final clusters was similar to
the one when all the quantitative and qualitative descriptors were used. Lastly, ANOVA
44
followed by independent sample t-test was performed to test the existence of significant
differences between the two clusters based only on the key selected descriptors. Fruit
chemical and mineral data was therefore analysed again for significant differences based on
the two identified clusters and correlations performed with the key morphological
descriptors. A PCA scatter plot considering temperature, precipitation, soil, and fruit traits
was finally performed using Statistica software to check the correlations of all the variables
together.
3.4. Results
3.4.1. Fruit chemical and mineral composition based on region and climate
The chemical and mineral composition of guava fruits from the four regions of Kenya
are provided in Table 1. The edible fruit portion (pulp and skin) of the 128 sampled trees
had a mean ascorbic acid content of 83.8 mg 100 g-1 FW, although with an extremely high
variability ranging from 9.8 to 377.1 mg 100 g-1 FW. The highest mean value was recorded
in fruits from the Eastern region (147.4 mg 100 g-1 FW), followed by the Western region
(91.0 mg 100 g-1 FW). The samples from Coast and Rift Valley regions recorded the lowest
values (66.8 mg 100 g-1 and 52.9 mg 100 g-1 FW, respectively).
The contents of total phenolic compounds were statistically similar across the
regions, with a total mean value of 150.9 mg 100 g-1 FW. However, there were wide
variations of these compounds within the regions with the total mean minimum and
maximum values ranging between 108.6 mg 100 g-1 FW and 285.8 mg 100 g-1 FW.
Lower values of TSS (% brix; 9.13%) were registered in samples from the Rift Valley
region, especially in comparison to those from the Coast (13.2%) region, which recorded
higher values. The brix value ranged from 5.9% to 20% with an overall mean of 11.3%.
Consequently, higher fructose and glucose values were also recorded in samples from the
Coast region as 3.76 g 100 g-1 FW and 1.55 g 100 g-1 FW, respectively. On the other hand,

45
TA was highest in samples from the Eastern region (1.22 mg 100 g-1 FW) and lowest in the
Rift Valley region (0.78 mg 100 g-1 FW). TA ranged from 0.59 100 g-1 FW to 2.73 100 g-1
FW with an overall mean of 0.96 g 100 g-1 FW. The protein content was highest in fruits
from the Coast region (0.69 mg 100 g-1 FW) and lowest in the Eastern region (0.38 mg 100
g-1 FW).
The lowest Ca levels were found in fruits from the Eastern region (9.77 mg 100 g-1
FW), and the highest values were recorded in the Coast, Rift Valley and Western regions
(16.0 mg 100 g-1 FW, 15.3 mg 100 g-1 FW and 13.4 mg 100 g-1 FW, respectively) with a
total mean of 14.1 mg 100 g-1 FW for all the regions together. Fruits from the Coast region
had the highest K, Mg, and S contents (406 mg 100 g-1 FW, 13.1 mg 100 g-1 FW, and 17.1
mg 100 g-1 FW, respectively); the other regions recorded lower values that were similar to
each other. The fruit Na content was significantly higher in fruits from the Coast (5.63 mg
100 g-1 FW) and the Rift Valley (3.63 mg 100 g-1 FW) than those from the Western and
Eastern regions (1.49 mg 100 g-1 FW and 0.69 mg 100 g-1 FW, respectively). A similar trend
was observed with respect to fruit P content. The Fe content was significantly higher in fruits
from the Rift Valley (0.47 mg 100 g-1 FW) and Coast (0.38 mg 100 g-1 FW), compared to
those from the Western region (0.27 mg 100 g-1 FW). B was highest in samples from the
Coast region (0.27 mg 100 g-1 FW) and lowest in those from the Rift Valley region (0.15 mg
100 g-1 FW). Fruits collected in the Eastern region had highest Zn content (0.13 mg 100 g-1
FW) while those from the Western region recorded the lowest Zn values (0.04 mg 100 g-1
FW). However, fruits from the Eastern region recorded significantly lower Cu values (0.07
mg 100 g-1 FW), as compared to those from the Rift Valley region. Fruits sampled in the
Eastern, Western and Rift Valley regions had significantly higher water content than those
from the Coast region (Table 1).

46
Table 1. Fruit chemical and mineral composition of 128 guava accessions sampled from four regions of Kenya.
Region of collection
Fruit chemical and mineral
composition Rift Valley (n= 19) Western (n= 61) Coast (n= 36) Eastern (n= 12) Mean (n= 128)
p-
value
Ascorbic acid (mg 100 g-1 FW) 52.9 b (11.1-04.5) 91.0 a (11.5-206.5) 66.8 b (9.77-279.1) 147.4 a (58.6-377.1) 83.8 (9.77-377.1) 0.000
Phenolics (mg 100 g-1 FW) 141.8 a (110.6-167.5) 151.8 a (108.6-285.8) 151.3 a (113.7-248.7) 159.5 a (121.0-201.2) 150.9 (108.6-285.8) 0.283
TSS (% brix) 9.13 c (5.90-11.2) 11.1 b (6.9-14.9) 13.2 a (8.1-20.0) 9.53 bc (7.7-10.7) 11.3 (5.90-20.0) 0.000
TA (mg 100 g-1 FW) 0.78 b (0.62-0.98) 0.95 a (0.61-2.25) 1.00 a (0.60-1.58) 1.22 a (0.59-2.73) 0.96 (0.59-2.73) 0.000
Fructose (g 100 g-1 FW) 2.51 b (1.28-3.78) 2.77 b (0.80-6.05) 3.76 a (1.55-5.96) 2.30 b (0.88-2.95) 2.97 (0.80-6.05) 0.000
Glucose (g 100 g-1 FW) 1.09 ab (0.52-1.94) 1.08 b (0.10-2.80) 1.55 a (0.14-2.51) 0.88 b (0.36-1.24) 1.19 (0.10-2.80) 0.002
Protein (mg 100 g-1 FW) 0.43 b (0.26-0.58) 0.49 b (0.24-0.91) 0.69 a (0.38-1.16) 0.38 b (0.31-0.57) 0.53 (0.24-1.16) 0.000
Ca (mg 100 g-1 FW) 15.3 a (7.64-27.7) 13.4 ab (5.84-28.4) 16.0 a (7.09-36.5) 9.77 c (4.98-14.1) 14.1 (4.98-36.5) 0.002
K (mg 100 g-1 FW) 270.8 b (106.3-391.5) 287.6 b (126.2-680.5) 406.0 a (208.3-704.8) 243.9 b (187.7-376.4) 314.3 (106.3-704.8) 0.000
Mg (mg 100 g-1 FW) 8.15 b (3.43-16.9) 9.59 b (4.96-18.8) 13.1 a (7.91-19.6) 8.57 b (6.05-12.9) 10.3 (3.43-19.6) 0.000
Na (mg 100 g-1 FW) 3.63 a (0.61-6.02) 1.49 b (0.23-7.47) 5.63 a (2.54-16.0) 0.69 b (0.32-1.54) 2.90 (0.23-16.0) 0.000
P (mg 100 g-1 FW) 18.4 a (11.4-32.0) 12.3 b (4.18-32.4) 18.8 a (10.0-33.5) 11.1 b (6.94-16.1) 14.9 (4.18-33.5) 0.000
S (mg 100 g-1 FW) 10.7 b (3.98-15.9) 10.8 b (3.21-24.7) 17.1 a (7.95-28.4) 10.1 b (7.75-15.5) 12.5 (3.21-28.4) 0.000
Fe (mg 100 g-1 FW) 0.47 a (0.18-1.17) 0.27 b (0.10-0.67) 0.38 a (0.18-0.94) 0.37 ab (0.16-0.82) 0.34 (0.10-1.17) 0.000
B (mg 100 g-1 FW) 0.15 c (0.08-0.21) 0.21 b (0.08-0.42) 0.27 a (0.11-0.43) 0.18 bc (0.12-0.25) 0.22 (0.08-0.43) 0.000
Zn (mg 100 g-1 FW) 0.09 ab (0.00-0.19) 0.04 b (0.00-0.40) 0.11 ab (0.00-0.84) 0.13 a (0.00-0.28) 0.08 (0.00-0.84) 0.001
Cu (mg 100 g-1 FW) 0.13 a (0.06-0.52) 0.11 ab (0.02-0.46) 0.10 ab (0.05-0.17) 0.07 b (0.05-0.13) 0.11 (0.02-0.52) 0.017
Water content (%) 86.3 a (82.1-91.6) 85.2 a (75.1-92.6) 78.5 b (65.6-88.2) 88.4 a (83.7-90.6) 83.8 (65.6-92.6) 0.000
Values within the same row followed by the same letter are not significantly different at p < 0.05 according to Kruskall-Wallis test followed by pairwise comparisons.
Values within parenthesis depict the range.
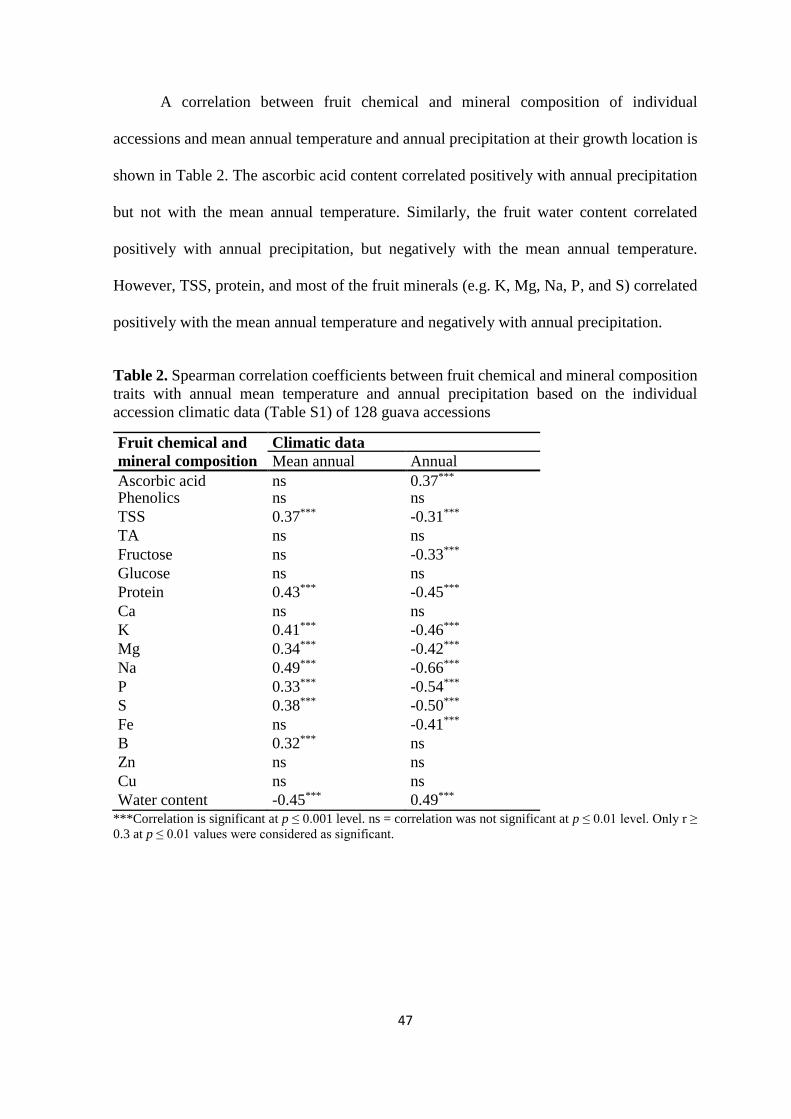
47
A correlation between fruit chemical and mineral composition of individual
accessions and mean annual temperature and annual precipitation at their growth location is
shown in Table 2. The ascorbic acid content correlated positively with annual precipitation
but not with the mean annual temperature. Similarly, the fruit water content correlated
positively with annual precipitation, but negatively with the mean annual temperature.
However, TSS, protein, and most of the fruit minerals (e.g. K, Mg, Na, P, and S) correlated
positively with the mean annual temperature and negatively with annual precipitation.
Table 2. Spearman correlation coefficients between fruit chemical and mineral composition
traits with annual mean temperature and annual precipitation based on the individual
accession climatic data (Table S1) of 128 guava accessions
Fruit chemical and
mineral composition
Climatic data
Mean annual
temperature
Annual
precipitation Ascorbic acid ns 0.37*** Phenolics ns ns
TSS 0.37*** -0.31***
TA ns ns
Fructose ns -0.33***
Glucose ns ns
Protein 0.43*** -0.45***
Ca ns ns
K 0.41*** -0.46***
Mg 0.34*** -0.42***
Na 0.49*** -0.66***
P 0.33*** -0.54***
S 0.38*** -0.50***
Fe ns -0.41***
B 0.32*** ns
Zn ns ns
Cu ns ns
Water content -0.45*** 0.49*** ***Correlation is significant at p ≤ 0.001 level. ns = correlation was not significant at p ≤ 0.01 level. Only r ≥
0.3 at p ≤ 0.01 values were considered as significant.
48
3.4.2. Correlation of fruit chemical and mineral composition with soil nutrients
In general, the regional variation in the fruit chemical and mineral traits of the 50
trees was fairly similar to those of the 128 trees analysed (Table S3), thus enabling a
correlation analysis with soil nutrients that could be generalized for the entire fruit sample.
The soil pH and nutrients in the four regions were fairly similar, with the soil textures
being sand, sandy loam, loamy sand, and loam. The results of the soil analyses are presented
in Table S4. Mean soil pH was similar under trees in all the regions with an overall mean
value of 5.97, and ranged between 4.33 and 7.98. The highest soil N was recorded under
trees from the Rift Valley region (0.23%), and this was statistically similar to those of the
Eastern (0.20%) and the Western (0.15%) regions. The soil under the trees from the Coast
region had the least N content (0.07%), and the lowest levels of C, while C was highest in
the Rift Valley region. The C/N ratio was similar in samples from the Rift Valley (13.0) and
the Coast (12.4) regions, while statistically similar values were also recorded for Coast
(12.4), Western (10.6) and Eastern (10.5) regions. The P2O5 content was highest in soil
samples from the Coast (101.1 mg kg-1) but least in those from the Western region (19.9 mg
kg-1), and K2O content was also highest in soil samples from the Coast region (656.8 mg kg-
1), but least in samples from the Rift Valley region (138.3 mg kg-1). Soil Mg content was
also highest in samples from the Coast and lowest in those from the Rift Valley region (325.9
mg kg-1 versus 134.2 mg kg-1, respectively). With regard to micronutrients, samples from the
Coast region were highest in B content (4.06 mg kg-1) that was least in those from the Rift
Valley region (1.59 mg kg-1). The other soil micronutrients (Cu, Mn, Fe, Zn, and Na) did not
vary among the studied regions.
Table 3 presents the results of the correlation between the soil nutrients and fruit
chemical and mineral composition. Soil P2O5 was observed to correlate positively with TSS.
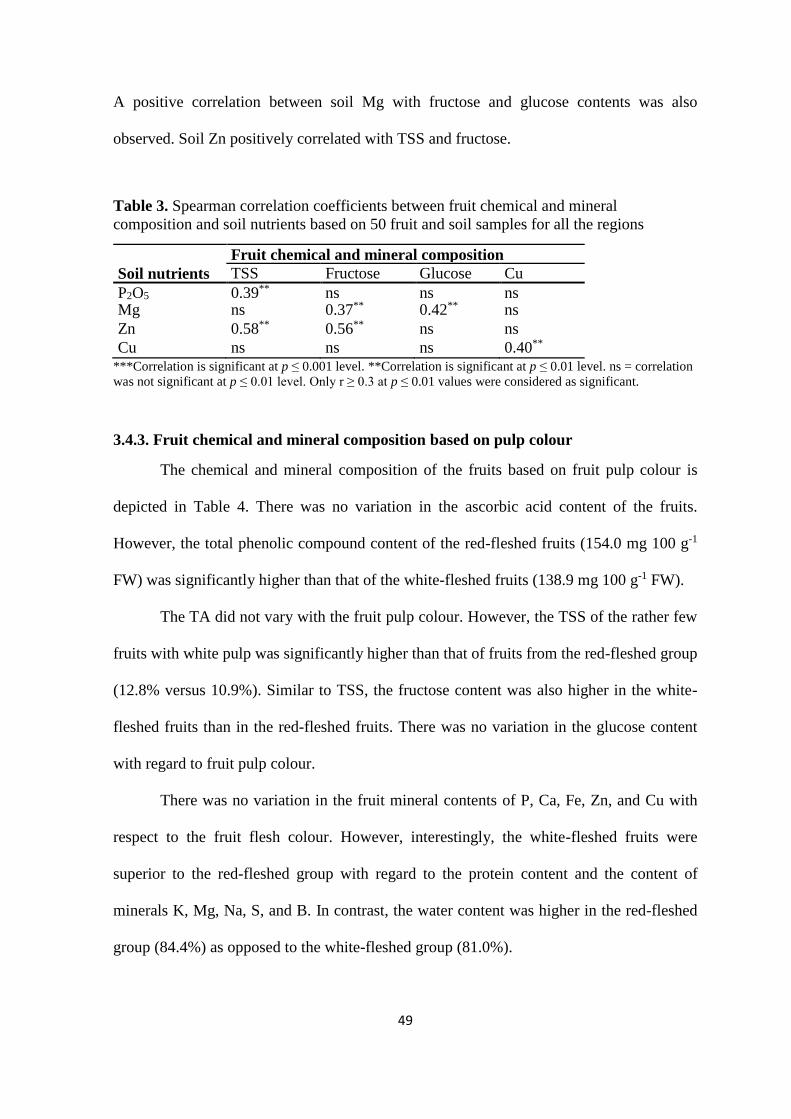
49
A positive correlation between soil Mg with fructose and glucose contents was also
observed. Soil Zn positively correlated with TSS and fructose.
Table 3. Spearman correlation coefficients between fruit chemical and mineral
composition and soil nutrients based on 50 fruit and soil samples for all the regions
Fruit chemical and mineral composition
Soil nutrients TSS Fructose Glucose Cu
P2O5 0.39** ns ns ns Mg ns 0.37** 0.42** ns
Zn 0.58** 0.56** ns ns
Cu ns ns ns 0.40** ***Correlation is significant at p ≤ 0.001 level. **Correlation is significant at p ≤ 0.01 level. ns = correlation
was not significant at p ≤ 0.01 level. Only r ≥ 0.3 at p ≤ 0.01 values were considered as significant.
3.4.3. Fruit chemical and mineral composition based on pulp colour
The chemical and mineral composition of the fruits based on fruit pulp colour is
depicted in Table 4. There was no variation in the ascorbic acid content of the fruits.
However, the total phenolic compound content of the red-fleshed fruits (154.0 mg 100 g-1
FW) was significantly higher than that of the white-fleshed fruits (138.9 mg 100 g-1 FW).
The TA did not vary with the fruit pulp colour. However, the TSS of the rather few
fruits with white pulp was significantly higher than that of fruits from the red-fleshed group
(12.8% versus 10.9%). Similar to TSS, the fructose content was also higher in the white-
fleshed fruits than in the red-fleshed fruits. There was no variation in the glucose content
with regard to fruit pulp colour.
There was no variation in the fruit mineral contents of P, Ca, Fe, Zn, and Cu with
respect to the fruit flesh colour. However, interestingly, the white-fleshed fruits were
superior to the red-fleshed group with regard to the protein content and the content of
minerals K, Mg, Na, S, and B. In contrast, the water content was higher in the red-fleshed
group (84.4%) as opposed to the white-fleshed group (81.0%).
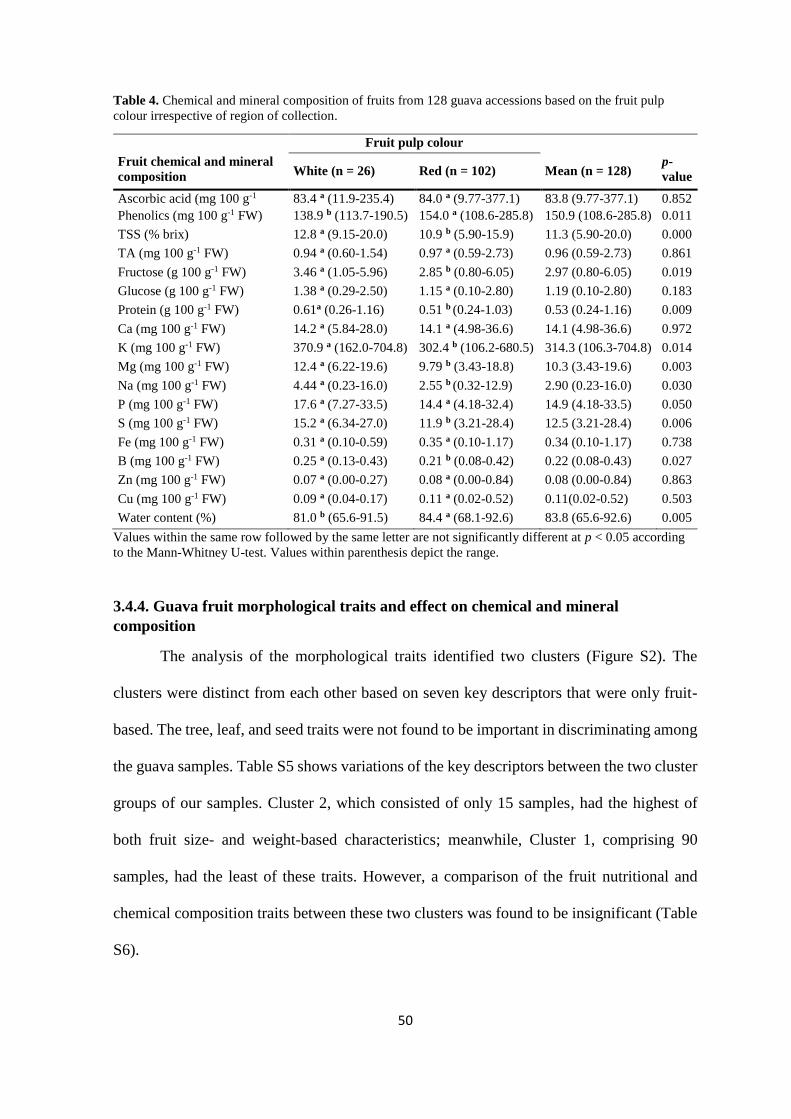
50
Table 4. Chemical and mineral composition of fruits from 128 guava accessions based on the fruit pulp
colour irrespective of region of collection.
Fruit pulp colour
Fruit chemical and mineral
composition White (n = 26) Red (n = 102) Mean (n = 128) p-
value
Ascorbic acid (mg 100 g-1
FW)
83.4 a (11.9-235.4) 84.0 a (9.77-377.1) 83.8 (9.77-377.1) 0.852
Phenolics (mg 100 g-1 FW) 138.9 b (113.7-190.5) 154.0 a (108.6-285.8) 150.9 (108.6-285.8) 0.011
TSS (% brix) 12.8 a (9.15-20.0) 10.9 b (5.90-15.9) 11.3 (5.90-20.0) 0.000
TA (mg 100 g-1 FW) 0.94 a (0.60-1.54) 0.97 a (0.59-2.73) 0.96 (0.59-2.73) 0.861
Fructose (g 100 g-1 FW) 3.46 a (1.05-5.96) 2.85 b (0.80-6.05) 2.97 (0.80-6.05) 0.019
Glucose (g 100 g-1 FW) 1.38 a (0.29-2.50) 1.15 a (0.10-2.80) 1.19 (0.10-2.80) 0.183
Protein (g 100 g-1 FW) 0.61a (0.26-1.16) 0.51 b (0.24-1.03) 0.53 (0.24-1.16) 0.009
Ca (mg 100 g-1 FW) 14.2 a (5.84-28.0) 14.1 a (4.98-36.6) 14.1 (4.98-36.6) 0.972
K (mg 100 g-1 FW) 370.9 a (162.0-704.8) 302.4 b (106.2-680.5) 314.3 (106.3-704.8) 0.014
Mg (mg 100 g-1 FW) 12.4 a (6.22-19.6) 9.79 b (3.43-18.8) 10.3 (3.43-19.6) 0.003
Na (mg 100 g-1 FW) 4.44 a (0.23-16.0) 2.55 b (0.32-12.9) 2.90 (0.23-16.0) 0.030
P (mg 100 g-1 FW) 17.6 a (7.27-33.5) 14.4 a (4.18-32.4) 14.9 (4.18-33.5) 0.050
S (mg 100 g-1 FW) 15.2 a (6.34-27.0) 11.9 b (3.21-28.4) 12.5 (3.21-28.4) 0.006
Fe (mg 100 g-1 FW) 0.31 a (0.10-0.59) 0.35 a (0.10-1.17) 0.34 (0.10-1.17) 0.738
B (mg 100 g-1 FW) 0.25 a (0.13-0.43) 0.21 b (0.08-0.42) 0.22 (0.08-0.43) 0.027
Zn (mg 100 g-1 FW) 0.07 a (0.00-0.27) 0.08 a (0.00-0.84) 0.08 (0.00-0.84) 0.863
Cu (mg 100 g-1 FW) 0.09 a (0.04-0.17) 0.11 a (0.02-0.52) 0.11(0.02-0.52) 0.503
Water content (%) 81.0 b (65.6-91.5) 84.4 a (68.1-92.6) 83.8 (65.6-92.6) 0.005
Values within the same row followed by the same letter are not significantly different at p < 0.05 according
to the Mann-Whitney U-test. Values within parenthesis depict the range.
3.4.4. Guava fruit morphological traits and effect on chemical and mineral
composition
The analysis of the morphological traits identified two clusters (Figure S2). The
clusters were distinct from each other based on seven key descriptors that were only fruit-
based. The tree, leaf, and seed traits were not found to be important in discriminating among
the guava samples. Table S5 shows variations of the key descriptors between the two cluster
groups of our samples. Cluster 2, which consisted of only 15 samples, had the highest of
both fruit size- and weight-based characteristics; meanwhile, Cluster 1, comprising 90
samples, had the least of these traits. However, a comparison of the fruit nutritional and
chemical composition traits between these two clusters was found to be insignificant (Table
S6).
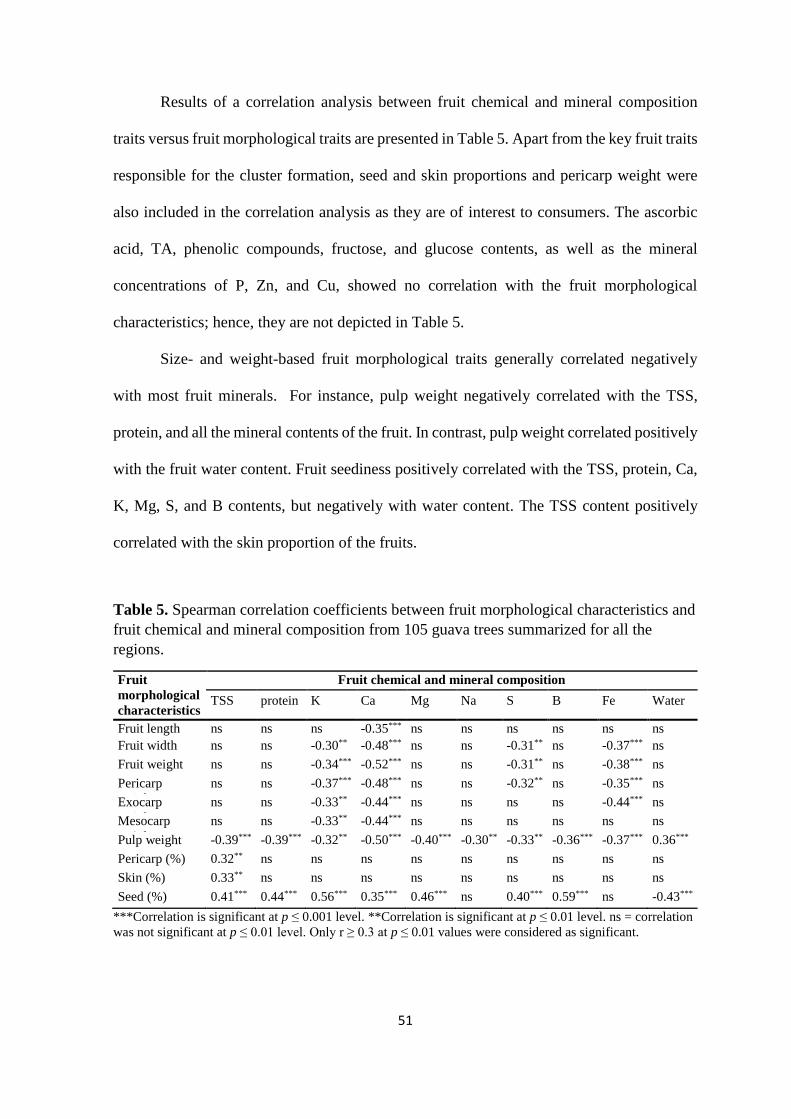
51
Results of a correlation analysis between fruit chemical and mineral composition
traits versus fruit morphological traits are presented in Table 5. Apart from the key fruit traits
responsible for the cluster formation, seed and skin proportions and pericarp weight were
also included in the correlation analysis as they are of interest to consumers. The ascorbic
acid, TA, phenolic compounds, fructose, and glucose contents, as well as the mineral
concentrations of P, Zn, and Cu, showed no correlation with the fruit morphological
characteristics; hence, they are not depicted in Table 5.
Size- and weight-based fruit morphological traits generally correlated negatively
with most fruit minerals. For instance, pulp weight negatively correlated with the TSS,
protein, and all the mineral contents of the fruit. In contrast, pulp weight correlated positively
with the fruit water content. Fruit seediness positively correlated with the TSS, protein, Ca,
K, Mg, S, and B contents, but negatively with water content. The TSS content positively
correlated with the skin proportion of the fruits.
Table 5. Spearman correlation coefficients between fruit morphological characteristics and
fruit chemical and mineral composition from 105 guava trees summarized for all the
regions.
***Correlation is significant at p ≤ 0.001 level. **Correlation is significant at p ≤ 0.01 level. ns = correlation
was not significant at p ≤ 0.01 level. Only r ≥ 0.3 at p ≤ 0.01 values were considered as significant.
Fruit
morphological
characteristics
Fruit chemical and mineral composition
TSS protein K Ca Mg Na S B Fe Water
Fruit length ns ns ns -0.35*** ns ns ns ns ns ns
Fruit width ns ns -0.30** -0.48*** ns ns -0.31** ns -0.37*** ns
Fruit weight ns ns -0.34*** -0.52*** ns ns -0.31** ns -0.38*** ns
Pericarp
weight
ns ns -0.37*** -0.48*** ns ns -0.32** ns -0.35*** ns
Exocarp
weight
ns ns -0.33** -0.44*** ns ns ns ns -0.44*** ns
Mesocarp
weight
ns ns -0.33** -0.44*** ns ns ns ns ns ns
Pulp weight -0.39*** -0.39*** -0.32** -0.50*** -0.40*** -0.30** -0.33** -0.36*** -0.37*** 0.36***
Pericarp (%) 0.32** ns ns ns ns ns ns ns ns ns
Skin (%) 0.33** ns ns ns ns ns ns ns ns ns
Seed (%) 0.41*** 0.44*** 0.56*** 0.35*** 0.46*** ns 0.40*** 0.59*** ns -0.43***
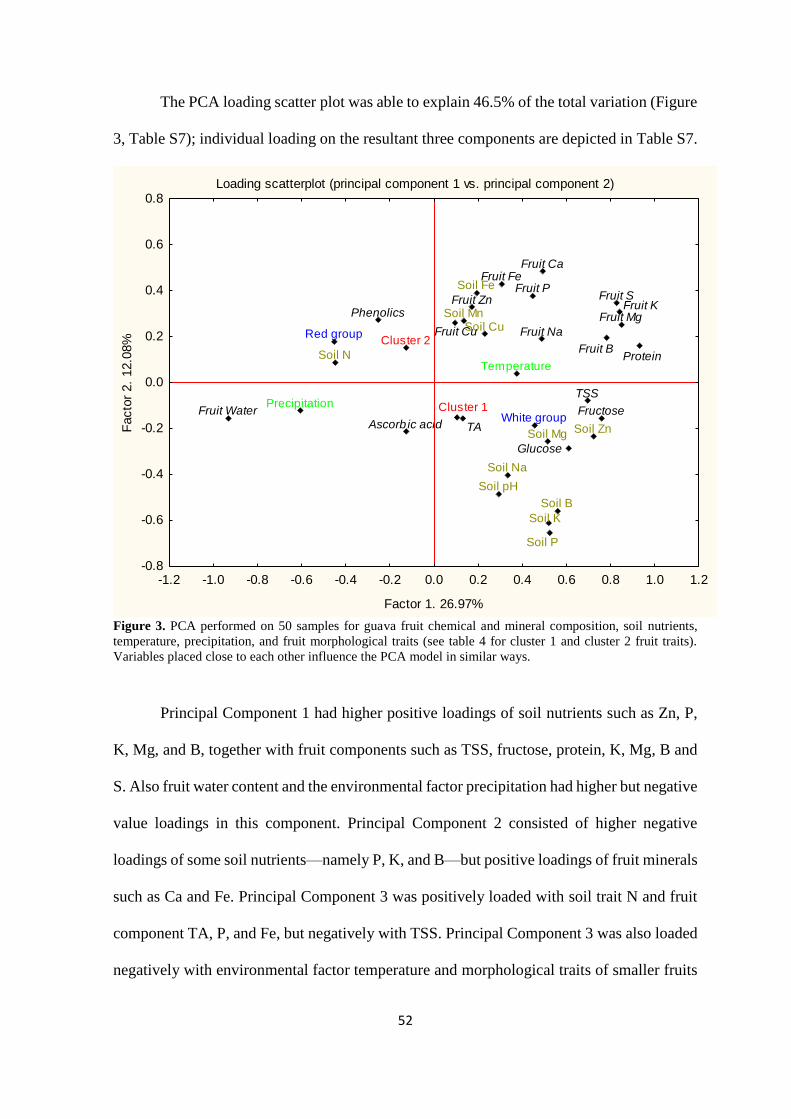
52
The PCA loading scatter plot was able to explain 46.5% of the total variation (Figure
3, Table S7); individual loading on the resultant three components are depicted in Table S7.
Loading scatterplot (principal component 1 vs. principal component 2)
Soil Mg
Soil pH
Soil B
Soil CuSoil Mn
Soil Fe
Soil Zn
Soil Na
Soil N
Ascorb ic acid
TSS
Phenolics
Fruit Ca
Fruit Mg
Fruit Na
Fruit PFruit SFruit Zn
Fructose
Fruit Fe
Fruit Water
Temperature
Precipitation
Cluster 2
White group
Red group
-1.2 -1.0 -0.8 -0.6 -0.4 -0.2 0.0 0.2 0.4 0.6 0.8 1.0 1.2
Factor 1. 26.97%
-0.8
-0.6
-0.4
-0.2
0.0
0.2
0.4
0.6
0.8
Facto
r 2.
12.0
8%
Soil P
Soil K
TA
Protein
Fruit K
Glucose
Fruit B
Fruit Cu
Cluster 1
Figure 3. PCA performed on 50 samples for guava fruit chemical and mineral composition, soil nutrients,
temperature, precipitation, and fruit morphological traits (see table 4 for cluster 1 and cluster 2 fruit traits).
Variables placed close to each other influence the PCA model in similar ways.
Principal Component 1 had higher positive loadings of soil nutrients such as Zn, P,
K, Mg, and B, together with fruit components such as TSS, fructose, protein, K, Mg, B and
S. Also fruit water content and the environmental factor precipitation had higher but negative
value loadings in this component. Principal Component 2 consisted of higher negative
loadings of some soil nutrients—namely P, K, and B—but positive loadings of fruit minerals
such as Ca and Fe. Principal Component 3 was positively loaded with soil trait N and fruit
component TA, P, and Fe, but negatively with TSS. Principal Component 3 was also loaded
negatively with environmental factor temperature and morphological traits of smaller fruits
53
(Cluster 1; see table S5), but positively with morphological traits of larger fruits (Cluster 2;
see table S5). In addition, this component was loaded negatively with the white-fleshed fruits
trait but positively with the red-fleshed fruits trait.
3.5. Discussion
3.5.1. The effect of temperature and precipitation on fruit chemical and mineral
composition
The mean ascorbic acid content of fruits from the 128 guava trees from four regions
of Kenya was 83.8 mg 100 g-1 FW. According to food composition tables, the ascorbic acid
content of guava is estimated to be 228.3 mg 100 g-1 edible portion (Lukmanji et al. 2008),
which is higher than the observed value in our sample. The observed differences could be
due to variation in determination methods and state of the sample at the time of analysis. The
samples in this study were partly transported over long distances to the laboratory and could
only be analysed for ascorbic acid content the following day. The highest recorded mean
value for ascorbic acid content was from the Eastern region (147.4 mg 100 g-1 FW), while
the least was from the Rift Valley region (52.9 mg 100 g-1 FW); however, wide ranges were
observed both within and among the regions. Based on mean annual temperature and total
annual precipitation data from WorldClim—Global Climate Data:
http://www.worldclim.org/bioclim; (Fick and Hijmans 2017) for individual accessions,
annual precipitation correlated positively with the ascorbic acid content of the fruits in this
study. However, the mean annual temperature correlated negatively but also insignificantly
(r < 0.3, P ≤ 0.01) with the ascorbic acid content. The effect of precipitation on ascorbic acid
content of guava has so far not been reported. However, Gull et al. (2012) determined the
ascorbic acid content in the pulp and peel of fully ripe guava fruits from three diverse regions
of Pakistan as ranging from 129.5 mg 100 g-1 to 247.9 mg 100 g-1. The ascorbic acid
composition of the fully ripe fruits was found to vary with the regions, with higher values

54
recorded in the higher-temperature regions (mean max./min.) air temperature: 35/24°C) than
in moderate and colder areas (mean max./min. air temperature: 33/21°C and 33/18°C,
respectively). The variation was attributed mainly to climatic and soil factors. Contrarily,
Thaipong and Boonprakob (2005) found higher contents of ascorbic acid in the slightly
colder winter season (mean max./min. air temperature: 31.8/20.8°C) rather than in the hot
summer season (mean max./min. air temperature: 33.6/24.5°C) in guava fruits grown in
Thailand. The authors concluded that the effect of lower temperatures experienced in winter
during fruit development could not only retard the excessive loss of respiratory substrates
but also increase the translocation of photosynthates to other parts of the plant, including the
fruits. It should be noted that the mean annual temperature for individual accessions in the
present study (21.2°C), the mean minimum (16°C) and the mean maximum (23.7°C) are far
below that reported by Gull et al. (2012) and Thaipong and Boonprakob (2005), which
makes comparison of the results difficult. However, one may speculate that the cooling effect
and slightly lower temperatures associated with precipitation are a possible reason for the
positive correlation between ascorbic acid content and precipitation.
The observed TSS value in the present study (mean = 11.3% brix) is similar to that
reported by El-Sisy (2013) in eight-year-old guava genotypes growing under uniform
conditions for two seasons (ranging from 9.4% to 14.07%). El-Sisy (2013) recorded higher
values in the first season as opposed to the second season, although both were under a
uniform irrigation scheme, which points at the variation in temperature as among factors
influencing TSS. The TSS in the present study positively correlated with mean annual
temperature but negatively with annual precipitation. These results partly agree with those
of Thaipong and Boonprakob (2005), in which lower TSS values during the summer season
were attributed to the higher moisture content. However, the findings of Thaipong and
Boonprakob (2005) contrast with the positive correlation observed between temperature and
55
TSS in the present study. A possible explanation for the negative correlation of TSS with
precipitation could be the dilution effect, which is a result of higher soil moisture content
leading to more water uptake and, hence, to water accumulation in the fruits as also shown
by the positive correlation of fruit water content and precipitation (Table 2). In agreement
with the observations of the present study, and using a 14C tracer to compare the effects of
elevated temperature on sugar and acid accumulation in mandarin fruit grown under tunnel
house experiments, Marsh et al. (1999) reported a positive correlation between temperature
and TSS. Fruit labelling with 14C showed that rising canopy temperatures reduced the
amount of incoming photosynthates partitioned to citrate and increased that allocated to
sugars. A likely scenario could have also occurred in our study with guava.
The protein content of the guava fruit samples of the present study ranged from 0.24
g 100 g-1 to 1.16 g 100 g-1 FW with a mean of 0.53 g 100 g-1 FW, which is markedly lower
than that reported in the food composition tables (2.6 g 100 g-1 edible portion; Lukmanji et
al. 2008), possibly because freeze-dried samples were used in this study. Similar to TSS, the
protein content also positively correlated with the mean annual temperature but negatively
with the total annual precipitation. This trend was also observed with regard to most of the
fruit minerals which were also lower (possibly due to use of freeze-dried samples) than that
given in the food composition tables (except for Na and Fe) for Ca (18 mg 100 g-1), K (417
mg 100 g-1), Mg (22 mg 100 g-1), Na (2.0 mg100 g-1), P (40 mg 100 g-1), Fe (0.3 mg 100 g-
1), Zn (0.2 mg 100 g-1), and Cu (0.2 mg 100 g-1) (Lukmanji et al. 2008). There currently
appears to be no report on the relationship between climatic conditions and guava fruit
protein and mineral composition for comparison; however, the dilution effect as a result of
higher moisture content is also the likely reason for the negative correlation between
precipitation and these fruit components. This can also be confirmed by the positive
56
correlation between the fruit water content and annual precipitation. The observed positive
correlation with temperature requires further investigation.
3.5.2. Effect of soil nutrients on fruit chemical and mineral composition
Soil P positively and significantly correlated with the TSS contents of the fruits, as
well as positively though insignificantly with fructose and glucose contents. Although there
are no reports on the effect of P on guava sugar content, but higher sugar contents were
reported in tomato with both higher and lower concentrations of P (Fandi et al. 2010). P is a
key component in ATP synthesis. ATP is the principal energy-rich pyrophosphate required
for starch synthesis. This energy can also be transferred to other co-enzymes such as uridine
triphosphate and guanosine triphosphate which are required for sucrose and cellulose
synthesis (Marschner 2012). The role this plays in glucose synthesis could contribute to the
positive relationship between the P and TSS content of fruits such as guava. Consequently,
Mg and its interaction with P have been observed to affect the activity of ATPases, mediating
hydrolysis, and thus energy transfer (Marschner 2012). The positive correlation between soil
Mg with fruit fructose and glucose contents could be a result of such interactions; however,
more detailed studies are needed to confirm this.
Soil Zn content was also observed to increase the TSS and fructose contents of the
fruits in this study. Zn plays various physiological functions and acts as a co-factor in many
enzymatic reactions. It also has effects on photosynthesis, nucleic acid metabolism, and
protein biosynthesis (Alloway 2004); hence, it could have contributed to the enhancement
of the TSS and fructose levels in the present study.
3.5.3. Pulp colour influences chemical and mineral composition of guava fruits
The findings related to the fruit flesh colour depicted red-fleshed fruits as having
higher phenolic content than the white-fleshed types. The results of this study were in
agreement with those of Santos and Corrêa (2012), in which the pink- and red-fleshed guava
57
accessions recorded greater values for phenolic compound concentrations. In contrast,
Hassimotto et al. (2005) found higher phenolic content in white guava pulp than in red guava
pulp (160 vs. 124 mg 100 g-1 FW, respectively). Phenolic compounds are classified as
phenolic acids, stilbenes, flavonoids, lignans, and tannins (Naczk and Shahidi 2004).
Flavonoids account for the majority of the dietary phenols (Robbins 2003) and constitute
most of the yellow, red, and blue colours in fruits (Lampila et al. 2009). A particular colour
of guava flesh is therefore likely to reflect the accumulation of the respective flavonoid in
the fruit and, hence, the phenolic content. Phenolic compounds have been reported to be
affected by many other factors, among them variety, cultivation, species, area, and climatic
conditions (Iqbal and Bhanger 2006; Wang and Lin 2000). These factors act in an interactive
way; therefore, more focused studies on determining the contribution of flesh colour to the
phenolic content of guava may be required.
The occurrence of flavonoids have been reported to also vary with the cultivars
(Flores et al. 2015; Wang and Lin 2000) – thus could indicate genotypic variation among
accessions of guava. Flavonoids have also been connected with various plant functions,
including photosynthesis (Ampomah-Dwamena et al. 2015) and nutrient uptake.
Accordingly, we found that the white-fleshed guavas accumulated more TSS and fructose
than the red-fleshed types, which is in agreement with Choudhary et al. (2012) who studied
the chemical composition of four guava cultivars under similar cultural conditions and found
variations in TSS and non-reducing sugars, that were attributed partly to the variety of the
fruit. Moreover, we also observed that the white-fleshed guava fruits accumulated more
protein and some minerals (K, Mg, Na, S, and B), than the red-fleshed fruits. The variation
in the accumulation of minerals in the fruit, such as K, Mg, S, and B, support the observation
by Natale et al. (2002, 2007) that different guava cultivars vary in their nutrient uptake.
58
3.5.4. Larger and heavier fruits negatively correlate with their chemical and mineral
composition
The size- and weight-based fruit traits correlated negatively with TSS, protein, and
most fruit mineral contents. Fruits with higher pulp weight negatively correlated with TSS.
In this regard, the results of the present study were similar to those of Thaipong and
Boonprakob (2005)—larger fruits resulted in lower TSS and total sugar content in guava.
Mehmood et al. (2014) and Singh et al. (2015) also reported poor accumulation of chemical
compounds in large guava fruits, including TSS. Similarly, negative observations of fruit
size and weight with TSS were observed during guava selection and breeding (Dinesh and
Yadav 1998), in which the genotypic correlation was lower than the phenotypic correlation
for TSS—thus, indicating greater effect of fruit size- and weight-based traits plus external
factors, as soil and environment, affecting TSS. Accordingly, pulp weight positively
correlated with the fruit water content—an indication that much of the juicy pulp core in
large fruits mainly consisted of water. This could be confirmed by the positive correlation
between the pericarp and skin proportions with TSS, implying a higher dilution effect of
TSS in the pulp core but not or less in the peel portion.
In addition, the pulp weight of the fruits was negatively correlated with the fruit
protein content and most of the minerals (K, Ca, Mg, Na, S, B, and Fe). Similarly, negative
correlations were also observed between fruit weight-based traits and some fruit minerals
mainly K, Ca, S, and Fe. Ca was also negatively correlated with fruit length and width, while
K, S, and Fe showed negative correlations with fruit width. These negative correlations could
still be attributed to the dilution effect of increasing fruit size on fruit mineral accumulation,
as was also observed by Singh et al. (2015), Mehmood et al. (2014), and Dinesh and Yadav
(1998) in guava. It was notable that seed proportion correlated positively with most of the
fruit mineral and chemical constituents and negatively with fruit water content. One may
assume that increased seed proportion is likely to take up the position of water in the fruit
59
pulp, thus reducing water accumulation in the pulp core of guava fruit, as evidenced by the
negative correlation observed between seed proportion and fruit water content. Reduced
water in the pulp core implies a reduced dilution effect for the fruit minerals and chemicals
in the pulp. The lack of a significant correlation based on pericarp and skin proportions with
most fruit minerals affirms that, unlike TSS, some minerals such as K, Ca, and Fe are likely
to be evenly distributed within guava fruit. This is also confirmed by the observed negative
correlations of the various fruit parts with some minerals—unlike the case of TSS which
only negatively correlated with pulp weight. However, further research is necessary to
ascertain this finding.
In conclusion, the ascorbic acid content positively correlated with annual
precipitation. TSS positively correlated with temperature and soil P and Zn, and was also
found to be higher in white-fleshed fruits and fruits having lower pulp weight and more
seeds. The red-fleshed fruits contained more phenolic content than the white-fleshed types,
while the white-fleshed fruits had more of TSS, protein, and some minerals. Larger fruits
were generally observed to have a dilution effect on the fruit mineral content. Generally,
most of the correlations were not strong, implying that more than just the studied factors
influence the nutritional and chemical content of guava.
The relationship between climatic data on fruit traits such as ascorbic acid and TSS
could help in the choice of guava production regions that maximize on these chemical
components. The flesh colour of fruits provides the information necessary for the selection
of fruits for various purposes—for example, sweeter white-fleshed fruits with more mineral
content could be preferred for fresh consumption; larger, less sweet fruits with lower mineral
content could be preferred for industrial processing. The positive role of soil elements such
as P and Zn in enhancing fruit traits such as TSS and sugars could help in the establishment
of a fertilizer regime that maximizes the respective fruit quality traits.
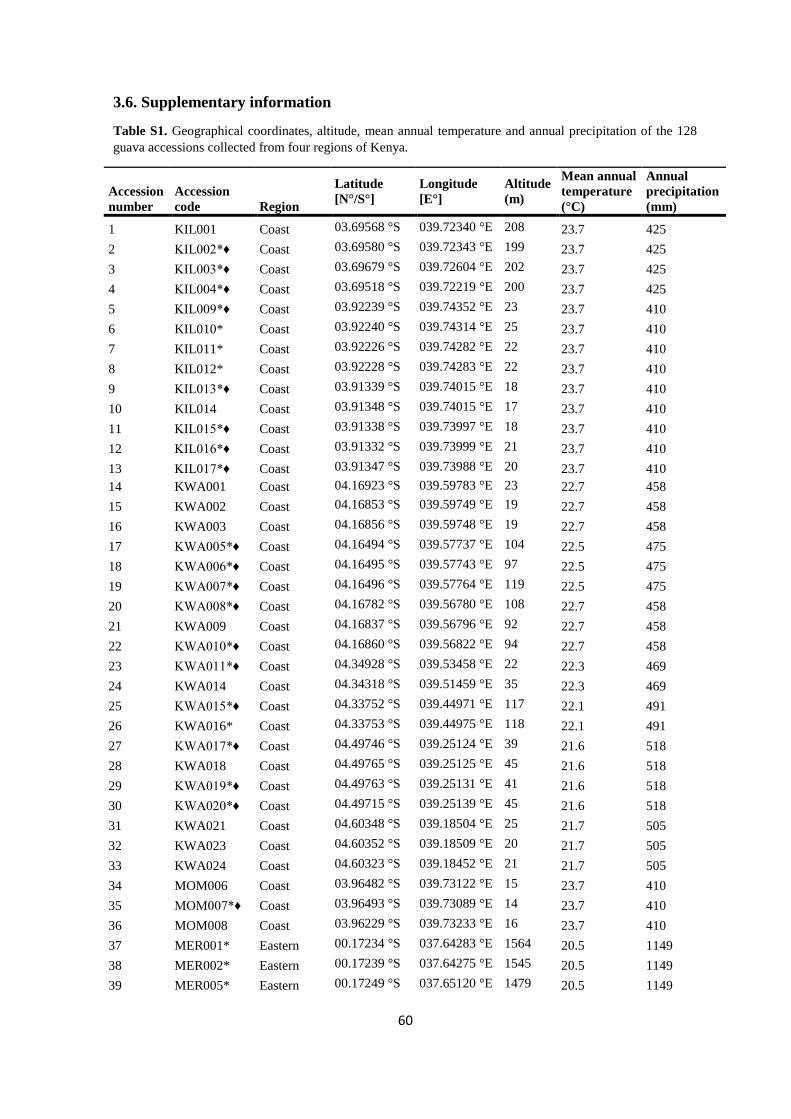
60
3.6. Supplementary information
Table S1. Geographical coordinates, altitude, mean annual temperature and annual precipitation of the 128
guava accessions collected from four regions of Kenya.
Accession
number
Accession
code Region
Latitude
[N°/S°]
Longitude
[E°]
Altitude
(m)
Mean annual
temperature
(°C)
Annual
precipitation
(mm)
1 KIL001 Coast 03.69568 °S 039.72340 °E 208 23.7 425
2 KIL002*♦ Coast 03.69580 °S 039.72343 °E 199 23.7 425
3 KIL003*♦ Coast 03.69679 °S 039.72604 °E 202 23.7 425
4 KIL004*♦ Coast 03.69518 °S 039.72219 °E 200 23.7 425
5 KIL009*♦ Coast 03.92239 °S 039.74352 °E 23 23.7 410
6 KIL010* Coast 03.92240 °S 039.74314 °E 25 23.7 410
7 KIL011* Coast 03.92226 °S 039.74282 °E 22 23.7 410
8 KIL012* Coast 03.92228 °S 039.74283 °E 22 23.7 410
9 KIL013*♦ Coast 03.91339 °S 039.74015 °E 18 23.7 410
10 KIL014 Coast 03.91348 °S 039.74015 °E 17 23.7 410
11 KIL015*♦ Coast 03.91338 °S 039.73997 °E 18 23.7 410
12 KIL016*♦ Coast 03.91332 °S 039.73999 °E 21 23.7 410
13 KIL017*♦ Coast 03.91347 °S 039.73988 °E 20 23.7 410
14 KWA001 Coast 04.16923 °S 039.59783 °E 23 22.7 458
15 KWA002 Coast 04.16853 °S 039.59749 °E 19 22.7 458
16 KWA003 Coast 04.16856 °S 039.59748 °E 19 22.7 458
17 KWA005*♦ Coast 04.16494 °S 039.57737 °E 104 22.5 475
18 KWA006*♦ Coast 04.16495 °S 039.57743 °E 97 22.5 475
19 KWA007*♦ Coast 04.16496 °S 039.57764 °E 119 22.5 475
20 KWA008*♦ Coast 04.16782 °S 039.56780 °E 108 22.7 458
21 KWA009 Coast 04.16837 °S 039.56796 °E 92 22.7 458
22 KWA010*♦ Coast 04.16860 °S 039.56822 °E 94 22.7 458
23 KWA011*♦ Coast 04.34928 °S 039.53458 °E 22 22.3 469
24 KWA014 Coast 04.34318 °S 039.51459 °E 35 22.3 469
25 KWA015*♦ Coast 04.33752 °S 039.44971 °E 117 22.1 491
26 KWA016* Coast 04.33753 °S 039.44975 °E 118 22.1 491
27 KWA017*♦ Coast 04.49746 °S 039.25124 °E 39 21.6 518
28 KWA018 Coast 04.49765 °S 039.25125 °E 45 21.6 518
29 KWA019*♦ Coast 04.49763 °S 039.25131 °E 41 21.6 518
30 KWA020*♦ Coast 04.49715 °S 039.25139 °E 45 21.6 518
31 KWA021 Coast 04.60348 °S 039.18504 °E 25 21.7 505
32 KWA023 Coast 04.60352 °S 039.18509 °E 20 21.7 505
33 KWA024 Coast 04.60323 °S 039.18452 °E 21 21.7 505
34 MOM006 Coast 03.96482 °S 039.73122 °E 15 23.7 410
35 MOM007*♦ Coast 03.96493 °S 039.73089 °E 14 23.7 410
36 MOM008 Coast 03.96229 °S 039.73233 °E 16 23.7 410
37 MER001* Eastern 00.17234 °S 037.64283 °E 1564 20.5 1149
38 MER002* Eastern 00.17239 °S 037.64275 °E 1545 20.5 1149
39 MER005* Eastern 00.17249 °S 037.65120 °E 1479 20.5 1149
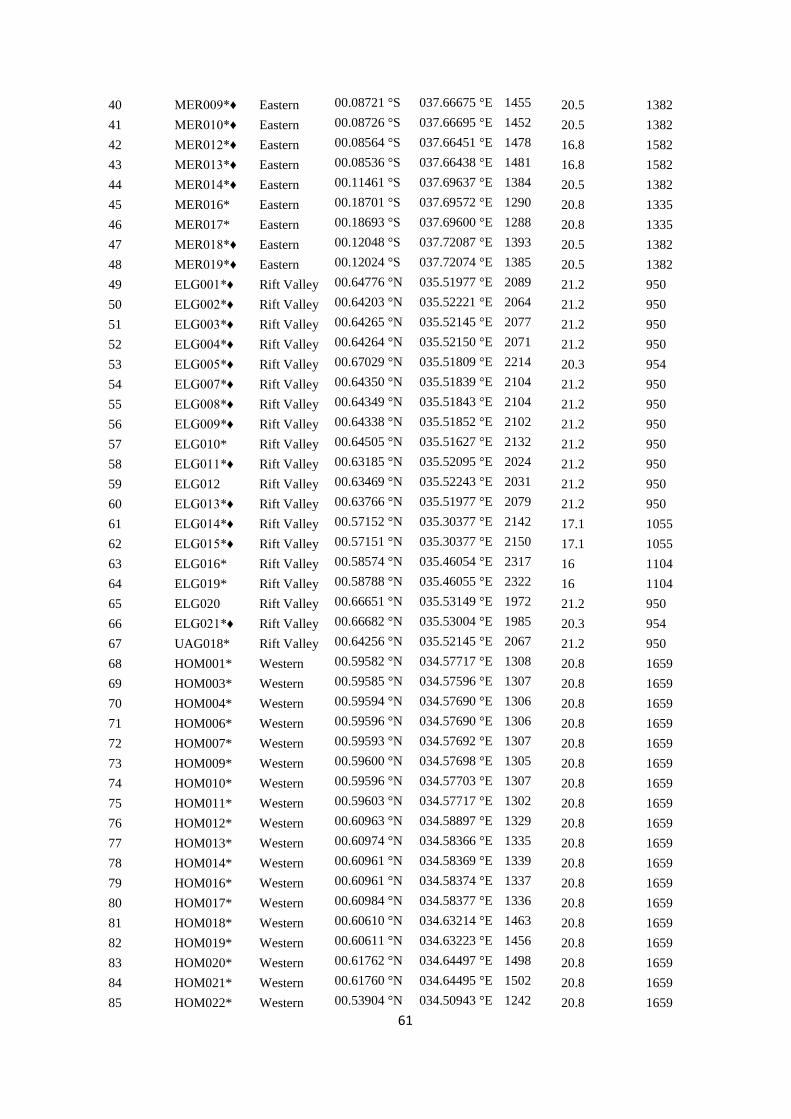
61
40 MER009*♦ Eastern 00.08721 °S 037.66675 °E 1455 20.5 1382
41 MER010*♦ Eastern 00.08726 °S 037.66695 °E 1452 20.5 1382
42 MER012*♦ Eastern 00.08564 °S 037.66451 °E 1478 16.8 1582
43 MER013*♦ Eastern 00.08536 °S 037.66438 °E 1481 16.8 1582
44 MER014*♦ Eastern 00.11461 °S 037.69637 °E 1384 20.5 1382
45 MER016* Eastern 00.18701 °S 037.69572 °E 1290 20.8 1335
46 MER017* Eastern 00.18693 °S 037.69600 °E 1288 20.8 1335
47 MER018*♦ Eastern 00.12048 °S 037.72087 °E 1393 20.5 1382
48 MER019*♦ Eastern 00.12024 °S 037.72074 °E 1385 20.5 1382
49 ELG001*♦ Rift Valley 00.64776 °N 035.51977 °E 2089 21.2 950
50 ELG002*♦ Rift Valley 00.64203 °N 035.52221 °E 2064 21.2 950
51 ELG003*♦ Rift Valley 00.64265 °N 035.52145 °E 2077 21.2 950
52 ELG004*♦ Rift Valley 00.64264 °N 035.52150 °E 2071 21.2 950
53 ELG005*♦ Rift Valley 00.67029 °N 035.51809 °E 2214 20.3 954
54 ELG007*♦ Rift Valley 00.64350 °N 035.51839 °E 2104 21.2 950
55 ELG008*♦ Rift Valley 00.64349 °N 035.51843 °E 2104 21.2 950
56 ELG009*♦ Rift Valley 00.64338 °N 035.51852 °E 2102 21.2 950
57 ELG010* Rift Valley 00.64505 °N 035.51627 °E 2132 21.2 950
58 ELG011*♦ Rift Valley 00.63185 °N 035.52095 °E 2024 21.2 950
59 ELG012 Rift Valley 00.63469 °N 035.52243 °E 2031 21.2 950
60 ELG013*♦ Rift Valley 00.63766 °N 035.51977 °E 2079 21.2 950
61 ELG014*♦ Rift Valley 00.57152 °N 035.30377 °E 2142 17.1 1055
62 ELG015*♦ Rift Valley 00.57151 °N 035.30377 °E 2150 17.1 1055
63 ELG016* Rift Valley 00.58574 °N 035.46054 °E 2317 16 1104
64 ELG019* Rift Valley 00.58788 °N 035.46055 °E 2322 16 1104
65 ELG020 Rift Valley 00.66651 °N 035.53149 °E 1972 21.2 950
66 ELG021*♦ Rift Valley 00.66682 °N 035.53004 °E 1985 20.3 954
67 UAG018* Rift Valley 00.64256 °N 035.52145 °E 2067 21.2 950
68 HOM001* Western 00.59582 °N 034.57717 °E 1308 20.8 1659
69 HOM003* Western 00.59585 °N 034.57596 °E 1307 20.8 1659
70 HOM004* Western 00.59594 °N 034.57690 °E 1306 20.8 1659
71 HOM006* Western 00.59596 °N 034.57690 °E 1306 20.8 1659
72 HOM007* Western 00.59593 °N 034.57692 °E 1307 20.8 1659
73 HOM009* Western 00.59600 °N 034.57698 °E 1305 20.8 1659
74 HOM010* Western 00.59596 °N 034.57703 °E 1307 20.8 1659
75 HOM011* Western 00.59603 °N 034.57717 °E 1302 20.8 1659
76 HOM012* Western 00.60963 °N 034.58897 °E 1329 20.8 1659
77 HOM013* Western 00.60974 °N 034.58366 °E 1335 20.8 1659
78 HOM014* Western 00.60961 °N 034.58369 °E 1339 20.8 1659
79 HOM016* Western 00.60961 °N 034.58374 °E 1337 20.8 1659
80 HOM017* Western 00.60984 °N 034.58377 °E 1336 20.8 1659
81 HOM018* Western 00.60610 °N 034.63214 °E 1463 20.8 1659
82 HOM019* Western 00.60611 °N 034.63223 °E 1456 20.8 1659
83 HOM020* Western 00.61762 °N 034.64497 °E 1498 20.8 1659
84 HOM021* Western 00.61760 °N 034.64495 °E 1502 20.8 1659
85 HOM022* Western 00.53904 °N 034.50943 °E 1242 20.8 1659
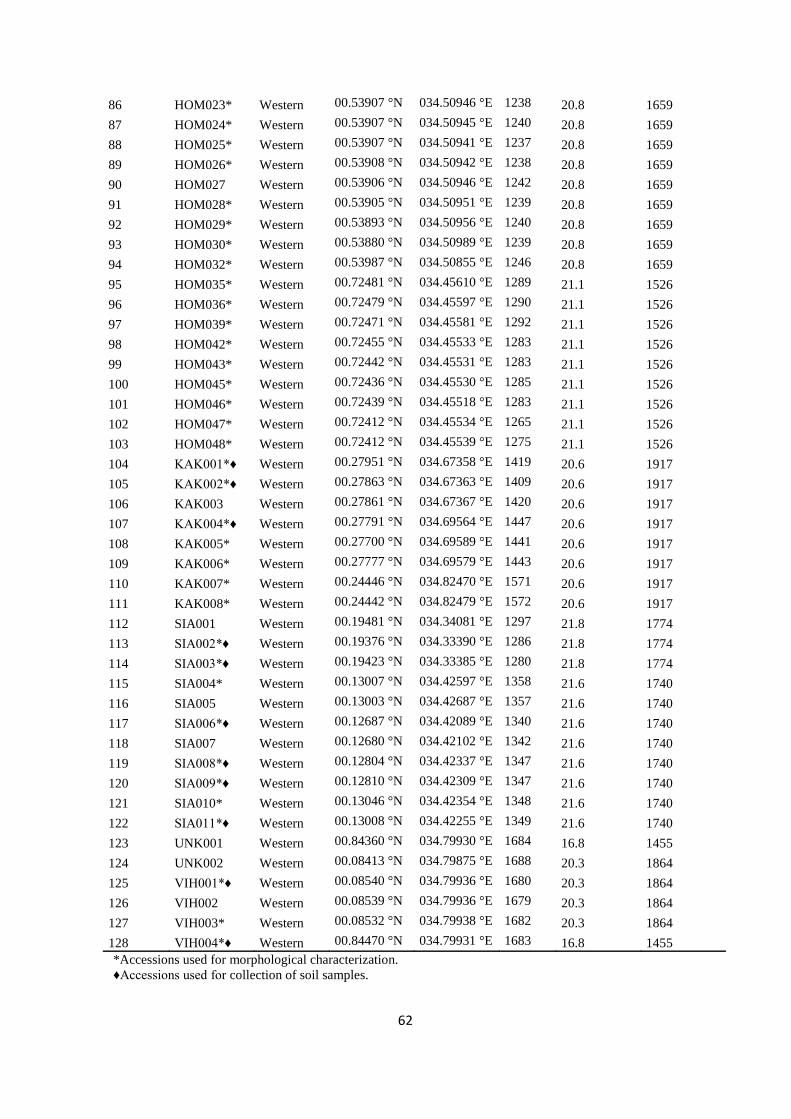
62
86 HOM023* Western 00.53907 °N 034.50946 °E 1238 20.8 1659
87 HOM024* Western 00.53907 °N 034.50945 °E 1240 20.8 1659
88 HOM025* Western 00.53907 °N 034.50941 °E 1237 20.8 1659
89 HOM026* Western 00.53908 °N 034.50942 °E 1238 20.8 1659
90 HOM027 Western 00.53906 °N 034.50946 °E 1242 20.8 1659
91 HOM028* Western 00.53905 °N 034.50951 °E 1239 20.8 1659
92 HOM029* Western 00.53893 °N 034.50956 °E 1240 20.8 1659
93 HOM030* Western 00.53880 °N 034.50989 °E 1239 20.8 1659
94 HOM032* Western 00.53987 °N 034.50855 °E 1246 20.8 1659
95 HOM035* Western 00.72481 °N 034.45610 °E 1289 21.1 1526
96 HOM036* Western 00.72479 °N 034.45597 °E 1290 21.1 1526
97 HOM039* Western 00.72471 °N 034.45581 °E 1292 21.1 1526
98 HOM042* Western 00.72455 °N 034.45533 °E 1283 21.1 1526
99 HOM043* Western 00.72442 °N 034.45531 °E 1283 21.1 1526
100 HOM045* Western 00.72436 °N 034.45530 °E 1285 21.1 1526
101 HOM046* Western 00.72439 °N 034.45518 °E 1283 21.1 1526
102 HOM047* Western 00.72412 °N 034.45534 °E 1265 21.1 1526
103 HOM048* Western 00.72412 °N 034.45539 °E 1275 21.1 1526
104 KAK001*♦ Western 00.27951 °N 034.67358 °E 1419 20.6 1917
105 KAK002*♦ Western 00.27863 °N 034.67363 °E 1409 20.6 1917
106 KAK003 Western 00.27861 °N 034.67367 °E 1420 20.6 1917
107 KAK004*♦ Western 00.27791 °N 034.69564 °E 1447 20.6 1917
108 KAK005* Western 00.27700 °N 034.69589 °E 1441 20.6 1917
109 KAK006* Western 00.27777 °N 034.69579 °E 1443 20.6 1917
110 KAK007* Western 00.24446 °N 034.82470 °E 1571 20.6 1917
111 KAK008* Western 00.24442 °N 034.82479 °E 1572 20.6 1917
112 SIA001 Western 00.19481 °N 034.34081 °E 1297 21.8 1774
113 SIA002*♦ Western 00.19376 °N 034.33390 °E 1286 21.8 1774
114 SIA003*♦ Western 00.19423 °N 034.33385 °E 1280 21.8 1774
115 SIA004* Western 00.13007 °N 034.42597 °E 1358 21.6 1740
116 SIA005 Western 00.13003 °N 034.42687 °E 1357 21.6 1740
117 SIA006*♦ Western 00.12687 °N 034.42089 °E 1340 21.6 1740
118 SIA007 Western 00.12680 °N 034.42102 °E 1342 21.6 1740
119 SIA008*♦ Western 00.12804 °N 034.42337 °E 1347 21.6 1740
120 SIA009*♦ Western 00.12810 °N 034.42309 °E 1347 21.6 1740
121 SIA010* Western 00.13046 °N 034.42354 °E 1348 21.6 1740
122 SIA011*♦ Western 00.13008 °N 034.42255 °E 1349 21.6 1740
123 UNK001 Western 00.84360 °N 034.79930 °E 1684 16.8 1455
124 UNK002 Western 00.08413 °N 034.79875 °E 1688 20.3 1864
125 VIH001*♦ Western 00.08540 °N 034.79936 °E 1680 20.3 1864
126 VIH002 Western 00.08539 °N 034.79936 °E 1679 20.3 1864
127 VIH003* Western 00.08532 °N 034.79938 °E 1682 20.3 1864
128 VIH004*♦ Western 00.84470 °N 034.79931 °E 1683 16.8 1455
*Accessions used for morphological characterization.
♦Accessions used for collection of soil samples.
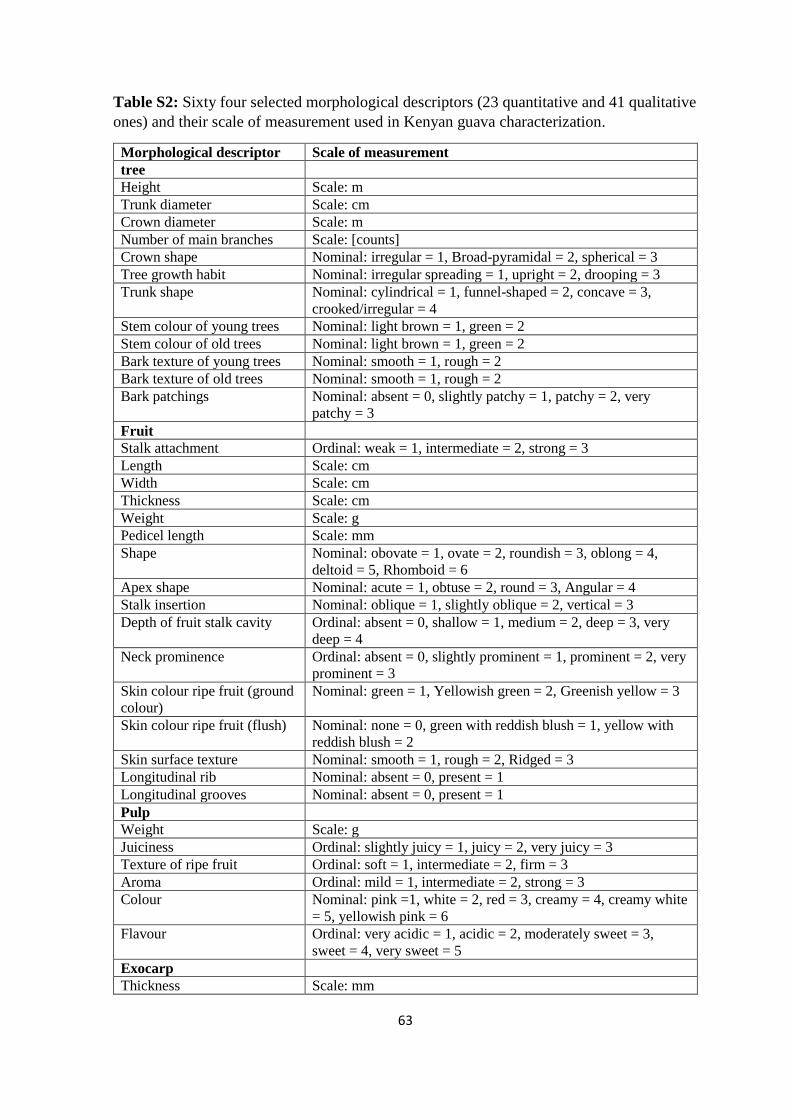
63
Table S2: Sixty four selected morphological descriptors (23 quantitative and 41 qualitative
ones) and their scale of measurement used in Kenyan guava characterization.
Morphological descriptor Scale of measurement
tree
Height Scale: m
Trunk diameter Scale: cm
Crown diameter Scale: m
Number of main branches Scale: [counts]
Crown shape Nominal: irregular = 1, Broad-pyramidal = 2, spherical = 3
Tree growth habit Nominal: irregular spreading = 1, upright = 2, drooping = 3
Trunk shape Nominal: cylindrical = 1, funnel-shaped = 2, concave = 3,
crooked/irregular = 4
Stem colour of young trees Nominal: light brown = 1, green = 2
Stem colour of old trees Nominal: light brown = 1, green = 2
Bark texture of young trees Nominal: smooth = 1, rough = 2
Bark texture of old trees Nominal: smooth = 1, rough = 2
Bark patchings Nominal: absent = 0, slightly patchy = 1, patchy = 2, very
patchy = 3
Fruit
Stalk attachment Ordinal: weak = 1, intermediate = 2, strong = 3
Length Scale: cm
Width Scale: cm
Thickness Scale: cm
Weight Scale: g
Pedicel length Scale: mm
Shape Nominal: obovate = 1, ovate = 2, roundish = 3, oblong = 4,
deltoid = 5, Rhomboid = 6
Apex shape Nominal: acute = 1, obtuse = 2, round = 3, Angular = 4
Stalk insertion Nominal: oblique = 1, slightly oblique = 2, vertical = 3
Depth of fruit stalk cavity Ordinal: absent = 0, shallow = 1, medium = 2, deep = 3, very
deep = 4
Neck prominence Ordinal: absent = 0, slightly prominent = 1, prominent = 2, very
prominent = 3
Skin colour ripe fruit (ground
colour)
Nominal: green = 1, Yellowish green = 2, Greenish yellow = 3
Skin colour ripe fruit (flush) Nominal: none = 0, green with reddish blush = 1, yellow with
reddish blush = 2
Skin surface texture Nominal: smooth = 1, rough = 2, Ridged = 3
Longitudinal rib Nominal: absent = 0, present = 1
Longitudinal grooves Nominal: absent = 0, present = 1
Pulp
Weight Scale: g
Juiciness Ordinal: slightly juicy = 1, juicy = 2, very juicy = 3
Texture of ripe fruit Ordinal: soft = 1, intermediate = 2, firm = 3
Aroma Ordinal: mild = 1, intermediate = 2, strong = 3
Colour Nominal: pink =1, white = 2, red = 3, creamy = 4, creamy white
= 5, yellowish pink = 6
Flavour Ordinal: very acidic = 1, acidic = 2, moderately sweet = 3,
sweet = 4, very sweet = 5
Exocarp
Thickness Scale: mm
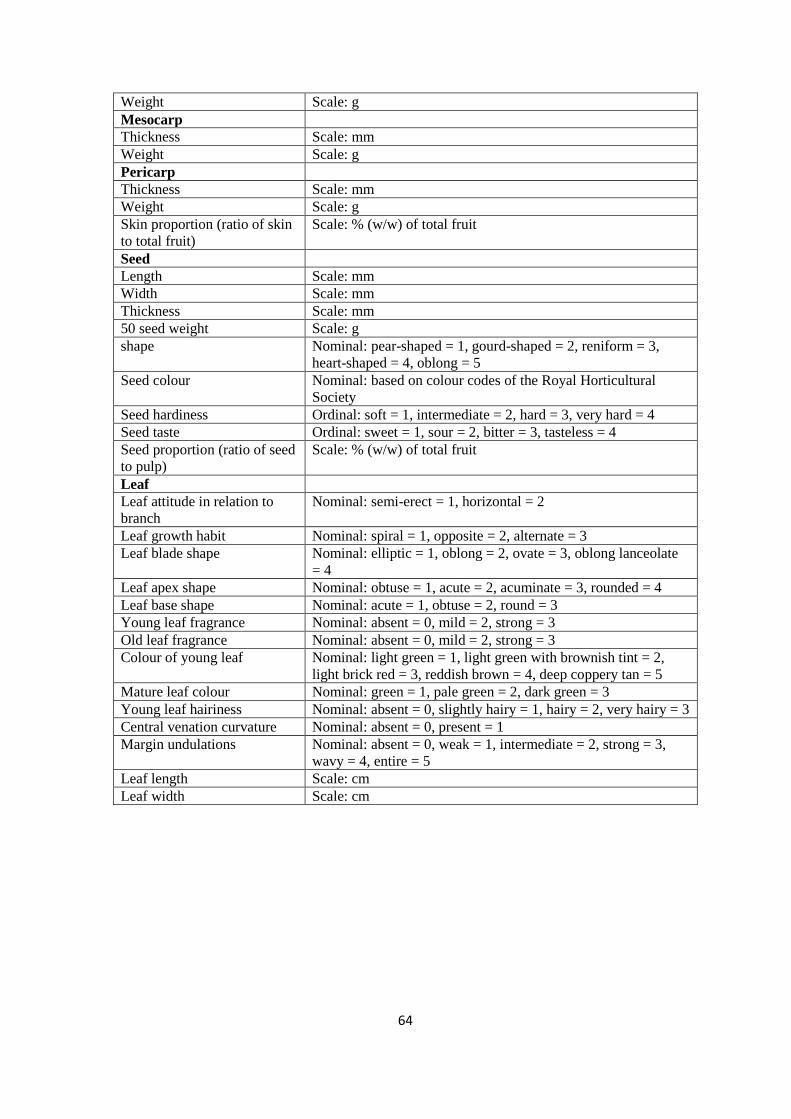
64
Weight Scale: g
Mesocarp
Thickness Scale: mm
Weight Scale: g
Pericarp
Thickness Scale: mm
Weight Scale: g
Skin proportion (ratio of skin
to total fruit)
Scale: % (w/w) of total fruit
Seed
Length Scale: mm
Width Scale: mm
Thickness Scale: mm
50 seed weight Scale: g
shape Nominal: pear-shaped = 1, gourd-shaped = 2, reniform = 3,
heart-shaped = 4, oblong = 5
Seed colour Nominal: based on colour codes of the Royal Horticultural
Society
Seed hardiness Ordinal: soft = 1, intermediate = 2, hard = 3, very hard = 4
Seed taste Ordinal: sweet = 1, sour = 2, bitter = 3, tasteless = 4
Seed proportion (ratio of seed
to pulp)
Scale: % (w/w) of total fruit
Leaf
Leaf attitude in relation to
branch
Nominal: semi-erect = 1, horizontal = 2
Leaf growth habit Nominal: spiral = 1, opposite = 2, alternate = 3
Leaf blade shape Nominal: elliptic = 1, oblong = 2, ovate = 3, oblong lanceolate
= 4
Leaf apex shape Nominal: obtuse = 1, acute = 2, acuminate = 3, rounded = 4
Leaf base shape Nominal: acute = 1, obtuse = 2, round = 3
Young leaf fragrance Nominal: absent = 0, mild = 2, strong = 3
Old leaf fragrance Nominal: absent = 0, mild = 2, strong = 3
Colour of young leaf Nominal: light green = 1, light green with brownish tint = 2,
light brick red = 3, reddish brown = 4, deep coppery tan = 5
Mature leaf colour Nominal: green = 1, pale green = 2, dark green = 3
Young leaf hairiness Nominal: absent = 0, slightly hairy = 1, hairy = 2, very hairy = 3
Central venation curvature Nominal: absent = 0, present = 1
Margin undulations Nominal: absent = 0, weak = 1, intermediate = 2, strong = 3,
wavy = 4, entire = 5
Leaf length Scale: cm
Leaf width Scale: cm
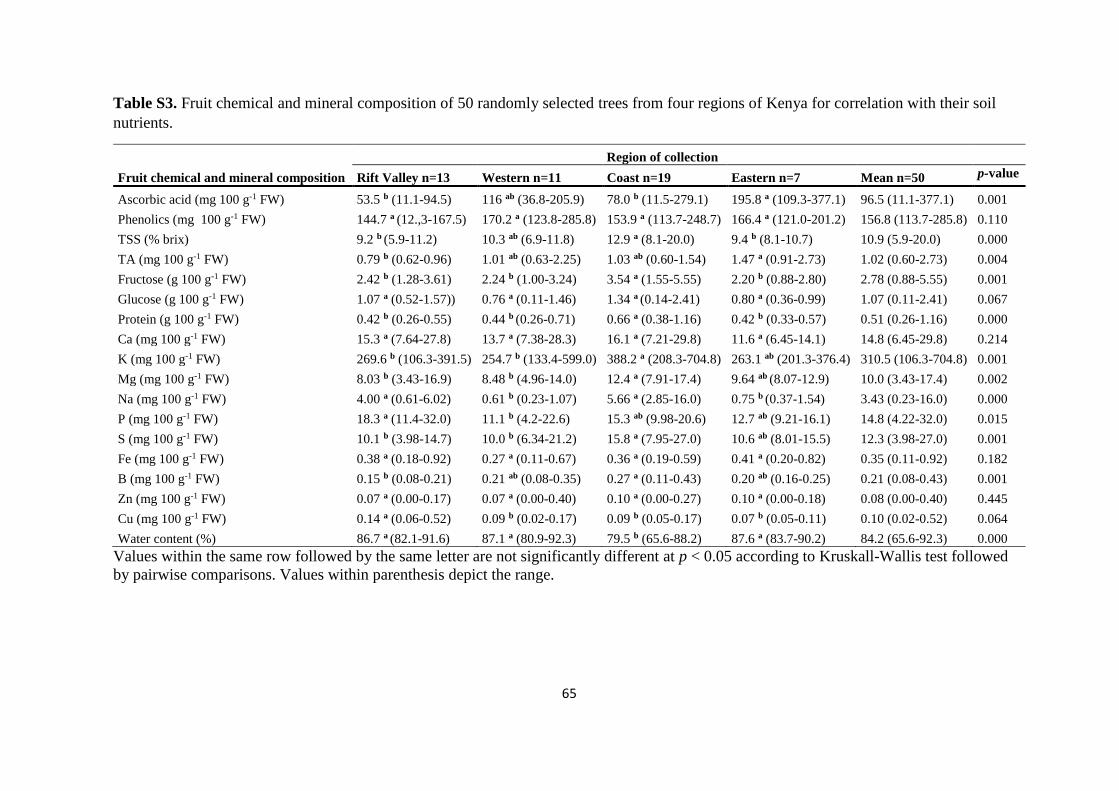
65
Table S3. Fruit chemical and mineral composition of 50 randomly selected trees from four regions of Kenya for correlation with their soil
nutrients.
Region of collection
Fruit chemical and mineral composition Rift Valley n=13 Western n=11 Coast n=19 Eastern n=7 Mean n=50 p-value
Ascorbic acid (mg 100 g-1 FW) 53.5 b (11.1-94.5) 116 ab (36.8-205.9) 78.0 b (11.5-279.1) 195.8 a (109.3-377.1) 96.5 (11.1-377.1) 0.001
Phenolics (mg 100 g-1 FW) 144.7 a (12.,3-167.5) 170.2 a (123.8-285.8) 153.9 a (113.7-248.7) 166.4 a (121.0-201.2) 156.8 (113.7-285.8) 0.110
TSS (% brix) 9.2 b (5.9-11.2) 10.3 ab (6.9-11.8) 12.9 a (8.1-20.0) 9.4 b (8.1-10.7) 10.9 (5.9-20.0) 0.000
TA (mg 100 g-1 FW) 0.79 b (0.62-0.96) 1.01 ab (0.63-2.25) 1.03 ab (0.60-1.54) 1.47 a (0.91-2.73) 1.02 (0.60-2.73) 0.004
Fructose (g 100 g-1 FW) 2.42 b (1.28-3.61) 2.24 b (1.00-3.24) 3.54 a (1.55-5.55) 2.20 b (0.88-2.80) 2.78 (0.88-5.55) 0.001
Glucose (g 100 g-1 FW) 1.07 a (0.52-1.57)) 0.76 a (0.11-1.46) 1.34 a (0.14-2.41) 0.80 a (0.36-0.99) 1.07 (0.11-2.41) 0.067
Protein (g 100 g-1 FW) 0.42 b (0.26-0.55) 0.44 b (0.26-0.71) 0.66 a (0.38-1.16) 0.42 b (0.33-0.57) 0.51 (0.26-1.16) 0.000
Ca (mg 100 g-1 FW) 15.3 a (7.64-27.8) 13.7 a (7.38-28.3) 16.1 a (7.21-29.8) 11.6 a (6.45-14.1) 14.8 (6.45-29.8) 0.214
K (mg 100 g-1 FW) 269.6 b (106.3-391.5) 254.7 b (133.4-599.0) 388.2 a (208.3-704.8) 263.1 ab (201.3-376.4) 310.5 (106.3-704.8) 0.001
Mg (mg 100 g-1 FW) 8.03 b (3.43-16.9) 8.48 b (4.96-14.0) 12.4 a (7.91-17.4) 9.64 ab (8.07-12.9) 10.0 (3.43-17.4) 0.002
Na (mg 100 g-1 FW) 4.00 a (0.61-6.02) 0.61 b (0.23-1.07) 5.66 a (2.85-16.0) 0.75 b (0.37-1.54) 3.43 (0.23-16.0) 0.000
P (mg 100 g-1 FW) 18.3 a (11.4-32.0) 11.1 b (4.2-22.6) 15.3 ab (9.98-20.6) 12.7 ab (9.21-16.1) 14.8 (4.22-32.0) 0.015
S (mg 100 g-1 FW) 10.1 b (3.98-14.7) 10.0 b (6.34-21.2) 15.8 a (7.95-27.0) 10.6 ab (8.01-15.5) 12.3 (3.98-27.0) 0.001
Fe (mg 100 g-1 FW) 0.38 a (0.18-0.92) 0.27 a (0.11-0.67) 0.36 a (0.19-0.59) 0.41 a (0.20-0.82) 0.35 (0.11-0.92) 0.182
B (mg 100 g-1 FW) 0.15 b (0.08-0.21) 0.21 ab (0.08-0.35) 0.27 a (0.11-0.43) 0.20 ab (0.16-0.25) 0.21 (0.08-0.43) 0.001
Zn (mg 100 g-1 FW) 0.07 a (0.00-0.17) 0.07 a (0.00-0.40) 0.10 a (0.00-0.27) 0.10 a (0.00-0.18) 0.08 (0.00-0.40) 0.445
Cu (mg 100 g-1 FW) 0.14 a (0.06-0.52) 0.09 b (0.02-0.17) 0.09 b (0.05-0.17) 0.07 b (0.05-0.11) 0.10 (0.02-0.52) 0.064
Water content (%) 86.7 a (82.1-91.6) 87.1 a (80.9-92.3) 79.5 b (65.6-88.2) 87.6 a (83.7-90.2) 84.2 (65.6-92.3) 0.000
Values within the same row followed by the same letter are not significantly different at p < 0.05 according to Kruskall-Wallis test followed
by pairwise comparisons. Values within parenthesis depict the range.

66
Table S4. Soil pH and nutrients of 50 soil samples collected under guava trees from four regions of Kenya.
Region
soil content Rift Valley n=13 Western n=11 Coast n=19 Eastern n=7 Mean n=50 p-value
pH 5.96 a (4.83-7.01) 5.66 a (4.33-7.20) 6.10 a (4.63-7.98) 6.10 a (5.36-7.27) 5.97 (4.33-7.98) 0.625
N (%) 0.23 a (0.14-0.43) 0.15 a (0.08-0.26) 0.07 b (0.03-0.24) 0.20 a (0.11-0.32) 0.15 (0.03-0.43) 0.000
C (%) 2.97 a (1.57-5.70) 1.62 ab (0.80-2.81) 0.90 b (0.44-2.37) 2.12 a (1.15-3.82) 1.77 (0.44-5.70 0.000
C/N ratio 13.0 a (9.5-17.4) 10.6 b (8.8-12.5) 12.4 ab (9.7-14.8) 10.5 b (9.5-11.8) 11.9 (8.8-17.4) 0.002
P2O5 (mg kg-1) 21.5 b (0.83-97.9) 19.9 b (2.00-69.0) 101.1 a (1.38-841.6) 48.5 ab (11.1-88.2) 55.2 (0.83-841.6) 0.030
K2O (mg kg-1) 138.3 b (10.4-374.7) 283.0 ab (11.0-956.1) 656.8 a (4.17-4590) 487.1 a (285.2-816.4) 416.0 (4.17-4590) 0.040
Mg (mg kg-1) 134.2 c (46.9-252.6) 168.4 bc (49.4-462.1) 325.9 a (76.5-764.6) 270.2 ab (95.5-425.9) 233.6 (46.9-764.6) 0.006
B (mg kg-1) 1.59 b (0.21-3.62) 1.95 b (0.20-6.12) 4.06 a (0.49-15.76) 2.18 ab (0.63-3.51) 2.69 (0.20-15.76) 0.044
Cu (mg kg-1) 16.9 a (2.76-69.1) 24.4 a (7.12-57.6) 21.8 a (4.03-83.5) 10.9 a (4.52-26.3) 19.6 (2.76-83.5) 0.283
Mn (mg kg-1) 4764 a (1979-9358) 3614 a (815-6975) 4742 a (388-7693) 3865 a (1603-7731) 4377(388-9358) 0.474
Fe (mg kg-1) 757.1 a (250.3-1574) 785.1 a (335.3-1534) 803.3 a (236.7-1848) 738.5 a (369.5-1025) 778.2 (236.7-1848) 0.911
Zn (mg kg-1) 81.2 a (6.67-270.2) 73.9 a (10.2-205.0) 183.4 a (4.78-843.5) 67.2 a (20.4-217.5) 116.5(4.78-843.5) 0.462
Na (mg kg-1) 39.7 a (18.0-115.4) 43.3 a (18.2-140.8) 53.8 a (16.0-163.4) 64.0 a (25.0-226.9) 49.3 (16.0-226.9) 0.990
Values within the same row followed by the same letter are not significantly different at p < 0.05 according to Kruskall-Wallis test followed
by pairwise comparisons. Values within parenthesis depict the range.
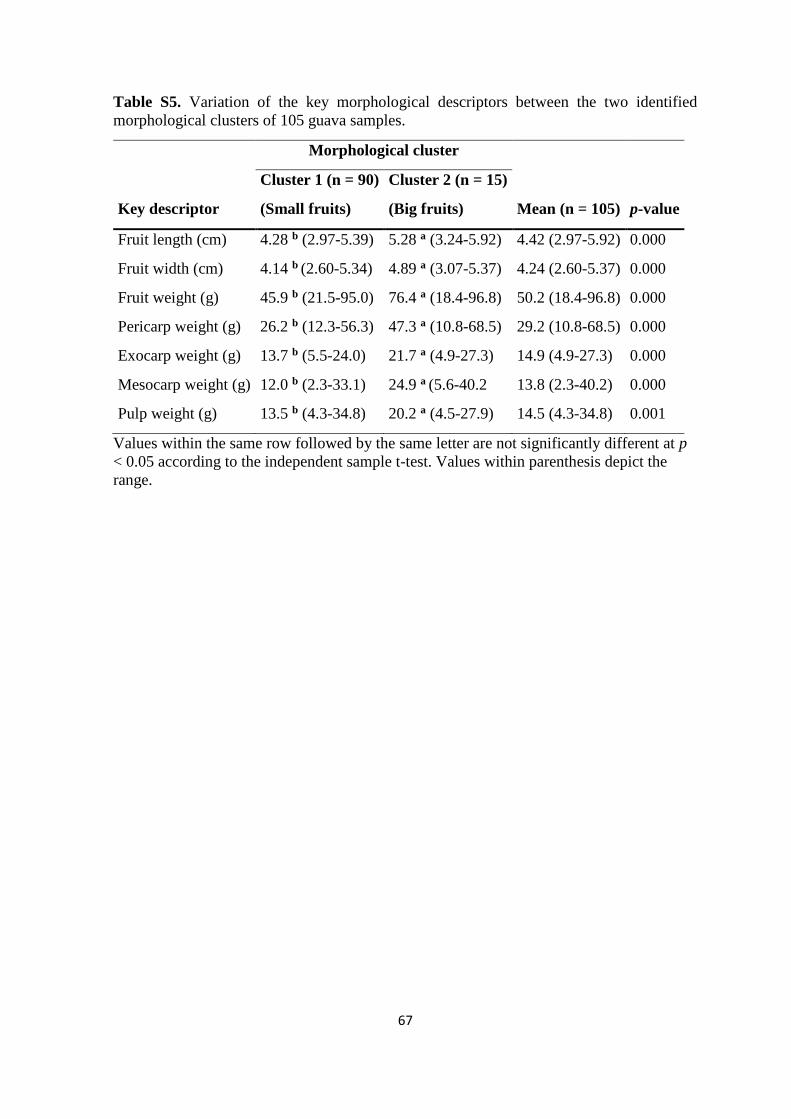
67
Table S5. Variation of the key morphological descriptors between the two identified
morphological clusters of 105 guava samples.
Morphological cluster
Key descriptor
Cluster 1 (n = 90)
(Small fruits)
Cluster 2 (n = 15)
(Big fruits) Mean (n = 105) p-value
Fruit length (cm) 4.28 b (2.97-5.39) 5.28 a (3.24-5.92) 4.42 (2.97-5.92) 0.000
Fruit width (cm) 4.14 b (2.60-5.34) 4.89 a (3.07-5.37) 4.24 (2.60-5.37) 0.000
Fruit weight (g) 45.9 b (21.5-95.0) 76.4 a (18.4-96.8) 50.2 (18.4-96.8) 0.000
Pericarp weight (g) 26.2 b (12.3-56.3) 47.3 a (10.8-68.5) 29.2 (10.8-68.5) 0.000
Exocarp weight (g) 13.7 b (5.5-24.0) 21.7 a (4.9-27.3) 14.9 (4.9-27.3) 0.000
Mesocarp weight (g) 12.0 b (2.3-33.1) 24.9 a (5.6-40.2 13.8 (2.3-40.2) 0.000
Pulp weight (g) 13.5 b (4.3-34.8) 20.2 a (4.5-27.9) 14.5 (4.3-34.8) 0.001
Values within the same row followed by the same letter are not significantly different at p
< 0.05 according to the independent sample t-test. Values within parenthesis depict the
range.
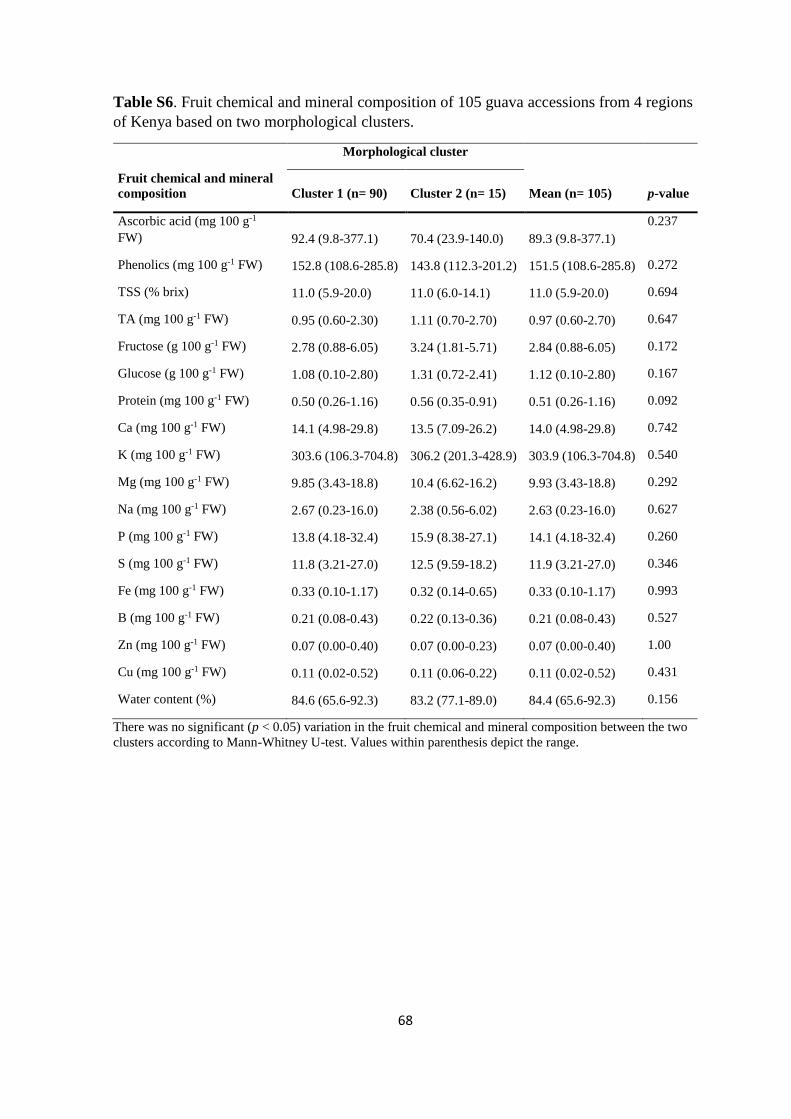
68
Table S6. Fruit chemical and mineral composition of 105 guava accessions from 4 regions
of Kenya based on two morphological clusters.
Morphological cluster
Fruit chemical and mineral
composition Cluster 1 (n= 90) Cluster 2 (n= 15) Mean (n= 105) p-value
Ascorbic acid (mg 100 g-1
FW) 92.4 (9.8-377.1) 70.4 (23.9-140.0) 89.3 (9.8-377.1)
0.237
Phenolics (mg 100 g-1 FW) 152.8 (108.6-285.8) 143.8 (112.3-201.2) 151.5 (108.6-285.8) 0.272
TSS (% brix) 11.0 (5.9-20.0) 11.0 (6.0-14.1) 11.0 (5.9-20.0) 0.694
TA (mg 100 g-1 FW) 0.95 (0.60-2.30) 1.11 (0.70-2.70) 0.97 (0.60-2.70) 0.647
Fructose (g 100 g-1 FW) 2.78 (0.88-6.05) 3.24 (1.81-5.71) 2.84 (0.88-6.05) 0.172
Glucose (g 100 g-1 FW) 1.08 (0.10-2.80) 1.31 (0.72-2.41) 1.12 (0.10-2.80) 0.167
Protein (mg 100 g-1 FW) 0.50 (0.26-1.16) 0.56 (0.35-0.91) 0.51 (0.26-1.16) 0.092
Ca (mg 100 g-1 FW) 14.1 (4.98-29.8) 13.5 (7.09-26.2) 14.0 (4.98-29.8) 0.742
K (mg 100 g-1 FW) 303.6 (106.3-704.8) 306.2 (201.3-428.9) 303.9 (106.3-704.8) 0.540
Mg (mg 100 g-1 FW) 9.85 (3.43-18.8) 10.4 (6.62-16.2) 9.93 (3.43-18.8) 0.292
Na (mg 100 g-1 FW) 2.67 (0.23-16.0) 2.38 (0.56-6.02) 2.63 (0.23-16.0) 0.627
P (mg 100 g-1 FW) 13.8 (4.18-32.4) 15.9 (8.38-27.1) 14.1 (4.18-32.4) 0.260
S (mg 100 g-1 FW) 11.8 (3.21-27.0) 12.5 (9.59-18.2) 11.9 (3.21-27.0) 0.346
Fe (mg 100 g-1 FW) 0.33 (0.10-1.17) 0.32 (0.14-0.65) 0.33 (0.10-1.17) 0.993
B (mg 100 g-1 FW) 0.21 (0.08-0.43) 0.22 (0.13-0.36) 0.21 (0.08-0.43) 0.527
Zn (mg 100 g-1 FW) 0.07 (0.00-0.40) 0.07 (0.00-0.23) 0.07 (0.00-0.40) 1.00
Cu (mg 100 g-1 FW) 0.11 (0.02-0.52) 0.11 (0.06-0.22) 0.11 (0.02-0.52) 0.431
Water content (%) 84.6 (65.6-92.3) 83.2 (77.1-89.0) 84.4 (65.6-92.3) 0.156
There was no significant (p < 0.05) variation in the fruit chemical and mineral composition between the two
clusters according to Mann-Whitney U-test. Values within parenthesis depict the range.
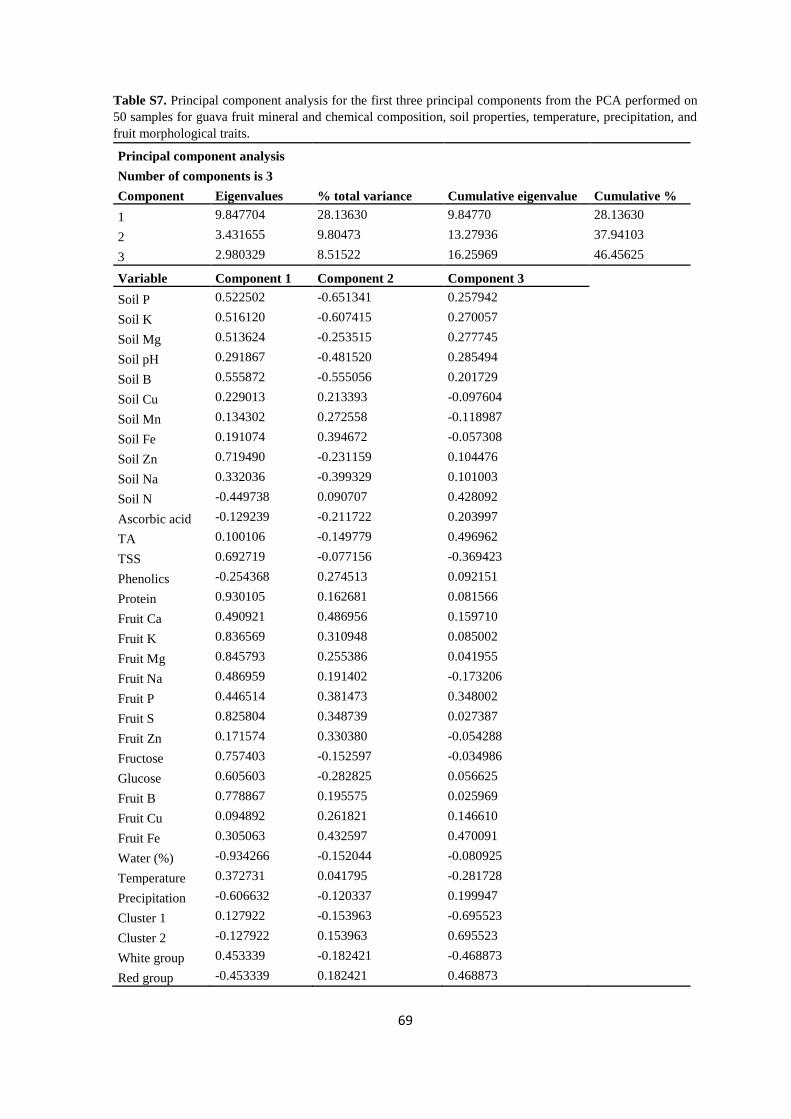
69
Table S7. Principal component analysis for the first three principal components from the PCA performed on
50 samples for guava fruit mineral and chemical composition, soil properties, temperature, precipitation, and
fruit morphological traits.
Principal component analysis
Number of components is 3
Component Eigenvalues % total variance Cumulative eigenvalue Cumulative %
1 9.847704 28.13630 9.84770 28.13630
2 3.431655 9.80473 13.27936 37.94103
3 2.980329 8.51522 16.25969 46.45625
Variable Component 1 Component 2 Component 3
Soil P 0.522502 -0.651341 0.257942
Soil K 0.516120 -0.607415 0.270057
Soil Mg 0.513624 -0.253515 0.277745
Soil pH 0.291867 -0.481520 0.285494
Soil B 0.555872 -0.555056 0.201729
Soil Cu 0.229013 0.213393 -0.097604
Soil Mn 0.134302 0.272558 -0.118987
Soil Fe 0.191074 0.394672 -0.057308
Soil Zn 0.719490 -0.231159 0.104476
Soil Na 0.332036 -0.399329 0.101003
Soil N -0.449738 0.090707 0.428092
Ascorbic acid -0.129239 -0.211722 0.203997
TA 0.100106 -0.149779 0.496962
TSS 0.692719 -0.077156 -0.369423
Phenolics -0.254368 0.274513 0.092151
Protein 0.930105 0.162681 0.081566
Fruit Ca 0.490921 0.486956 0.159710
Fruit K 0.836569 0.310948 0.085002
Fruit Mg 0.845793 0.255386 0.041955
Fruit Na 0.486959 0.191402 -0.173206
Fruit P 0.446514 0.381473 0.348002
Fruit S 0.825804 0.348739 0.027387
Fruit Zn 0.171574 0.330380 -0.054288
Fructose 0.757403 -0.152597 -0.034986
Glucose 0.605603 -0.282825 0.056625
Fruit B 0.778867 0.195575 0.025969
Fruit Cu 0.094892 0.261821 0.146610
Fruit Fe 0.305063 0.432597 0.470091
Water (%) -0.934266 -0.152044 -0.080925
Temperature 0.372731 0.041795 -0.281728
Precipitation -0.606632 -0.120337 0.199947
Cluster 1 0.127922 -0.153963 -0.695523
Cluster 2 -0.127922 0.153963 0.695523
White group 0.453339 -0.182421 -0.468873
Red group -0.453339 0.182421 0.468873
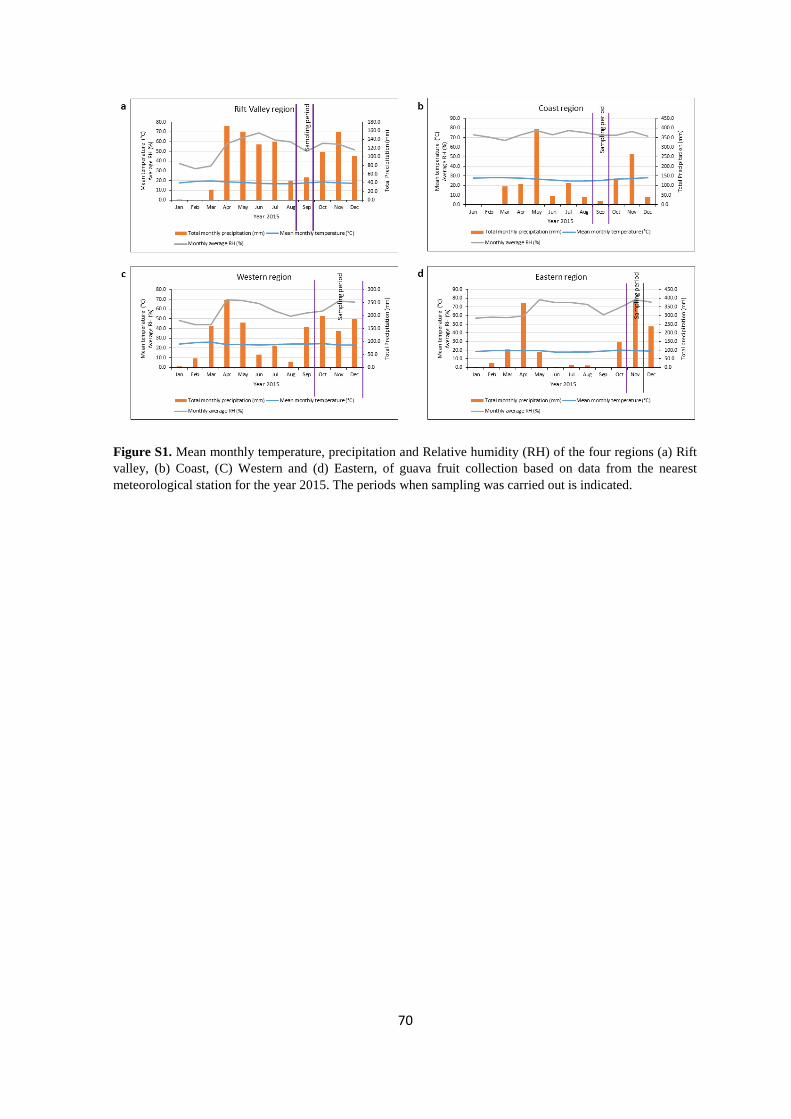
70
Figure S1. Mean monthly temperature, precipitation and Relative humidity (RH) of the four regions (a) Rift
valley, (b) Coast, (C) Western and (d) Eastern, of guava fruit collection based on data from the nearest
meteorological station for the year 2015. The periods when sampling was carried out is indicated.

71
Figure S2. Dendrogram resulting from cluster analysis (Ward method, squared Euclidean distances, z-score
standardization of variables) using seven key descriptors on 105 guava accessions. The dotted line indicate the
cutting distance for cluster formation. Cluster 2 comprised of larger and heavier fruits compared to cluster 1.
Cluster 1
Cluster 2
72
Chapter four
4. Partitioning of dry matter and minerals in guava (Psidium guajava L.) accessions
under salt stress: Implications for selection of adapted rootstocks for saline soils
Abstract
Common guava (Psidium guajava L.) is highly valued for the deliciousness of the
fruit, which is a source of vitamins, minerals, and natural antioxidants. However, guava
production faces salinity challenges in many guava-producing countries. The effect of
sodium chloride (NaCl) salinity—0 mM (control), 10/20 mM (low), 20/40 mM (medium),
and 40/80 mM (high)—supplied through a standard Hoagland nutrient solution to 10
genetically diverse guava accessions was investigated to test their level of tolerance in a six-
week greenhouse experiment. Leaf number and leaf dry matter (DM) were significantly
reduced at the medium and high salinity levels while root DM remained similar in all the
treatments, however; differential accumulation of DM was observed in individual
accessions. Root water content increased with rising salinity levels, whereas leaf water
content was significantly reduced only at the high NaCl level. There was a decrease in the
leaf potassium/sodium (K/Na) and calcium/sodium (Ca/Na) ratios with increasing salinity
level, which could be attributed to the high accumulation of Na rather than to the replacement
of K and Ca. The levels of leaf phosphorus (P) and sulphur (S) decreased with increasing
salinity; however, leaf magnesium (Mg) did not show a clear trend. Leaf boron (B) and iron
(Fe) were significantly reduced only at the high salinity level, whereas the other
micronutrients remained unaffected. Differences among the accessions relative to the
accumulation of Na were observed and positively correlated with the DM. Thus, the ability
to maintain more DM under salt stress could serve as an indicator for salinity tolerance in
guava and should be considered when selecting genotypes for adaptation to saline
environments.
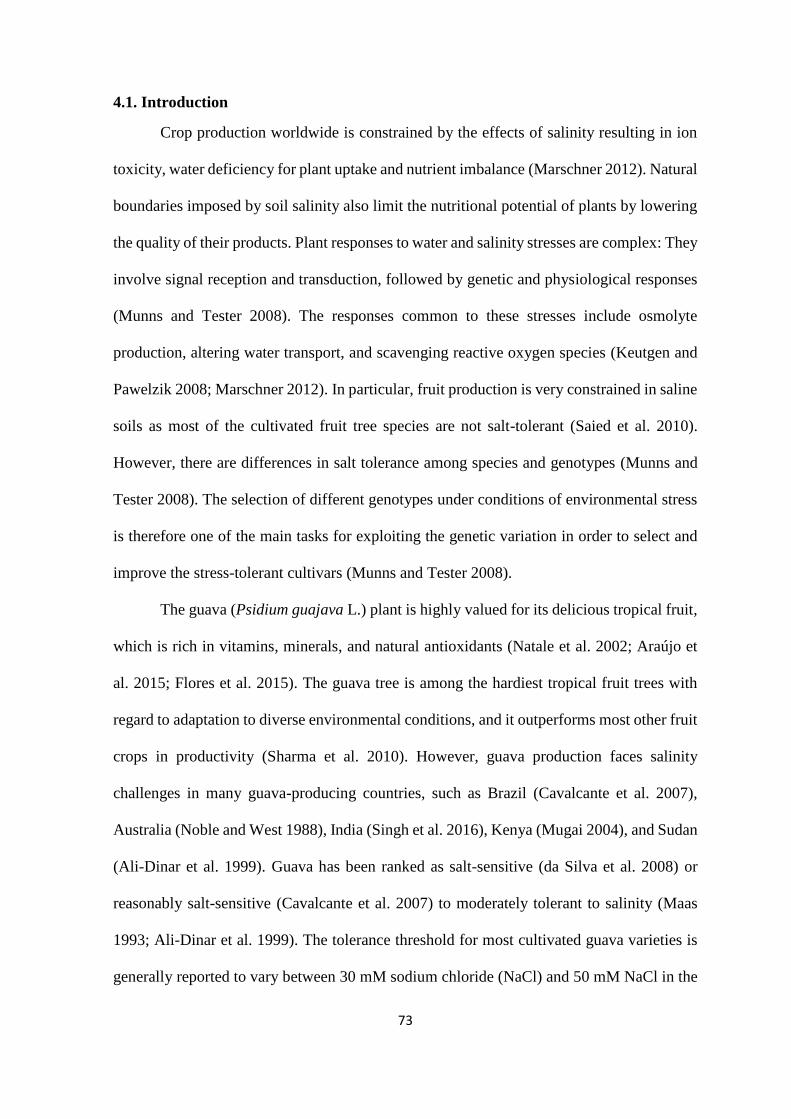
73
4.1. Introduction
Crop production worldwide is constrained by the effects of salinity resulting in ion
toxicity, water deficiency for plant uptake and nutrient imbalance (Marschner 2012). Natural
boundaries imposed by soil salinity also limit the nutritional potential of plants by lowering
the quality of their products. Plant responses to water and salinity stresses are complex: They
involve signal reception and transduction, followed by genetic and physiological responses
(Munns and Tester 2008). The responses common to these stresses include osmolyte
production, altering water transport, and scavenging reactive oxygen species (Keutgen and
Pawelzik 2008; Marschner 2012). In particular, fruit production is very constrained in saline
soils as most of the cultivated fruit tree species are not salt-tolerant (Saied et al. 2010).
However, there are differences in salt tolerance among species and genotypes (Munns and
Tester 2008). The selection of different genotypes under conditions of environmental stress
is therefore one of the main tasks for exploiting the genetic variation in order to select and
improve the stress-tolerant cultivars (Munns and Tester 2008).
The guava (Psidium guajava L.) plant is highly valued for its delicious tropical fruit,
which is rich in vitamins, minerals, and natural antioxidants (Natale et al. 2002; Araújo et
al. 2015; Flores et al. 2015). The guava tree is among the hardiest tropical fruit trees with
regard to adaptation to diverse environmental conditions, and it outperforms most other fruit
crops in productivity (Sharma et al. 2010). However, guava production faces salinity
challenges in many guava-producing countries, such as Brazil (Cavalcante et al. 2007),
Australia (Noble and West 1988), India (Singh et al. 2016), Kenya (Mugai 2004), and Sudan
(Ali-Dinar et al. 1999). Guava has been ranked as salt-sensitive (da Silva et al. 2008) or
reasonably salt-sensitive (Cavalcante et al. 2007) to moderately tolerant to salinity (Maas
1993; Ali-Dinar et al. 1999). The tolerance threshold for most cultivated guava varieties is
generally reported to vary between 30 mM sodium chloride (NaCl) and 50 mM NaCl in the
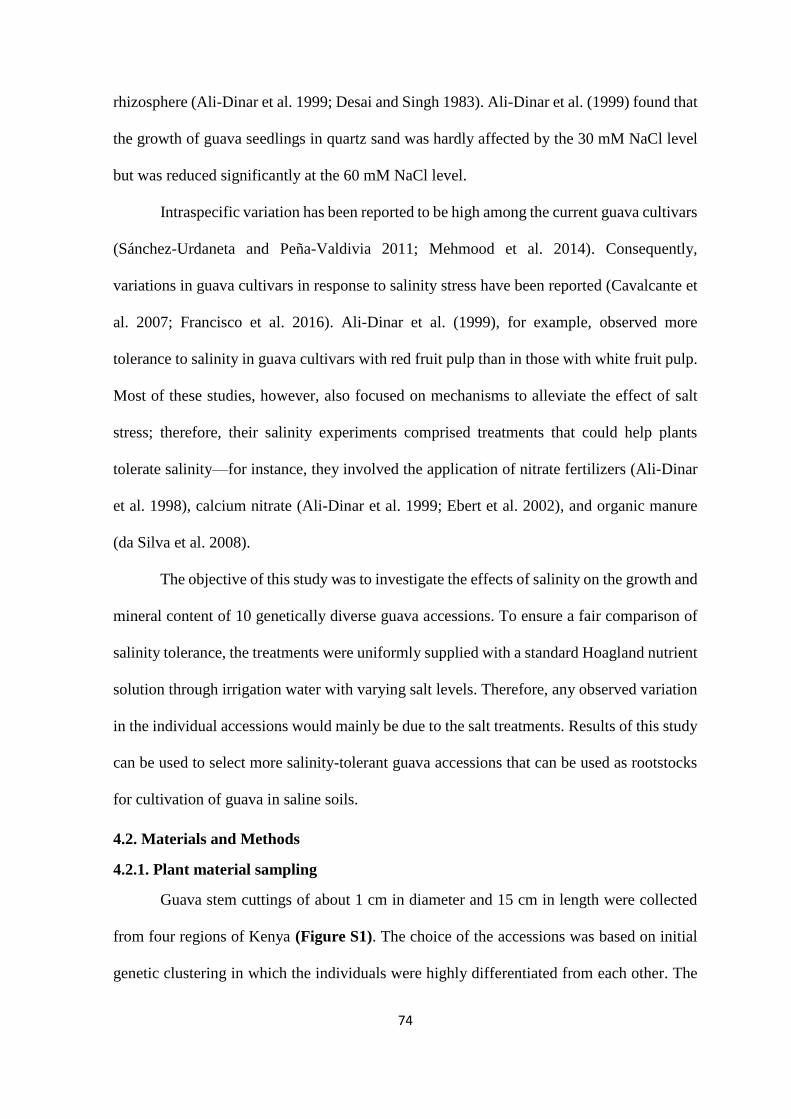
74
rhizosphere (Ali-Dinar et al. 1999; Desai and Singh 1983). Ali-Dinar et al. (1999) found that
the growth of guava seedlings in quartz sand was hardly affected by the 30 mM NaCl level
but was reduced significantly at the 60 mM NaCl level.
Intraspecific variation has been reported to be high among the current guava cultivars
(Sánchez-Urdaneta and Peña-Valdivia 2011; Mehmood et al. 2014). Consequently,
variations in guava cultivars in response to salinity stress have been reported (Cavalcante et
al. 2007; Francisco et al. 2016). Ali-Dinar et al. (1999), for example, observed more
tolerance to salinity in guava cultivars with red fruit pulp than in those with white fruit pulp.
Most of these studies, however, also focused on mechanisms to alleviate the effect of salt
stress; therefore, their salinity experiments comprised treatments that could help plants
tolerate salinity—for instance, they involved the application of nitrate fertilizers (Ali-Dinar
et al. 1998), calcium nitrate (Ali-Dinar et al. 1999; Ebert et al. 2002), and organic manure
(da Silva et al. 2008).
The objective of this study was to investigate the effects of salinity on the growth and
mineral content of 10 genetically diverse guava accessions. To ensure a fair comparison of
salinity tolerance, the treatments were uniformly supplied with a standard Hoagland nutrient
solution through irrigation water with varying salt levels. Therefore, any observed variation
in the individual accessions would mainly be due to the salt treatments. Results of this study
can be used to select more salinity-tolerant guava accessions that can be used as rootstocks
for cultivation of guava in saline soils.
4.2. Materials and Methods
4.2.1. Plant material sampling
Guava stem cuttings of about 1 cm in diameter and 15 cm in length were collected
from four regions of Kenya (Figure S1). The choice of the accessions was based on initial
genetic clustering in which the individuals were highly differentiated from each other. The
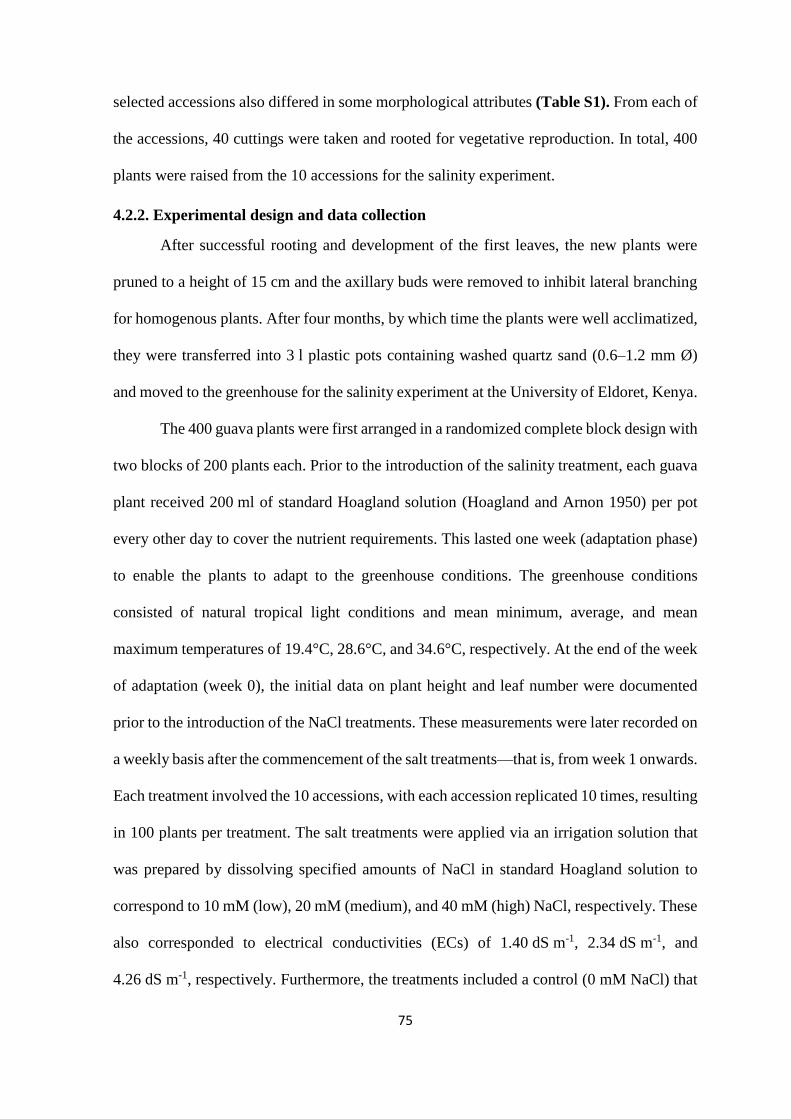
75
selected accessions also differed in some morphological attributes (Table S1). From each of
the accessions, 40 cuttings were taken and rooted for vegetative reproduction. In total, 400
plants were raised from the 10 accessions for the salinity experiment.
4.2.2. Experimental design and data collection
After successful rooting and development of the first leaves, the new plants were
pruned to a height of 15 cm and the axillary buds were removed to inhibit lateral branching
for homogenous plants. After four months, by which time the plants were well acclimatized,
they were transferred into 3 l plastic pots containing washed quartz sand (0.6–1.2 mm Ø)
and moved to the greenhouse for the salinity experiment at the University of Eldoret, Kenya.
The 400 guava plants were first arranged in a randomized complete block design with
two blocks of 200 plants each. Prior to the introduction of the salinity treatment, each guava
plant received 200 ml of standard Hoagland solution (Hoagland and Arnon 1950) per pot
every other day to cover the nutrient requirements. This lasted one week (adaptation phase)
to enable the plants to adapt to the greenhouse conditions. The greenhouse conditions
consisted of natural tropical light conditions and mean minimum, average, and mean
maximum temperatures of 19.4°C, 28.6°C, and 34.6°C, respectively. At the end of the week
of adaptation (week 0), the initial data on plant height and leaf number were documented
prior to the introduction of the NaCl treatments. These measurements were later recorded on
a weekly basis after the commencement of the salt treatments—that is, from week 1 onwards.
Each treatment involved the 10 accessions, with each accession replicated 10 times, resulting
in 100 plants per treatment. The salt treatments were applied via an irrigation solution that
was prepared by dissolving specified amounts of NaCl in standard Hoagland solution to
correspond to 10 mM (low), 20 mM (medium), and 40 mM (high) NaCl, respectively. These
also corresponded to electrical conductivities (ECs) of 1.40 dS m-1, 2.34 dS m-1, and
4.26 dS m-1, respectively. Furthermore, the treatments included a control (0 mM NaCl) that
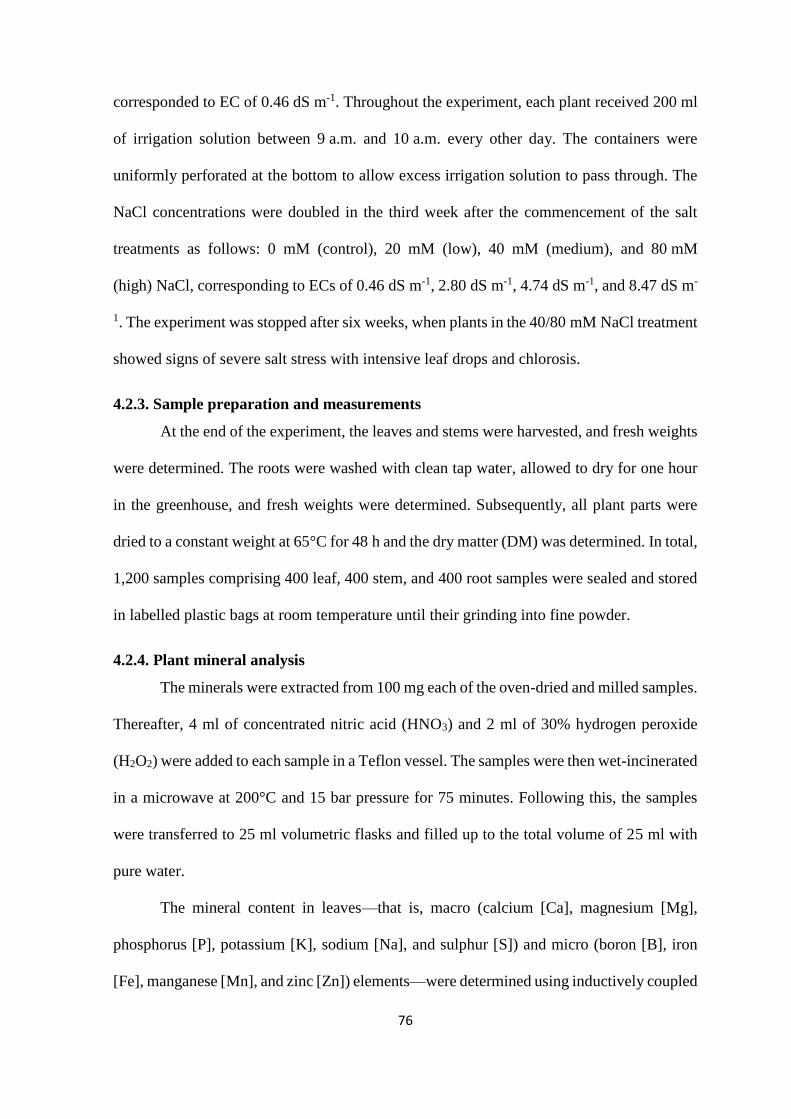
76
corresponded to EC of 0.46 dS m-1. Throughout the experiment, each plant received 200 ml
of irrigation solution between 9 a.m. and 10 a.m. every other day. The containers were
uniformly perforated at the bottom to allow excess irrigation solution to pass through. The
NaCl concentrations were doubled in the third week after the commencement of the salt
treatments as follows: 0 mM (control), 20 mM (low), 40 mM (medium), and 80 mM
(high) NaCl, corresponding to ECs of 0.46 dS m-1, 2.80 dS m-1, 4.74 dS m-1, and 8.47 dS m-
1. The experiment was stopped after six weeks, when plants in the 40/80 mM NaCl treatment
showed signs of severe salt stress with intensive leaf drops and chlorosis.
4.2.3. Sample preparation and measurements
At the end of the experiment, the leaves and stems were harvested, and fresh weights
were determined. The roots were washed with clean tap water, allowed to dry for one hour
in the greenhouse, and fresh weights were determined. Subsequently, all plant parts were
dried to a constant weight at 65°C for 48 h and the dry matter (DM) was determined. In total,
1,200 samples comprising 400 leaf, 400 stem, and 400 root samples were sealed and stored
in labelled plastic bags at room temperature until their grinding into fine powder.
4.2.4. Plant mineral analysis
The minerals were extracted from 100 mg each of the oven-dried and milled samples.
Thereafter, 4 ml of concentrated nitric acid (HNO3) and 2 ml of 30% hydrogen peroxide
(H2O2) were added to each sample in a Teflon vessel. The samples were then wet-incinerated
in a microwave at 200°C and 15 bar pressure for 75 minutes. Following this, the samples
were transferred to 25 ml volumetric flasks and filled up to the total volume of 25 ml with
pure water.
The mineral content in leaves—that is, macro (calcium [Ca], magnesium [Mg],
phosphorus [P], potassium [K], sodium [Na], and sulphur [S]) and micro (boron [B], iron
[Fe], manganese [Mn], and zinc [Zn]) elements—were determined using inductively coupled
77
plasma atomic emission spectroscopy (ICP-AES) (Vista-RL ICP-OES, Varian Inc., USA)
(Wheal et al. 2011). Stem and root samples were analysed for Na concentration with a flame
photometer (model BWB XP, BWB Technologies UK Ltd., UK). Prior measurements of Na
content in the root and stem samples had not shown variations within similar treatments;
hence, to save on time and cost, measurements for stems and roots considered only one block
of the treatments (i.e. half of the total samples). The results were expressed as mg 100 g-1
dry weight (DW) of the sample. The Na content was also calculated at the plant level, taking
into consideration the dry biomass at the end of the experiment for the leaves, stems, roots,
and the entire plant. The results were accordingly expressed as mg per DW of the plant part
or the entire plant.
4.3. Statistical analysis
All statistical analyses were performed using the statistical software package SPSS,
version 20 (IBM Corp., Armonk, NY). For growth and DM parameters, samples from all
400 plants were used. For mineral analysis, however, samples from one block were used for
stem and root (200 samples), while 240 samples were used for leaf mineral analysis, due to
insufficient amount of leaf for some samples. However, for comparison of Na
concentrations, same samples were used for the different plant organs. The data was
statistically analysed using a two-way analysis of variance (ANOVA), considering the salt
levels, the accession, and their interaction. Comparison of the means was assessed by a
Tukey test at the 95% confidence interval. Furthermore, changes in growth parameters, DM,
and Na content between the control and high salinity (40/80 mM NaCl) level within
individual accessions was assessed for significance differences using a paired sample t-test.
4.4. Results
Plants in the control treatment did not show any signs of salt toxicity symptoms. At
the low salinity level (10/20 mM NaCl), most plants showed only mild signs of salt injury:

78
The leaves were only less green compared to the control plants. At the medium (20/40 mM
NaCl) salinity level, however, leaf chlorosis was moderately severe in most plants, with a
few plants showing necrotic symptoms at the leaf margins. Mild leaf drops were observed
in all plants at this salinity level, especially from Week 4, though with varying intensities
among the accessions. Plants in the high salinity level (40/80 mM NaCl) showed symptoms
of chlorosis and necrosis from Week 3 and the symptoms became more severe over time.
All plants at this level exhibited severe leaf drops starting from the fourth week, with no
observable differences among the accessions. Figure 1 shows the salinity symptoms
observed under different salt levels.
Figure 1. Observed salt injury symptoms at the end of the experiment in (A) guava plants, (B) upper side of
the leaves, and (C) underside of the leaves. Symptoms became more pronounced from the medium (20/40 mM)
to the high (40/80 mM) salt stress levels.
79
4.4.1. Growth parameters
Plant height increased from Week 0 with a mean of 42.8 cm to 47.7 cm in Week 6
(data not shown). Overall, plants in the control treatment had a mean height of 45.7 cm
compared to 45.1 cm in the high salinity treatment (Table 1). Plant height was not
significantly affected by NaCl treatments; however, a significant variation among the
accessions was recorded based on the interaction between the accession and NaCl treatments
(Table 1). For instance, accession ELG009 gained more height (8%) at the 40/80 mM salt
level compared to the control. On the other hand, accession HOM013 reduced most in height
(9%) at the high salt level in comparison to the control. Nevertheless, these changes between
the control and high salinity level in plant height within the accessions were found to be
insignificant based on the paired sample t-test. The average number of leaves per plant
increased steadily from Week 0 with a mean of 8.84 to 11.2 in Week 6 (data not shown).
Leaf number, however, generally significantly reduced as a result of the NaCl treatments,
with the control and low salinity treatments recording higher values compared to the medium
and high salinity treatments (Table 1, Figure 2). The difference in leaf number between
treatments was more observable from the fourth week and continued through to the end of
the experiment (Figure 2). Compared to the control plants, the mean leaf number reduced
by 8.33% in the 40/80 mM NaCl treatment. Differential variations in leaf number in
individual accessions were also observed between the control and high salinity treatments.
Accessions MER014, ELG009, and UAG014 recorded slight increases of 4.29%, 3.84%,
and 0.53%, respectively, in the high NaCl treatments compared to the control. In contrast,
all the remaining accessions had a reduction in leaf number with higher losses recorded in
accessions KIL013 (21.4%), HOM016 (19.4%), and MER011 (15.3%). However, the
reductions were significant only in accessions HOM016 and MER011 (Table 1).
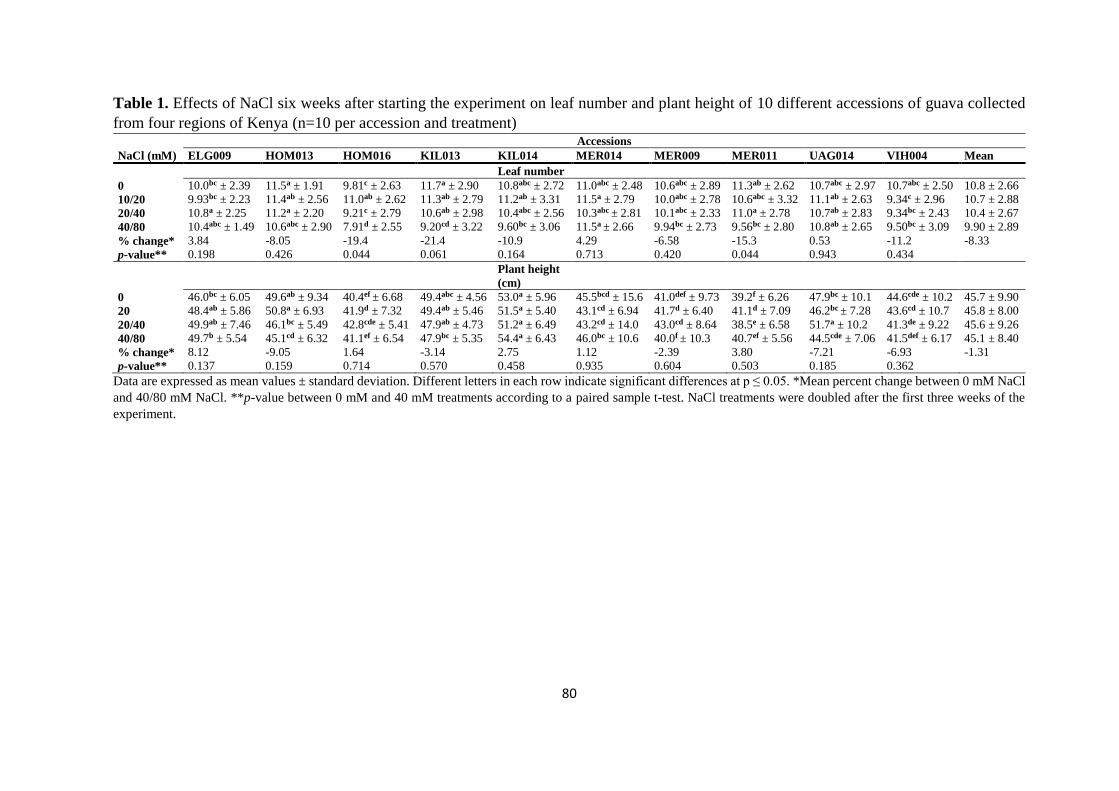
80
Table 1. Effects of NaCl six weeks after starting the experiment on leaf number and plant height of 10 different accessions of guava collected
from four regions of Kenya (n=10 per accession and treatment)
NaCl (mM)
Accessions
ELG009 HOM013 HOM016 KIL013 KIL014 MER014 MER009 MER011 UAG014 VIH004 Mean
Leaf number 0 10.0bc ± 2.39 11.5a ± 1.91 9.81c ± 2.63 11.7a ± 2.90 10.8abc ± 2.72 11.0abc ± 2.48 10.6abc ± 2.89 11.3ab ± 2.62 10.7abc ± 2.97 10.7abc ± 2.50 10.8 ± 2.66
10/20 9.93bc ± 2.23 11.4ab ± 2.56 11.0ab ± 2.62 11.3ab ± 2.79 11.2ab ± 3.31 11.5a ± 2.79 10.0abc ± 2.78 10.6abc ± 3.32 11.1ab ± 2.63 9.34c ± 2.96 10.7 ± 2.88
20/40 10.8a ± 2.25 11.2a ± 2.20 9.21c ± 2.79 10.6ab ± 2.98 10.4abc ± 2.56 10.3abc ± 2.81 10.1abc ± 2.33 11.0a ± 2.78 10.7ab ± 2.83 9.34bc ± 2.43 10.4 ± 2.67
40/80 10.4abc ± 1.49 10.6abc ± 2.90 7.91d ± 2.55 9.20cd ± 3.22 9.60bc ± 3.06 11.5a ± 2.66 9.94bc ± 2.73 9.56bc ± 2.80 10.8ab ± 2.65 9.50bc ± 3.09 9.90 ± 2.89
% change* 3.84 -8.05 -19.4 -21.4 -10.9 4.29 -6.58 -15.3 0.53 -11.2 -8.33
p-value** 0.198 0.426 0.044 0.061 0.164 0.713 0.420 0.044 0.943 0.434
Plant height
(cm) 0 46.0bc ± 6.05 49.6ab ± 9.34 40.4ef ± 6.68 49.4abc ± 4.56 53.0a ± 5.96 45.5bcd ± 15.6 41.0def ± 9.73 39.2f ± 6.26 47.9bc ± 10.1 44.6cde ± 10.2 45.7 ± 9.90
20 48.4ab ± 5.86 50.8a ± 6.93 41.9d ± 7.32 49.4ab ± 5.46 51.5a ± 5.40 43.1cd ± 6.94 41.7d ± 6.40 41.1d ± 7.09 46.2bc ± 7.28 43.6cd ± 10.7 45.8 ± 8.00
20/40 49.9ab ± 7.46 46.1bc ± 5.49 42.8cde ± 5.41 47.9ab ± 4.73 51.2a ± 6.49 43.2cd ± 14.0 43.0cd ± 8.64 38.5e ± 6.58 51.7a ± 10.2 41.3de ± 9.22 45.6 ± 9.26
40/80 49.7b ± 5.54 45.1cd ± 6.32 41.1ef ± 6.54 47.9bc ± 5.35 54.4a ± 6.43 46.0bc ± 10.6 40.0f ± 10.3 40.7ef ± 5.56 44.5cde ± 7.06 41.5def ± 6.17 45.1 ± 8.40
% change* 8.12 -9.05 1.64 -3.14 2.75 1.12 -2.39 3.80 -7.21 -6.93 -1.31
p-value** 0.137 0.159 0.714 0.570 0.458 0.935 0.604 0.503 0.185 0.362 Data are expressed as mean values ± standard deviation. Different letters in each row indicate significant differences at p ≤ 0.05. *Mean percent change between 0 mM NaCl
and 40/80 mM NaCl. **p-value between 0 mM and 40 mM treatments according to a paired sample t-test. NaCl treatments were doubled after the first three weeks of the
experiment.
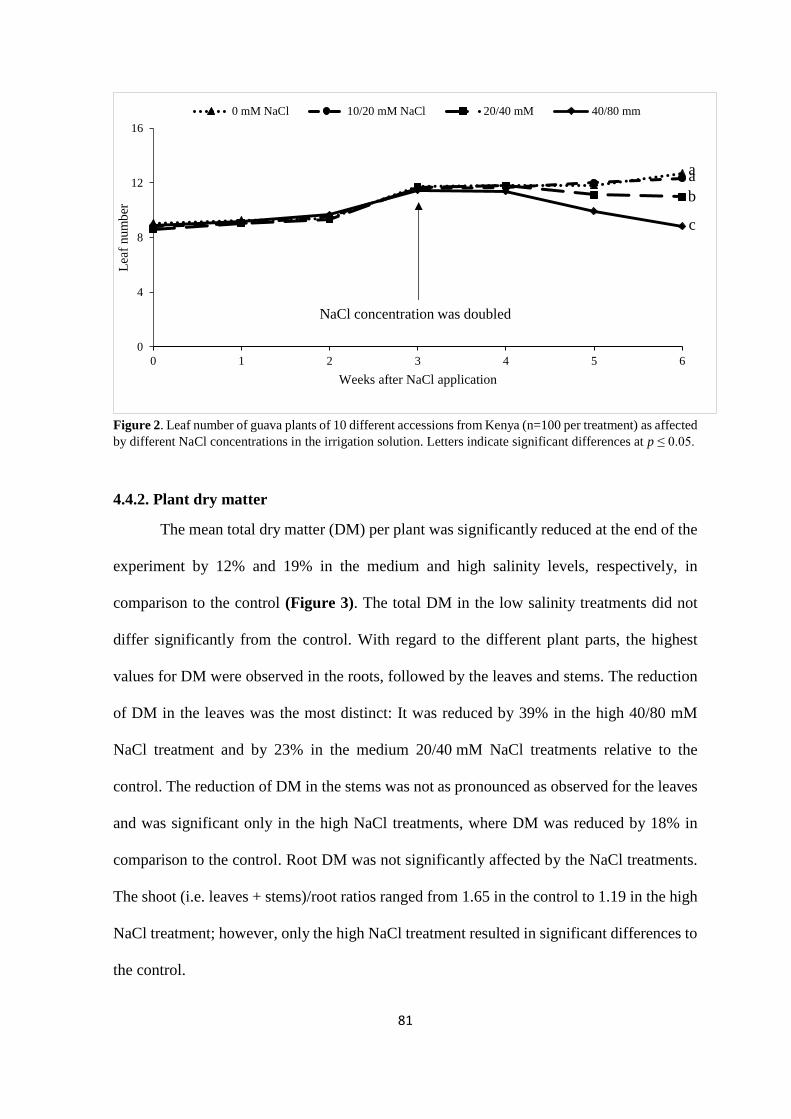
81
Figure 2. Leaf number of guava plants of 10 different accessions from Kenya (n=100 per treatment) as affected
by different NaCl concentrations in the irrigation solution. Letters indicate significant differences at p ≤ 0.05.
4.4.2. Plant dry matter
The mean total dry matter (DM) per plant was significantly reduced at the end of the
experiment by 12% and 19% in the medium and high salinity levels, respectively, in
comparison to the control (Figure 3). The total DM in the low salinity treatments did not
differ significantly from the control. With regard to the different plant parts, the highest
values for DM were observed in the roots, followed by the leaves and stems. The reduction
of DM in the leaves was the most distinct: It was reduced by 39% in the high 40/80 mM
NaCl treatment and by 23% in the medium 20/40 mM NaCl treatments relative to the
control. The reduction of DM in the stems was not as pronounced as observed for the leaves
and was significant only in the high NaCl treatments, where DM was reduced by 18% in
comparison to the control. Root DM was not significantly affected by the NaCl treatments.
The shoot (i.e. leaves + stems)/root ratios ranged from 1.65 in the control to 1.19 in the high
NaCl treatment; however, only the high NaCl treatment resulted in significant differences to
the control.
0
4
8
12
16
0 1 2 3 4 5 6
Lea
f num
ber
Weeks after NaCl application
0 mM NaCl 10/20 mM NaCl 20/40 mM 40/80 mm
NaCl concentration was doubled
c
a a
b
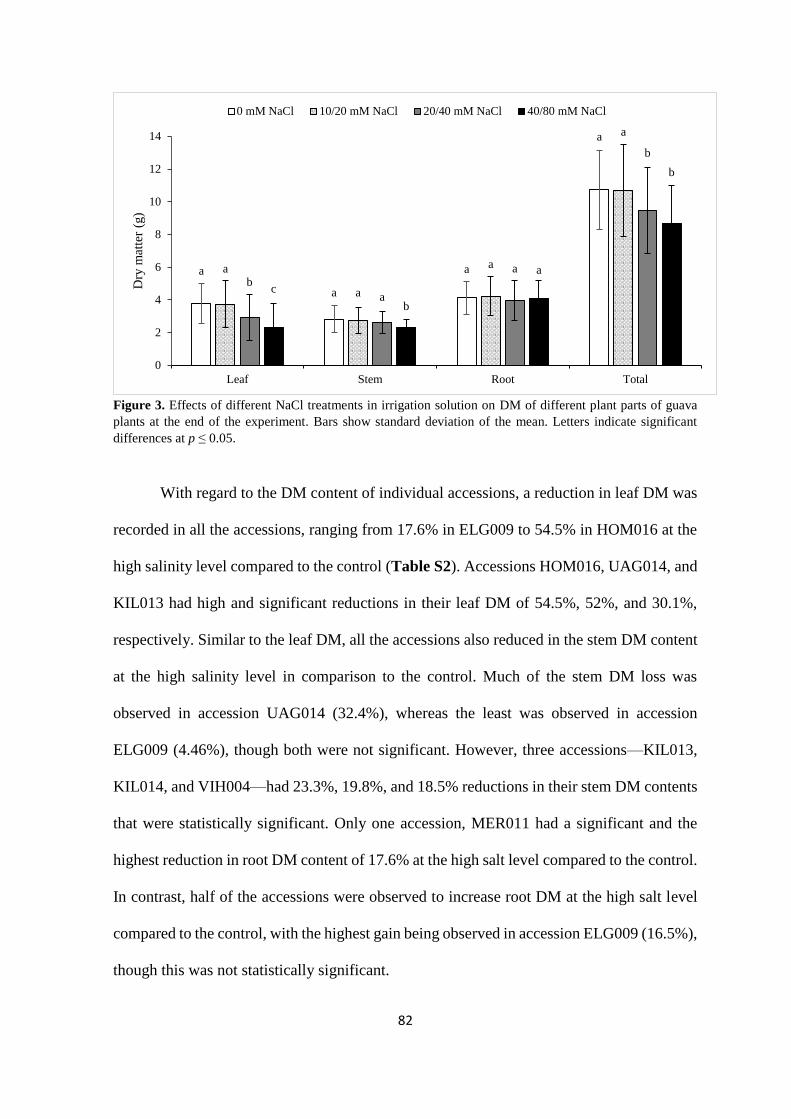
82
Figure 3. Effects of different NaCl treatments in irrigation solution on DM of different plant parts of guava
plants at the end of the experiment. Bars show standard deviation of the mean. Letters indicate significant
differences at p ≤ 0.05.
With regard to the DM content of individual accessions, a reduction in leaf DM was
recorded in all the accessions, ranging from 17.6% in ELG009 to 54.5% in HOM016 at the
high salinity level compared to the control (Table S2). Accessions HOM016, UAG014, and
KIL013 had high and significant reductions in their leaf DM of 54.5%, 52%, and 30.1%,
respectively. Similar to the leaf DM, all the accessions also reduced in the stem DM content
at the high salinity level in comparison to the control. Much of the stem DM loss was
observed in accession UAG014 (32.4%), whereas the least was observed in accession
ELG009 (4.46%), though both were not significant. However, three accessions—KIL013,
KIL014, and VIH004—had 23.3%, 19.8%, and 18.5% reductions in their stem DM contents
that were statistically significant. Only one accession, MER011 had a significant and the
highest reduction in root DM content of 17.6% at the high salt level compared to the control.
In contrast, half of the accessions were observed to increase root DM at the high salt level
compared to the control, with the highest gain being observed in accession ELG009 (16.5%),
though this was not statistically significant.
a
a
a
a
a
a
a
a
b
a
a
b
c
b
a
b
0
2
4
6
8
10
12
14
Leaf Stem Root Total
Dry
mat
ter
(g)
0 mM NaCl 10/20 mM NaCl 20/40 mM NaCl 40/80 mM NaCl
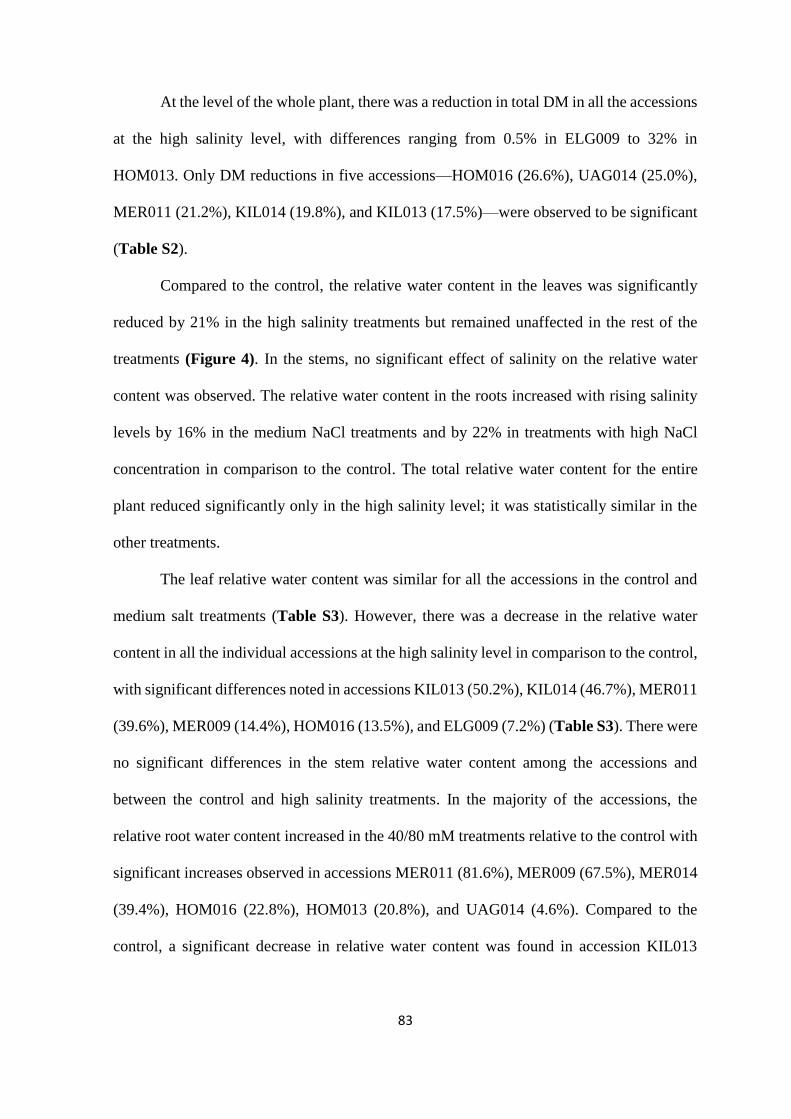
83
At the level of the whole plant, there was a reduction in total DM in all the accessions
at the high salinity level, with differences ranging from 0.5% in ELG009 to 32% in
HOM013. Only DM reductions in five accessions—HOM016 (26.6%), UAG014 (25.0%),
MER011 (21.2%), KIL014 (19.8%), and KIL013 (17.5%)—were observed to be significant
(Table S2).
Compared to the control, the relative water content in the leaves was significantly
reduced by 21% in the high salinity treatments but remained unaffected in the rest of the
treatments (Figure 4). In the stems, no significant effect of salinity on the relative water
content was observed. The relative water content in the roots increased with rising salinity
levels by 16% in the medium NaCl treatments and by 22% in treatments with high NaCl
concentration in comparison to the control. The total relative water content for the entire
plant reduced significantly only in the high salinity level; it was statistically similar in the
other treatments.
The leaf relative water content was similar for all the accessions in the control and
medium salt treatments (Table S3). However, there was a decrease in the relative water
content in all the individual accessions at the high salinity level in comparison to the control,
with significant differences noted in accessions KIL013 (50.2%), KIL014 (46.7%), MER011
(39.6%), MER009 (14.4%), HOM016 (13.5%), and ELG009 (7.2%) (Table S3). There were
no significant differences in the stem relative water content among the accessions and
between the control and high salinity treatments. In the majority of the accessions, the
relative root water content increased in the 40/80 mM treatments relative to the control with
significant increases observed in accessions MER011 (81.6%), MER009 (67.5%), MER014
(39.4%), HOM016 (22.8%), HOM013 (20.8%), and UAG014 (4.6%). Compared to the
control, a significant decrease in relative water content was found in accession KIL013
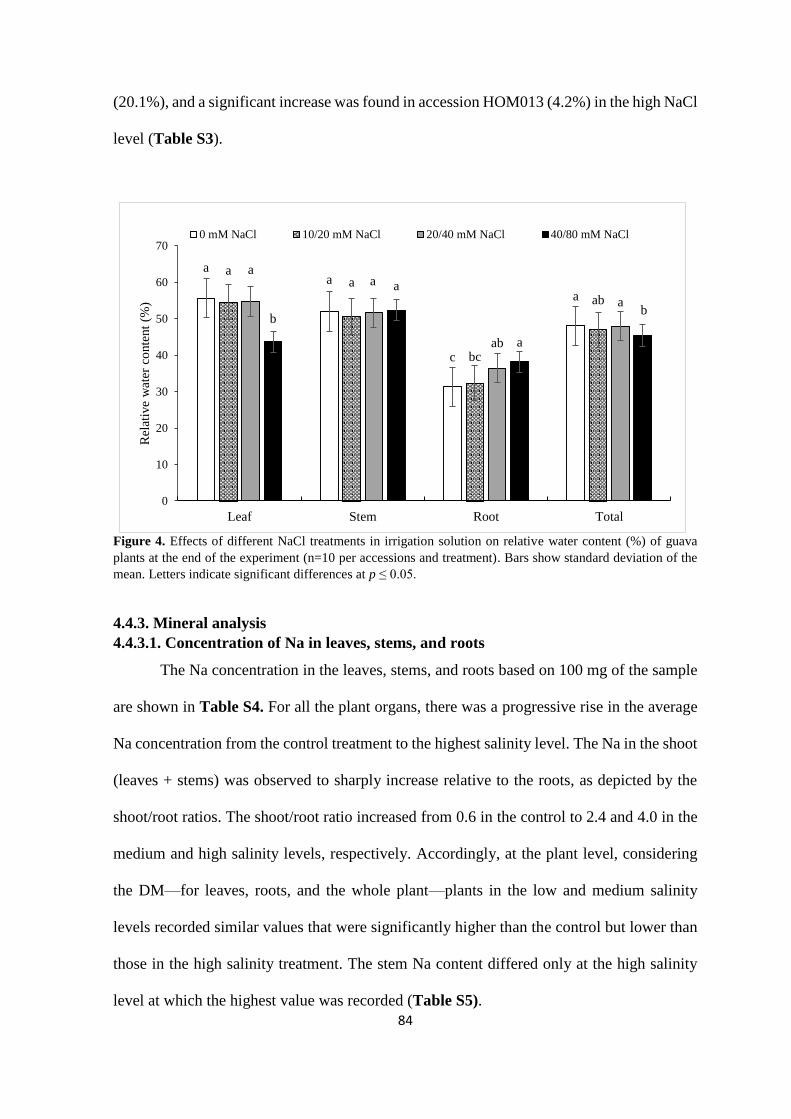
84
(20.1%), and a significant increase was found in accession HOM013 (4.2%) in the high NaCl
level (Table S3).
Figure 4. Effects of different NaCl treatments in irrigation solution on relative water content (%) of guava
plants at the end of the experiment (n=10 per accessions and treatment). Bars show standard deviation of the
mean. Letters indicate significant differences at p ≤ 0.05.
4.4.3. Mineral analysis
4.4.3.1. Concentration of Na in leaves, stems, and roots
The Na concentration in the leaves, stems, and roots based on 100 mg of the sample
are shown in Table S4. For all the plant organs, there was a progressive rise in the average
Na concentration from the control treatment to the highest salinity level. The Na in the shoot
(leaves + stems) was observed to sharply increase relative to the roots, as depicted by the
shoot/root ratios. The shoot/root ratio increased from 0.6 in the control to 2.4 and 4.0 in the
medium and high salinity levels, respectively. Accordingly, at the plant level, considering
the DM—for leaves, roots, and the whole plant—plants in the low and medium salinity
levels recorded similar values that were significantly higher than the control but lower than
those in the high salinity treatment. The stem Na content differed only at the high salinity
level at which the highest value was recorded (Table S5).
aa
c
a
aa
bc
ab
aa
ab
a
b
a
a
b
0
10
20
30
40
50
60
70
Leaf Stem Root Total
Rel
ativ
e w
ater
co
nte
nt
(%)
0 mM NaCl 10/20 mM NaCl 20/40 mM NaCl 40/80 mM NaCl
85
In the case of individual accessions, accumulation of Na based on 100 mg of the
sample was observed to vary based on plant parts and NaCl treatments (Table 2).
Interestingly, leaf Na concentration among the accessions varied even in the control prior to
the introduction of the treatments. At the low NaCl level, the accessions did not differ in
their leaf Na concentration. With a further increase to moderate and high salt stress,
significant variations among the accessions were observed. The accessions differentially
accumulated Na in their leaves: Accession ELG009 had the highest values at the high salinity
level; this was 45 times more than the control. The least accumulation of leaf Na at the high
salinity level in comparison to the control was in accession HOM013; here, the accumulation
of leaf Na was 16 times higher than the control. These differences between the control and
the higher salinity level were significant for all accessions, except MER011. Significant
differences among the accessions in stem Na concentration were observed only at the high
salinity level. The differences in Na concentration between the control and high salinity level
increased from nine-fold in accessions HOM013 and HOM016 to 68-fold in accession
KIL014. All stem Na changes between the control and 40/80 mM treatments were significant
except for accession KIL013 and MER011. The root Na concentration among the accessions
was observed to vary in low and medium salinities but not in the control and high salinity
treatments. The changes between the control and high salt level were lower than those
observed for leaves and stems—increasing from three-fold to five-fold, and were all
significant for all the accessions (Table 2).
At the whole plant level, considering plant DM, accession ELG009 still accumulated
the highest leaf Na content, and this was 37 times higher in the high salinity treatment than
in the control (Table S6). The least change was observed in accession HOM016 (seven times
higher than the control). The changes between the Na content in the control plants and those
under high salt treatments in accessions KIL013, KIL014, MER014, and UAG014 were not
86
significant. Regarding the stem, two accessions, KIL013 and MER011, did not differ in their
Na content between the control and the high salinity level. Considering the root, only
accession VIH004 did not have a significant accumulation of Na (Table S6). At the whole
plant level, there was a significant difference in Na content between the control and 40/80
mM treatments in all the accessions. The Na content increased by four-fold in HOM016 to
11-fold in ELG009 and KIL013 in the 40/80 mM plants compared to the control (Table S6).
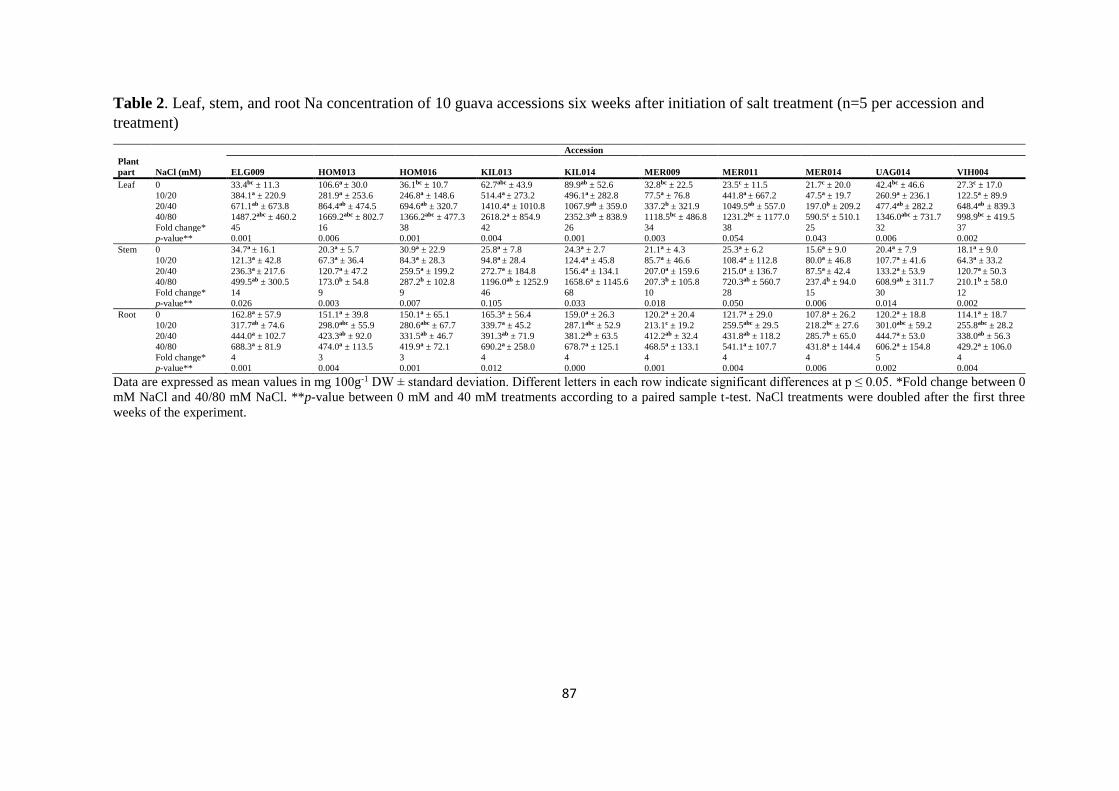
87
Table 2. Leaf, stem, and root Na concentration of 10 guava accessions six weeks after initiation of salt treatment (n=5 per accession and
treatment)
Accession Plant
part NaCl (mM) ELG009 HOM013 HOM016 KIL013 KIL014 MER009 MER011 MER014 UAG014 VIH004
Leaf 0 33.4bc ± 11.3 106.6a ± 30.0 36.1bc ± 10.7 62.7abc ± 43.9 89.9ab ± 52.6 32.8bc ± 22.5 23.5c ± 11.5 21.7c ± 20.0 42.4bc ± 46.6 27.3c ± 17.0
10/20 384.1a ± 220.9 281.9a ± 253.6 246.8a ± 148.6 514.4a ± 273.2 496.1a ± 282.8 77.5a ± 76.8 441.8a ± 667.2 47.5a ± 19.7 260.9a ± 236.1 122.5a ± 89.9
20/40 671.1ab ± 673.8 864.4ab ± 474.5 694.6ab ± 320.7 1410.4a ± 1010.8 1067.9ab ± 359.0 337.2b ± 321.9 1049.5ab ± 557.0 197.0b ± 209.2 477.4ab ± 282.2 648.4ab ± 839.3
40/80 1487.2abc ± 460.2 1669.2abc ± 802.7 1366.2abc ± 477.3 2618.2a ± 854.9 2352.3ab ± 838.9 1118.5bc ± 486.8 1231.2bc ± 1177.0 590.5c ± 510.1 1346.0abc ± 731.7 998.9bc ± 419.5
Fold change* 45 16 38 42 26 34 38 25 32 37
p-value** 0.001 0.006 0.001 0.004 0.001 0.003 0.054 0.043 0.006 0.002
Stem 0 34.7a ± 16.1 20.3a ± 5.7 30.9a ± 22.9 25.8a ± 7.8 24.3a ± 2.7 21.1a ± 4.3 25.3a ± 6.2 15.6a ± 9.0 20.4a ± 7.9 18.1a ± 9.0
10/20 121.3a ± 42.8 67.3a ± 36.4 84.3a ± 28.3 94.8a ± 28.4 124.4a ± 45.8 85.7a ± 46.6 108.4a ± 112.8 80.0a ± 46.8 107.7a ± 41.6 64.3a ± 33.2
20/40 236.3a ± 217.6 120.7a ± 47.2 259.5a ± 199.2 272.7a ± 184.8 156.4a ± 134.1 207.0a ± 159.6 215.0a ± 136.7 87.5a ± 42.4 133.2a ± 53.9 120.7a ± 50.3
40/80 499.5ab ± 300.5 173.0b ± 54.8 287.2b ± 102.8 1196.0ab ± 1252.9 1658.6a ± 1145.6 207.3b ± 105.8 720.3ab ± 560.7 237.4b ± 94.0 608.9ab ± 311.7 210.1b ± 58.0
Fold change* 14 9 9 46 68 10 28 15 30 12
p-value** 0.026 0.003 0.007 0.105 0.033 0.018 0.050 0.006 0.014 0.002
Root 0 162.8a ± 57.9 151.1a ± 39.8 150.1a ± 65.1 165.3a ± 56.4 159.0a ± 26.3 120.2a ± 20.4 121.7a ± 29.0 107.8a ± 26.2 120.2a ± 18.8 114.1a ± 18.7
10/20 317.7ab ± 74.6 298.0abc ± 55.9 280.6abc ± 67.7 339.7a ± 45.2 287.1abc ± 52.9 213.1c ± 19.2 259.5abc ± 29.5 218.2bc ± 27.6 301.0abc ± 59.2 255.8abc ± 28.2
20/40 444.0a ± 102.7 423.3ab ± 92.0 331.5ab ± 46.7 391.3ab ± 71.9 381.2ab ± 63.5 412.2ab ± 32.4 431.8ab ± 118.2 285.7b ± 65.0 444.7a ± 53.0 338.0ab ± 56.3
40/80 688.3a ± 81.9 474.0a ± 113.5 419.9a ± 72.1 690.2a ± 258.0 678.7a ± 125.1 468.5a ± 133.1 541.1a ± 107.7 431.8a ± 144.4 606.2a ± 154.8 429.2a ± 106.0
Fold change* 4 3 3 4 4 4 4 4 5 4
p-value** 0.001 0.004 0.001 0.012 0.000 0.001 0.004 0.006 0.002 0.004
Data are expressed as mean values in mg 100g-1 DW ± standard deviation. Different letters in each row indicate significant differences at p ≤ 0.05. *Fold change between 0
mM NaCl and 40/80 mM NaCl. **p-value between 0 mM and 40 mM treatments according to a paired sample t-test. NaCl treatments were doubled after the first three
weeks of the experiment.
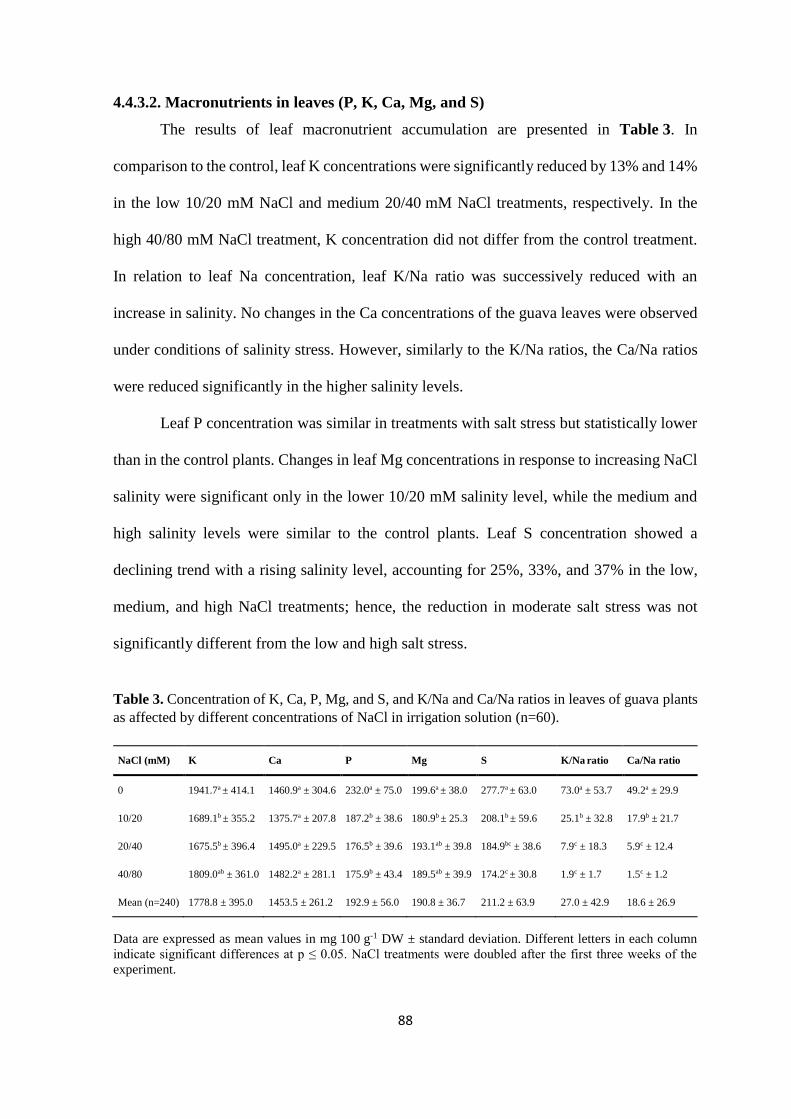
88
4.4.3.2. Macronutrients in leaves (P, K, Ca, Mg, and S)
The results of leaf macronutrient accumulation are presented in Table 3. In
comparison to the control, leaf K concentrations were significantly reduced by 13% and 14%
in the low 10/20 mM NaCl and medium 20/40 mM NaCl treatments, respectively. In the
high 40/80 mM NaCl treatment, K concentration did not differ from the control treatment.
In relation to leaf Na concentration, leaf K/Na ratio was successively reduced with an
increase in salinity. No changes in the Ca concentrations of the guava leaves were observed
under conditions of salinity stress. However, similarly to the K/Na ratios, the Ca/Na ratios
were reduced significantly in the higher salinity levels.
Leaf P concentration was similar in treatments with salt stress but statistically lower
than in the control plants. Changes in leaf Mg concentrations in response to increasing NaCl
salinity were significant only in the lower 10/20 mM salinity level, while the medium and
high salinity levels were similar to the control plants. Leaf S concentration showed a
declining trend with a rising salinity level, accounting for 25%, 33%, and 37% in the low,
medium, and high NaCl treatments; hence, the reduction in moderate salt stress was not
significantly different from the low and high salt stress.
Table 3. Concentration of K, Ca, P, Mg, and S, and K/Na and Ca/Na ratios in leaves of guava plants
as affected by different concentrations of NaCl in irrigation solution (n=60).
NaCl (mM) K Ca P Mg S K/Na ratio Ca/Na ratio
0 1941.7a ± 414.1 1460.9a ± 304.6 232.0a ± 75.0 199.6a ± 38.0 277.7a ± 63.0 73.0a ± 53.7 49.2a ± 29.9
10/20 1689.1b ± 355.2 1375.7a ± 207.8 187.2b ± 38.6 180.9b ± 25.3 208.1b ± 59.6 25.1b ± 32.8 17.9b ± 21.7
20/40 1675.5b ± 396.4 1495.0a ± 229.5 176.5b ± 39.6 193.1ab ± 39.8 184.9bc ± 38.6 7.9c ± 18.3 5.9c ± 12.4
40/80 1809.0ab ± 361.0 1482.2a ± 281.1 175.9b ± 43.4 189.5ab ± 39.9 174.2c ± 30.8 1.9c ± 1.7 1.5c ± 1.2
Mean (n=240) 1778.8 ± 395.0 1453.5 ± 261.2 192.9 ± 56.0 190.8 ± 36.7 211.2 ± 63.9 27.0 ± 42.9 18.6 ± 26.9
Data are expressed as mean values in mg 100 g-1 DW ± standard deviation. Different letters in each column
indicate significant differences at p ≤ 0.05. NaCl treatments were doubled after the first three weeks of the
experiment.
89
4.4.3.3. Micronutrients in leaves (B, Fe, Mn, and Zn)
The results of the micronutrient analysis of the leaf samples are depicted in Table S7.
B remained the same in the low and medium salinity levels, but was reduced significantly in
the high salinity level. A similar trend was observed with respect to Fe concentration. There
was no variation in the accumulation of Mn and Zn in leaves, which indicates that they
remained unaffected by all the salinity treatments.
4.4.3.4. Correlation among growth traits, DM, and Na content
A positive correlation between the changes in leaf number and that of the whole plant DM
was observed (Table 4.). A change in leaf DM positively correlated with the change in root
DM and DM change of the entire plant, while stem and root DM changes positively
correlated with the change in the DM of the whole plant. In addition, leaf DM change was
positively correlated with the change in the Na content of the leaf and that of the entire plant
but negatively with that of the stem Na content. The change in root DM positively correlated
with the change in the Na content of the leaf, root, and that of the entire plant. The entire
plant DM change positively correlated with the change in the leaf Na, root Na, and Na
content of the entire plant (Table 4). The change in leaf Na content positively correlated
with that of the root and whole plant, while the change in stem Na content only positively
correlated with that of the whole plant.
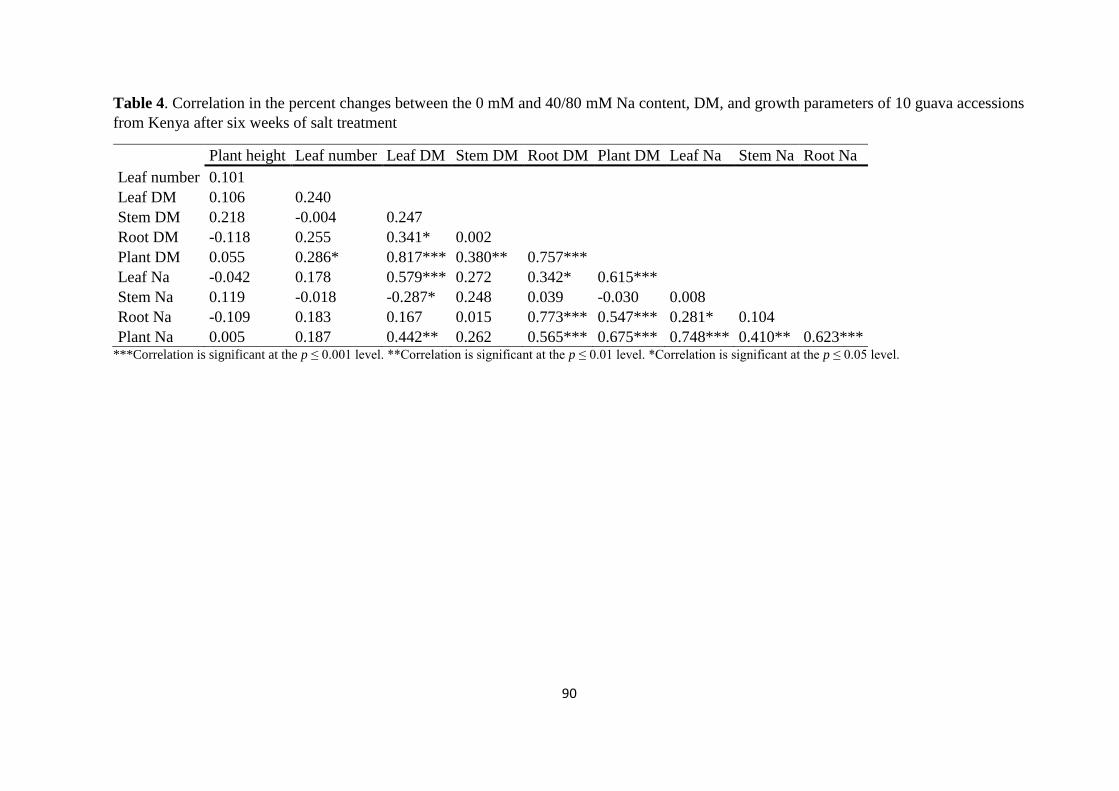
90
Table 4. Correlation in the percent changes between the 0 mM and 40/80 mM Na content, DM, and growth parameters of 10 guava accessions
from Kenya after six weeks of salt treatment
Plant height Leaf number Leaf DM Stem DM Root DM Plant DM Leaf Na Stem Na Root Na
Leaf number 0.101 Leaf DM 0.106 0.240 Stem DM 0.218 -0.004 0.247 Root DM -0.118 0.255 0.341* 0.002 Plant DM 0.055 0.286* 0.817*** 0.380** 0.757*** Leaf Na -0.042 0.178 0.579*** 0.272 0.342* 0.615*** Stem Na 0.119 -0.018 -0.287* 0.248 0.039 -0.030 0.008 Root Na -0.109 0.183 0.167 0.015 0.773*** 0.547*** 0.281* 0.104 Plant Na 0.005 0.187 0.442** 0.262 0.565*** 0.675*** 0.748*** 0.410** 0.623***
***Correlation is significant at the p ≤ 0.001 level. **Correlation is significant at the p ≤ 0.01 level. *Correlation is significant at the p ≤ 0.05 level.
91
4.5. Discussion
The salt injury was evident in all salinity treatments except the control and was more
pronounced in the higher salinity level. The symptoms began with slight leaf cupping,
followed by leaf chlorosis on the lower older leaves, which progressed to the upper younger
leaves. Eventually, in the medium and high salinity treatments, the leaves became necrotic
and started to fall off. Thus, the reduced leaf number in the medium and high salinity
treatments was due to salt injury in the older leaves which could no longer expand and dilute
the salt as was also observed by Munns and Tester (2008). However, the individual
accessions were observed to have varying degrees to which the salt could be tolerated, for
instance accessions ELG009, MER014 and UAG014 produced more leaves relative to the
control, though not significantly. The remaining accessions reduced in leaf number at
varying degrees in comparison to the control—indicative of existing genetic differences in
salt tolerance as pointed out by Munns and Tester (2008). The salt-related toxicity symptoms
observed are also consistent with observations in other experiments involving guava (Ebert
et al. 2002; da Silva et al. 2008).
The plant height in the salinity treatments of the present study were not significantly
different from those of the unstressed plants. However, variations among accessions were
noted: Accessions ELG009, HOM016, KIL014, MER014, and MER011 increased in plant
height at the high salt level in comparison to the control, while the other accessions reduced.
Several earlier studies involving guava have reported varying effects of salinity on plant
height (Ali-Dinar et al. 1999; Cavalcante et al. 2007; da Silva et al. 2008; Singh et al. 2016).
These studies described varied observations with regard to the salinity levels. For instance,
Cavalcante et al. (2007) reported a decrease in plant height during the initial development of
the guava seedlings when irrigated with water with EC of more than 1.5 dS m-1. Singh et al.
(2016) observed an increase in the plant height of guava seedlings up to an EC of 1.4 dS m-
92
1 relative to the control but with a decrease at an EC above 2.0 dS m-1 that was comparable
to the control. The differences relative to these growth parameters in the different studies
could be due to the duration of exposure to salinity, growing conditions, plant age, and
genotype, as was also reported by Maas (1993).
Leaf DM was significantly reduced in the medium 20/40 and high 40/80 mM NaCl
treatments, whereas DM in stems was significantly reduced only in the high salinity
treatments. Root DM was not significantly affected by all salinity levels. However, the
accessions were observed to have varied responses with regard to leaf, stem, and root DM
at the various salinities. Ali-Dinar et al. (1998) reported a reduction in the DM production
of leaves and stems with increasing salinity, even as root DM increased. However, da Silva
et al. (2008) observed that salinity reduced DW in roots but increased DW in leaves, and
therefore suggested that the roots were more affected by salinity than the shoot. These
different findings may be due to the varying longevity of the experiments, as they were set
up for 200 days (da Silva et al. 2008) and 12 weeks (Ali-Dinar et al. 1998), but they could
also be due to genetic differences, as observed in the 10 accessions of the present study.
Accession ELG009 was able to maintain and gain DM for leaf and root at the low, medium,
and high salinities, and lost the least DM at the total plant level. Accession HOM013, on the
other hand, lost the highest DM at the whole plant level. The decrease in leaf DM in the
20/40 mM and 40/80 mM NaCl treatments in this study could be attributed to the reduction
of leaf area and the reduced number of leaves. Decreased DM production under saline
conditions is attributed to a higher expenditure of metabolic energy and decreased carbon
gain, along with the adaption to salinity, as observed by Netondo et al. (2004) and reflected
in the reduction of leaf DM in the present study.
The relative water content of the leaves was significantly lower only at the high
salinity level compared to the control. The stem relative water content remained similar in
93
all the treatments while that of the roots increased with increasing salinity. The decrease of
leaf water content at the high salinity level and the observed cupping of leaves in this study
may be considered a response to water stress (Koller 1990) due to the decreased osmotic
potential caused by salinity in the root zone (Munns 2002). Owing to increased osmotic
potentials in the root zone, water availability reduces for plants under salinity. Therefore,
water uptake and turgor are reduced, whereby subsequently the stomata are closed. This, in
turn, leads to decreased transpiration and photosynthesis (Mastrogiannidou et al. 2016). The
reduced water uptake by the plant is likely to reduce the overall water content of plant leaves
and stems. The stem is a conduit for water and food transport to the leaves in plants;
therefore, the effect of reduced water content is expected to be less felt compared to the
leaves. Thus, similar values are observed in the stem water content for all the salinities. On
the other hand, an increase in the root water content was observed with a rise in the salinity
level in most accessions under the current study. Such an increase in relative water content
as a result of salinity in some plants has been attributed to compensate the possible
morphological changes to salinity (Saied et al. 2003). Additionally, the increased succulence
in some plants could be a morphological feature to avoid excessive ion concentration in their
tissues as observed by Larcher (2003). Moreover, at the high 40/80 mM NaCl treatment, the
water content in the roots increased significantly while the leaves experienced a significant
reduction, which might indicate either that water transportation to the leaves was hindered
due to reduced transpiration, and/or that the leaf injury was already severe, resulting in
reduced leaf area, as was also reported by da Silva et al. (2008).
The leaf Na content varied in all treatments for all the 10 genetically diverse
accessions, except in the low NaCl treatment. Variations among accessions in the control
prior to the introduction of treatments supplemented with NaCl could be attributed to the
fact that the Hoagland solution contained salts (e.g. sodium molybdate) which were
94
differentially accumulated, already indicating genotypic variation in salt uptake among the
guava accessions. The similarity of Na uptake at the low salinity level is likely to be due to
low concentrations of salt in the solution that did not significantly affect plant uptake by
altering the osmotic potential (Munns and Tester 2008). However, with a further increase in
salinity, differences in the accumulation of Na in leaves emerged among the accessions
which could be attributed to their genotypic differences. There was no differential
accumulation of Na in the stem until the high 40/80 mM NaCl treatment in all accessions.
This coincided with the time in which there was severe leaf drop, and therefore, much of the
Na remained in the stem and could not leave the transpiration stream. In contrast, the root
Na concentration varied at the lower and medium salinities but was similar for all accessions
at the highest salinity level. It has been proposed that Na in roots might accumulate up to a
certain saturation level, and when this is exceeded, leaf Na content increases (Esechie and
Rodriguez 1998). Guava was inefficient at excluding Na from the transpiration stream, as
greater amounts of Na were accumulated in the leaves with increasing salinity (Munns
1993). At the high salinity level, the root Na increased possibly due to reduced transpiration
as a result of reduced leaf number observed from the severe leaf drop.
Accession ELG009 (from the Rift Valley region) showed a tendency towards higher
Na accumulation while accession HOM016 (from the Western region) accumulated the least
Na based on the leaf, stem, root, and entire plant DM. Nevertheless, these accessions and all
the others in this study accumulated significant amounts of Na at the high salinity level
compared to the control based on whole plant DM. The positive correlations observed
between leaf and root DM with the Na content of the plant seems to play a role in
ameliorating the effects of Na toxicity within the plant—as salinity tolerance is usually
determined by the percentage of biomass production in saline versus control conditions over
a period of time (Martin et al. 1994). Accessions such as ELG009, KIL013, MER009 and
95
MER014 were able to maintain a higher whole plant DM despite also accumulating
appreciable Na content at the high salinity level compared to the control—indicative of their
higher degree of salinity tolerance compared to the other accessions.
Salinity is also associated with the plant’s ability to maintain balanced K levels under
saline conditions (Blumwald et al. 2000). K is an important osmoticum which is antagonistic
to Na, and it is generally believed that K is replaced by Na in plant tissues with an increase
in the NaCl levels (Kozlowski 1997; Marschner 2012). The leaf K/Na ratios in the present
study sharply reduced with rising salinity levels. Notably, the leaf K content decreased
slightly in relation to the control, though the decrease was not statistically significant.
Therefore, the observed decrease in the K/Na ratio in this study is mainly attributed to the
severe accumulation of Na rather than to the replacement of K, as was also suggested by
Negrão et al. (2017). Similarly, a lower K/Na ratio was observed in guava by Ebert et al.
(2002) in the control treatment in relation to treatments ameliorated by the application of
calcium nitrate (Ca[NO3]2). Accordingly, Ebert et al. (2002) did not observe replacement of
K by Na in guava seedlings treated with (Ca[NO3]2) under saline conditions. This may also
indicate that K was available under salt stress. According to He and Cramer (1993), changes
in K/Na ratios with rising salinity levels do not interact with K-Na selectivity; therefore,
neither of them was found to be correlated with salt resistance and may not represent a
reliable criterion for the selection of tolerant species. Similar observations were made for
Ca/Na ratios during the experiment, with the Ca content remaining unaffected by salinity in
the experiment, even though the Ca/Na ratio decreased with increasing salinity. When
exposed to Na, plants were found to respond directly and specifically to the enhancement of
cytosolic Ca (Munns and Tester 2008). Ca has been reported to ameliorate the performance
of plants under saline conditions as it can enhance membrane selectivity for K (Ebert et al.
2002; Marschner 2012) and may prevent toxic ion accumulations in cells (Cramer et al.
96
1987). Therefore, there seems to be a threshold level for Ca to ameliorate salinity effects in
guava plants. Ebert et al. (2002) observed enhanced K/Na and Ca/Na ratios with application
of 10 mM (Ca[NO3]2).
Relatively little is known about the effect of NaCl salinity on Mg, P, and S
accumulation in plants, including guava. In the present experiment, salinity-induced changes
in leaf Mg content slightly decreased relative to the control; however, the medium and high
salinity levels were statistically similar to the control. In contrast, Makhija et al. (1980)
reported that Mg levels in the leaves of guava seedlings increased with rising salinity levels.
Mastrogiannidou et al. (2016), however, found a negative correlation between salinity and
leaf Mg content in pomegranate when provided with half-strength Hoagland solution.
Further investigation to ascertain the effect of salinity on Mg uptake in guava is therefore
required. The P content showed a tendency to decrease with increasing salinity in the present
study. Similarly, Makhija et al. (1980) reported significant reductions of P concentrations in
guava. According to Grattan and Grieve (1998), the effects of salinity on P uptake vary
within plant species and according to experimental conditions, such as in the developmental
stage of plants, type, and level of salinity, as well as the P regime. Reduced P availability
under saline conditions may not only be a result of ionic-strength effects that lead to
decreased availability of P, but can also be associated with desorption-dissolution reactions
which control P release from the soil (Grattan and Grieve 1998). With regard to leaf S
content, to the knowledge of the authors of this paper, there is no report on the effects of
salinity on S accumulation in the leaves of guava plants. The study found that S content was
significantly decreased with rising salinity levels. In other studies, reduced S content was
also observed in the leaves of annuals, such as tomato plants (Balliu et al. 2015), maize
(Ausma et al. 2017), and pea (Mor and Manchanda 1992), when exposed to NaCl salinity.
Ausma et al. (2017) ascribed the measured decrease of S in maize to reduced sulphate
97
content. Mor and Manchanda (1992) suggested that reduced foliage S content may result
from a hampered S translocation caused by chloride (Cl) at the root–shoot interface. Sulphate
is assimilated in the roots by a proton gradient and transported to the chloroplasts in xylem
vessels via a transpiration stream (Nazar et al. 2011). Therefore, the observed decrease in
leaf S content with rising salinity levels in the present experiment may be attributed to both
reduced translocation of S caused by Cl at the root–shoot interface and reduced
transportation due to reduced evapotranspiration as a result of reduced leaf number and
possibly stomatal closure.
Currently, there is no report on the effect of NaCl-induced salinity on the
micronutrient composition of guava. In this study, relatively uniform B, Fe, Mn, and Zn
contents were observed, with B and Fe being statistically lower only at the high salinity level.
Grattan and Grieve (1998) observed that the solubility of Fe and Zn decreases further with
increasing salinity in tomato. However, other observations have been made in different
plants. For instance, Fe, Mn, and Zn concentrations increased in tomato and soybean under
salinity (Balliu et al. 2015). Hu and Schmidhalter (2001) found that the effect of salinity on
the foliage B, Fe, Mn, and Zn content of wheat were complex and depended on the levels of
macronutrients and salinity. Therefore, further investigation on the effect of NaCl-induced
salinity on the micronutrient content of guava is necessary.
4.6. Conclusion
All 10 accessions in the present study exhibited salt injury symptoms at varying
levels, and this was severe in the high salinity level. The accessions had varied responses
with regard to plant height and leaf number, showing varying degrees of tolerance. A
reduction in leaf DM also varied among the accessions although significant reductions were
observed in the medium and high salinity levels, while the leaf water content in the high
salinity level reduced significantly. Root DM remained stable under all salinity treatments
98
with root water content rising with increasing salinity levels; hence, water transport to the
leaves may have been hindered by reduced transpiration as a result of reduced leaf number.
The accessions varied in their DM production at different salinity levels relative to the
control, with accession ELG009 maintaining more DM. A reduction in leaf chlorophyll
content was observed, suggesting that the chlorophyll formation process was inhibited by
NaCl. A similarity in root Na concentration at the high salinity level in all the accessions
indicates that the lethality level was reached regardless of the genetic differences of the
accessions. Overall, a decrease in the K/Na and Ca/Na ratios was observed; however, similar
amounts of K and Ca were still maintained in the leaves at all salinity levels, which was
indicative of the accumulation of Na rather than the replacement of K and Ca by Na. The P
and S levels reduced with rising salinity, while the B and Fe concentrations reduced only
significantly at the high salinity level. Guava was not effective at excluding Na from the
transpiration stream as high amounts of Na were accumulated in leaves with increasing
salinity until 40 mM NaCl, which is when the plants began to die. However, accessions
which were able to maintain more leaf number, plant height, and biomass such as ELG009,
MER009, and MER014 could be targeted for adaptation to saline environments at salinity
levels below 40/80 mM.
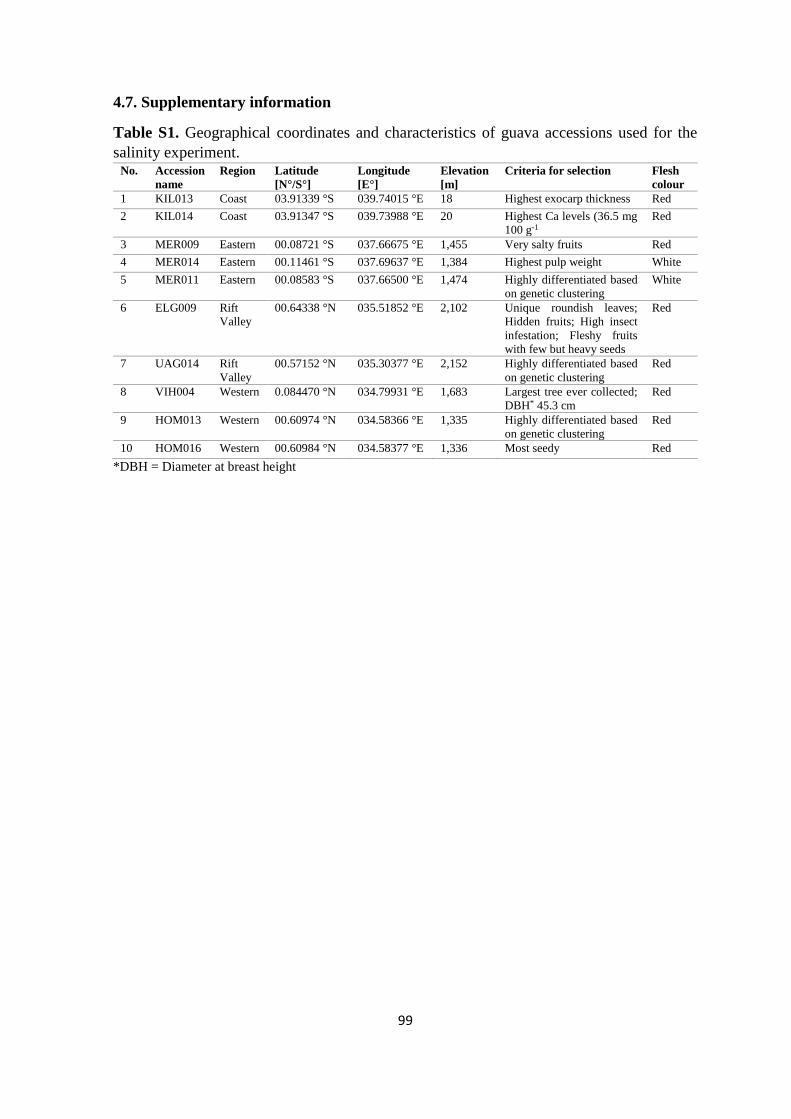
99
4.7. Supplementary information
Table S1. Geographical coordinates and characteristics of guava accessions used for the
salinity experiment. No. Accession
name
Region Latitude
[N°/S°]
Longitude
[E°]
Elevation
[m]
Criteria for selection Flesh
colour
1 KIL013 Coast 03.91339 °S 039.74015 °E 18 Highest exocarp thickness Red
2 KIL014 Coast 03.91347 °S 039.73988 °E 20 Highest Ca levels (36.5 mg
100 g-1
Red
3 MER009 Eastern 00.08721 °S 037.66675 °E 1,455 Very salty fruits Red
4 MER014 Eastern 00.11461 °S 037.69637 °E 1,384 Highest pulp weight White
5 MER011 Eastern 00.08583 °S 037.66500 °E 1,474 Highly differentiated based
on genetic clustering
White
6 ELG009 Rift
Valley
00.64338 °N 035.51852 °E 2,102 Unique roundish leaves;
Hidden fruits; High insect
infestation; Fleshy fruits
with few but heavy seeds
Red
7 UAG014 Rift
Valley
00.57152 °N 035.30377 °E 2,152 Highly differentiated based
on genetic clustering
Red
8 VIH004 Western 0.084470 °N 034.79931 °E 1,683 Largest tree ever collected;
DBH* 45.3 cm
Red
9 HOM013 Western 00.60974 °N 034.58366 °E 1,335 Highly differentiated based
on genetic clustering
Red
10 HOM016 Western 00.60984 °N 034.58377 °E 1,336 Most seedy Red
*DBH = Diameter at breast height
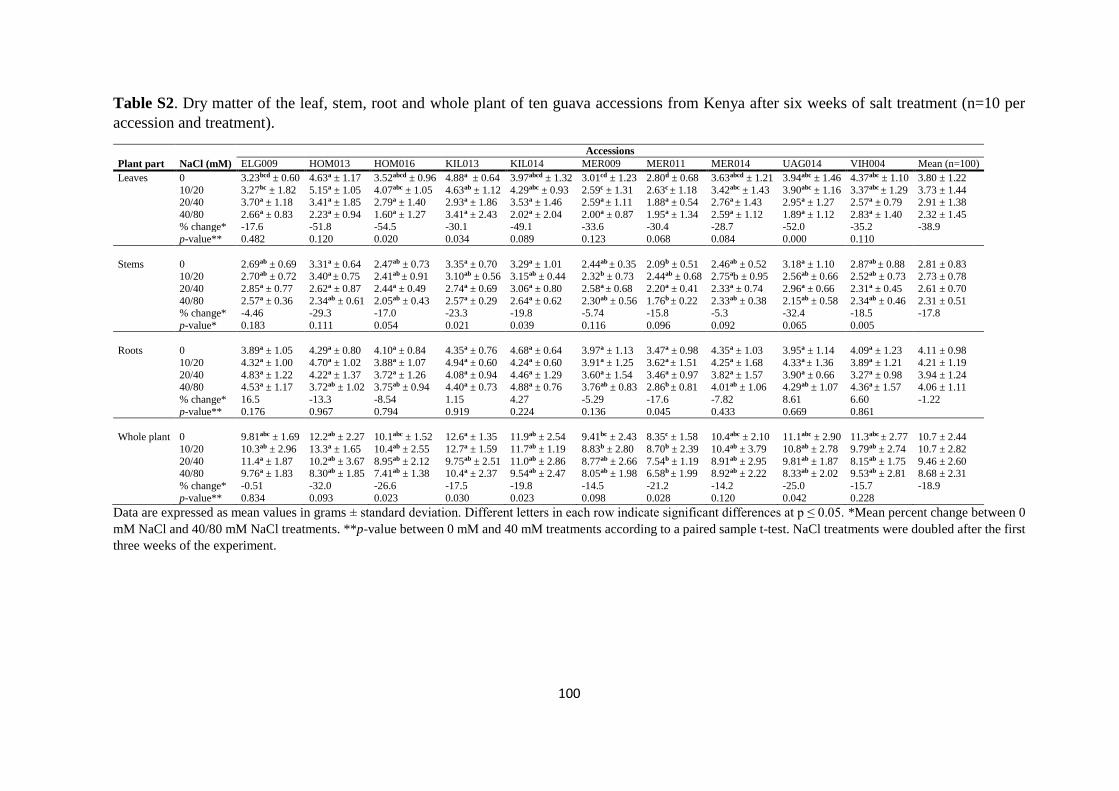
100
Table S2. Dry matter of the leaf, stem, root and whole plant of ten guava accessions from Kenya after six weeks of salt treatment (n=10 per
accession and treatment).
Plant part NaCl (mM)
Accessions
ELG009 HOM013 HOM016 KIL013 KIL014 MER009 MER011 MER014 UAG014 VIH004 Mean (n=100)
Leaves 0 3.23bcd ± 0.60 4.63a ± 1.17 3.52abcd ± 0.96 4.88a ± 0.64 3.97abcd ± 1.32 3.01cd ± 1.23 2.80d ± 0.68 3.63abcd ± 1.21 3.94abc ± 1.46 4.37abc ± 1.10 3.80 ± 1.22
10/20 3.27bc ± 1.82 5.15a ± 1.05 4.07abc ± 1.05 4.63ab ± 1.12 4.29abc ± 0.93 2.59c ± 1.31 2.63c ± 1.18 3.42abc ± 1.43 3.90abc ± 1.16 3.37abc ± 1.29 3.73 ± 1.44
20/40 3.70a ± 1.18 3.41a ± 1.85 2.79a ± 1.40 2.93a ± 1.86 3.53a ± 1.46 2.59a ± 1.11 1.88a ± 0.54 2.76a ± 1.43 2.95a ± 1.27 2.57a ± 0.79 2.91 ± 1.38
40/80 2.66a ± 0.83 2.23a ± 0.94 1.60a ± 1.27 3.41a ± 2.43 2.02a ± 2.04 2.00a ± 0.87 1.95a ± 1.34 2.59a ± 1.12 1.89a ± 1.12 2.83a ± 1.40 2.32 ± 1.45 % change* -17.6 -51.8 -54.5 -30.1 -49.1 -33.6 -30.4 -28.7 -52.0 -35.2 -38.9
p-value** 0.482 0.120 0.020 0.034 0.089 0.123 0.068 0.084 0.000 0.110
Stems 0 2.69ab ± 0.69 3.31a ± 0.64 2.47ab ± 0.73 3.35a ± 0.70 3.29a ± 1.01 2.44ab ± 0.35 2.09b ± 0.51 2.46ab ± 0.52 3.18a ± 1.10 2.87ab ± 0.88 2.81 ± 0.83
10/20 2.70ab ± 0.72 3.40a ± 0.75 2.41ab ± 0.91 3.10ab ± 0.56 3.15ab ± 0.44 2.32b ± 0.73 2.44ab ± 0.68 2.75ab ± 0.95 2.56ab ± 0.66 2.52ab ± 0.73 2.73 ± 0.78
20/40 2.85a ± 0.77 2.62a ± 0.87 2.44a ± 0.49 2.74a ± 0.69 3.06a ± 0.80 2.58a ± 0.68 2.20a ± 0.41 2.33a ± 0.74 2.96a ± 0.66 2.31a ± 0.45 2.61 ± 0.70
40/80 2.57a ± 0.36 2.34ab ± 0.61 2.05ab ± 0.43 2.57a ± 0.29 2.64a ± 0.62 2.30ab ± 0.56 1.76b ± 0.22 2.33ab ± 0.38 2.15ab ± 0.58 2.34ab ± 0.46 2.31 ± 0.51 % change* -4.46 -29.3 -17.0 -23.3 -19.8 -5.74 -15.8 -5.3 -32.4 -18.5 -17.8
p-value* 0.183 0.111 0.054 0.021 0.039 0.116 0.096 0.092 0.065 0.005 Roots 0 3.89a ± 1.05 4.29a ± 0.80 4.10a ± 0.84 4.35a ± 0.76 4.68a ± 0.64 3.97a ± 1.13 3.47a ± 0.98 4.35a ± 1.03 3.95a ± 1.14 4.09a ± 1.23 4.11 ± 0.98
10/20 4.32a ± 1.00 4.70a ± 1.02 3.88a ± 1.07 4.94a ± 0.60 4.24a ± 0.60 3.91a ± 1.25 3.62a ± 1.51 4.25a ± 1.68 4.33a ± 1.36 3.89a ± 1.21 4.21 ± 1.19
20/40 4.83a ± 1.22 4.22a ± 1.37 3.72a ± 1.26 4.08a ± 0.94 4.46a ± 1.29 3.60a ± 1.54 3.46a ± 0.97 3.82a ± 1.57 3.90a ± 0.66 3.27a ± 0.98 3.94 ± 1.24
40/80 4.53a ± 1.17 3.72ab ± 1.02 3.75ab ± 0.94 4.40a ± 0.73 4.88a ± 0.76 3.76ab ± 0.83 2.86b ± 0.81 4.01ab ± 1.06 4.29ab ± 1.07 4.36a ± 1.57 4.06 ± 1.11
% change* 16.5 -13.3 -8.54 1.15 4.27 -5.29 -17.6 -7.82 8.61 6.60 -1.22
p-value** 0.176 0.967 0.794 0.919 0.224 0.136 0.045 0.433 0.669 0.861
Whole plant 0 9.81abc ± 1.69 12.2ab ± 2.27 10.1abc ± 1.52 12.6a ± 1.35 11.9ab ± 2.54 9.41bc ± 2.43 8.35c ± 1.58 10.4abc ± 2.10 11.1abc ± 2.90 11.3abc ± 2.77 10.7 ± 2.44
10/20 10.3ab ± 2.96 13.3a ± 1.65 10.4ab ± 2.55 12.7a ± 1.59 11.7ab ± 1.19 8.83b ± 2.80 8.70b ± 2.39 10.4ab ± 3.79 10.8ab ± 2.78 9.79ab ± 2.74 10.7 ± 2.82
20/40 11.4a ± 1.87 10.2ab ± 3.67 8.95ab ± 2.12 9.75ab ± 2.51 11.0ab ± 2.86 8.77ab ± 2.66 7.54b ± 1.19 8.91ab ± 2.95 9.81ab ± 1.87 8.15ab ± 1.75 9.46 ± 2.60
40/80 9.76a ± 1.83 8.30ab ± 1.85 7.41ab ± 1.38 10.4a ± 2.37 9.54ab ± 2.47 8.05ab ± 1.98 6.58b ± 1.99 8.92ab ± 2.22 8.33ab ± 2.02 9.53ab ± 2.81 8.68 ± 2.31
% change* -0.51 -32.0 -26.6 -17.5 -19.8 -14.5 -21.2 -14.2 -25.0 -15.7 -18.9
p-value** 0.834 0.093 0.023 0.030 0.023 0.098 0.028 0.120 0.042 0.228
Data are expressed as mean values in grams ± standard deviation. Different letters in each row indicate significant differences at p ≤ 0.05. *Mean percent change between 0
mM NaCl and 40/80 mM NaCl treatments. **p-value between 0 mM and 40 mM treatments according to a paired sample t-test. NaCl treatments were doubled after the first
three weeks of the experiment.
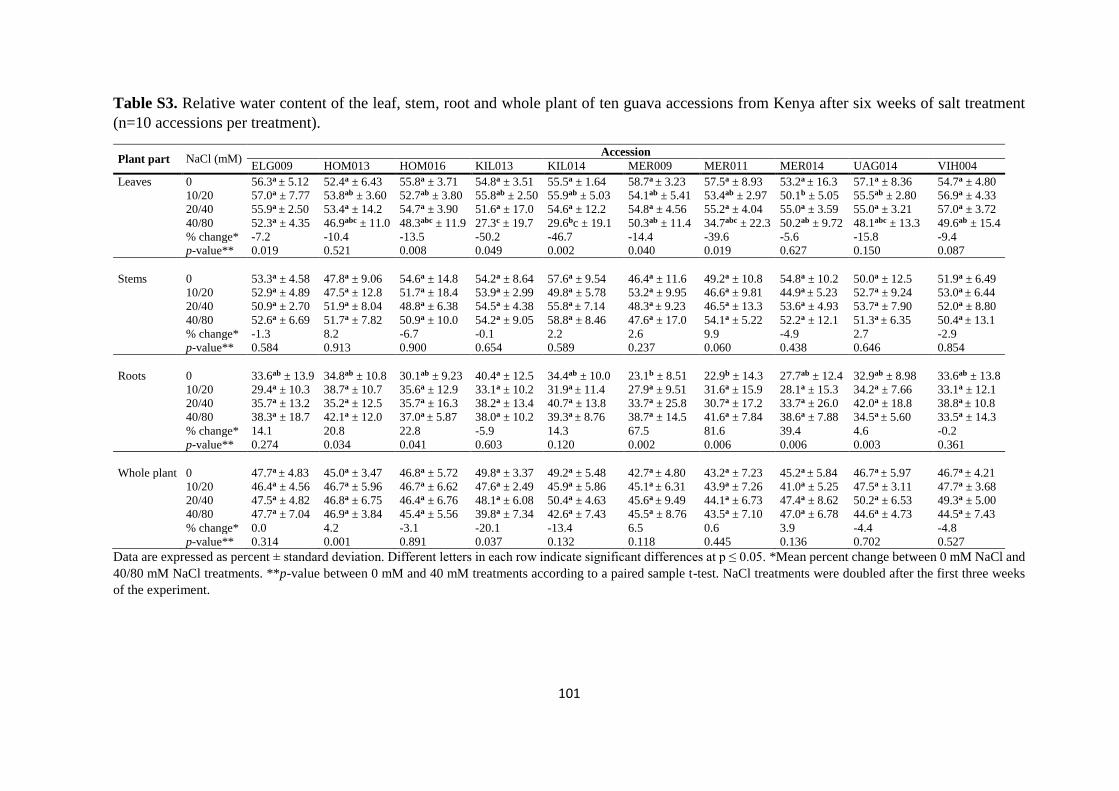
101
Table S3. Relative water content of the leaf, stem, root and whole plant of ten guava accessions from Kenya after six weeks of salt treatment
(n=10 accessions per treatment).
Plant part NaCl (mM) Accession
ELG009 HOM013 HOM016 KIL013 KIL014 MER009 MER011 MER014 UAG014 VIH004
Leaves 0 56.3a ± 5.12 52.4a ± 6.43 55.8a ± 3.71 54.8a ± 3.51 55.5a ± 1.64 58.7a ± 3.23 57.5a ± 8.93 53.2a ± 16.3 57.1a ± 8.36 54.7a ± 4.80
10/20 57.0a ± 7.77 53.8ab ± 3.60 52.7ab ± 3.80 55.8ab ± 2.50 55.9ab ± 5.03 54.1ab ± 5.41 53.4ab ± 2.97 50.1b ± 5.05 55.5ab ± 2.80 56.9a ± 4.33
20/40 55.9a ± 2.50 53.4a ± 14.2 54.7a ± 3.90 51.6a ± 17.0 54.6a ± 12.2 54.8a ± 4.56 55.2a ± 4.04 55.0a ± 3.59 55.0a ± 3.21 57.0a ± 3.72
40/80 52.3a ± 4.35 46.9abc ± 11.0 48.3abc ± 11.9 27.3c ± 19.7 29.6bc ± 19.1 50.3ab ± 11.4 34.7abc ± 22.3 50.2ab ± 9.72 48.1abc ± 13.3 49.6ab ± 15.4 % change* -7.2 -10.4 -13.5 -50.2 -46.7 -14.4 -39.6 -5.6 -15.8 -9.4
p-value** 0.019 0.521 0.008 0.049 0.002 0.040 0.019 0.627 0.150 0.087
Stems 0 53.3a ± 4.58 47.8a ± 9.06 54.6a ± 14.8 54.2a ± 8.64 57.6a ± 9.54 46.4a ± 11.6 49.2a ± 10.8 54.8a ± 10.2 50.0a ± 12.5 51.9a ± 6.49
10/20 52.9a ± 4.89 47.5a ± 12.8 51.7a ± 18.4 53.9a ± 2.99 49.8a ± 5.78 53.2a ± 9.95 46.6a ± 9.81 44.9a ± 5.23 52.7a ± 9.24 53.0a ± 6.44
20/40 50.9a ± 2.70 51.9a ± 8.04 48.8a ± 6.38 54.5a ± 4.38 55.8a ± 7.14 48.3a ± 9.23 46.5a ± 13.3 53.6a ± 4.93 53.7a ± 7.90 52.0a ± 8.80
40/80 52.6a ± 6.69 51.7a ± 7.82 50.9a ± 10.0 54.2a ± 9.05 58.8a ± 8.46 47.6a ± 17.0 54.1a ± 5.22 52.2a ± 12.1 51.3a ± 6.35 50.4a ± 13.1
% change* -1.3 8.2 -6.7 -0.1 2.2 2.6 9.9 -4.9 2.7 -2.9 p-value** 0.584 0.913 0.900 0.654 0.589 0.237 0.060 0.438 0.646 0.854
Roots 0 33.6ab ± 13.9 34.8ab ± 10.8 30.1ab ± 9.23 40.4a ± 12.5 34.4ab ± 10.0 23.1b ± 8.51 22.9b ± 14.3 27.7ab ± 12.4 32.9ab ± 8.98 33.6ab ± 13.8
10/20 29.4a ± 10.3 38.7a ± 10.7 35.6a ± 12.9 33.1a ± 10.2 31.9a ± 11.4 27.9a ± 9.51 31.6a ± 15.9 28.1a ± 15.3 34.2a ± 7.66 33.1a ± 12.1
20/40 35.7a ± 13.2 35.2a ± 12.5 35.7a ± 16.3 38.2a ± 13.4 40.7a ± 13.8 33.7a ± 25.8 30.7a ± 17.2 33.7a ± 26.0 42.0a ± 18.8 38.8a ± 10.8
40/80 38.3a ± 18.7 42.1a ± 12.0 37.0a ± 5.87 38.0a ± 10.2 39.3a ± 8.76 38.7a ± 14.5 41.6a ± 7.84 38.6a ± 7.88 34.5a ± 5.60 33.5a ± 14.3 % change* 14.1 20.8 22.8 -5.9 14.3 67.5 81.6 39.4 4.6 -0.2
p-value** 0.274 0.034 0.041 0.603 0.120 0.002 0.006 0.006 0.003 0.361
Whole plant 0 47.7a ± 4.83 45.0a ± 3.47 46.8a ± 5.72 49.8a ± 3.37 49.2a ± 5.48 42.7a ± 4.80 43.2a ± 7.23 45.2a ± 5.84 46.7a ± 5.97 46.7a ± 4.21
10/20 46.4a ± 4.56 46.7a ± 5.96 46.7a ± 6.62 47.6a ± 2.49 45.9a ± 5.86 45.1a ± 6.31 43.9a ± 7.26 41.0a ± 5.25 47.5a ± 3.11 47.7a ± 3.68
20/40 47.5a ± 4.82 46.8a ± 6.75 46.4a ± 6.76 48.1a ± 6.08 50.4a ± 4.63 45.6a ± 9.49 44.1a ± 6.73 47.4a ± 8.62 50.2a ± 6.53 49.3a ± 5.00
40/80 47.7a ± 7.04 46.9a ± 3.84 45.4a ± 5.56 39.8a ± 7.34 42.6a ± 7.43 45.5a ± 8.76 43.5a ± 7.10 47.0a ± 6.78 44.6a ± 4.73 44.5a ± 7.43 % change* 0.0 4.2 -3.1 -20.1 -13.4 6.5 0.6 3.9 -4.4 -4.8
p-value** 0.314 0.001 0.891 0.037 0.132 0.118 0.445 0.136 0.702 0.527
Data are expressed as percent ± standard deviation. Different letters in each row indicate significant differences at p ≤ 0.05. *Mean percent change between 0 mM NaCl and
40/80 mM NaCl treatments. **p-value between 0 mM and 40 mM treatments according to a paired sample t-test. NaCl treatments were doubled after the first three weeks
of the experiment.
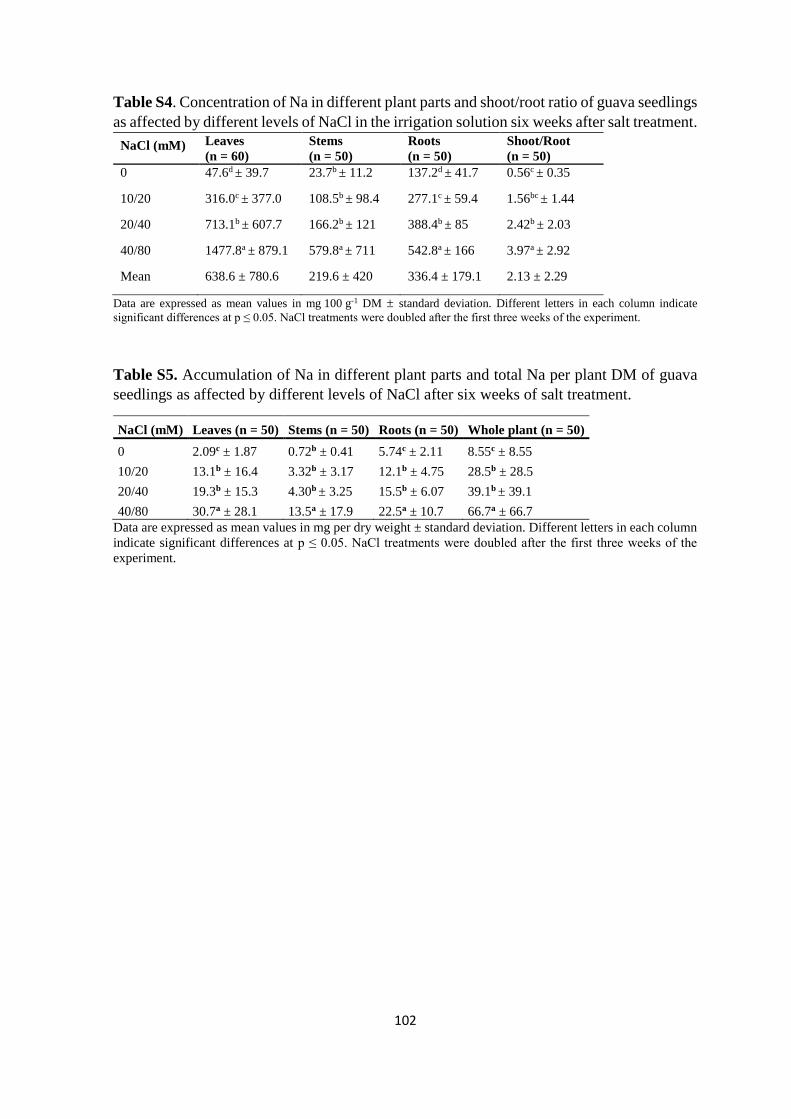
102
Table S4. Concentration of Na in different plant parts and shoot/root ratio of guava seedlings
as affected by different levels of NaCl in the irrigation solution six weeks after salt treatment.
NaCl (mM) Leaves
(n = 60)
Stems
(n = 50)
Roots
(n = 50)
Shoot/Root
(n = 50)
0 47.6d ± 39.7 23.7b ± 11.2 137.2d ± 41.7 0.56c ± 0.35
10/20 316.0c ± 377.0 108.5b ± 98.4 277.1c ± 59.4 1.56bc ± 1.44
20/40 713.1b ± 607.7 166.2b ± 121 388.4b ± 85 2.42b ± 2.03
40/80 1477.8a ± 879.1 579.8a ± 711 542.8a ± 166 3.97a ± 2.92
Mean 638.6 ± 780.6 219.6 ± 420 336.4 ± 179.1 2.13 ± 2.29
Data are expressed as mean values in mg 100 g-1 DM ± standard deviation. Different letters in each column indicate
significant differences at p ≤ 0.05. NaCl treatments were doubled after the first three weeks of the experiment.
Table S5. Accumulation of Na in different plant parts and total Na per plant DM of guava
seedlings as affected by different levels of NaCl after six weeks of salt treatment.
NaCl (mM) Leaves (n = 50) Stems (n = 50) Roots (n = 50) Whole plant (n = 50)
0 2.09c ± 1.87 0.72b ± 0.41 5.74c ± 2.11 8.55c ± 8.55
10/20 13.1b ± 16.4 3.32b ± 3.17 12.1b ± 4.75 28.5b ± 28.5
20/40 19.3b ± 15.3 4.30b ± 3.25 15.5b ± 6.07 39.1b ± 39.1
40/80 30.7a ± 28.1 13.5a ± 17.9 22.5a ± 10.7 66.7a ± 66.7
Data are expressed as mean values in mg per dry weight ± standard deviation. Different letters in each column
indicate significant differences at p ≤ 0.05. NaCl treatments were doubled after the first three weeks of the
experiment.
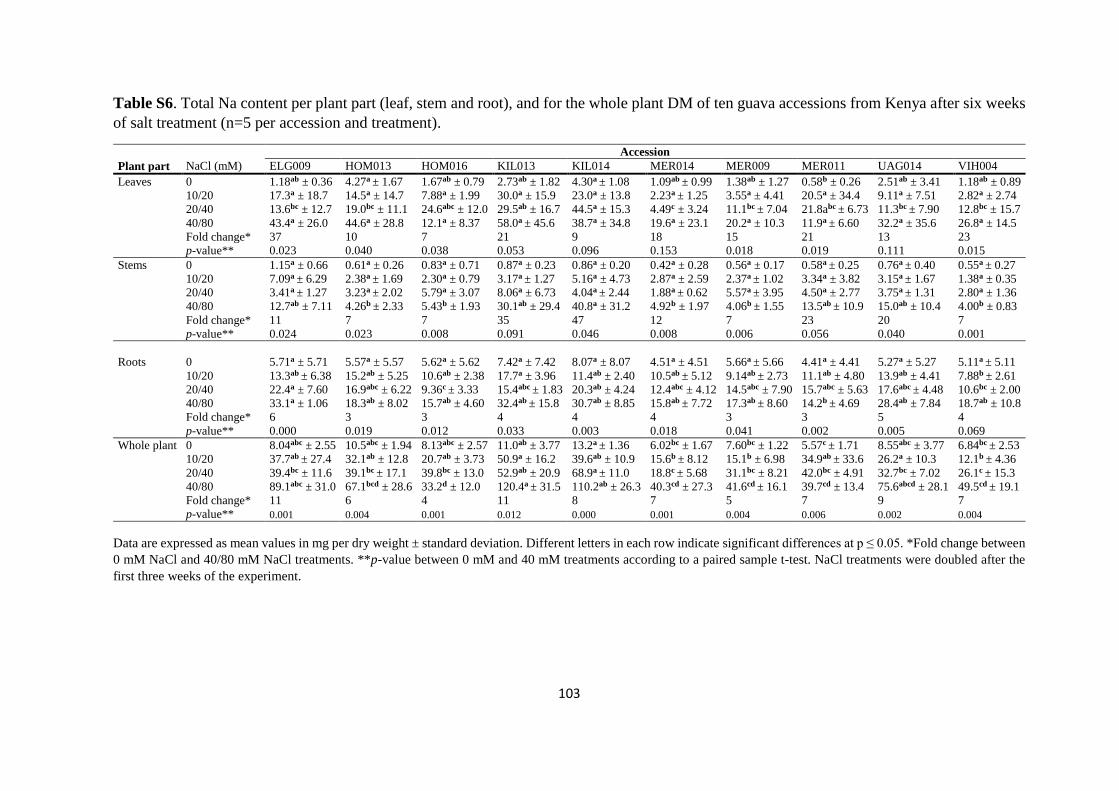
103
Table S6. Total Na content per plant part (leaf, stem and root), and for the whole plant DM of ten guava accessions from Kenya after six weeks
of salt treatment (n=5 per accession and treatment).
Plant part NaCl (mM)
Accession
ELG009 HOM013 HOM016 KIL013 KIL014 MER014 MER009 MER011 UAG014 VIH004
Leaves 0 1.18ab ± 0.36 4.27a ± 1.67 1.67ab ± 0.79 2.73ab ± 1.82 4.30a ± 1.08 1.09ab ± 0.99 1.38ab ± 1.27 0.58b ± 0.26 2.51ab ± 3.41 1.18ab ± 0.89
10/20 17.3a ± 18.7 14.5a ± 14.7 7.88a ± 1.99 30.0a ± 15.9 23.0a ± 13.8 2.23a ± 1.25 3.55a ± 4.41 20.5a ± 34.4 9.11a ± 7.51 2.82a ± 2.74
20/40 13.6bc ± 12.7 19.0bc ± 11.1 24.6abc ± 12.0 29.5ab ± 16.7 44.5a ± 15.3 4.49c ± 3.24 11.1bc ± 7.04 21.8abc ± 6.73 11.3bc ± 7.90 12.8bc ± 15.7
40/80 43.4a ± 26.0 44.6a ± 28.8 12.1a ± 8.37 58.0a ± 45.6 38.7a ± 34.8 19.6a ± 23.1 20.2a ± 10.3 11.9a ± 6.60 32.2a ± 35.6 26.8a ± 14.5
Fold change* 37 10 7 21 9 18 15 21 13 23
p-value** 0.023 0.040 0.038 0.053 0.096 0.153 0.018 0.019 0.111 0.015
Stems 0 1.15a ± 0.66 0.61a ± 0.26 0.83a ± 0.71 0.87a ± 0.23 0.86a ± 0.20 0.42a ± 0.28 0.56a ± 0.17 0.58a ± 0.25 0.76a ± 0.40 0.55a ± 0.27
10/20 7.09a ± 6.29 2.38a ± 1.69 2.30a ± 0.79 3.17a ± 1.27 5.16a ± 4.73 2.87a ± 2.59 2.37a ± 1.02 3.34a ± 3.82 3.15a ± 1.67 1.38a ± 0.35
20/40 3.41a ± 1.27 3.23a ± 2.02 5.79a ± 3.07 8.06a ± 6.73 4.04a ± 2.44 1.88a ± 0.62 5.57a ± 3.95 4.50a ± 2.77 3.75a ± 1.31 2.80a ± 1.36
40/80 12.7ab ± 7.11 4.26b ± 2.33 5.43b ± 1.93 30.1ab ± 29.4 40.8a ± 31.2 4.92b ± 1.97 4.06b ± 1.55 13.5ab ± 10.9 15.0ab ± 10.4 4.00b ± 0.83
Fold change* 11 7 7 35 47 12 7 23 20 7
p-value** 0.024 0.023 0.008 0.091 0.046 0.008 0.006 0.056 0.040 0.001
Roots 0 5.71a ± 5.71 5.57a ± 5.57 5.62a ± 5.62 7.42a ± 7.42 8.07a ± 8.07 4.51a ± 4.51 5.66a ± 5.66 4.41a ± 4.41 5.27a ± 5.27 5.11a ± 5.11
10/20 13.3ab ± 6.38 15.2ab ± 5.25 10.6ab ± 2.38 17.7a ± 3.96 11.4ab ± 2.40 10.5ab ± 5.12 9.14ab ± 2.73 11.1ab ± 4.80 13.9ab ± 4.41 7.88b ± 2.61
20/40 22.4a ± 7.60 16.9abc ± 6.22 9.36c ± 3.33 15.4abc ± 1.83 20.3ab ± 4.24 12.4abc ± 4.12 14.5abc ± 7.90 15.7abc ± 5.63 17.6abc ± 4.48 10.6bc ± 2.00
40/80 33.1a ± 1.06 18.3ab ± 8.02 15.7ab ± 4.60 32.4ab ± 15.8 30.7ab ± 8.85 15.8ab ± 7.72 17.3ab ± 8.60 14.2b ± 4.69 28.4ab ± 7.84 18.7ab ± 10.8
Fold change* 6 3 3 4 4 4 3 3 5 4
p-value** 0.000 0.019 0.012 0.033 0.003 0.018 0.041 0.002 0.005 0.069
Whole plant 0 8.04abc ± 2.55 10.5abc ± 1.94 8.13abc ± 2.57 11.0ab ± 3.77 13.2a ± 1.36 6.02bc ± 1.67 7.60bc ± 1.22 5.57c ± 1.71 8.55abc ± 3.77 6.84bc ± 2.53
10/20 37.7ab ± 27.4 32.1ab ± 12.8 20.7ab ± 3.73 50.9a ± 16.2 39.6ab ± 10.9 15.6b ± 8.12 15.1b ± 6.98 34.9ab ± 33.6 26.2a ± 10.3 12.1b ± 4.36
20/40 39.4bc ± 11.6 39.1bc ± 17.1 39.8bc ± 13.0 52.9ab ± 20.9 68.9a ± 11.0 18.8c ± 5.68 31.1bc ± 8.21 42.0bc ± 4.91 32.7bc ± 7.02 26.1c ± 15.3
40/80 89.1abc ± 31.0 67.1bcd ± 28.6 33.2d ± 12.0 120.4a ± 31.5 110.2ab ± 26.3 40.3cd ± 27.3 41.6cd ± 16.1 39.7cd ± 13.4 75.6abcd ± 28.1 49.5cd ± 19.1
Fold change* 11 6 4 11 8 7 5 7 9 7
p-value** 0.001 0.004 0.001 0.012 0.000 0.001 0.004 0.006 0.002 0.004
Data are expressed as mean values in mg per dry weight ± standard deviation. Different letters in each row indicate significant differences at p ≤ 0.05. *Fold change between
0 mM NaCl and 40/80 mM NaCl treatments. **p-value between 0 mM and 40 mM treatments according to a paired sample t-test. NaCl treatments were doubled after the
first three weeks of the experiment.
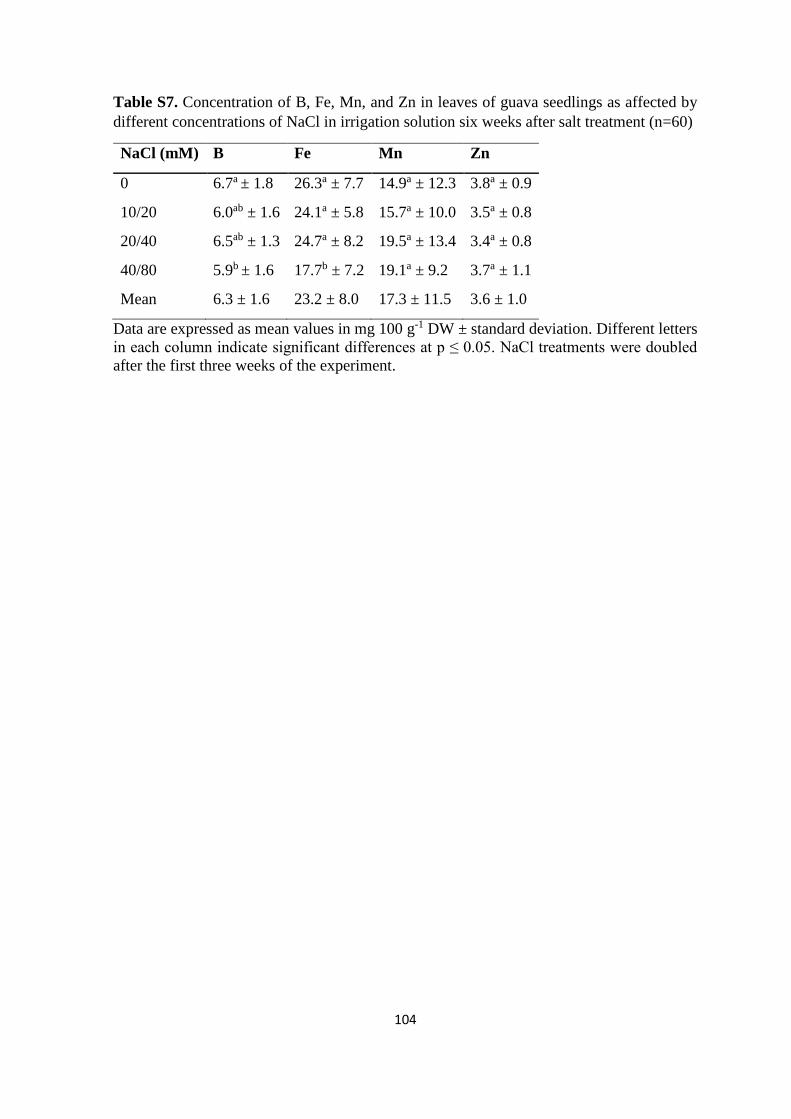
104
Table S7. Concentration of B, Fe, Mn, and Zn in leaves of guava seedlings as affected by
different concentrations of NaCl in irrigation solution six weeks after salt treatment (n=60)
NaCl (mM) B Fe Mn Zn
0 6.7a ± 1.8 26.3a ± 7.7 14.9a ± 12.3 3.8a ± 0.9
10/20 6.0ab ± 1.6 24.1a ± 5.8 15.7a ± 10.0 3.5a ± 0.8
20/40 6.5ab ± 1.3 24.7a ± 8.2 19.5a ± 13.4 3.4a ± 0.8
40/80 5.9b ± 1.6 17.7b ± 7.2 19.1a ± 9.2 3.7a ± 1.1
Mean 6.3 ± 1.6 23.2 ± 8.0 17.3 ± 11.5 3.6 ± 1.0
Data are expressed as mean values in mg 100 g-1 DW ± standard deviation. Different letters
in each column indicate significant differences at p ≤ 0.05. NaCl treatments were doubled
after the first three weeks of the experiment.
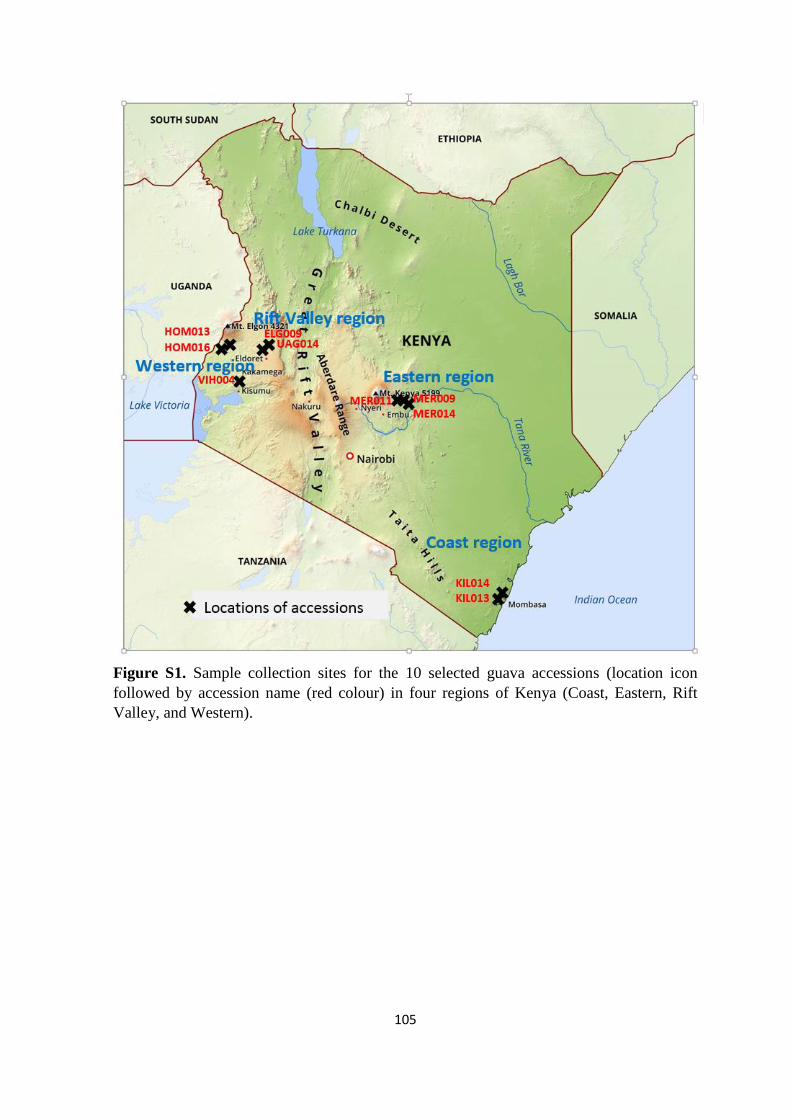
105
Figure S1. Sample collection sites for the 10 selected guava accessions (location icon
followed by accession name (red colour) in four regions of Kenya (Coast, Eastern, Rift
Valley, and Western).
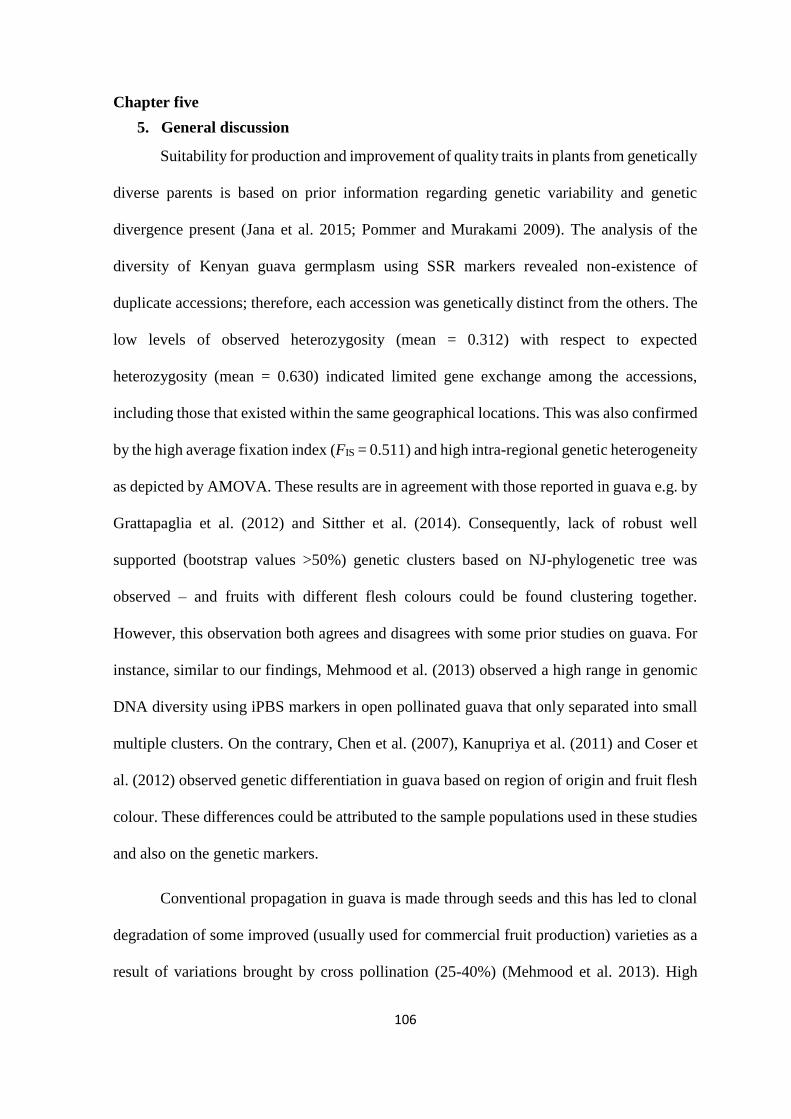
106
Chapter five
5. General discussion
Suitability for production and improvement of quality traits in plants from genetically
diverse parents is based on prior information regarding genetic variability and genetic
divergence present (Jana et al. 2015; Pommer and Murakami 2009). The analysis of the
diversity of Kenyan guava germplasm using SSR markers revealed non-existence of
duplicate accessions; therefore, each accession was genetically distinct from the others. The
low levels of observed heterozygosity (mean = 0.312) with respect to expected
heterozygosity (mean = 0.630) indicated limited gene exchange among the accessions,
including those that existed within the same geographical locations. This was also confirmed
by the high average fixation index (FIS = 0.511) and high intra-regional genetic heterogeneity
as depicted by AMOVA. These results are in agreement with those reported in guava e.g. by
Grattapaglia et al. (2012) and Sitther et al. (2014). Consequently, lack of robust well
supported (bootstrap values >50%) genetic clusters based on NJ-phylogenetic tree was
observed – and fruits with different flesh colours could be found clustering together.
However, this observation both agrees and disagrees with some prior studies on guava. For
instance, similar to our findings, Mehmood et al. (2013) observed a high range in genomic
DNA diversity using iPBS markers in open pollinated guava that only separated into small
multiple clusters. On the contrary, Chen et al. (2007), Kanupriya et al. (2011) and Coser et
al. (2012) observed genetic differentiation in guava based on region of origin and fruit flesh
colour. These differences could be attributed to the sample populations used in these studies
and also on the genetic markers.
Conventional propagation in guava is made through seeds and this has led to clonal
degradation of some improved (usually used for commercial fruit production) varieties as a
result of variations brought by cross pollination (25-40%) (Mehmood et al. 2013). High
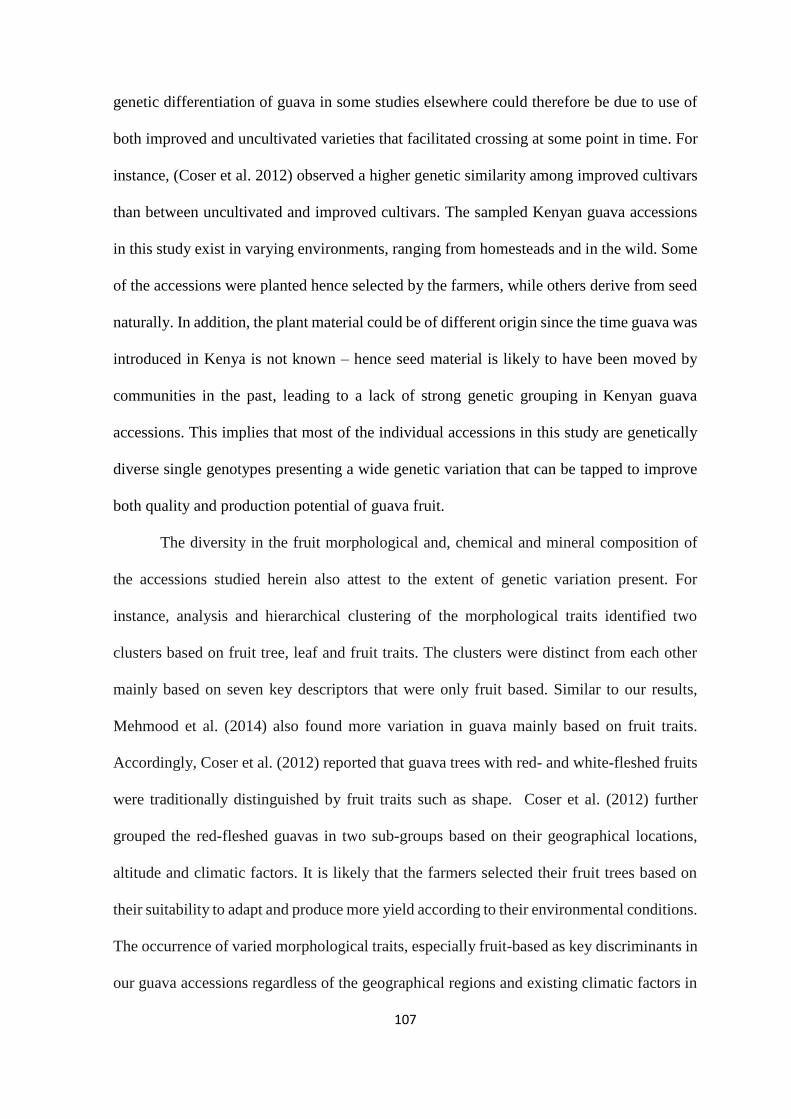
107
genetic differentiation of guava in some studies elsewhere could therefore be due to use of
both improved and uncultivated varieties that facilitated crossing at some point in time. For
instance, (Coser et al. 2012) observed a higher genetic similarity among improved cultivars
than between uncultivated and improved cultivars. The sampled Kenyan guava accessions
in this study exist in varying environments, ranging from homesteads and in the wild. Some
of the accessions were planted hence selected by the farmers, while others derive from seed
naturally. In addition, the plant material could be of different origin since the time guava was
introduced in Kenya is not known – hence seed material is likely to have been moved by
communities in the past, leading to a lack of strong genetic grouping in Kenyan guava
accessions. This implies that most of the individual accessions in this study are genetically
diverse single genotypes presenting a wide genetic variation that can be tapped to improve
both quality and production potential of guava fruit.
The diversity in the fruit morphological and, chemical and mineral composition of
the accessions studied herein also attest to the extent of genetic variation present. For
instance, analysis and hierarchical clustering of the morphological traits identified two
clusters based on fruit tree, leaf and fruit traits. The clusters were distinct from each other
mainly based on seven key descriptors that were only fruit based. Similar to our results,
Mehmood et al. (2014) also found more variation in guava mainly based on fruit traits.
Accordingly, Coser et al. (2012) reported that guava trees with red- and white-fleshed fruits
were traditionally distinguished by fruit traits such as shape. Coser et al. (2012) further
grouped the red-fleshed guavas in two sub-groups based on their geographical locations,
altitude and climatic factors. It is likely that the farmers selected their fruit trees based on
their suitability to adapt and produce more yield according to their environmental conditions.
The occurrence of varied morphological traits, especially fruit-based as key discriminants in
our guava accessions regardless of the geographical regions and existing climatic factors in
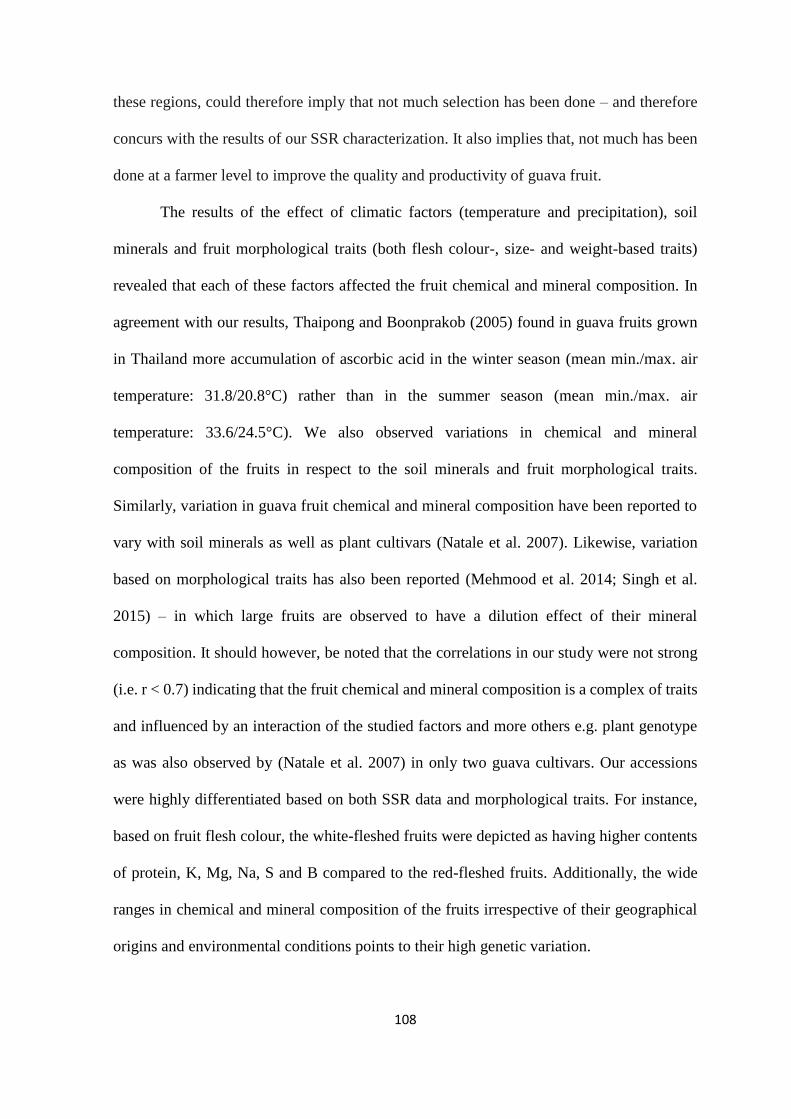
108
these regions, could therefore imply that not much selection has been done – and therefore
concurs with the results of our SSR characterization. It also implies that, not much has been
done at a farmer level to improve the quality and productivity of guava fruit.
The results of the effect of climatic factors (temperature and precipitation), soil
minerals and fruit morphological traits (both flesh colour-, size- and weight-based traits)
revealed that each of these factors affected the fruit chemical and mineral composition. In
agreement with our results, Thaipong and Boonprakob (2005) found in guava fruits grown
in Thailand more accumulation of ascorbic acid in the winter season (mean min./max. air
temperature: 31.8/20.8°C) rather than in the summer season (mean min./max. air
temperature: 33.6/24.5°C). We also observed variations in chemical and mineral
composition of the fruits in respect to the soil minerals and fruit morphological traits.
Similarly, variation in guava fruit chemical and mineral composition have been reported to
vary with soil minerals as well as plant cultivars (Natale et al. 2007). Likewise, variation
based on morphological traits has also been reported (Mehmood et al. 2014; Singh et al.
2015) – in which large fruits are observed to have a dilution effect of their mineral
composition. It should however, be noted that the correlations in our study were not strong
(i.e. r < 0.7) indicating that the fruit chemical and mineral composition is a complex of traits
and influenced by an interaction of the studied factors and more others e.g. plant genotype
as was also observed by (Natale et al. 2007) in only two guava cultivars. Our accessions
were highly differentiated based on both SSR data and morphological traits. For instance,
based on fruit flesh colour, the white-fleshed fruits were depicted as having higher contents
of protein, K, Mg, Na, S and B compared to the red-fleshed fruits. Additionally, the wide
ranges in chemical and mineral composition of the fruits irrespective of their geographical
origins and environmental conditions points to their high genetic variation.
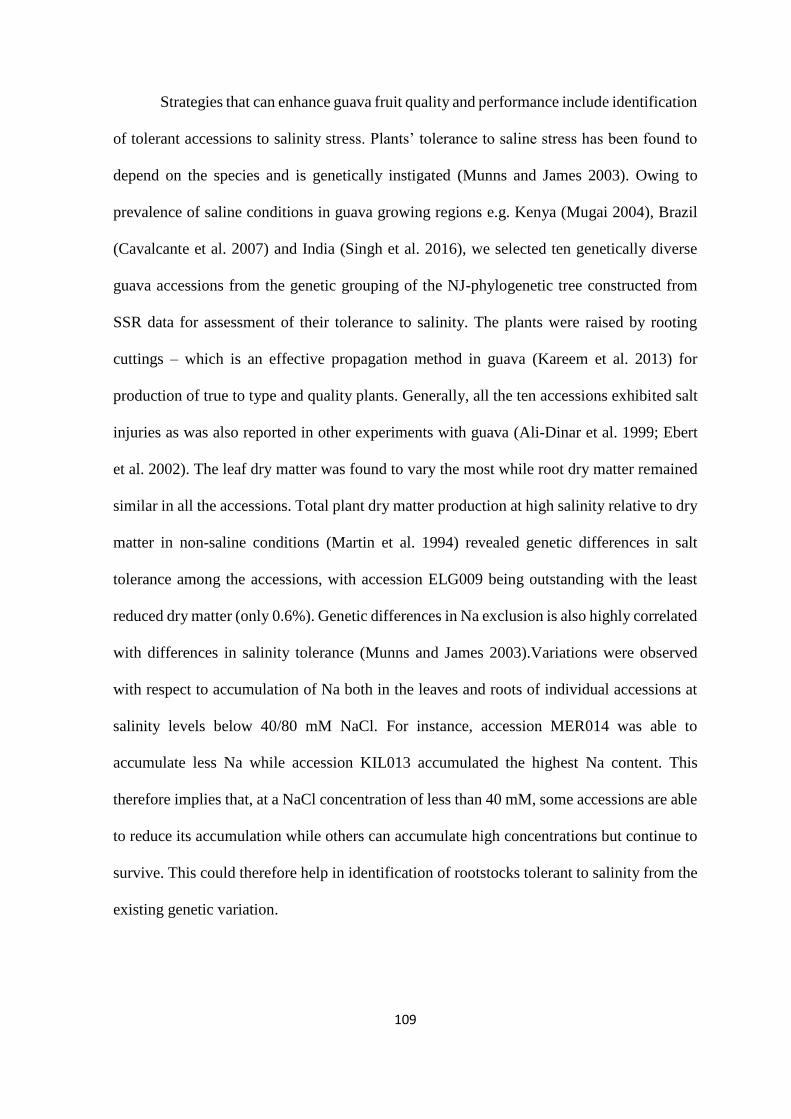
109
Strategies that can enhance guava fruit quality and performance include identification
of tolerant accessions to salinity stress. Plants’ tolerance to saline stress has been found to
depend on the species and is genetically instigated (Munns and James 2003). Owing to
prevalence of saline conditions in guava growing regions e.g. Kenya (Mugai 2004), Brazil
(Cavalcante et al. 2007) and India (Singh et al. 2016), we selected ten genetically diverse
guava accessions from the genetic grouping of the NJ-phylogenetic tree constructed from
SSR data for assessment of their tolerance to salinity. The plants were raised by rooting
cuttings – which is an effective propagation method in guava (Kareem et al. 2013) for
production of true to type and quality plants. Generally, all the ten accessions exhibited salt
injuries as was also reported in other experiments with guava (Ali-Dinar et al. 1999; Ebert
et al. 2002). The leaf dry matter was found to vary the most while root dry matter remained
similar in all the accessions. Total plant dry matter production at high salinity relative to dry
matter in non-saline conditions (Martin et al. 1994) revealed genetic differences in salt
tolerance among the accessions, with accession ELG009 being outstanding with the least
reduced dry matter (only 0.6%). Genetic differences in Na exclusion is also highly correlated
with differences in salinity tolerance (Munns and James 2003).Variations were observed
with respect to accumulation of Na both in the leaves and roots of individual accessions at
salinity levels below 40/80 mM NaCl. For instance, accession MER014 was able to
accumulate less Na while accession KIL013 accumulated the highest Na content. This
therefore implies that, at a NaCl concentration of less than 40 mM, some accessions are able
to reduce its accumulation while others can accumulate high concentrations but continue to
survive. This could therefore help in identification of rootstocks tolerant to salinity from the
existing genetic variation.
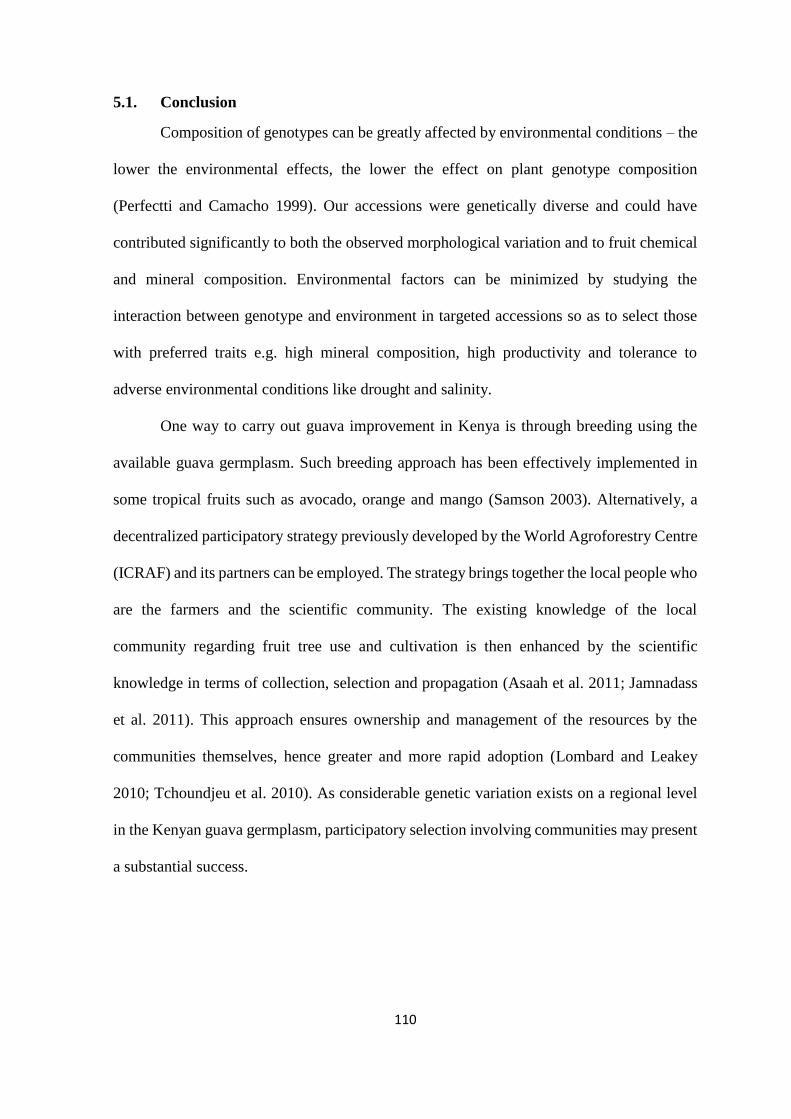
110
5.1. Conclusion
Composition of genotypes can be greatly affected by environmental conditions – the
lower the environmental effects, the lower the effect on plant genotype composition
(Perfectti and Camacho 1999). Our accessions were genetically diverse and could have
contributed significantly to both the observed morphological variation and to fruit chemical
and mineral composition. Environmental factors can be minimized by studying the
interaction between genotype and environment in targeted accessions so as to select those
with preferred traits e.g. high mineral composition, high productivity and tolerance to
adverse environmental conditions like drought and salinity.
One way to carry out guava improvement in Kenya is through breeding using the
available guava germplasm. Such breeding approach has been effectively implemented in
some tropical fruits such as avocado, orange and mango (Samson 2003). Alternatively, a
decentralized participatory strategy previously developed by the World Agroforestry Centre
(ICRAF) and its partners can be employed. The strategy brings together the local people who
are the farmers and the scientific community. The existing knowledge of the local
community regarding fruit tree use and cultivation is then enhanced by the scientific
knowledge in terms of collection, selection and propagation (Asaah et al. 2011; Jamnadass
et al. 2011). This approach ensures ownership and management of the resources by the
communities themselves, hence greater and more rapid adoption (Lombard and Leakey
2010; Tchoundjeu et al. 2010). As considerable genetic variation exists on a regional level
in the Kenyan guava germplasm, participatory selection involving communities may present
a substantial success.
111
References
Ali-Dinar H, Ebert G, Ludders P (1998) Biomass production and partitioning of guava
(Psidium guajava L.) in response to salinity and nitrogen nutrition. Angewandte
Botanik, Germany
Ali-Dinar H, Ebert G, Ludders P (1999) Growth, chlorophyll content, photo-synthesis and
water relations in guava (Psidium guajava L) under salinity and different nitrogen
supply. Gartenbauwissenschaft 64 (2):54-59
Alloway BJ (2004) Zinc in soils and crop nutrition. International Zinc Association Brussels,
Belgium
Ampomah-Dwamena C, Driedonks N, Lewis D, Shumskaya M, Chen X, Wurtzel ET, Espley
RV, Allan AC (2015) The Phytoene synthase gene family of apple (Malus x
domestica) and its role in controlling fruit carotenoid content. BMC Plant Biology
15 (1):185. doi:10.1186/s12870-015-0573-7
Araújo HM, Rodrigues FF, Costa WD, de FA Nonato C, Rodrigues FF, Boligon AA,
Athayde ML, Costa JG (2015) Chemical profile and antioxidant capacity verification
of Psidium guajava (Myrtaceae) fruits at different stages of maturation. EXCLI
Journal 14:1020-1030
Arimond M, Wiesmann D, Becquey E, Carriquiry A, Daniels MC, Deitchler M, Fanou-
Fogny N, Joseph ML, Kennedy G, Martin-Prevel Y (2010) Simple food group
diversity indicators predict micronutrient adequacy of women's diets in 5 diverse,
resource-poor settings. The Journal of Nutrition 140 (11):2059-2069
Asaah EK, Tchoundjeu Z, Leakey RR, Takousting B, Njong J, Edang I (2011) Trees,
agroforestry and multifunctional agriculture in Cameroon. International Journal of
Agricultural Sustainability 9 (1):110-119
Ausma T, Parmar S, Hawkesford MJ, De Kok LJ (2017) Impact of atmospheric H2S, salinity
and anoxia on sulfur metabolism in Zea mays. In: Sulfur Metabolism in Higher
Plants-Fundamental, Environmental and Agricultural Aspects. Springer, pp 93-101
Azevêdo JAG, Valadares Filho SdC, S. PDd, Detmann E, Valadares RFD, Pereira LGR,
Souza NKP, Silva LFC (2011) Intake, total digestibility, microbial protein
production and the nitrogen balance in diets with fruit by-products for ruminants.
Rev Bras Zootec 40 (5):1052-1060
Babu KD, Patel RK, Yadav DS (2007) Comparative evaluation of guava selections under
North Eastern region of India. Acta Horticulturae (735):99-103
Bajpai A, Chandra R, Rajan S, Srivastava N (2008) RAPD and minisatellite markers for
genetic diversity and relationship in guava varieties. Indian Journal of Genetics and
Plant Breeding 68 (4):441
Balliu A, Sallaku G, Rewald B (2015) AMF inoculation enhances growth and improves the
nutrient uptake rates of transplanted, salt-stressed tomato seedlings. Sustainability 7
(12):15967-15981
Belaj A, Satovic Z, Cipriani G, Baldoni L, Testolin R, Rallo L, Trujillo I (2003) Comparative
study of the discriminating capacity of RAPD, AFLP and SSR markers and of their
effectiveness in establishing genetic relationships in olive. Theoretical and Applied
Genetics 107 (4):736-744
Blumwald E, Aharon GS, Apse MP (2000) Sodium transport in plant cells. Biochimica et
Biophysica Acta 1465 (1-2):140-151
Bradford MM (1976) A rapid and sensitive method for the quantitation of microgram
quantities of protein utilizing the principle of protein-dye binding. Analytical
Biochemistry 72 (1-2):248-254

112
Bresler E, McNeal BL, Carter DL (2012) Saline and sodic soils: principles-dynamics-
modeling. Springer Science and Business Media, Vol 10
Burlingame B, Charrondiere R, Mouille B (2009) Food composition is fundamental to the
cross-cutting initiative on biodiversity for food and nutrition. Journal of Food
Composition and Analysis 22 (5):361-365
CABI (2013) Invasive species compendium. CAB International. Wallingford, UK
Cavalcante ÍHL, Cavalcante L, Hu Y, Beckmann-Cavalcante M (2007) Water salinity and
initial development of four guava (Psidium guajava L.) cultivars in North-eastern
Brazil. Journal of Fruit and Ornamental Plant Research (15):71-80
Chandra R, Mishra M (2007) Biotechnological interventions for improvement of Guava
(Psidium guajava L.). Acta Horticulturae (735):117-125
Chen T, Ng C, Wang C, Shyu Y (2007) Molecular identification and analysis of Psidium
guajava L. from indigenous tribes of Taiwan. Journal of Food and Drug Analysis 15
(1):82-88
Chikamai B, Eyog-Matig O, Mbogga M (2004) Review and appraisal on the status of
indigenous fruits in Eastern Africa. IPGRI-SAFORGEN report
Choudhary ML, Dikshit S, Neeraj S, Saxena R (2012) Studies on physico-chemical
properties of different guava varieties under agro-climatic conditions of Chhattisgarh
plains. Progressive Horticulture 44 (2):340-341
Coser SM, daSilva FMF, Ferreira A, Mitre LK, Carvalho CR, Clarindo WR (2012)
Assessment of genetic diversity in Psidium guajava L. using different approaches.
Scientia Horticulturae 148:223-229
Cramer GR, Lynch J, Läuchli A, Epstein E (1987) Influx of Na+, K+, and Ca2+ into roots of
salt-stressed cotton seedlings: effects of supplemental Ca2+. Plant Physiology 83
(3):510-516
Crane JH, Balerdi CF (2005) Guava growing in the Florida home landscape. Horticultural
Sciences Department Document HS4, Florida Cooperative Extension Service
Institute of Food and Agricultural Sciences, University of Florida:1-8
da Silva AB, Fernandes PD, Gheyi HR, Blanco FF (2008) Growth and yield of guava
irrigated with saline water and addition of farmyard manure. Revista Brasileira de
Ciências Agrárias 3 (4):354-359
Desai U, Singh R (1983) Biochemical studies in guava as influenced by salinity. Indian
Journal of Horticulture 40 (3/4):160-164
Dieringer D, Schlötterer C (2003) Microsatellite analyser (MSA): A platform independent
analysis tool for large microsatellite data sets. Molecular Ecology Notes 3 (1):167-
169
Dinesh M, Yadav I (1998) Half-sib analysis in guava (Psidium guajava). Indian Journal of
Horticulture 55 (1):20-22
Earl DA, von Holdt B (2012) STRUCTURE HARVESTER: a website and program for
visualizing STRUCTURE output and implementing the Evanno method.
Conservation genetics resources 4 (2):359-361
Ebert G Salinity problems in (sub-) tropical fruit production. In: II ISHS conference on fruit
production in the tropics and subtropics 531, 1999. pp 99-106
Ebert G, Eberle J, Ali-Dinar H, Lüdders P (2002) Ameliorating effects of Ca(NO3)2 on
growth, mineral uptake and photosynthesis of NaCl-stressed guava seedlings
(Psidium guajava L.). Scientia Horticulturae 93 (2):125-135
Ecocrop (2015) Ecocrop database. FAO, Rome, Italy.
El-Sisy WAAZ (2013) Evaluation of some genotypes of guava trees grown under Alexandria
Governorate condition I. Vegetative growth, flowering and fruit quality. World
Applied Sciences Journal 28 (4):583-595
113
Esechie HA, Rodriguez V (1998) Ion compartmentation in salinity‐stressed alfalfa seedlings
growing under different temperature regimes. Communications in Soil Science and
Plant Analysis 29 (17-18):2607-2618
Evanno G, Regnaut S, Goudet J (2005) Detecting the number of clusters of individuals using
the software STRUCTURE: a simulation study. Molecular ecology 14 (8):2611-2620
Fandi M, Muhtaseb J, Hussein M (2010) Effect of N, P, K concentrations on yield and fruit
quality of tomato (Solanum lycopersicum L.) in tuff culture. Journal of Central
European Agriculture 11 (2):179-184
FAO (2003) The state of food insecurity in the world 2003. FAO, Rome.
Faurobert M, Pelpoir E, Chaïb J (2007) Phenol extraction of proteins for proteomic studies
of recalcitrant plant tissues. Plant Proteomics: Methods and Protocols:9-14
Felsenstein J (1993) Phylogeny inference package. Department of Genetics, University of
Washington, Seattle, WA, USA
Fick SE, Hijmans RJ (2017) WorldClim 2: new 1‐km spatial resolution climate surfaces for
global land areas. International Journal of Climatology 37 (12):4302-4315
Flores G, Dastmalchi K, Wu S-B, Whalen K, Dabo AJ, Reynertson KA, Foronjy RF,
Kennelly EJ (2013) Phenolic-rich extract from the Costa Rican guava (Psidium
friedrichsthalianum) pulp with antioxidant and anti-inflammatory activity. Potential
for COPD therapy. Food Chemistry 141 (2):889-895
Flores G, Wu S-B, Negrin A, Kennelly EJ (2015) Chemical composition and antioxidant
activity of seven cultivars of guava (Psidium guajava) fruits. Food Chemistry
170:327-335
Flowers TJ, Garcia A, Koyama M, Yeo AR (1997) Breeding for salt tolerance in crop
plants—the role of molecular biology. Acta Physiologiae Plantarum 19 (4):427-433
Forster MP, Rodríguez ER, Martín JD, Romero CD (2002) Statistical differentiation of
bananas according to their mineral composition. Journal of Agricultural and Food
Chemistry 50 (21):6130-6135
Francisco VSS, Reginaldo GN, Luderlândio AS, Rômulo CLM, Emanoela PdP, Fernanda
AO (2016) Tolerance of guava rootstocks under salt stress. Revista Brasileira de
Engenharia Agrícola e Ambiental 20 (12):1072-1077
Galli JA, Michelotto MD, Soares MBB, Martins ALM, Palharini MCdA, Fischer IH (2015)
Characterization of guava plants belonging to a germplasm bank and cultivated in an
organic system. International Symposium on Innovation in Integrated and Organic
Horticulture (INNOHORT) 1137:213-218
Gautam NN, Singh K, Singh B, Seal S, Goel A, Goel V (2010) Studies on clonal
multiplication of guava (Psidium guajava L.) through cutting under controlled
conditions. Australian Journal of Crop Science 4 (9):666
Govaerts R, Sobral M, Ashton P, Barrie F, Holst BK, Landrum LL, Matsumoto K, Mazine
FF, Lughadha EN, Proneça C (2008) World checklist of Myrtaceae. Royal Botanic
Gardens, London
Grattan S, Grieve C (1998) Salinity–mineral nutrient relations in horticultural crops. Scientia
Horticulturae 78 (1-4):127-157
Grattapaglia D, Vaillancourt RE, Shepherd M, Thumma BR, Foley W, Külheim C, Potts
BM, Myburg AA (2012) Progress in Myrtaceae genetics and genomics: Eucalyptus
as the pivotal genus. Tree Genetics and Genomes 8 (3):463-508
Griesbach J (2007) Growing temperate fruit trees in Kenya. World Agroforestry Centre,
Nairobi
114
Gull J, Sultana B, Anwar F, Naseer R, Ashraf M, Ashrafuzzaman M (2012) Variation in
antioxidant attributes at three ripening stages of guava (Psidium guajava L.) fruit
from different geographical regions of Pakistan. Molecules 17 (3):3165-3180
Gutiérrez RMP, Mitchell S, Solis RV (2008) Psidium guajava: A review of its traditional
uses, phytochemistry and pharmacology. Journal of Ethnopharmacology 117 (1):1-
27
Haque MN, Saha BK, Karim MR, Bhuiyan MNH (2009) Evaluation of nutritional and
physico-chemical properties of several selected fruits in Bangladesh. Bangladesh
Journal of Scientific and Industrial Research 44 (3):353-358
Hassimotto NMA, Genovese MI, Lajolo FM (2005) Antioxidant activity of dietary fruits,
vegetables, and commercial frozen fruit pulps. Journal of Agricultural and Food
Chemistry 53 (8):2928-2935
HCD (2014) Horticultural Crops Directorate. Horticulture validated report 2014. pp68.
Available: http://www.agricultureauthority.go.ke/wp-
content/uploads/2016/05/Horticulture-Validated-Report-2014-Final-copy.pdf.
(Accessed 30 Nov 2017)
HCDA (2010) (Horticultural Crops Development Authority). Horticulture validated report
2010. pp74
He T, Cramer G (1993) Salt tolerance of rapid‐cycling Brassica species in relation to
potassium/sodium ratio and selectivity at the whole plant and callus levels. Journal
of Plant Nutrition 16 (7):1263-1277
Hoagland DR, Arnon DI (1950) The water-culture method for growing plants without soil.
Circular California Agricultural Experiment Station 347 (2nd edition)
Hu Y, Schmidhalter U (2001) Effects of salinity and macronutrient levels on micronutrients
in wheat. Journal of Plant Nutrition 24 (2):273-281
Hu Y, Schmidhalter U (2004) Limitation of salt stress to plant growth. HOCK, E Plant
toxicology 4:191-224
IBM (2011) IBM SPSS statistics for Windows, version 20.0. New York: IBM Corp
IPGRI (2006) Descriptors for Mango (Mangifera indica L.) International Plant Genetic
Resources Institute, Rome, Italy
Iqbal S, Bhanger M (2006) Effect of season and production location on antioxidant activity
of Moringa oleifera leaves grown in Pakistan. Journal of Food Composition and
Analysis 19 (6):544-551
Jackson ML (1967) Soil chemical analysis. Prentice-Hall, Inc; Englewood Cliffs, NJ, USA
Jamnadass RH, Dawson IK, Franzel S, Leakey RRB, Mithöfer D, Akinnifesi FK,
Tchoundjeu Z (2011) Improving livelihoods and nutrition in sub-Saharan Africa
through the promotion of indigenous and exotic fruit production in smallholders'
agroforestry systems: a review. International Forestry Review 13 (3):338-354
Jana BR, Munsi PS, Manna DC, Sarkar H, Das B (2015) Genetic divergence studies in guava
(Psidium guajava L.). Electronic Journal of Plant Breeding 6 (1):161-166
Jiménez-Escrig A, Rincón M, Pulido R, Saura-Calixto F (2001) Guava fruit (Psidium
guajava L.) as a new source of antioxidant dietary fiber. Journal of Agricultural and
Food Chemistry 49 (11):5489-5493
Kakon A, Haque M, Mohsin M (2008) Effect of three growth regulators on mound layering
in the three varieties of guava. SAARC Journal of Agriculture 6 (2):39-47
Kanupriya P, Madhavi LC, Aswath LRB, Padmakar C, Vasugi, Dinesh MR (2011) Cultivar
identification and genetic fingerprinting of guava (Psidium guajava) using
microsatellite markers. International Journal of Fruit Science 11 (2):184-196
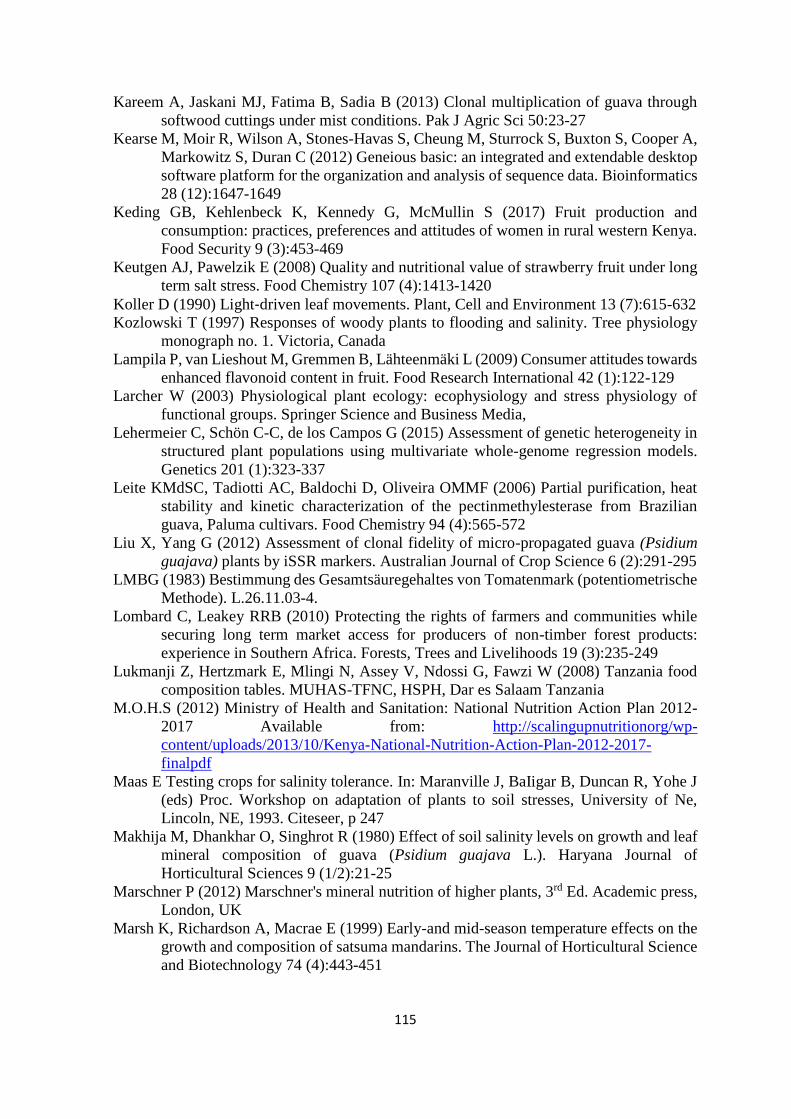
115
Kareem A, Jaskani MJ, Fatima B, Sadia B (2013) Clonal multiplication of guava through
softwood cuttings under mist conditions. Pak J Agric Sci 50:23-27
Kearse M, Moir R, Wilson A, Stones-Havas S, Cheung M, Sturrock S, Buxton S, Cooper A,
Markowitz S, Duran C (2012) Geneious basic: an integrated and extendable desktop
software platform for the organization and analysis of sequence data. Bioinformatics
28 (12):1647-1649
Keding GB, Kehlenbeck K, Kennedy G, McMullin S (2017) Fruit production and
consumption: practices, preferences and attitudes of women in rural western Kenya.
Food Security 9 (3):453-469
Keutgen AJ, Pawelzik E (2008) Quality and nutritional value of strawberry fruit under long
term salt stress. Food Chemistry 107 (4):1413-1420
Koller D (1990) Light‐driven leaf movements. Plant, Cell and Environment 13 (7):615-632
Kozlowski T (1997) Responses of woody plants to flooding and salinity. Tree physiology
monograph no. 1. Victoria, Canada
Lampila P, van Lieshout M, Gremmen B, Lähteenmäki L (2009) Consumer attitudes towards
enhanced flavonoid content in fruit. Food Research International 42 (1):122-129
Larcher W (2003) Physiological plant ecology: ecophysiology and stress physiology of
functional groups. Springer Science and Business Media,
Lehermeier C, Schön C-C, de los Campos G (2015) Assessment of genetic heterogeneity in
structured plant populations using multivariate whole-genome regression models.
Genetics 201 (1):323-337
Leite KMdSC, Tadiotti AC, Baldochi D, Oliveira OMMF (2006) Partial purification, heat
stability and kinetic characterization of the pectinmethylesterase from Brazilian
guava, Paluma cultivars. Food Chemistry 94 (4):565-572
Liu X, Yang G (2012) Assessment of clonal fidelity of micro-propagated guava (Psidium
guajava) plants by iSSR markers. Australian Journal of Crop Science 6 (2):291-295
LMBG (1983) Bestimmung des Gesamtsäuregehaltes von Tomatenmark (potentiometrische
Methode). L.26.11.03-4.
Lombard C, Leakey RRB (2010) Protecting the rights of farmers and communities while
securing long term market access for producers of non-timber forest products:
experience in Southern Africa. Forests, Trees and Livelihoods 19 (3):235-249
Lukmanji Z, Hertzmark E, Mlingi N, Assey V, Ndossi G, Fawzi W (2008) Tanzania food
composition tables. MUHAS-TFNC, HSPH, Dar es Salaam Tanzania
M.O.H.S (2012) Ministry of Health and Sanitation: National Nutrition Action Plan 2012-
2017 Available from: http://scalingupnutritionorg/wp-
content/uploads/2013/10/Kenya-National-Nutrition-Action-Plan-2012-2017-
finalpdf
Maas E Testing crops for salinity tolerance. In: Maranville J, BaIigar B, Duncan R, Yohe J
(eds) Proc. Workshop on adaptation of plants to soil stresses, University of Ne,
Lincoln, NE, 1993. Citeseer, p 247
Makhija M, Dhankhar O, Singhrot R (1980) Effect of soil salinity levels on growth and leaf
mineral composition of guava (Psidium guajava L.). Haryana Journal of
Horticultural Sciences 9 (1/2):21-25
Marschner P (2012) Marschner's mineral nutrition of higher plants, 3rd Ed. Academic press,
London, UK
Marsh K, Richardson A, Macrae E (1999) Early-and mid-season temperature effects on the
growth and composition of satsuma mandarins. The Journal of Horticultural Science
and Biotechnology 74 (4):443-451
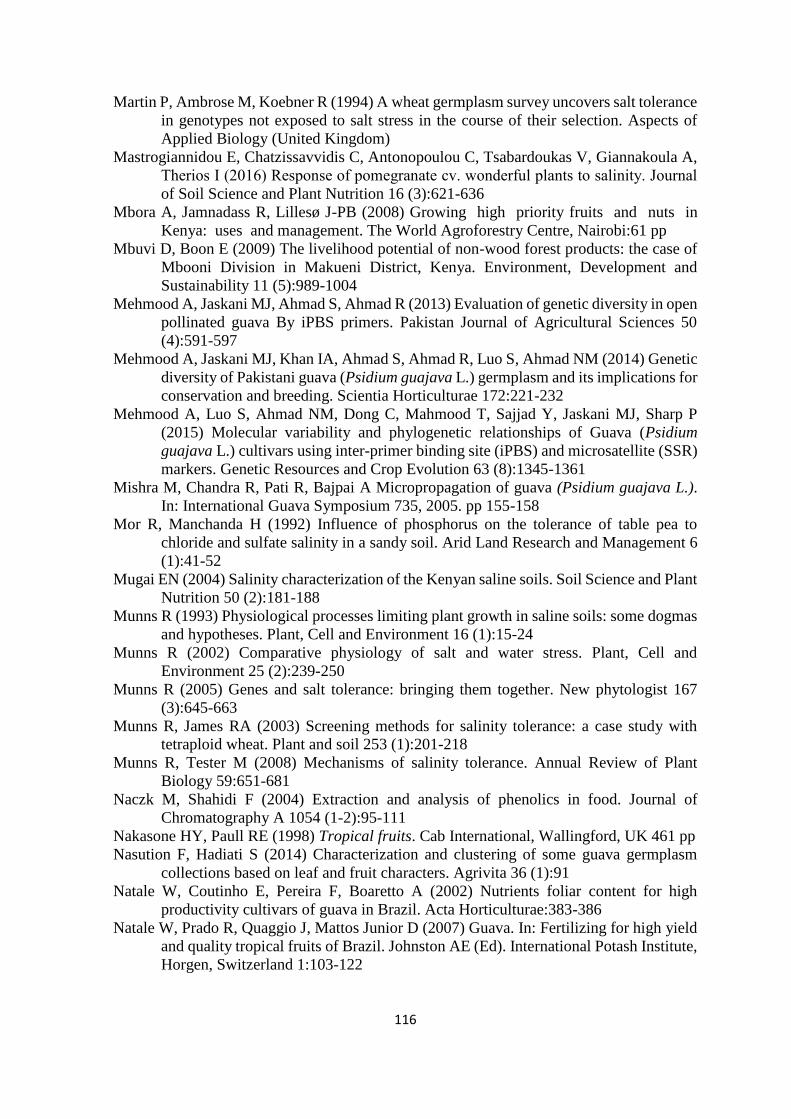
116
Martin P, Ambrose M, Koebner R (1994) A wheat germplasm survey uncovers salt tolerance
in genotypes not exposed to salt stress in the course of their selection. Aspects of
Applied Biology (United Kingdom)
Mastrogiannidou E, Chatzissavvidis C, Antonopoulou C, Tsabardoukas V, Giannakoula A,
Therios I (2016) Response of pomegranate cv. wonderful plants tο salinity. Journal
of Soil Science and Plant Nutrition 16 (3):621-636
Mbora A, Jamnadass R, Lillesø J-PB (2008) Growing high priority fruits and nuts in
Kenya: uses and management. The World Agroforestry Centre, Nairobi:61 pp
Mbuvi D, Boon E (2009) The livelihood potential of non-wood forest products: the case of
Mbooni Division in Makueni District, Kenya. Environment, Development and
Sustainability 11 (5):989-1004
Mehmood A, Jaskani MJ, Ahmad S, Ahmad R (2013) Evaluation of genetic diversity in open
pollinated guava By iPBS primers. Pakistan Journal of Agricultural Sciences 50
(4):591-597
Mehmood A, Jaskani MJ, Khan IA, Ahmad S, Ahmad R, Luo S, Ahmad NM (2014) Genetic
diversity of Pakistani guava (Psidium guajava L.) germplasm and its implications for
conservation and breeding. Scientia Horticulturae 172:221-232
Mehmood A, Luo S, Ahmad NM, Dong C, Mahmood T, Sajjad Y, Jaskani MJ, Sharp P
(2015) Molecular variability and phylogenetic relationships of Guava (Psidium
guajava L.) cultivars using inter-primer binding site (iPBS) and microsatellite (SSR)
markers. Genetic Resources and Crop Evolution 63 (8):1345-1361
Mishra M, Chandra R, Pati R, Bajpai A Micropropagation of guava (Psidium guajava L.).
In: International Guava Symposium 735, 2005. pp 155-158
Mor R, Manchanda H (1992) Influence of phosphorus on the tolerance of table pea to
chloride and sulfate salinity in a sandy soil. Arid Land Research and Management 6
(1):41-52
Mugai EN (2004) Salinity characterization of the Kenyan saline soils. Soil Science and Plant
Nutrition 50 (2):181-188
Munns R (1993) Physiological processes limiting plant growth in saline soils: some dogmas
and hypotheses. Plant, Cell and Environment 16 (1):15-24
Munns R (2002) Comparative physiology of salt and water stress. Plant, Cell and
Environment 25 (2):239-250
Munns R (2005) Genes and salt tolerance: bringing them together. New phytologist 167
(3):645-663
Munns R, James RA (2003) Screening methods for salinity tolerance: a case study with
tetraploid wheat. Plant and soil 253 (1):201-218
Munns R, Tester M (2008) Mechanisms of salinity tolerance. Annual Review of Plant
Biology 59:651-681
Naczk M, Shahidi F (2004) Extraction and analysis of phenolics in food. Journal of
Chromatography A 1054 (1-2):95-111
Nakasone HY, Paull RE (1998) Tropical fruits. Cab International, Wallingford, UK 461 pp
Nasution F, Hadiati S (2014) Characterization and clustering of some guava germplasm
collections based on leaf and fruit characters. Agrivita 36 (1):91
Natale W, Coutinho E, Pereira F, Boaretto A (2002) Nutrients foliar content for high
productivity cultivars of guava in Brazil. Acta Horticulturae:383-386
Natale W, Prado R, Quaggio J, Mattos Junior D (2007) Guava. In: Fertilizing for high yield
and quality tropical fruits of Brazil. Johnston AE (Ed). International Potash Institute,
Horgen, Switzerland 1:103-122
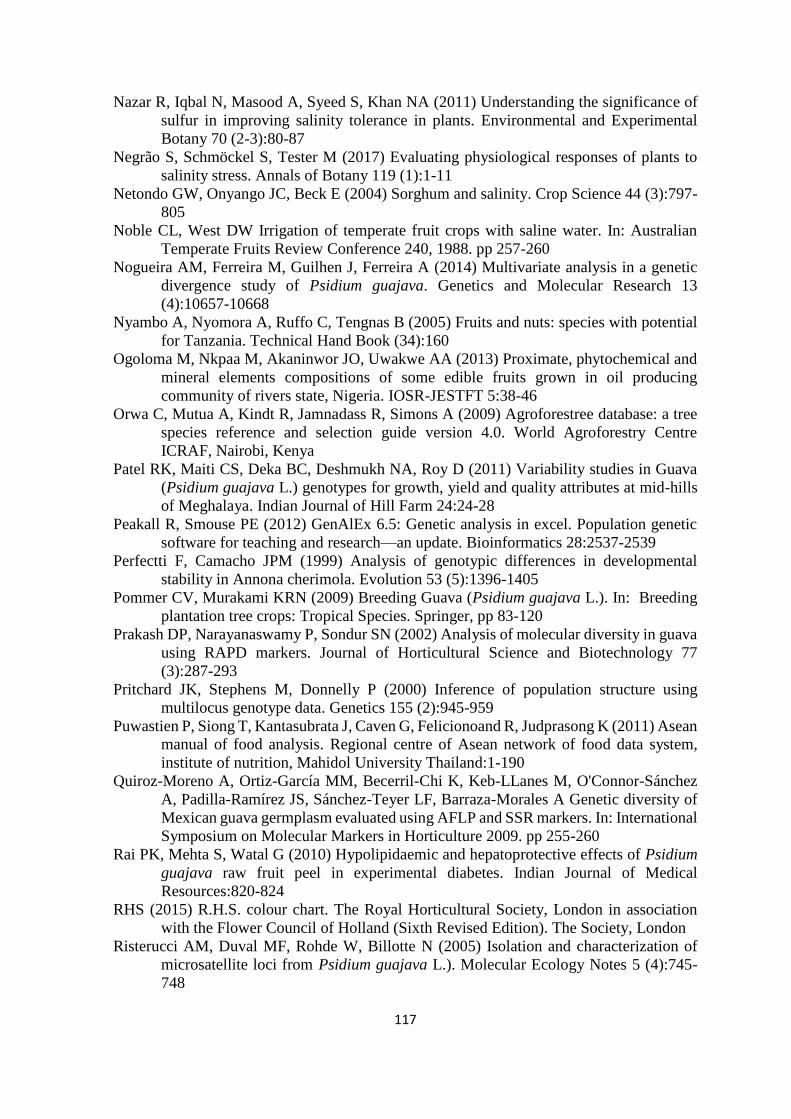
117
Nazar R, Iqbal N, Masood A, Syeed S, Khan NA (2011) Understanding the significance of
sulfur in improving salinity tolerance in plants. Environmental and Experimental
Botany 70 (2-3):80-87
Negrão S, Schmöckel S, Tester M (2017) Evaluating physiological responses of plants to
salinity stress. Annals of Botany 119 (1):1-11
Netondo GW, Onyango JC, Beck E (2004) Sorghum and salinity. Crop Science 44 (3):797-
805
Noble CL, West DW Irrigation of temperate fruit crops with saline water. In: Australian
Temperate Fruits Review Conference 240, 1988. pp 257-260
Nogueira AM, Ferreira M, Guilhen J, Ferreira A (2014) Multivariate analysis in a genetic
divergence study of Psidium guajava. Genetics and Molecular Research 13
(4):10657-10668
Nyambo A, Nyomora A, Ruffo C, Tengnas B (2005) Fruits and nuts: species with potential
for Tanzania. Technical Hand Book (34):160
Ogoloma M, Nkpaa M, Akaninwor JO, Uwakwe AA (2013) Proximate, phytochemical and
mineral elements compositions of some edible fruits grown in oil producing
community of rivers state, Nigeria. IOSR-JESTFT 5:38-46
Orwa C, Mutua A, Kindt R, Jamnadass R, Simons A (2009) Agroforestree database: a tree
species reference and selection guide version 4.0. World Agroforestry Centre
ICRAF, Nairobi, Kenya
Patel RK, Maiti CS, Deka BC, Deshmukh NA, Roy D (2011) Variability studies in Guava
(Psidium guajava L.) genotypes for growth, yield and quality attributes at mid-hills
of Meghalaya. Indian Journal of Hill Farm 24:24-28
Peakall R, Smouse PE (2012) GenAlEx 6.5: Genetic analysis in excel. Population genetic
software for teaching and research—an update. Bioinformatics 28:2537-2539
Perfectti F, Camacho JPM (1999) Analysis of genotypic differences in developmental
stability in Annona cherimola. Evolution 53 (5):1396-1405
Pommer CV, Murakami KRN (2009) Breeding Guava (Psidium guajava L.). In: Breeding
plantation tree crops: Tropical Species. Springer, pp 83-120
Prakash DP, Narayanaswamy P, Sondur SN (2002) Analysis of molecular diversity in guava
using RAPD markers. Journal of Horticultural Science and Biotechnology 77
(3):287-293
Pritchard JK, Stephens M, Donnelly P (2000) Inference of population structure using
multilocus genotype data. Genetics 155 (2):945-959
Puwastien P, Siong T, Kantasubrata J, Caven G, Felicionoand R, Judprasong K (2011) Asean
manual of food analysis. Regional centre of Asean network of food data system,
institute of nutrition, Mahidol University Thailand:1-190
Quiroz-Moreno A, Ortiz-García MM, Becerril-Chi K, Keb-LLanes M, O'Connor-Sánchez
A, Padilla-Ramírez JS, Sánchez-Teyer LF, Barraza-Morales A Genetic diversity of
Mexican guava germplasm evaluated using AFLP and SSR markers. In: International
Symposium on Molecular Markers in Horticulture 2009. pp 255-260
Rai PK, Mehta S, Watal G (2010) Hypolipidaemic and hepatoprotective effects of Psidium
guajava raw fruit peel in experimental diabetes. Indian Journal of Medical
Resources:820-824
RHS (2015) R.H.S. colour chart. The Royal Horticultural Society, London in association
with the Flower Council of Holland (Sixth Revised Edition). The Society, London
Risterucci AM, Duval MF, Rohde W, Billotte N (2005) Isolation and characterization of
microsatellite loci from Psidium guajava L.). Molecular Ecology Notes 5 (4):745-
748
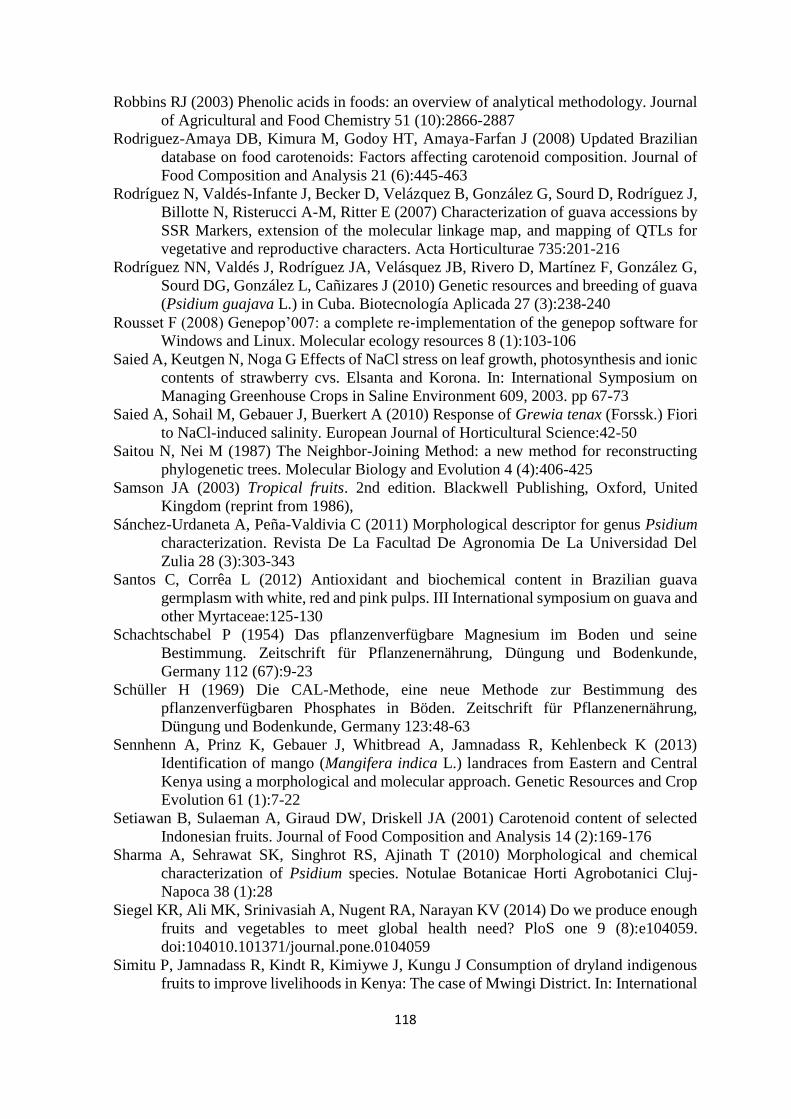
118
Robbins RJ (2003) Phenolic acids in foods: an overview of analytical methodology. Journal
of Agricultural and Food Chemistry 51 (10):2866-2887
Rodriguez-Amaya DB, Kimura M, Godoy HT, Amaya-Farfan J (2008) Updated Brazilian
database on food carotenoids: Factors affecting carotenoid composition. Journal of
Food Composition and Analysis 21 (6):445-463
Rodríguez N, Valdés-Infante J, Becker D, Velázquez B, González G, Sourd D, Rodríguez J,
Billotte N, Risterucci A-M, Ritter E (2007) Characterization of guava accessions by
SSR Markers, extension of the molecular linkage map, and mapping of QTLs for
vegetative and reproductive characters. Acta Horticulturae 735:201-216
Rodríguez NN, Valdés J, Rodríguez JA, Velásquez JB, Rivero D, Martínez F, González G,
Sourd DG, González L, Cañizares J (2010) Genetic resources and breeding of guava
(Psidium guajava L.) in Cuba. Biotecnología Aplicada 27 (3):238-240
Rousset F (2008) Genepop’007: a complete re‐implementation of the genepop software for
Windows and Linux. Molecular ecology resources 8 (1):103-106
Saied A, Keutgen N, Noga G Effects of NaCl stress on leaf growth, photosynthesis and ionic
contents of strawberry cvs. Elsanta and Korona. In: International Symposium on
Managing Greenhouse Crops in Saline Environment 609, 2003. pp 67-73
Saied A, Sohail M, Gebauer J, Buerkert A (2010) Response of Grewia tenax (Forssk.) Fiori
to NaCl-induced salinity. European Journal of Horticultural Science:42-50
Saitou N, Nei M (1987) The Neighbor-Joining Method: a new method for reconstructing
phylogenetic trees. Molecular Biology and Evolution 4 (4):406-425
Samson JA (2003) Tropical fruits. 2nd edition. Blackwell Publishing, Oxford, United
Kingdom (reprint from 1986),
Sánchez-Urdaneta A, Peña-Valdivia C (2011) Morphological descriptor for genus Psidium
characterization. Revista De La Facultad De Agronomia De La Universidad Del
Zulia 28 (3):303-343
Santos C, Corrêa L (2012) Antioxidant and biochemical content in Brazilian guava
germplasm with white, red and pink pulps. III International symposium on guava and
other Myrtaceae:125-130
Schachtschabel P (1954) Das pflanzenverfügbare Magnesium im Boden und seine
Bestimmung. Zeitschrift für Pflanzenernährung, Düngung und Bodenkunde,
Germany 112 (67):9-23
Schüller H (1969) Die CAL-Methode, eine neue Methode zur Bestimmung des
pflanzenverfügbaren Phosphates in Böden. Zeitschrift für Pflanzenernährung,
Düngung und Bodenkunde, Germany 123:48-63
Sennhenn A, Prinz K, Gebauer J, Whitbread A, Jamnadass R, Kehlenbeck K (2013)
Identification of mango (Mangifera indica L.) landraces from Eastern and Central
Kenya using a morphological and molecular approach. Genetic Resources and Crop
Evolution 61 (1):7-22
Setiawan B, Sulaeman A, Giraud DW, Driskell JA (2001) Carotenoid content of selected
Indonesian fruits. Journal of Food Composition and Analysis 14 (2):169-176
Sharma A, Sehrawat SK, Singhrot RS, Ajinath T (2010) Morphological and chemical
characterization of Psidium species. Notulae Botanicae Horti Agrobotanici Cluj-
Napoca 38 (1):28
Siegel KR, Ali MK, Srinivasiah A, Nugent RA, Narayan KV (2014) Do we produce enough
fruits and vegetables to meet global health need? PloS one 9 (8):e104059.
doi:104010.101371/journal.pone.0104059
Simitu P, Jamnadass R, Kindt R, Kimiywe J, Kungu J Consumption of dryland indigenous
fruits to improve livelihoods in Kenya: The case of Mwingi District. In: International
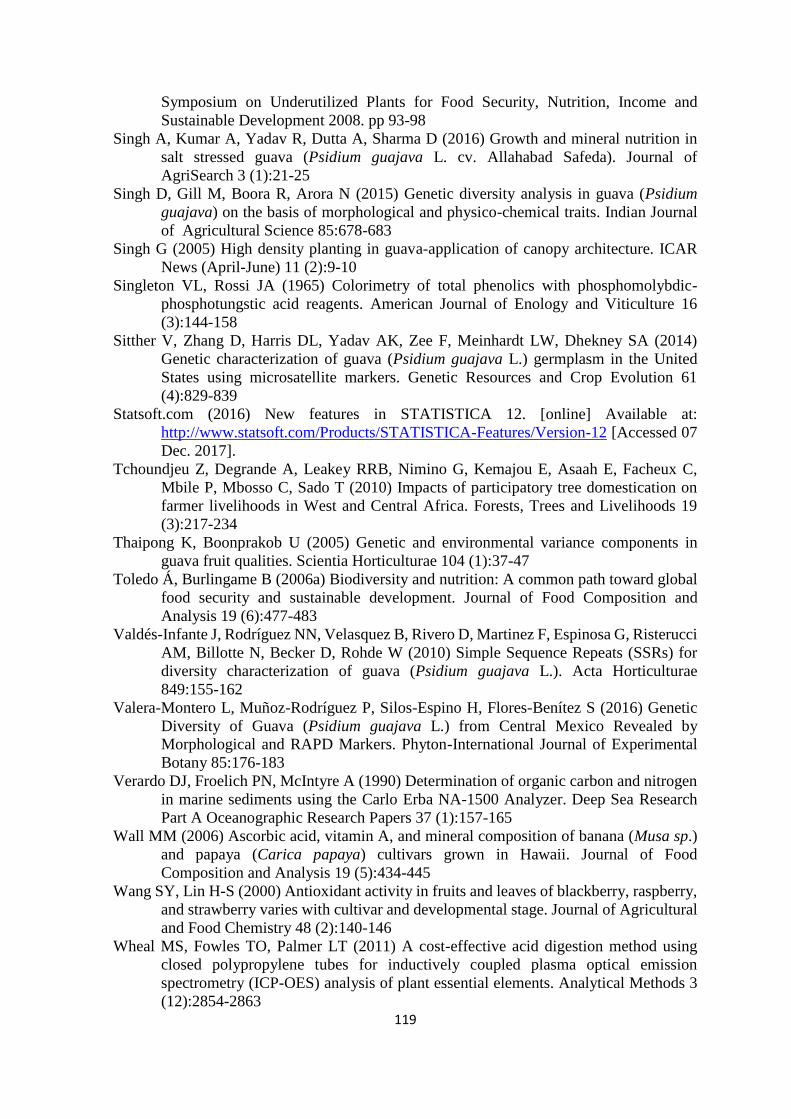
119
Symposium on Underutilized Plants for Food Security, Nutrition, Income and
Sustainable Development 2008. pp 93-98
Singh A, Kumar A, Yadav R, Dutta A, Sharma D (2016) Growth and mineral nutrition in
salt stressed guava (Psidium guajava L. cv. Allahabad Safeda). Journal of
AgriSearch 3 (1):21-25
Singh D, Gill M, Boora R, Arora N (2015) Genetic diversity analysis in guava (Psidium
guajava) on the basis of morphological and physico-chemical traits. Indian Journal
of Agricultural Science 85:678-683
Singh G (2005) High density planting in guava-application of canopy architecture. ICAR
News (April-June) 11 (2):9-10
Singleton VL, Rossi JA (1965) Colorimetry of total phenolics with phosphomolybdic-
phosphotungstic acid reagents. American Journal of Enology and Viticulture 16
(3):144-158
Sitther V, Zhang D, Harris DL, Yadav AK, Zee F, Meinhardt LW, Dhekney SA (2014)
Genetic characterization of guava (Psidium guajava L.) germplasm in the United
States using microsatellite markers. Genetic Resources and Crop Evolution 61
(4):829-839
Statsoft.com (2016) New features in STATISTICA 12. [online] Available at:
http://www.statsoft.com/Products/STATISTICA-Features/Version-12 [Accessed 07
Dec. 2017].
Tchoundjeu Z, Degrande A, Leakey RRB, Nimino G, Kemajou E, Asaah E, Facheux C,
Mbile P, Mbosso C, Sado T (2010) Impacts of participatory tree domestication on
farmer livelihoods in West and Central Africa. Forests, Trees and Livelihoods 19
(3):217-234
Thaipong K, Boonprakob U (2005) Genetic and environmental variance components in
guava fruit qualities. Scientia Horticulturae 104 (1):37-47
Toledo Á, Burlingame B (2006a) Biodiversity and nutrition: A common path toward global
food security and sustainable development. Journal of Food Composition and
Analysis 19 (6):477-483
Valdés-Infante J, Rodríguez NN, Velasquez B, Rivero D, Martinez F, Espinosa G, Risterucci
AM, Billotte N, Becker D, Rohde W (2010) Simple Sequence Repeats (SSRs) for
diversity characterization of guava (Psidium guajava L.). Acta Horticulturae
849:155-162
Valera-Montero L, Muñoz-Rodríguez P, Silos-Espino H, Flores-Benítez S (2016) Genetic
Diversity of Guava (Psidium guajava L.) from Central Mexico Revealed by
Morphological and RAPD Markers. Phyton-International Journal of Experimental
Botany 85:176-183
Verardo DJ, Froelich PN, McIntyre A (1990) Determination of organic carbon and nitrogen
in marine sediments using the Carlo Erba NA-1500 Analyzer. Deep Sea Research
Part A Oceanographic Research Papers 37 (1):157-165
Wall MM (2006) Ascorbic acid, vitamin A, and mineral composition of banana (Musa sp.)
and papaya (Carica papaya) cultivars grown in Hawaii. Journal of Food
Composition and Analysis 19 (5):434-445
Wang SY, Lin H-S (2000) Antioxidant activity in fruits and leaves of blackberry, raspberry,
and strawberry varies with cultivar and developmental stage. Journal of Agricultural
and Food Chemistry 48 (2):140-146
Wheal MS, Fowles TO, Palmer LT (2011) A cost-effective acid digestion method using
closed polypropylene tubes for inductively coupled plasma optical emission
spectrometry (ICP-OES) analysis of plant essential elements. Analytical Methods 3
(12):2854-2863

120
WHO (2002) (World Health Organisation).The world health report 2002: reducing risks,
promoting healthy life. http://www.who.int/whr/en/ Accessed 20.06.2017.
WHO (2003) (World Health Organisation). Diet, nutrition and the prevention of chronic
diseases. World Health Organisation Technical Report Series 916 (i-viii)
Wright S (1965) The interpretation of population structure by F-Statistics with special regard
to systems of mating. Evolution:395-420
Youssef M, Ibrahim RA (2016) Molecular markers associated with high vitamin-C content
in guava. Journal of Agricultural Chemistry and Biotechnology 3 (7):49-55
121
Summary
Common guava (Psidium guajava L.) fruit has a significant nutritional and medicinal
potential besides its economic importance, yet is still underutilized in terms of production
and consumption. The current global guava fruit production is based only on a few cultivars
selected mainly based on their morphological traits, hence much of the genetic variation
remains untapped. There is also limited knowledge about the impact of climatic conditions,
soil properties and fruit morphological traits on the chemical and mineral composition of the
guava fruit. Additionally, guava production currently faces challenges of salinity in many
guava-producing countries. The objectives of this study were therefore to determine the
genetic diversity, nutritional variability and salinity tolerance among accessions of guava
collected from four different regions of Kenya (Coast, Eastern, Rift Valley and Western).
The genetic diversity was assessed on 177 guava accessions using 13 simple sequence repeat
(SSR) markers. Out of the 177 trees used for SSR analysis, a relationship between climatic
factors and, chemical and mineral composition of fruits from128 trees was determined.
Correlations were also performed for fruit chemical and mineral composition with their
morphological traits and soil mineral contents, respectively. The effect of sodium chloride
(NaCl) salinity—0 mM (control), 10/20 mM (low), 20/40 mM (medium), and 40/80 mM
(high) was also investigated on ten genetically diverse accessions in a six week greenhouse
experiment. Results of the genetic analysis revealed that most accessions generally clustered
into multiple weakly supported groups with only 46 out of 177 accessions being supported
by bootstrap values above 50%. There was a lack of clear-cut genetic groups along
geographical origins and fruit flesh colour. Results of fruit chemical and mineral
composition revealed a positive correlation between ascorbic acid composition and total
annual precipitation while the total soluble solids (TSS) was positively linked with mean
annual temperature, and was high in white-fleshed fruits. The mineral content of the fruits
122
mainly reduced with an increase in most of the fruit weight- and size-based morphological
traits and also with the total annual precipitation. Results of the salinity experiment revealed
genetic differences in dry matter accumulation by some accessions. Moreover, variations
were observed among the accessions with respect to accumulation of Na, and was positively
correlated to dry matter (DM). Generally, guava was not so effective in excluding Na from
the transpiration stream. For guava conservation, selection and improvement, we
recommend sampling many individual accessions covering the geographical range of the
species based on our genetic analysis results. The information on fruit chemical and mineral
composition could act as a guide in the selection of specific regions for guava fruit
production, selection of accessions for improvement programmes, and the design of
appropriate fertilizer regimes that enhance guava fruit composition. Differences among the
accessions relative to DM production and accumulation Na at varying salinities should be
considered for selecting genotypes for adaptation to saline environments. The interaction
between genotype, environmental conditions and fruit morphological traits should be used
to select accessions with preferred traits – for instance, those with high chemical and mineral
composition, high productivity and tolerance to adverse conditions such as salinity.
123
Acknowledgement
The field work for this research was funded by the International Fund for Agricultural Development
(IFAD) and the European Commission under the World Agroforestry Centre (ICRAF) project “Tree crops
development in Africa to benefit the poor”. Thanks to Deutscher Akademischer Austauschdienst (DAAD) and
the Kenyan government through National Commission for Science, Technology and Innovation (NACOSTI)
for providing me a PhD scholarship; and to all farmers as well as field and lab staff at the ICRAF. The SSR
fragment analysis was done at the Department of Forest Genetics and Forest Tree Breeding, University of
Goettingen, Germany. I appreciate Mrs. Alexandra Dolynska for the technical assistance. The technical staff
at the Division of Quality of Plant Products, University of Goettingen are also appreciated for their assistance
with laboratory protocols and aspects to do with the analysis of nutritional properties of guava.
I acknowledge Prof. Dr. Anthony Whitbread (formerly of the Crop Sciences Department, University
of Goettingen), for having read my proposal and also accepted me as a PhD student at the University. I also
thank Prof. Dr. Reiner Finkeldey (formerly at the Department of Forest Genetics and Forest Tree Breeding,
University of Goettingen) who also agreed to co-supervise my work and allowed the use of their laboratory.
Consequently, I appecriate the advise and help of Prof. Dr. Konstantin Krutovsky and Dr. Markus Mueller
(both of the Department of Forest Genetics and Forest Tree Breeding, University of Goettingen) regarding SSR
fragment analysis and revising the genetic manuscript. Prof. Dr. Katja Kehlenbeck formerly of the World
Agroforestry Centre, (currently at Rhine-Waal University of Applied Sciences, Faculty of Life Sciences)
assisted with the formulation of the hypotheses and subsequently the proposal. She was also instrumental in
field work and morphological characterization of guava in Kenya as well as reading of the manuscripts. Thank
you so much. I also would not forget Dr. Naumann Marcel (Division of Quality of Plant Products, University
of Goettingen) for his tireless effort at advising and facilitating the various phases of this study, and reading of
the manuscripts. Much appreciation goes to Prof. Dr. Elke Pawelzik for finally accepting me as a PhD student
in her Division (Division of Quality of Plant Products, University of Goettingen) when the former supervisors
had to leave for other positions elsewhere. I acknowledge the much support she offered regarding the various
aspects of the analysis, evaluation of my proposal, progress reports and reading of the manuscripts.
Lastly, I appreciate my parents, brothers and sisters and, my loving wife, Joan and son, Joshua for
they had to bear with my long absence from home during this study. I love you and may the Almighty God
bless you abundantly.

124
Declaration
125
Curriculum vitae
Personal information Name: Josiah Chemulanga Chiveu
Address: Department of Seed, Crop and Horticultural Sciences,
School of Agriculture and Biotechnology, University of Eldoret,
P.O. Box 1125-30100, Eldoret, Kenya.
+254721421430 +254721421430
Sex: Male | Date of birth : 26.08.1980 | Nationality: Kenyan
Marital status: Married
Work experience:
July 2010 onwards
Education
2015-2018
2004-2008
2000-2004
Lecturer
Currently: Department of Seed, Crop and Horticultural Sciences,
School of Agriculture and Biotechnology, University of Eldoret,
P.O. Box 1125-30100, Eldoret, Kenya.
PhD in Crop Science- University of Goettingen, Germany
MPhil. in Horticulture - Moi University, Eldoret, Kenya
Bachelor of Science in Horticulture (Second Class Honours
Upper Division) - Moi University, Eldoret, Kenya
Publications
Chiveu, CJ, Dangasuk, OG, Omunyin, ME. and Wachira, FN.
(2009). Genetic diversity in Kenyan populations of Acacia
senegal (L.) Willd. based on ISSR Markers. Silvae
Genetica 58(1/2): 20-28.
Chiveu, CJ, Dangasuk, OG, Omunyin, ME. and Wachira, FN.
(2009). Quantitative variation among Kenyan populations
of Acacia senegal (L.) Willd. for gum production, seed
and growth traits. New Forests 38: 1-14.
Chiveu, CJ, Dangasuk, OG, Omunyin, ME. and Wachira, FN.
(2008). Genetic diversity in Kenyan populations of Acacia
senegal (L.) Willd revealed by combined RAPD and ISSR
markers. African Journal of Biotechnology 7(14): 2333-
2340.