assessment of groundwater resources in the western ... · assessment of groundwater resources in...
TRANSCRIPT

Assessment of Groundwater Resources in the Western
Davenport Plains Water Control District
E204629
August 2009

Project title - Report name Revision No: 0 Document ID number Report date
The concepts and information contained in this document are the property of Hydro Tasmania Consulting. This document may only be used
for the purposes, and upon the conditions, for which the report is supplied. Use or copying of this document in whole or in part for any other
purpose without the written permission of Hydro Tasmania Consulting constitutes an infringement of copyright.
ii
Document information
Title Assessment of Groundwater Resources in the Western Davenport
Plains Water Control District
Client organisation Department of Natural Resources, Environment The Arts and Sports
Client contact Anne Pye
Document number E204629
Project manager Eric Rooke
Project reference
Revision history Revision 0
Revision description
Prepared by Prepared by Eric Rooke
Reviewed by Reviewed by
Approved by Approved by (name) (signature) (date)
Distributed to Anne Pye DNRETAS
(name) (organisation) (date)

Assessment of Groundwater Resources in the Western Davenport Plains Water Control District
Revision No: 0 E204629 July 2009
iii
Contents
1. Scope of Work 7
1.1 Preamble 7 1.2 The Study 10
2. Physiography and Rainfall 11
3. Geology 18
3.1 Introduction 18 3.2 The Lander Trough 18 3.3 Wiso Basin (BMR, 1980), Bonney Well (SF53-2) and northern Barrow Creek
(SF53-6) 1:250,000 Geological Map sheets 25 3.4 Georgina Basin and Barrow Creek (SF53-6) 1:250,000 Geological Map sheet 26
4. Water Resources 28
4.1 Groundwater Investigations Timeline 28 4.2 Literature Review 29 4.3 Groundwater Use 46 4.4 Water Bores 46
5. Surface Water Hydrology 50
5.1 The Drainage System 50 5.2 Wetlands 51 5.3 Davenport Murchison Ranges Bioregion 53 5.4 Tanami bioregion 53 5.5 The Wiso Basin 53 5.6 Possible Groundwater Dependent Ecosystems 54
5.6.1 Thring Swamp 54 5.6.2 Piggery Bore �swamp� 55
5.7 Catchment Yield 55
6. Hydrogeology 57
6.1 Introduction 57 6.2 Aquifers 57 6.3 Alluvial Aquifers 59 6.4 Cainozoic Aquifers 59 6.5 Cambrian Sedimentary Aquifers 59 6.6 Groundwater Quality 61
6.6.1 Aquifer Storage 62 6.6.2 Aquifer Throughflow 62 6.6.3 Recharge 63 6.6.4 Discharge 63 6.6.5 Other Aquifers 64
7. Water Resource Assessment Zones 67
7.1 NRETA�s (2007C) WRAZs 67

Project title - Report name Revision No: 0 Document ID number Report date
iv
7.2 Revised WRAZs and Groundwater Storage Volumes 70
8. Conclusions 75
8.1 Current and future Water Use 75 8.2 Aquifer Recharge 75 8.3 Aquifer Throughflow 75 8.4 Aquifer Storage 76 8.5 Surface Water Yields 76 8.6 Water Dependent Ecosystems 77
9. Recommendations 79
9.1 Water Balance 79 9.2 Groundwater Monitoring 79 9.3 Aquifer Yields 79 9.4 Aquifer Correlation 80 9.5 Surface Water Yields 80
10. References 81

Assessment of Groundwater Resources in the Western Davenport Plains Water Control District
Revision No: 0 E204629 July 2009
v
Appendices
A Water Planning Policy
B Remotely-sensed Imagery
C Hydrochemical Facies
Annexure
List of figures
Figure 1-1 Water Control District and Surface Water Boundaries 8
Figure 1-2 Tenure and Water Bore Locations 9
Figure 2-1 Topography and Ephemeral Swamps and Pans 12
Figure 2-2 Rainfall graphs for Wycliffe Well (BoM DR 15550) 14
Figure 2-3 Rainfall graphs for Alekarenge (BoM DR 15502) 15
Figure 2-4 Rainfall graphs for Barrow Creek (BoM DR 15525) 16
Figure 2-5 Evaporation graphs for Tennant Creek Airport (BoM DE 15135) 17
Figure 3-1 Surface Water Boundaries & 1:250k Map Sheets & Monitoring Bores 20
Figure 3-2Basins and Bores - with RN number 23
Figure 3-3 Aquifer Systems and Simplified Geology 24
Figure 4-1 Water Bore Drilling History (No. of Bores versus Decadal Years) in the WDP 28
Figure 4-2 Total bore depth (m bgl) vs. No. of bores drilled in the WDP 47
Figure 4-3 Bore Status by Screened Aquifer vs. No. of Bores Drilled 47
Figure 4-4 SWL vs. No. of Bores 48
Figure 6-1 Schematic Hydrogeological Section across WDP 65
Figure 6-2 Block diagram 66
Figure 7-1Water Resource Assessment Zones and Simplified Geology 73
List of tables
Table 2-1 Western Davenport Plains � Physiographic Description 13
Table 3-1 Western Davenport Plains � Geology 21
Table 3-2 Neighbouring Basin Correlation of Formations (after Wyche et al., 1987) 25
Table 4-1 Western Davenport Plains � Water Resources 45
Table 5-1 Wiso Basin - Summary statistics (extracted form Table 8 of Duguid, et al. (2005) 50
Table 6-1 Hydrostratigraphy 57
Table 6-2 Regional interpretation of geological depths from bores drilled for Western Davenport Plains Assessment and Alekarenge PMG Farm (reproduced from Sumner, 2008 [Table 2]). 60
Table 7-1 Description of Water Resource Assessment Zones (after NRETA,2007C) 68
Table 7-2 Revised Description of Water Resource Assessment Zones 72
Table 7-3 Calculation of order of magnitude Storage Volumes of Groundwater available for Allocation74


Assessment of Groundwater Resources in the Western Davenport Plains Water Control District
Revision No: 0 E204629 Aug 2009
7
1. Scope of Work
1.1 Preamble
Under section 22 of the Water Act the Minister may declare a part of the Northern Territory (NT) to be
a Water Control District (WCD). On 24th October 2007 the Western Davenport Plains Water Control
District was officially gazetted. Appendix A provides a background of water policy and planning
aspects.
A Water Allocation Planning (WAP) process is commencing for the Western Davenport Plains (WDP)
WCD (see Figure 1-1 for boundary of the WCD). The WAP is expected to use a sound scientific basis
to make water allocations for non-consumptive use including environmental and cultural values, with
allocations then to be made subsequently for consumptive use within the remaining available water
resources, and is expected to reflect the allocation framework policy of NRETAS. In the Arid Zone in
relation to groundwater this policy dictates that total extraction over at least a century should not
exceed 80 % of total aquifer storage and there are to be no deleterious impacts on groundwater
dependent ecosystems (GDEs). The policy also states that extraction for consumptive use from any
river in the Arid Zone shall not exceed 5 % of flow at any time in any part of the river.
The WDP is situated about 350 km N of Alice Springs and is bisected by the Stuart Highway (see
Figure 1-1 inset). It currently has a population of about 550 including a large Aboriginal community
at Alekarenge (aka Ali Curung). Land use across the plains is mainly cattle grazing on the pastoral
leases of Singleton, Murray Downs and Neutral Junction. However, there are some expanding water
consumptive industries, namely horticultural enterprises being developed by Centrefarm on Aboriginal
land and on at least one of the pastoral holdings by the station owner. Land Tenure is shown on
Figure 1-2.
The area has been surveyed for wetlands but insufficient studies have been done on individual GDEs.
Some wetlands which have been identified as GDEs, such as Thring Swamp may, in fact, be more
surface water dependent given the presence of underlying clay layers which may isolate such
�swamps� from the aquifers below.
The cultural values of the WDP are also yet to be identified through the community consultation
involved in the planning process.

STUA
RT H
IGHW
AY
SANDOVER
HIG
HWAY
WAUCHOPE
BARROW CREEK
ALI - CURUNG
WYCLIFFE WELL
ATHELEY
IMANGARA
KALINJARRI
ATNWENGERRPE
INDARINGINYA
PMARA JUTUNTA
NGKWARLERLANEM
AMENGERNTERNEAH
TARA HOME OF BULLION MINE
350000 400000 450000 50000075
5000
0
7550
000
7600
000
7600
000
7650
000
7650
000
7700
000
7700
000
7750
000
7750
000
Western Davenport Plains - Figure 1-1Water Control District and Surface Water Boundaries
1:700,000
Transverse MercatorGDA94
0 10 20km
All reasonable care has been taken in collecting andrecording the information shown on this map.
Hydro Tasmania Consulting assumes no liability resulting fromerrors or omissions in this information or its use in any way.
GIS File No.: G4422_03Eng. No.: E204629
Project No.: P208738Revision: Rev 0
Date: 14/08/2009Prepared by: Jo Zantuck
[
Projection:Datum:
@ A3
Verified by: Keith Vander SchoorApproved by: Eric Rooke
LegendRoads
Dual CarriagewayPrincipal RoadSecondary RoadMinor Road
Surface Water Sub Catchment BoundariesSurface Water Catchment DivideWater Control DistrictCadastre

!
!
!
!
!
!
!
!
!
!!
!
!
!!
!
!
!
!
!
!
!
!
!
!
!!!
!
!!!
!
!
!
!
!
!!
!
!
!
!
!
!
!!
!!!!
!
!
!
!
!
!
!
!
!
!
!!!!
!!
!
!
!
!
!
!
!!
!
!
!
!
!
!
!
!
!
!
!!
!
!
!
!
!
!!!
!
!
!
!
!!
!
!
!
!
!
!
!!!
!!
!!!!
!!!
!
!!
!
!
!
!
!
!
!!
!
!
!!
!
!!
!
!!
!
!
!
!
!
!
!
!
!
!
!
!
!
!
!!
!
!
!!
!
!!
!
!
!
!
!
!
!
!
!
!
!
!
!
!
!
!
!
!
!
!
!
!
!!!!
!
!
!
!
!
!
!
!
!
!!
!
!
!
!
!
!!
!
!
!
!
!
!
!
!
!
!
!
!
!
!
!
!
!
!
!
!
!!
!
!
!
!
!
!
!
!
!!
!!
!!!!
!
!
!
!
!!!!
!!
!!
!
!
!
!
!!!
!
!!
!
!
!
!
!
!!
! !
!
!
!
!
!
!
!
!!
!
!
!
!
!
!
!
!
STIRLING
MURRAY DOWNS
KURUNDI
MOUNT SKINNER
NEUTRAL JUNCTION
SINGLETON
KARLANTIJPA SOUTH ABORIGINAL LAND TRUST
ELKEDRA
AMMAROO
ALYAWARRA ABORIGINAL LAND TRUST
MUNGKARTA ABORIGINAL LAND TRUST
EPENARRA
ANNINGIE
ANGARAPA ABORIGINAL LAND TRUSTAHAKEYE ABORIGINAL LAND TRUST
TENNANT CREEK
MACDONALD DOWNS
ERLTERLAPENTYE ABORIGINAL LAND TRUST
WARRABRI ABORIGINAL LAND TRUST
WARUMUNGU ABORIGINALLAND TRUST
ALLALGARA/ANNANGARA ABORIGINAL
CORPORATION
MUNGKARTA 2 ABORIGINAL LAND TRUST
STUA
RT H
IGHW
AY
SANDOVER
HIG
HWAY
350000 400000 450000 50000075
5000
0
7550
000
7600
000
7600
000
7650
000
7650
000
7700
000
7700
000
7750
000
7750
000
Western Davenport Plains - Figure 1-2Tenure and Water Bore Locations
1:700,000
Transverse MercatorGDA94
0 10 20km
All reasonable care has been taken in collecting andrecording the information shown on this map.
Hydro Tasmania Consulting assumes no liability resulting fromerrors or omissions in this information or its use in any way.
GIS File No.: G4422_03Eng. No.: E204629
Project No.: P208738Revision: Rev 0
Date: 14/08/2009Prepared by: Jo Zantuck
[
Projection:Datum:
@ A3
Verified by: Keith Vander SchoorApproved by: Eric Rooke
Legend! Bores
Water Control DistrictAdelaide to Darwin Railway
RoadsDual CarriagewayPrincipal RoadSecondary RoadMinor Road
CadastreTenure
ReserveFreeholdPerpetual Pastoral LeaseVacant Crown Land
Crown Lease PerpetualCrown Lease TermSpecial Purposes LeaseGovernmentUnregistered Crown Land

Project title - Report name Revision No: 0 Document ID number Report date
10
Extensive work has been done by the Northern Territory Department of Natural Resources,
Environment, The Arts and Sport (NRETAS) on various areas within the WDP WCD, including a
technical and non-technical overview of the land and water resources of the region (NRETA, 200C).
However, most of that work has not related to the whole declared WCD, and it is important that the
results of these pre-existing studies and investigation work are collated in a logical and independent
manner, which will provide a scientific basis for the decisions to be encapsulated in the forthcoming
WAP. The WAP should then provide the framework for an environmentally sustainable water
extraction regime.
1.2 The Study
Hydro Tasmania Consulting (HTC) was commissioned by NRETAS to undertake a scientific appraisal
of the Western Davenport Ranges Water Resources Assessment Project. The scope of work for this
commission follows:
TASK 1: undertake a desktop analysis and literature review in order to make a meaningful and
accurate assessment of the groundwater balance, and of the water resources which can be identified as
available for allocation in a forthcoming Water Allocation Plan (WAP) for the Western Davenport
Plains (WDP).
(Relevant data produced to include digital data in �Arc� format to allow import of relevant mapping
layers to GIS for report presentation).
TASK 2: make an accurate assessment of recharge, water quality, regional water throughflow, and
aquifer storage broken down into water resource assessment zones (WRAZs) based on
hydrogeological boundaries, in order to formulate the sustainable yield of the catchment with some
reference to the potential effects to estimated recharge under various climate change scenarios.
The resulting report should inform NRETAS on a sustainable water extraction regime from a
hydrogeological perspective that can then be used in tandem with community consultation to fully
consider the social, cultural and economic consequences associated with all aspects of the WAP.

Assessment of Groundwater Resources in the Western Davenport Plains Water Control District
Revision No: 0 E204629 Aug 2009
11
2. Physiography and Rainfall
The Davenport Ranges and the adjacent Murchison Ranges form the second largest range system in
the arid NT, based on area (not elevation). This broad series of low ranges has a predominant height
of 500 - 600 m AHD but rarely exceed 200 m above the surrounding plain
(http://www.nt.gov.au/nreta/wildlife/nature/pdf/aridwetlands/bioregion.pdf).
DNRETA (2007C) describes the physiography and land systems. Table 2-1 distils this information.
Figure 2-1 is a digital elevation map (AUSLIG Geodata 9 second DEM) with drainage including
surface water superimposed.


Assessment of Groundwater Resources in the Western Davenport Plains Water Control District Revision No: 0 E204629 Aug 2009
13
Table 2-1 Western Davenport Plains � Physiographic Description
Regional location & area / dimensions
Description / Land System Soils Settlement / Infrastructure Land use / Industry Development
150 km S of Tennant Ck.
Barrow Ck Telegraph Stn is 50 km SW of Plains
9,290 km2 (7,770 km2 sand plains + 1,500 km2 wooded alluvial floodout, swamps and clay pans).
Covers ~ 10 % of 100,000 km2, Davenport Region.
Broad, flat valley bearing NW 60 km wide by 180 km long between Davenport Range to NE & Osborne, Watt and Spring Ranges to SW.
Davenport, Watt and Spring Ranges rise ~ 250 m & Osborne Range, rises to ~ 240 m above Plains.
Part of Davenport Murchison Range bioregion (ANRA, 2008): network of waterholes in Davenport Ranges contains a rich fish fauna, a high plant diversity & endemic & rare plant species.
Singleton �Land System�: 5,000 km2; flat or gently undulating plain; intermittent low dune fields and sand plain landforms.
Contains alluvial floodout country, ephemeral swamps & clay pans, & chain of rocky ranges.
Lightly wooded (low open Eucalypt woodland & acacia sparse shrub-land) & understorey of hummock (Spinifex) grassland on red aeolian sand, with series of large alluvial flood outs and smaller areas of colluvial foot slopes adjacent to ranges..
Soils of bioregion: red earths, red sandy loams; red earthy sands with a gravel or stony crust on lateritic rises in NW.
550 population.
Stuart Hwy. bisects the Plains.
Crown Land: 3 pastoral leases: Murray Downs, Singleton & Neutral Junction cattle stations.
Aboriginal land incl. Warrabri ALT (440 km2) 30 km SE of Wycliffe Well Road-house.
Adjacent Hwy. is Adelaide Darwin railway; W of Hwy. is LNG Palm Valley Darwin pipeline.
Aboriginal town of Alekarenge (430 persons plus transient 100) & Imangera Aboriginal community.
Potential for horticulture - high value out-of-season crops due to suitable water resources, soils & climate. 20 potential horticultural development locations identified. Area on Warrabri ALT, W of Alekarenge leased to Alekarenge Horticulture Ltd - contracted Centrefarm Aboriginal Horticulture Ltd to establish a 200 ha commercial farm (melons & pomegranates).
Old gold mines in the ranges. Mining exploration areas, oil and gas exploration areas.
Low stocking rates (order of 5,000 head cattle) on 3 pastoral leases.
Proposed Davenport-Murchison National Park 60 km E of Wycliffe Well (on W boundary of Elkedra Station).

Project title - Report name Revision No: 0 Document ID number Report date
14
The following rainfall graphs appear as Figure 2-2, Figure 2-3 and Figure 2-4.
Figure 2-2 Rainfall graphs for Wycliffe Well (BoM DR 15550)
1965 1976 1998 2009Year
0
200
400
600
800
1000
mm
Wycliffe Well DR015550Annual Rainfall
1965 1976 1987 1998 2009Year
0
100
200
300
400
mm
Wycliffe Well DR015550Monthly Rainfall
1965 1976 1998 2009Year
0
40
80
120
160
mm
Wycliffe Well DR015550Daily Rainfall

Assessment of Groundwater Resources in the Western Davenport Plains Water Control District
Revision No: 0 E204629 Aug 2009
15
Figure 2-3 Rainfall graphs for Alekarenge (BoM DR 15502)
1965 1976 1998 2009Year
0
200
400
600
800
1000
mm
Ali Curung DR015502Annual Rainfall
1965 1976 1998 2009Year
0
100
200
300
400
500
mm
Ali Curung DR015502Monthly Rainfall
1965 1976 1998 2009Year
0
40
80
120
160
mm
Ali Curung DR015502Daily Rainfall

Project title - Report name Revision No: 0 Document ID number Report date
16
Figure 2-4 Rainfall graphs for Barrow Creek (BoM DR 15525)
Evaporation data is only available for Tennant Creek some 130 km N of Wycliffe Well (see Figure
2-5)
1880 1920 1960 2000Year
0
200
400
600
800
1000
mm
Barrow Creek DR015525Annual Rainfall (1884-2009)
1927 1954 1982 2009Year
0
100
200
300
400
500
mm
Barrow Creek DR015525Monthly Rainfall (1901-2009)
1927 1954 1982 2009Year
0
50
100
150
200
250
mm
Barrow Creek DR015525Daily Rainfall (1900-2009)

Assessment of Groundwater Resources in the Western Davenport Plains Water Control District
Revision No: 0 E204629 Aug 2009
17
Figure 2-5 Evaporation graphs for Tennant Creek Airport (BoM DE 15135)
1965 1971 1976 1982 1987 1993 1998Year
0
2000
4000
6000
mm
TC A DE015135Annual Evaporation
1965 1971 1976 1982 1987 1993 1998
Year
0
200
400
600
mm
TC A DE015135Monthly Evaporation
1965 1971 1976 1982 1987 1993 1998Year
0
10
20
30
mm
TC A Evap DE015135Daily Evaporation

Project title - Report name Revision No: 0 Document ID number Report date
18
3. Geology
3.1 Introduction
Figure 3-1 shows the coverage of 1:250,000 geological (and topographic) map-sheets across the study
region.
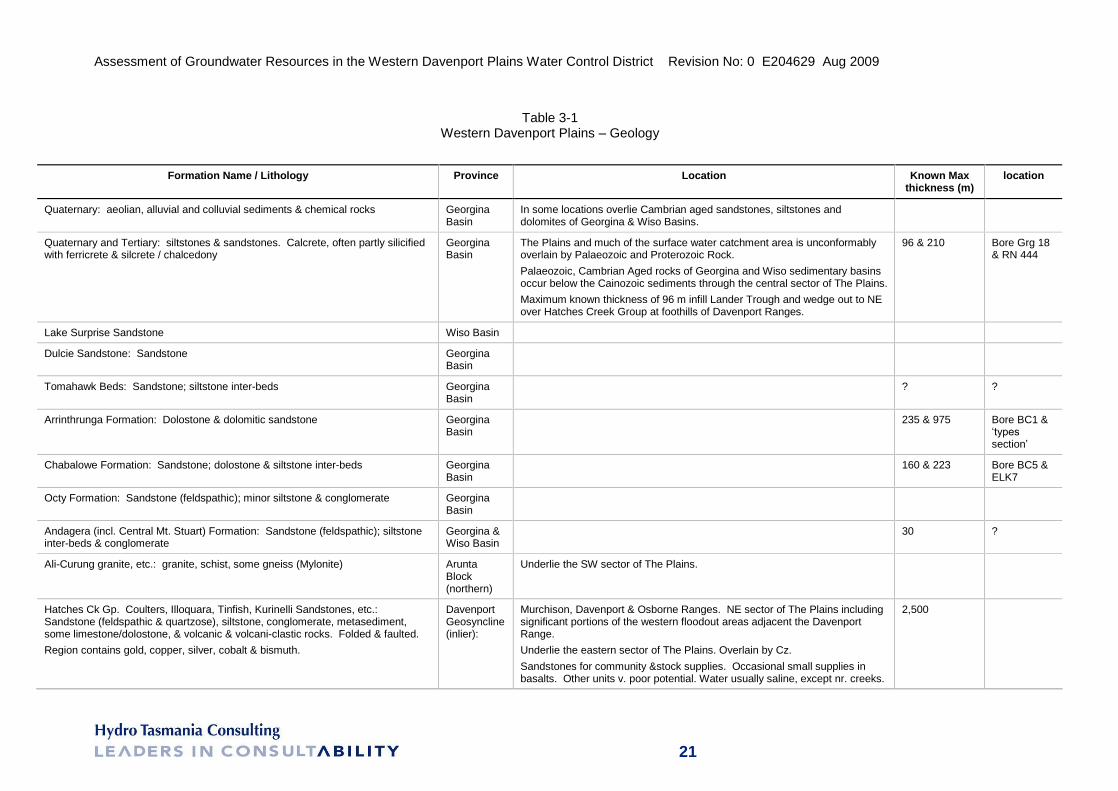
Table 3-1 summarises geological provinces and is taken from Barrow Creek and Bonney Well
1:250,000 geology - explanatory notes and the Wiso Basin 1:1,000,000 geology map-sheet.
Figure 3-2 depicts the geological basins; that define the rocks fundamentally belonging to igneous /
metamorphic as blocks or inliers; igneous / metamorphic/sedimentary as geosynclines, and
sedimentary as basins.
Figure 3-3 presents a simplified geological map; with geological formations classified into:
Cainozoic sediments;
Wiso Basin sequence formations;
Georgina Basin sequence formations;
Barrow Creek complex (granite rocks of the northern Arunta Block);
Hatches Creek Group (Davenport Geosyncline);
Undivided Granite/Gneiss (northern Arunta Block);
Arunta Inlier (metamorphic rocks of the northern Arunta Block); and,
Warramunga Group (Tennant Creek Block).
3.2 The Lander Trough
The Davenport Plains overlie the Lander Trough (40 km wide trending NW/SE with up to 1 km
thickness of sedimentary rocks); a fault-controlled geological structure which links the NW end of
the Georgina Basin with the SE end of the Wiso Basin. The NTGS considers that the transition beds
between these two Cambrian-aged basins commence at about the Alekarenge access road
(NRETA, 2007C) (i.e. the Warrabri ALT / Wycliffe Well area).
On its southern boundary (of the Wiso Basin) the trough is faulted against the Arunta Block. A
series of parallel ESE faults (throw of > 2 km) displace sedimentary rocks against the Arunta
Block. ?Upper Palaeozoic sandstone overlies these rocks and transgresses this fault. It is covered

Assessment of Groundwater Resources in the Western Davenport Plains Water Control District
Revision No: 0 E204629 Aug 2009
19
with a veneer of Cainozoic sediments that in much of the study region (especially on the WDP
proper) conceal underlying Formations.

!
!
!!!
!
!
! !
!
!
!
!
!!
!
!
!!!
!
!
Barrow Creek
Bonney Well
Alcoota
ElkedraMount Peake
Lander River Frew River
Napperby Huckitta
5427 5409
1476
18118
18114
17595 1759417593
17592
17589
16933 16932
15588
15587
15585
15580
1557815174
14789
13754
10538
1801
350000 400000 450000 50000075
5000
0
7550
000
7600
000
7600
000
7650
000
7650
000
7700
000
7700
000
7750
000
7750
000
Western Davenport Plains - Figure 3-1Surface Water Boundaries & 1:250k Map Sheets & Monitoring Bores
1:700,000
Transverse MercatorGDA94
0 10 20km
All reasonable care has been taken in collecting andrecording the information shown on this map.
Hydro Tasmania Consulting assumes no liability resulting fromerrors or omissions in this information or its use in any way.
GIS File No.: G4422_03Eng. No.: E204629
Project No.: P208738Revision: Rev 0
Date: 14/08/2009Prepared by: Jo Zantuck
[
Projection:Datum:
@ A3
Verified by: Keith Vander SchoorApproved by: Eric Rooke
LegendMonitoring Bores
! Ali-Curung Warrabri! Warrabri! Murray Downs! Neutral Junction! Singleton Station! Railway Corridor
Surface Water Sub Catchment BoundariesSurface Water Catchment DivideWater Control DistrictCadastre1: 250k Map Sheets
Assessment of Groundwater Resources in the Western Davenport Plains Water Control District Revision No: 0 E204629 Aug 2009
21
Table 3-1 Western Davenport Plains � Geology
Formation Name / Lithology Province Location Known Max thickness (m)
location
Quaternary: aeolian, alluvial and colluvial sediments & chemical rocks Georgina Basin
In some locations overlie Cambrian aged sandstones, siltstones and dolomites of Georgina & Wiso Basins.
Quaternary and Tertiary: siltstones & sandstones. Calcrete, often partly silicified with ferricrete & silcrete / chalcedony
Georgina Basin
The Plains and much of the surface water catchment area is unconformably overlain by Palaeozoic and Proterozoic Rock.
Palaeozoic, Cambrian Aged rocks of Georgina and Wiso sedimentary basins occur below the Cainozoic sediments through the central sector of The Plains.
Maximum known thickness of 96 m infill Lander Trough and wedge out to NE over Hatches Creek Group at foothills of Davenport Ranges.
96 & 210 Bore Grg 18 & RN 444
Lake Surprise Sandstone Wiso Basin
Dulcie Sandstone: Sandstone Georgina Basin
Tomahawk Beds: Sandstone; siltstone inter-beds Georgina Basin
? ?
Arrinthrunga Formation: Dolostone & dolomitic sandstone Georgina Basin
235 & 975 Bore BC1 & �types
section�
Chabalowe Formation: Sandstone; dolostone & siltstone inter-beds Georgina Basin
160 & 223 Bore BC5 & ELK7
Octy Formation: Sandstone (feldspathic); minor siltstone & conglomerate Georgina Basin
Andagera (incl. Central Mt. Stuart) Formation: Sandstone (feldspathic); siltstone inter-beds & conglomerate
Georgina & Wiso Basin
30 ?
Ali-Curung granite, etc.: granite, schist, some gneiss (Mylonite) Arunta Block (northern)
Underlie the SW sector of The Plains.
Hatches Ck Gp. Coulters, Illoquara, Tinfish, Kurinelli Sandstones, etc.: Sandstone (feldspathic & quartzose), siltstone, conglomerate, metasediment, some limestone/dolostone, & volcanic & volcani-clastic rocks. Folded & faulted.
Region contains gold, copper, silver, cobalt & bismuth.
Davenport Geosyncline (inlier):
Murchison, Davenport & Osborne Ranges. NE sector of The Plains including significant portions of the western floodout areas adjacent the Davenport Range.
Underlie the eastern sector of The Plains. Overlain by Cz.
Sandstones for community &stock supplies. Occasional small supplies in basalts. Other units v. poor potential. Water usually saline, except nr. creeks.
2,500

Project title - Report name Revision No: 0 Document ID number Report date
22
Formation Name / Lithology Province Location Known Max thickness (m)
location
Warramunga Formation Siltstones, greywacke

!
!
!
!
!
!
!
!
!
!!
!
!
!!
!
!
!
!
!
!
!
!
!
!
!
!!
!
!!!
!
!
!
!
!
!
!
!
!
!
!
!
!
!!
!!!!
!
!
!
!
!
!
!
!
!
!
!!!!
!!
!
!
!
!
!
!
!!
!
!
!
!
!
!
!
!
!
!
!!
!
!
!
!
!
!!!
!
!
!
!
!!
!
!
!
!
!
!
!!!
!!
!!!!
!!!
!
!!
!
!
!
!
!
!
!!
!
!
!!
!
!
!
!
!
!
!
!
!
!
!
!
!
!
!
!
!
!
!
!
!!
!
!
!!
!
!!
!
!
!
!
!
!
!
!
!
!
!
!
!
!
!
!
!
!
!
!
!
!
!
!!!
!
!
!
!
!
!
!
!
!
!
!
!
!
!
!
!
!!
!
!
!
!
!
!
!
!
!
!
!
!
!
!
!
!
!
!
!
!
!!
!
!
!
!
!
!
!
!
!!
!!
!!!!
!
!
!
!
! !!!
!
!
!!
!
!
!
!
!!
!
!
!!
!
!
!
!
!
!
!
! !
!
!
!
!
!
!
!
!!
!
!
!
!
!
!
!
!
Georgina Basin
Arunta Block
Wiso BasinDavenport Geosyncline
Tennant Creek Block
923
631
628
445
443
440
438
435
70177016
68986897
68966895
6891
6890
644364426440
64396437
62616260
6259
5952
5951
4401
3693
2881
2807
2539
2053 2051
2050
2049
2048
2047
2046
1480
1479
1476
1358
1262
1261
1260
1258
12571253
18265
18242
18241
1822518223
1811818117
18116
18115
18114
18067
180661800118000
17803
17802
17801
17800
17799
17701 17698
17595
1759217591
17590
17588 1758717586
17260
17258
1693316932
16799
16798
16797
16782
1619716163
15969
15966
15965
15964
15589
15588
15587
15586
15585
15584
15583
1558215581
15580
15579
15548
15396
15395
15182
15176
15171
1513815137
15136
15033
14943
1487814877
14789
14788
14787
14747
14706
14602
14562
14558
14557
14519
14357
14356
14355
14354
13870
13761
13760
13759
13758
1375713756
1375413753
13752
1375013749
13748
13722
13629
13413
13410
13345
13324
13323
13201
12976
12822
1281812817
1281112809
12706
12704
12407
12401
12371
1201412013
11874
11013 1101211011 11008
10858
10856
10844
10843
10841
10840
10683
10279
10273
10233
10232
10228
10224
10223
10222
10221
10220
10219
10203
10155
10042
1259
1759417589
6438
17585
1557815174
13751
12810
12006
11007
17593
350000 400000 450000 50000075
5000
0
7550
000
7600
000
7600
000
7650
000
7650
000
7700
000
7700
000
7750
000
7750
000
Western Davenport Plains - Figure 3-2Geological Basins and Bores - with RN number
1:700,000
Transverse MercatorGDA94
0 10 20km
All reasonable care has been taken in collecting andrecording the information shown on this map.
Hydro Tasmania Consulting assumes no liability resulting fromerrors or omissions in this information or its use in any way.
GIS File No.: G4422_03Eng. No.: E204629
Project No.: P208738Revision: Draft 0
Date: 14/08/2009Prepared by: Jo Zantuck
[
Projection:Datum:
@ A3
Verified by: INSERT NAMEApproved by: Eric Rooke
Legend! Bores with Registered Number
Water Control DistrictsArunta BlockDavenport Geosyncline
Georgina BasinTennant Creek BlockWiso Basin
!
!
! !
!
!
!
!1760817297
17259
17257
1725617254
16934
15661
!!
!
!
!!
!
!!!
!
!!!
!48404838
26251964
1953 1952
17313
173121731117310 15660
143581339413239
12820
!!
! !
!!
!
!
!
!
!
!
!
!
!
!
!!!
!
!182261822416917 16915
14944
14835
14834
14833
14832
14831
14830
12814
12813
1281210754 10753
1068210274
1023010229
18222
!
!!
!!
!
!!
!
!
!
!
!
!
!!
!!
!!
!
!
683
682
5788
54275409
5394
1801
18001777
177618113
18112
1811118002
1118111180
1117911178
107441057710538
10537
!!!
!
!!
!
!
!!
12561255
1269812697
1187711876
1165911658
11657
10721
!
!
!
!
!
!!
!
!
!
437
6434
6258
6257
15968
15967
15245
15244 1517514528
!
!
!
!
!
!!436
62145950
1619615140
15139
13755


Assessment of Groundwater Resources in the Western Davenport Plains Water Control District
Revision No: 0 E204629 Aug 2009
25
Table 3-2 correlates the formations between the sedimentary geological basins.
Table 3-2 Neighbouring Basin Correlation of Formations (after Wyche et al., 1987)
Georgina Basin Eastern Georgina Basin Wiso Basin
Dulcie Sandstone Craven Peak Beds Lake Surprise Sandstone
Tomahawk Beds Ninmaroo Formation -
Arrinthrunga Formation
- -
Chabalowe Formation
? Arthur Creek & Gum Ridge Formation
? Lothari Hill Sandstone
Andagera Formation Mount Baldwin Formation -
Kurinelli Sandstone - -
3.3 Wiso Basin (BMR, 1980), Bonney Well (SF53-2) and northern Barrow Creek (SF53-6) 1:250,000 Geological Map sheets
The WCD occupies the far SE corner of the Wiso special map-sheet and the western third of the
Bonney Well 1:250,000) geology map sheet.
The Wiso Basin, a structural down-warp in the central west part of the NT, contains a sequence of
near-horizontal Middle Cambrian to ?Upper Palaeozoic sedimentary rocks. It is probably
continuous with the Georgina Basin to the SE. Cambrian to Ordovician sediments includes five
mapped rock units (including the Lake Surprise Sandstone that lies in the Lander Trough as the
uppermost sequence) with disconformities and unconformities.
According to NRETA�s records (A. Pye, pers. comm.), the only bores drilled in the far W of
WCD are located along the Hanson River, as part of a 1977 BMR investigation (reported in
BMR, 1980).
A seismic survey (Hunting Geophysics Pty Ltd, 1967) conducted over the Lander Trough in the
eastern Lander River Map-sheet locality mapped several horizons dipping southwards and faulted
against the Arunta Block.
The Lake Surprise Sandstone (a potentially important, but little-exploited aquifer) is horizontal,
but fractured and faulted in places, and thins to the NW, and is poorly exposed being covered by
Cainozoic sediments. Its type section is described from BMR Lander River 1 (3-62 m bgl)
situated on E edge of the Lander River map-sheet. It is described as a very fine-medium
sandstone, well rounded and sorted (also bimodally sorted). Hanson River seismic survey (1967)

Project title - Report name Revision No: 0 Document ID number Report date
26
indicates a maximum thickness of ~ 150 m. It transgresses across the faulted margin of the Arunta
Block in the S.
BMR Bonney Well 3 penetrated ?Cainozoic sandstone overlying Arunta Block rocks indicating that
Cainozoic sediments extend across the major fault on the southern margin of the Lander Trough in the
SW Bonney Well map-sheet.
The Proterozoic Hatches Creek Group has a magnetic signature (refer Appendix B) especially in the E
part, where there are basaltic lavas. A magnetic zone extending from Bonney well into Lander River
map-sheet may represent a westward extension of the Hatches Creek Group. The Hatches Creek
Group outcrop to the E and S of Murray Downs homestead and N of Alekarenge (far N of Barrow
Creek map-sheet).
Some shallow magnetic anomalies may indicate Antrim Plateau Volcanics form the basement of the
Wiso Basin.
3.4 Georgina Basin and Barrow Creek (SF53-6) 1:250,000 Geological Map sheet
Just W of NTGS stratigraphic bore, �BC3� is Taylor fault. Taylor fault defines the western boundary
of the Lander Trough.
The structure of the Cambrian-aged rock of the Georgina Basin below the WDP is known to be
complex due to the presence of a series of faults, inferred from airborne geophysical survey and
limited NTGS stratigraphic drilling.
Adjacent Stuart Hwy., bore �BC3��s geology is recorded as:
56 m Cz sediments (53 m Tertiary);
55 - 175 m Arrinthrunga;
170 - >385 m Chabalowe Fm
Stratigraphic bore �BC5�, adjacent Stuart Hwy; 20 km N of �BC3�:
63 m Cz sediments (58 m Tertiary);
63 - 169 m Arrinthrunga Fm.;
169 - 328 m Chabalowe Fm.;
328 - >339 m Granite.
BC1, 8 km ENE of BC3 is underlain by the Hatches Creek Group at 315 m.

Assessment of Groundwater Resources in the Western Davenport Plains Water Control District
Revision No: 0 E204629 Aug 2009
27
BC2 (near site of RN 1259, Bluebush Bore), a further 17 km ENE of BC1 is underlain by granite at
59 m with no Cambrian present.
From the 2001 drilling (Paul, 2002) and previous drilling the generalised geology at Bluebush bore
(RN 1259) is:
0 - 45 m Cainozoic;
45- 100 m Chabalowe Formation
The strata is dipping slightly to the N, and at RN 17593 (ESE of Alekarenge) the geology is:
0 - 36 m Cainozoic;
36 - 100 m Arrinthrunga Formation
Further again to the N, around RN 10841 (Conglomerate bore), the Cambrian sediments appear to thin
out and Proterozoic Hatches Creek Group underlie the Cainozoic sediments.
Rocks of the Arunta Block are magnetic; e.g. in the NW corner of the Barrow Creek map-sheet (see
Figure B-2).

Project title - Report name Revision No: 0 Document ID number Report date
28
4. Water Resources
4.1 Groundwater Investigations Timeline
Figure 4-1 summarises the history of bore drilling activity in the WDP study region.
Figure 4-1 Water Bore Drilling History (No. of Bores versus Decadal Years) in the WDP
Salient comments based on this graph and the literature review (see Section 4.2) follows:
1920s: Water well drilling commenced with well sinking along the main N-S stock route;
1940s: World War 2 saw the drilling of N-S �road bores� for provision of water to convoys and
for road maintenance;
1950s: expansion in head of cattle and concomitant increase in stock bores sunk;
1960�s: provision and assistance with dams and production bores for town water supply and
horticulture at Alekarenge (Water Resources Branch [WRB] drilled and pump tested
agricultural production bores for a piggery, stock water, a market garden and fodder crops),

Assessment of Groundwater Resources in the Western Davenport Plains Water Control District
Revision No: 0 E204629 Aug 2009
29
Wycliffe Well (production bores and a dam used to supply irrigation water to a market garden)
and Murray Downs Homestead (advice on production bores and a dam used to supply irrigation
water for fodder crops and homestead market garden and trial crops / fruit trees);
Late 1960�s: WRB drilled several investigation bores on Warrabri ALT and adjacent areas to
assess regional aquifer potential for large scale horticulture (see Verhoeven, Read, 1978);
Early 1990�s: assessment for potential large scale horticultural development (see
AGC, Carosone, 1989 and 1990). 3 areas identified for field investigations �Western Davenport
Region Prospective Horticultural Areas�. Investigation drilling program was undertaken in
�Area 1�, mainly NE of the WDP aquifers on parts of Singleton Station. A few bores were
drilled in �Area 2 (Blue Bush Bore area on Murray Downs Station). The bores were drilled
40 km E of Stuart Highway;
2000: NRETA undertook a horticultural land capability survey at a scale of 1: 25,000 of an area
on proposed excision from Singleton Station for horticultural development adjacent to the Stuart
Highway, S of Hurst Creek where previous WRB investigations had proven the existence of
high yielding aquifers;
2001: NRETA undertook reconnaissance horticultural land capability survey of a large area on
Singleton Station and Murray Downs. The area included �Areas1 and 2� previously identified
by Carosone, (1989 and 1990) as having best prospects for horticultural water with a salinity,
(total dissolved solids), TDS < 1,000 mg/L;
Approx. 2001 -2003: a line of bores were sunk along the proposed route of the Alice Springs �
Darwin railway to provide construction water;
Post 2001: groundwater investigations by NRETA to locate potential borefield areas for
horticultural development and expand the groundwater monitoring bore network (including
drilling and pump testing) at several locations on Murray Downs and Warrabri ALT;
2006-7: NRETA drilled two investigation bores (3 monitoring bores) near Thring Swamp, to
E of Wycliffe Well (airlift 30 � 40 L/s of good to fair quality groundwater).
2008: (NRETA, 2008B) drilling investigation at Neutral Junction to address dearth of
information on groundwater availability and quality W of Stuart Highway.
4.2 Literature Review
The following provides salient, dot-point format findings / conclusions from reports reviewed (see
Section 10 for list of references).

Project title - Report name Revision No: 0 Document ID number Report date
30
Verhoeven and Read, 1978
report pertains to Warrabri region;
Cainozoic and Cambrian aquifers contain some carbonate, but are mainly sandstone and
siltstone units with variable clay content;
Aquifers are semi-confined;
Regional groundwater gradient slopes NW;
Recharge is local infiltration plus runoff from Davenport, �Froiland� and Osborne Ranges;
Cambrian and Proterozoic aquifers are recharged (by leakage) from the Cainozoic aquifers;
Groundwater storage volume of Cainozoic sediments at year, 1975 = 15,000 GL; based on
following assumptions;
o an area delimited by the distance between Osborne and Davenport Ranges, and 28 km
NW of Alekarenge to Wycliffe Well, and 28 km SE to Chabalowe Bore;
o regional depth to standing water level (SWL) = 10 m bgl;
o regional depth to top of Cainozoic aquifer = 20 m bgl;
o saturated sediments porosity = 0.3;
o assumption that 50 % of volume of Cainozoic sediments are impermeable; and,
o assuming semi-confined storage co-efficient, Sc = 1 x 10⁻³
Between November 1975 and June 1978, 17 GL of water was added to this storage following
year 1974 recharge event:
o net regional rise in SWL was 5 m;
o (This represents a rainfall input for the 30 month period of 5 mm depth over the area
during a period in which the rainfall exceeded 1,500 mm. This gives a recharge
coefficient of 0.003).
No estimate made of groundwater storage volume of Cambrian and Proterozoic aquifers;
Estimated throughflow at Alekarenge = 550 kL/day/km width of aquifer for the combined
Cainozoic and Cambrian aquifers; based on;
o hydraulic gradient, i = 0.001 for Cainozoic and Cambrian aquifers;
o average transmissivity, T = 50 m2/day for Cainozoic aquifer;
o average T = 500 m2/day for Cambrian aquifer;

Assessment of Groundwater Resources in the Western Davenport Plains Water Control District
Revision No: 0 E204629 Aug 2009
31
o Bore RN 1178 (partially penetrates Cambrian aquifer); T = 700 m2/day (based on a �long
term� pump test);
Water consumption (at 1979) = ~ 430 kL/day. �Design and peak requirements� = 860 and
1,300 kL/day, respectively;
Nitrate in groundwater increased in direction of throughflow;
Up to 1978, nitrate in water from Alekarenge town supply bores increased, in some cases
doubling; believed to be pollution of Cainozoic aquifers within Alekarenge and leaching from
unsaturated zone resulting from irrigation returns from adjacent market gardens;
Fluoride in groundwater increased in direction of throughflow. (Provenance as fluorspar in
sedimentary rocks and cryolite in igneous rock);
Fluoride concentrations in the Cambrian and Proterozoic aquifers = 0.5 to 4.2 mg/L; elevated
concentrations were located in aquifers underlying Alekarenge; average concentration E of
Alekarenge = 1 mg/L.
Carosone, 1990
Assessed horticultural development potential of 3 areas of WDP;
Investigated 2 of the recommended areas. (Most of the assessment was undertaken over
Singleton Station, E of Stuart Highway within aquifers of WDP. Some fieldwork was carried
out on Murray Downs between Chabalowe and Bluebush Bores);
Concluded that groundwater resources exist which are capable of sustaining large scale
horticultural projects;
Recommended that investigation drilling programs be carried at the most prospective sites
identified below:
o between Stuart Highway and Singleton homestead near the floodout of Hurst Creek
adjacent to bore, RN 15578;
o 3 km S of Hurst Creek and the Homestead adjacent RN 15586;
o adjacent to Wycliffe Creek near RN 15587; and,
o 1 km E of Stuart Highway between Wauchope Creek and Hurst Creek adjacent
RN 15579.
Cainozoic calcrete and sandstones both form good aquifers;

Project title - Report name Revision No: 0 Document ID number Report date
32
Sandstones and siltstones commonly well cemented, often with kaolinitic matrix and have
secondary permeability due to interconnected joints and fractures. Occasional layers of
sandstone have primary permeability due to interconnected porosity and vughs; particularly
ferruginized horizons;
Although clay layers are present acting locally as confining beds, regionally all aquifers are
interconnected and share a similar or common potentiometric surface;
As aquifers are semi-unconfined and regionally interconnected, inter-aquifer leakage represents
an important mode of recharge;
Throughflow roughly parallels surface drainage; flow lines converge towards middle of the
plain, then swing NW; i = 0.0005. Hydraulic gradient varies significantly over periods of
months / years, after major recharge events.
Local reversals of gradient and groundwater flow resulting from recharge mounds. In some
locations - correlation between floodouts, ephemeral swamps and lakes, and these recharge
mounds;
At Alekarenge a sand aquifer occurs between 18 m and 24 m bgl. Where this is absent
groundwater is obtained from calcrete at a similar depth. Bore RN 10744 �Warrabri production
bore #7� at Alekarenge can be pumped continuous rate =<30 L/s in a (?) silcrete/calcrete
aquifer. At Wycliffe Well, calcrete aquifer yields 9 L/s, but usual yield is ~ 2 L/s.
�Area 1� field investigations findings:
i = 0.0005 throughflow = 500 to 25,000 m3/d/km width of aquifer;
T = 150 to 5,000 m2/d (short term pumping tests of a few bores),
Regional T expected to be 1,000 to 5,000 m2/d;
specific yield, Sy not determined as limited number of pump tests incorporating observation
bores;
Local aquifers storage volume = 750 � 2,500 GL; based on:
o aquifer area of 500 km2 (area enclosed by 1,000 mg/L TDS contour);
o aquifer is semi-confined;
o Sy taken as 0.03 to 0.1;
o mean aquifer thickness = 50 m with 1,000 mg/L TDS;
gave a nominal borefield capacity of 1 GL/year;

Assessment of Groundwater Resources in the Western Davenport Plains Water Control District
Revision No: 0 E204629 Aug 2009
33
50 % of the 10 investigation bores showed increasing TDS with depth; 1 had no change; others
improved TDS with depth;
Proximity to creeks did not imply better recharge conditions and lower salinity groundwater;
Hypothesised that structural geology influences groundwater quality;
Hydrochemically closely grouped except in �Area 2� investigation bore, located E of Bluebush
Bore;
Bore near Bluebush Bore shows relationship Mg>Ca>Na>Cl - indicates a dynamic regime with
a recharge component;
relationship Na>Mg>Ca characteristic of seawater but also HCO3>SO4 which indicates water
in some dynamic phase;
2 bores between Wauchope and Hurst Creeks show more typical relationship, SO4>HCO3
indicating water in stasis (despite their location at foot of Davenport Ranges (cf likely recharge
zone).
NRETA (R Paul), 2002 & 2005
Aquifers were described in Georgina Basin sandstones (Chabalowe Formation), and
limestones (Arrinthrunga Formation), and Tertiary sediments with and without chalcedony;
identified WRAZs to calculate storage and throughflow;
estimate (total of 4 WRAZs in the plains was 1,900 � 13,170 ML/a throughflow and 330 �
3,300 GL in storage;
[Comment in NRETA (2007C) � assessment based on much lower aquifer parameters than that
established by NRETA (2007A) � latter allowed for partial penetration of tested bores in
calculating T];
identified recharge areas and noted they contained better salinity water.
WDP TDS < 2,000 mg/L, and frequently < 1,500 mg/L;
Paul (2005) extended known area of Cambrian aquifers with groundwater < 1,000 mg/L to
10 km to W of previous assessments;
< 1000 mg/L TDS groundwater is located in aquifers along foothills of Davenport Range, and S
of Murray Downs Homestead at Bluebush and Chabalowe Bores;
Localised areas of higher TDS groundwater near Davenport Ranges (e.g. parts of Singleton)
may be due to evaporites in rocks;

Project title - Report name Revision No: 0 Document ID number Report date
34
Brackish to salty groundwater associated with Osborne, Crawford and Watt Ranges to SW. In
this area salinity improves down-gradient with some lower TDS groundwater along Taylor
River. Noted water quality distribution in this area is erratic; probably reflects rock-water
interaction associated with underlying Arunta Complex;
Hydrographs of Cainozoic and Palaeozoic aquifers show substantial SWL variations in response
to above average rainfall periods;
Years 1973-77 rainfall exceeded annual average (of 312 mm); (maximums of 953 mm at
Barrow Creek in 1974 and 836 mm at Tennant Creek in 1977);
Wycliffe Well and Alekarenge located along a line parallel to Davenport Ranges and along
central drainage depression which continues to Green Swamp Well. At Wycliffe Well recorded
SWL = 2.5 and 4.5 m and > 8 m at Alekarenge;
Noted that areas around Bluebush and Chabalowe bores are subject to flooding and ponding;
Alekarenge 1990 SWLs were still ~ 3.5 m above SWLs of 1966 - 1973, indicating a rate of
decline of the potentiometric surface of approximately 0.4 m/year.
Using hydraulic parameters identified for �Area 1, SWL rise corresponded to 240 - 800 mm of
infiltration, or between 7 % and 22 % of rainfall.
Concluded � significant recharge across the plains occurs only after rare substantial rainfall
events � manifest in SWL hydrographs as a series of peaks probably every 20-30 years followed
by slow decline with occasional minor peaks following greater than average rainfall events;
For �Area 1�, using 500 km2 area with < 1,000 mg/L TDS, the 1973-77 event = 120 - 400 GL
water added to aquifer storage.
NRETA (2006) (Bob Read)
Tara is an excision on Neutral Junction Station, near Stuart Highway;
Geology - Central Mount Stuart Formation and older, Arunta metamorphic and igneous
rocks;
Historically, many investigations around Tara have failed to find much potable water;
Central Mount Stuart Formation contains moderate aquifers. It is flat-lying to gently dipping
and occurs in down-faulted blocks;
water supply � bore RNs 14833 and 16917 in the Central Mount Stuart Formation sandstone
with interbedded siltstone;

Assessment of Groundwater Resources in the Western Davenport Plains Water Control District
Revision No: 0 E204629 Aug 2009
35
Tara�s water use only ~ 3 - 5 ML/a;
No environmental use has been identified, though any River Red Gums on Donkey Creek
would be evapo-transpiring some groundwater.
RN 14833, T = 6 m2/day;
Test pumping analysis indicates radial flow; surprising in view of failure of nearby bores to
yield useful supplies of water.
Cambrian age Neutral Junction and Octy Formations, and the Cainozoic units are above the
water table;
groundwaters from the Central Mount Stuart Formation indicate magnesium rich (cf
dolomite); while �other waters� (from older rocks?) are more calcium rich;
attempt to correlate TDS versus rainfall in the previous 10 days, 30 days, 100 days and 1 year,
without success;
production bore would be recharged from flows in nearby Donkey Creek; no data for flow
frequency (and duration), but it is �likely that flows would occur in most years, with no flow
periods of 2 to 3 years being possible�.
NRETA (2007A) (Peter Jolly)
Pertains to Warrabri/ Murray Downs/ Singleton area;
Multiple aquifer system is extensive and complex;
NRETA�s investigation bores cover discrete areas rather than uniformly spread across whole
system;
cost of undertaking detailed groundwater investigations of each aquifer across the whole WDP
would be prohibitive;
Aquifer thickness > 300 m in SW to 20 m at edge of Davenport Range � average of order of
150 m thick (�refer NTGS cross section�).
i = 0.0005 from Bluebush bore area to Wycliffe Well. Noted that hydraulic gradient from
Bluebush Bore area slopes both ways (i.e. groundwater flows to NW and SE with similar
gradients);
T (test pumping using partially penetrating bores) = 150 - 5,000 m2/d. (Hence; full thickness)
aquifer T estimate = 1,000 - 5,000 m2/d.;

Project title - Report name Revision No: 0 Document ID number Report date
36
Throughflow from Bluebush Bore area to NW = (1,000 to 5,000) x 0.0005 x 40,000 m (aquifer
width) = 20 - 100 ML/day = 7.3 to 36.5 GL/a.
Sy 0.03 (carbonate) to 0.07 (Cainozoic);
In 40 years since monitoring began, total of SWL rises due to recharge events = ~ 14 m. Most
monitoring bores are relatively close to Davenport Range leading to an over-estimate of
recharge; (hence) assume regional rise = ~ 7 m. Equates to annual recharge of 5 - 12 ML/km2.
Aquifer area E of Stuart Highway underlying Warrabri, Singleton and Murray Downs =
~ 5000 km2. Recharge should be order of 25 - 60 GL.
In 1990 annual recharge was estimated to be 6 to 40 GL for �Area 1�.
Recharge minus throughflow for whole area estimates = -11.5 to 52.7 GL
Area NW of Bluebush Bore, ET = say 1 mm/day; therefore be 0 - 150 km2.
Approximate volume in storage = 150 x 5,000 x 106 x 0.05 = 37,500 GL;
~ 10 % of this storage, say, 4,000 GL appears to contain water with < 1,000 mg/L TDS;
Carosone (1990) estimated volume of good quality water = ~ 1,500 - 5,000 GL (i.e. twice
amount in Area 1);
Annual recharge estimate = 10 - 50 GL/a for aquifer system in Murray Downs/Alekarenge/
Singleton area;
Evapotranspiration from swamps in area probably discharge most of this water;
Volume of good quality water in storage in the Murray Downs/Alekarenge/ Singleton area order
of 2,000 - 4,000 GL;
Bore monitoring network and spread of groundwater quality monitoring sites need to be
expanded as per recommendations in Gilbert and Jolly (1990);
Need a numerical groundwater model to determine optimal placement of production bores and
impact on groundwater dependent ecosystems;
(Ride�s additions to?) Jolly�s notes:
Numerical modelling should be undertaken in ~ 5 years time with input from monitoring data
on SWLs and groundwater chemical quality changes following extraction of 4-5 GL/a.;
WLs in Wycliffe Swamp and SWLs in underlying aquifers need to be monitored in a specially
constructed monitoring bore.

Assessment of Groundwater Resources in the Western Davenport Plains Water Control District
Revision No: 0 E204629 Aug 2009
37
NRETA (2007C) (Graham Ride)
sets out interpretations and assessments of both recent and earlier, land and water resource
assessment technical reports, notes and maps;
care is needed in extracting and comparing calculations and data from the various technical
reports prepared over the past 20 years in that the analysis often refers to quite different areas or
different natural resource parameters1.;
�prepared key set of maps to meet water resource management and development needs as
identified by the Controller of Water, landholders and agribusiness companies interested in
establishing commercial farms in the region�. The sets are:
o the �Western Davenport Region, Atlas of Land and Water Resource Maps�; a set of 14,
B1-sized, 1: 250 000 maps, August 2006;
o the �Water Resources of the Western Davenport Plains�; a set of 6, B1-sized, 1: 250 000
maps, and 2 large-scale, schematic hydrogeological cross-sections, July 2007.
These maps identify:
WRAZs;
catchment boundaries; and,
other key water resource information including the potentiometric surface,
direction of groundwater flow and groundwater chemical quality zones.
presented tabulations of water resource assessment information; e.g. volumes of different
quality groundwater in storage in WRAZs using parameters from Verhoeven and Read (1979),
Paul (2003 and 2005) and NRETA (2007A).
calculations are based on WRAZ boundaries determined from the hydrogeological
characteristics of the aquifers, recharge zones and hydrological boundaries (area of each zone
calculated from TDS contour map. Some of these totals are quoted from NRETA (2007C) in
Section 6.6.1 and discussed and critically reviewed in that section.
because of lack of bores between Stuart Highway and Paul�s (2005) investigation area, it is
possible that the actual location of 1,000 mg/L TDS contour is further to the W
some evidence that SWLs rises above ground level at Bluebush, Chabalowe Bores and possibly
in other locations such as Thring Swamp; yet to be confirmed with properly constructed
monitoring bores. 1 this paradigm is perpetuated through this consultancy, as the study boundary of the WCD is different (envelopes a larger area) than that used as a basis for NRETA�s (2007c) water resources assessment.

Project title - Report name Revision No: 0 Document ID number Report date
38
water quality areas based on TDS contours drawn from groundwater sampling analyses at
May 2007
calculation of water in storage volumes utilised estimated �low� SWLs above AHD based on
NRETA monitoring program data;
SWL fluctuations of 8 - 12 m are known in the Alekarenge area as a result of major recharge
events and natural discharge;
SWL fluctuations of ~ 3 m occur in Wycliffe Well area as a result of major recharge events and
natural discharge;
extensive Cainozoic aquifers overlie Cambrian Aged sandstones and limestone within the main
aquifer zone;
Cainozoic aquifers are primarily Tertiary aged sands, gravels, calcrete, chalcedony and sandy
clays (up to 95 m thick);
variable yields from Cainozoic aquifers within close proximity (2 - 30 L/s);
estimates of the volume of Cainozoic and Cambrian sediments within the Shirley, Chabalowe,
Spinifex, Conglomerate WRAZs used estimated, average strata thicknesses.
above calculations use a conservative Cainozoic aquifer thickness (28-80 m);
Cainozoic, Cambrian and Proterozoic Aged aquifers are interconnected on a regional basis;
main aquifers are fractures but there are porous beds;
In places Cambrian aged sediments are > 325 m thick. Above calculations assume 200 m
thickness;
Conglomerate Bore area has high yielding aquifers in the Proterozoic Andagera Formation;
Best Cambrian yields to date are from Chabalowe formation sandstone; with reasonable yields
from Arrinthrunga formation limestone.
Spinifex and Conglomerate WRAZs mark the transition zone between the Georgina and Wiso
Basins;
Considerable faulting of the Cambrian formations evident from geophysical survey, this
complicates the hydrogeology but has improved the storage;
Sy values used in the calculations as identified by Jolly (NRETA 2007A).

Assessment of Groundwater Resources in the Western Davenport Plains Water Control District
Revision No: 0 E204629 Aug 2009
39
Australian Groundwater Technologies (AGT, 2007A)
AGT reviewed the hydrogeology of the Alekarenge area and identified an area of land suitable
to develop a water supply borefield for a horticultural farm;
Pertinent recommendations were:
o development of a borefield tapping the Chabalowe Formation aquifer;
o the proposed borefield to be situated within a 5 km W � E by 2.5 km N � S block
bounded by bores RNs 18000/18117 and 18001, adjacent to, and S of, the Stuart highway
� Alekarenge / Murray Downs homestead access road.
AGT, 2007B
Following from AGT (2007A), a detailed concept design for the proposed borefield was undertaken.
Pertinent aspects from scope of work included estimating the water demand and the potential impacts
arsing from the proposed operational philosophy of the proposed borefield. A borefield numerical
model and wider �environmental-impact� model was set-up to investigate amongst other aspects,
pumping interference impacts and possible impacts to other users including possible GDEs. Key,
pertinent, findings were:
projected irrigation water demands indicated that some 190 GL of groundwater would be
extracted over some 45 years;
based on the storage volume estimate in the Spinifex WRAZ (NRETA, 2007C) encompassing
the proposed borefield site, the volume extracted would represent some 15 % of total storage
in low salinity (< 1,000mg/L TDS), Cambrian aquifers, and 3 % in the total Cambrian
aquifers;
under the pumping regime envisaged (2008 - 2010) an average, instantaneous production of
80.5 L/s increasing to 145 L/s post-2011 (with various bore Nos. / configurations), the pumping
cone of influence to the 5 m drawdown contour is 2.3 km;
steady-state drawdown conditions quickly prevail, and the cone does not spread over many
years due to good transmissivity of the aquifer and leakage to the Cambrian aquifer form
overlying Cainozoic aquifer;
with years of pumping because of leaky nature of aquifer, drawdown in Cambrian and
Cainozoic is similar;
radius of influence is predicted to extend to a radius of ~ 7.5 km after 43 years of production;
drawdown is restricted to ~ 0.5 m in Cainozoic aquifer at Alekarenge (closest third-party
water supply) after 43 years of production;

Project title - Report name Revision No: 0 Document ID number Report date
40
all other users, chiefly Murray Downs and Singleton Stations and Wycliffe Roadhouse, are
situated far beyond the radius of influence;
possible GDEs; chiefly Thring Swamp and Wycliffe Creek, are situated well beyond the radius
of influence. Piggery Bore Swamp lies ~ 800 m E of the modelled zero drawdown contour and,
on this basis, will be unaffected, too. The downstream outlet of Warrabri Swamp (at bore,
RN 2881) lies at about the 2 m drawdown contour;
with 50 years of pumping, the model indicates only minor ingress of slightly more saline
groundwater (commencing after some 20 years of pumping).
NRETA (2008A) (Jon Sumner)
Groundwater assessment of Iliyarne ALT (May 2008) to assist with developing WDP
WRAP, and to assess potential for horticultural development;
3 investigation bores, RNs 18241 & 2, and 18338, drilled in 2008, ~ 10 km apart;
This report reported the 4th, and most westerly bore, in a series of investigation bores
drilled in the area;
NTGS modelling indicates Hatches Creek Group basement occurs at approximately
240 m bgl.
Bore RN 18401, drilled TD 225 m, encountered Cainozoic, Arrinthrunga and Chabalowe
Formations; did not penetrate basement;
Completed as a monitoring bore;
Stratigraphic hole, �BC-5�, situated 15 km S of RN 18401;
Chabalowe Formation aquifer intersected 160 - 200 m ; 1,100 mg/L TDS;
SWLs = ~ 5 m bgl;
Magnetic modelling of Hatches Creek Group (NTGS) indicates basement high due to block
faulting commencing 4 km E of Stuart Highway at S edge of map sheet. Magnetic and
gravity contour maps (Bonney Well Explanatory Notes) show fault strikes to be NW and
divide basement granite into stepped blocks upon which sedimentary formations drape;
Alekarenge PMG Farm is on a basement high;
Depth to basement increases to SW;
In S of Bonney Well (SF53-2) 1:250,000 geology map-sheet occurs the junction of Wiso
Basin to W, and Georgina Basin to E;

Assessment of Groundwater Resources in the Western Davenport Plains Water Control District
Revision No: 0 E204629 Aug 2009
41
Proterozoic rocks outcrop in Davenport Range 20 km NE of Iliyarne ALT;
upper 10 m is weathered to pink/white/yellow/grey clay, as at Alekarenge Farm, underlain by a
white friable sandstone aquifer (�top of� Chabalowe Formation).
boundary is best determined by gamma logging (cf significant drop from average 120 cps in
Arrinthrunga to 60 cps in Chabalowe);
Calliper log should show slightly larger hole diameters due to the more friable nature of
Chabalowe Formation;
RN 18401: Cainozoic aquifer 4 m thick; Arrinthrunga Formation aquifer ~ 20 m thick;
Chabalowe Formation aquifer 12 m thick.
Section shows an E dipping basement high at Alekarenge PMG Farm bounded by faults at
420000E and 422000E;
Sumner (his Figure 4) extrapolated faults along NW structural trend to form stepped blocks;
Fall of 50 m interpreted to top of Chabalowe Formation between Alekarenge PMG Farm
(RNs 18000 and 18390) and Thring Swamp (RNs 18242 and 18338);
A further drop of 50 - 60 m interpreted on the block containing RNs 18401 and 18241
which lies between Alekarenge Farm and Thring Swamp blocks, suggesting this block is
lower than the others;
SW of fault at 420000E, �BC-5� struck Chabalowe Formation at 169 m and granite
basement at 328 m. The basement may drop further still toward the Lander Trough in the
SW;
(Frogtech, 2006 reported in Sumner, 2008A) interpreted NW � SE, moderately dipping, normal,
and NE - SW vertical transfer structures in basement;
RNs 18401 and 18338 were logged with gamma, calliper and conductivity probes;
Gamma log of RN 18338, Thring Swamp shows an identical sequence to RN 18242 which is
approximately 1 km to S;
Gamma logging at Alekarenge Farm (RNs 18387 � 90 drilled in March/April 2008) showed
geology there is, essentially, flat-lying;
RN 18000, adjacent Alekarenge Road, encounters Chabalowe Formation closer to surface
which suggests a gentle dip to E. (Paul ,2005, comments that the basement surface appears
to be dipping to E between RN 18000 and Alekarenge);

Project title - Report name Revision No: 0 Document ID number Report date
42
RN 18338, 1.5 km N of RN 18242, yielded significantly more;
RN 18401, 5.5 km W of RN 18338 had similar yields;
possible that groundwater is draining to RN 18401 from the Davenport Range via Thring
Swamp;
RN 18401 test pumped for 1,500 minutes at 16 L/s (July 2008). T = 69 m2/day (�upper�
Chabalowe Formation aquifer 160 - 170 m bgl);
Sc = ~ 5 x 10⁻⁵;
RN 18241 shows increase in EC with depth;
Cainozoic aquifers EC = 1,550 ìS/cm; below 90 m, EC increases to 1700 ìS/cm;
RN 18338 EC = 2,200 ìS/cm near surface reducing to 1,290 ìS/cm at 36 m bgl, rising to
1,780 ìS/cm and consistent with depth. Evaporation concentrated salts in Thring Swamp may
be responsible for higher EC near surface. The lower value at 36 m may correspond to W
groundwater flow recharging from the Davenport Range;
RN 18401 EC increases from 1,400 ìS/cm in Cainozoic and upper Arrinthrunga Formation
at ~ 80 m depth to 1,800 ìS/cm in Chabalowe Formation at 160 m.
Groundwater at Alekerange PMG Farm is fresher than at Iliyarne.
Gamma most diagnostic tool for Iliyarne region. Chabalowe aquifer (45m+) discernible
from overlying Arrinthrunga Formation (latter contains more clay � higher gamma
response. More clayey bands are shown as spikes in the Chabalowe Formation).
NRETA (2008B) (Anne Pye)
Bore sites selection to provide:
o information for preparation of draft WDP WRMP;
o to extend SWL monitoring network across WDP (per 1990 recommendations).
4 bores RNs 18402-5 and 3 bores RNs 18346-8 inclusive were drilled along N boundary of
Neutral Junction (opposite Alekarenge turnoff, S of Wycliffe Well) in June and
September 2008, respectively;
Bore sites located in extensive Singleton spinifex red sand plains intersected by a Sandover
alluvial Coolibah floodout;
Only RN 18403 drilled > 100 m penetrated Arrinthrunga Formation (dolomite) at 117 m;

Assessment of Groundwater Resources in the Western Davenport Plains Water Control District
Revision No: 0 E204629 Aug 2009
43
All but one of bores encountered a Tertiary aquifer (fine, white quartz arenite);
214 to 1,020 ìS/cm EC in 6 western-most bores;
RN 18404, the eastern-most bore drilled (closest to Stuart Highway), recorded salinities up
to 1,710 ìS/cm EC;
Field EC indicated that salinity deteriorated with depth, except in RN 18403;
RN 18403: EC improved on penetrating dolomite at depth;
Ostensibly, yields increased with depth;
Airlift yields in 2 most western bores RNs 18347 & 8 were 1 L/s; the other 5 bores yielded 4 �
17 L/s;
Same aquifer was intersected by 4 bores, RNs 18387-90 drilled at Alekarenge for PMG Farms
in April 2008. PMG Farm bores yielded 10 - 20 L/s and EC�s of 590 � 970 ìS/cm. Gamma
logs of RN 18000, and composite logs of RNs 18117 & 8 (drilled 2004) sited < 3 km NW
of PMG bores were consistent with intersection of this sandstone aquifer;
The aquifer appears to be oriented E � W;
Geological and gamma logs of investigation bores drilled to NE, viz. RNs 18401 (drilled 15 km
N on Iliyarne ALT), 18338, 18241, and 18242, in the vicinity of Thring Swamp, and on Iliyarne
ALT (S of Wycliffe Well), indicate that the aquifers lie in a different formation;
Gamma logs and ECs indicate RNs 10223 (1 km E of RN18402 and 18403) and RN 15966, the
bores closest to 2008 drilling, appear to intersect the same aquifer;
RN 17182 (�BC-5�) contain similar sediments to Neutral Jcn. bores;
Other bores in a central corridor adjacent the Stuart Highway were gamma logged. These logs
did not indicate dominance of same fine, quartz arenite beds, which comprise main aquifer in
the newer PMG Farm and Neutral Jcn. bores. Moreover, their historic salinities are comparable
with higher EC�s shown in RN 18404 (the most proximate of new bores to Stuart Highway);
Possible that aquifer intersected at Neutral Jcn. and PMG Farms (2008) is overlain by more
saline clay sediments in areas adjacent the Highway, and that recharge filtering through these
sediments has an adverse impact on the water quality in these areas;
RN 18403 (sited on W side of Taylor�s Creek floodout), major sandstone aquifer underlain by
very hard dolomite beds of the Arrinthrunga Formation. Cores from nearby NTGS stratigraphic

Project title - Report name Revision No: 0 Document ID number Report date
44
bores (RNs 17177-17182) shows this dolomite to include vughs, minor solution cavities and
fractures;
RN 18403 test pumped (12 hours constant rate): T = 250 m2/day and Sc = 10-62 and indicates a
slight delayed yield effect indicating leakage from overlying storage.
NRETA (2008D) (R. Read)
Desktop study of Munkarta (McClaren Creek) community N of northern boundary of WCD.
Bores drilled near McClaren Ck. homestead have produced reasonable yields of TDS
< 1,000 mg/L);
McLaren Creek provides potential recharge; however salinity is variable and there are only local
lenses of lower salinity groundwater, not exclusively recharged from major creeks;
SW corner (SW of Younghusband Range), S of Mungkarta: good yields of marginal salinity
water found near Wycliffe Well in a small, NW trending (?Cainozoic) basin recharged by
Wycliffe Creek;
Salinity increases to NW in this basin;
NW corner underlain by Warramunga Formation;
Bores near Bonney Creek have saline water;
Table 4-1 summarises water resources data gleaned from NRETA (200C).
2 incorrectly analysed � needs checking?

Assessment of Groundwater Resources in the Western Davenport Plains Water Control District Revision No: 0 E204629 Aug 2009
45
Table 4-1 Western Davenport Plains � Water Resources
Climate Surface water area / drainage morphology Groundwater catchments, storage & salinity Groundwater recharge & throughflow
N. of frost line, mean temperatures Tennant Creek 24-36°C January; 14-26°C July.
Alekarenge (19 years record): Average annual rainfall = 398 mm/a; Median annual = 320 mm/at;
Tennant Creek:
Average annual rainfall = 375 mm
75-80 %of annual rainfall during summer thunderstorms.
Drought-dominated regime.
Rainfall much greater than annual average falls for a few days ~ 1 in every 30 years; e.g. Jan 2007 & in 1973 > 400 mm fell over a few days.
Evaporation order of magnitude greater than rainfall
Catchment area = 14,700 km2 to drainage outlet of Plains NW of Wauchope (7,770 km2 of sand plains + 6,900 km2 of ranges, hills, rocky plains & floodouts). 2 catchments: southern catchment covers 75 % of Plains & a large catchment area up-gradient (main drainage line to NW); northern catchment covers NW 25 % of Plains & a catchment area up-gradient to E of Hanson River.
7 major watercourses disgorge through deeply incised ephemeral creeks of Davenport Range & runoff to SW to floodouts 10-20 km to SW of foot slopes; meet with NW-SE drainage line (? fault controlled) SE of Chabalowe bore & swamp & continues to Green Swamp Well (NW of Tennant Ck.) ~ 200 km to NNW as flood & sand plains.
Ephemeral creeks flowing off Davenport Ranges are:
� Sutherland Ck., NW of Wauchope;
� Wauchope Ck. nr. Wauchope;
� Hurst Ck (crosses Stuart Hwy at Singleton Homestead turnoff);
� Wycliffe Ck. (crosses Stuart Hwy. just N of Wycliffe Well Roadhouse);
� Conglomerate Ck., E of Wycliffe Well.
E of Warrabri ALT & Alekarenge are 2 large creeks associated with major floodouts of Skinner & Murray Cks.
Taylor�s Ck flows off Osborne Ranges has a large catchment area to SW (crosses Stuart Hwy. at Taylor�s Well).
Normally, flows are intermittent & discontinuous in sections, but after rare, major runoff events, stream flow recommences W of floodouts flowing over a number of saddles along its length, e.g. NNW of Blue Bush Bore on Murray Downs Stn.
2 major ephemeral rivers flow from Osborne & other Ranges along SW boundary of the Plains.
Waterholes & low yielding springs (?) & seeps occur within and at foot of ranges.
2 catchments 9,000 km2: NW catchment (abuts SE catchment to NW, W of Stuart Highway) & SE catchment to an outflow zone NW of Wauchope (NRETA, Nov 2007).
Volume of groundwater in storage calculated for aquifers below Plains for 4 main SE �water resource assessment zones�
DNRETA (2007C).
Estimated 56,000 GL groundwater storage in 6 interconnected major aquifers below Plains (volumetrically, ~ 50 % is situated E of Stuart Hwy; estimated 21,000 GL < 1,500 mg/L TDS; DNRETA (2007).
E of Stuart Hwy. 75 % of groundwater within main aquifers has TDS < 1,500 mg/L & > 50 % is < 1,000 mg/L.
Plains have salinity by surface area < 1,500 mg/L > 4,000 km2 & < 1,000mg/L =< 2,000 km2 (NRETA, Nov 2007).
Limited hydrogeological information W of Hwy (an area of > 3,500 km2) so storage volume estimates less reliable: 28,000 GL W (?) of Stuart Hwy.
SWL = 2-30 m bgl
2,000 ML/a allocation to Centrefarm Block 1.
Recharge pulse every 35 years or so from large rainfall events (> 400 mm) raise SWL ~ 8-12 m in some locations, 2-3 m in others or as small as a few cms; e.g. 1973 rainfall event) with ongoing SWL decay from this event to date.
Groundwater recharge / discharge fluxes have been estimated on a regional basis.
Based on post-1973 SWLs rise, and aquifer storativity values, annual recharge E of Stuart Hwy, for 5 main WRAZs in SE plains is c. 18,000 to 40,000 ML/a (NRETA, Nov 2007).
Aquifer throughflow at Bluebush Bore section = c. 7,300-36,500 ML/a (NRETA, Nov 2007).
Following recharge, throughflow increases due to increased thickness of saturated sediments & increased hydraulic gradient. In some locations, groundwater flow direction is reversed; changes of throughflow direction believed to occur over months or years.
From a regional perspective, aquifers have a common water table / potentiometric surface.

Project title - Report name Revision No: 0 Document ID number Report date
46
4.3 Groundwater Use
Groundwater accounts for 100 % of water supplies in the WDP so that, essentially, all public water
supplies, and the pastoral and horticulture industries rely on it. However, it is likely that some pastoral
water use is semi-reliant on water-holes, off-stream farm dams, excavated tanks, and turkey's nest
storages, particularly on the rocky ranges. These diversions would be negligible and certainly well
below the permissible 5 % of flow.
There are neither springs nor dry weather flows i.e. rivers and creeks are all ephemeral (refer to Figure
1-1 for surface water catchment and sub-catchment boundaries).
The aquifers currently provide domestic water supplies to Alekarenge, several Aboriginal outstations,
two homesteads, one roadhouse and associated tourist facilities. Stock water for three cattle stations is
extracted stock bores across the plains and in adjacent areas. The annual extraction from the
aquifers is estimated to be less than 200 ML/a.
4.4 Water Bores
Whilst many bores have been drilled across the WDP they are not uniform in total depth (see Figure
4-2), separation or reliability of the data (see Figure 1-2 for distribution), and, as such, do not provide
an overall understanding of the extent, variability and characteristics of the main aquifers. There are
clusters of bores in localised areas e.g. Alekarenge and Wycliffe Well, and only a relatively limited
number of bores drilled into the deep Chabalowe and Arrinthrunga Formations aquifers.
There are extensive areas within the WDP where few bores have been drilled.
Several cored stratigraphic bores have been drilled by the NTGS and the old BMR (refer Section 3.4.
These bores provide key information on the stratigraphy of the Chabalowe and Arrinthrunga
Formations.
Many of the bores which have been drilled across the WDP were drilled as stock or community bores
where drilling ceased after obtaining limited yields required. This is illustrated by Figure 4-2 whereby
it is observed that most of the bores drilled penetrate down to a maximum depth of 120 m bgl; with the
majority terminating between 40 and 80 m bgl, indicating completion in the Cainozoic / upper
Cambrian aquifers, or the weathered, fractured rock in fractured (�bedrock�) rock aquifers.
Figure 4-3 indicates the number of bores drilled classified by type (�currently known status�) and by
aquifer screened. This figure is discussed further in Section 6.

Assessment of Groundwater Resources in the Western Davenport Plains Water Control District
Revision No: 0 E204629 Aug 2009
47
Figure 4-2 Total bore depth (m bgl) vs. No. of bores drilled in the WDP
Figure 4-3 Bore Status by Screened Aquifer vs. No. of Bores Drilled

Project title - Report name Revision No: 0 Document ID number Report date
48
Figure 4-4 SWL vs. No. of Bores
Figure 4-4 graphs SWL class intervals (10 m) versus No. of Bores. It indicates that the majority of
bores are completed in formations with SWLs of (5 m) to 20 m bgl; these bores are mainly but not
exclusively completed in Cainozoic and into the Cambrian aquifers.
SWLs in the Hatches Creek Group tend to be deeper (20-50 m bgl), and variable in the Andagera and
granites of the Arunta block (10-40 m bgl), indicating aquifer compartmentalisation.

Assessment of Groundwater Resources in the Western Davenport Plains Water Control District
Revision No: 0 E204629 Aug 2009
49
Only a limited number of high yielding production bores have been drilled and test-pumped for short
durations. Primarily, the testing was undertaken to establish production bore pumping rates, and
secondarily to determine aquifer hydraulic characteristics. The majority of bores have only been air-
lifted at completion of drilling. Such air-lift yields tend to underestimate the yield of the aquifer and
are of little use in determining aquifer sustainable yields (and wellfield yields or capacity).
Bore yields for the same type of aquifers have been quite variable. In view of the limited number of
investigation production bores that have been drilled to date and the known variability of the strata,
some caution should be exercised in projecting the potential for the upper range of continuous bore
yields in the same formations across the region.
All water bores with useful data3 are plotted on Figure 1-2 in relation to land tenure. Some 290 bores
are displayed and were used to inform this study. They were culled and collated from 3 databases
suppled by NRETA for this commission. Appendix B utilises this database to classify the bores into
the major aquifer formations on various map backdrops (these maps then assisted to draw up the
WRAZs; see Section 7.2).
Figure 3-1 indicates the groundwater monitoring bore network [plotted from data provided in
NRETAS (2009) and NRETA, (2007C)]. The bore network is clustered geographically into six
monitoring areas, as follows:
Ali-Curung / Warrabri;
Warrabri;
Murray Downs;
Neutral Junction;
Singleton Station; and,
�Railway Corridor�.
3 The bore databases supplied by NRETAS have been collated, sorted and culled to erase bores with little or no associated hydrogeological data (i.e. neither/nor SWL, EC/TDS, dubious airlift Yield, driller�s/geological logs).

Project title - Report name Revision No: 0 Document ID number Report date
50
5. Surface Water Hydrology
5.1 The Drainage System
Drainage divisions and river basins defined by the Australian Water Resources Commission
(Environment Australia 2001) indicate that the WCD lies wholly within the Wiso Basin surface water
catchment. The main surface water catchment within the WCD occupies some 14,850 km2.
Table 5-1 summarises geomorphic data and categorise creek reaches in terms of the bioregion they
reside within.
Table 5-1 Wiso Basin - Summary statistics (extracted form Table 8 of Duguid, et al. (2005)
Drainage System / Major Tributaries
Initial Bioregion
Interim & Terminal Bioregions
Highest Point in Catchment (m asl)
Height of highest Major Channel (m asl)
Lowest Point in NT (m asl)
Straight Line Length (km)
flowing W & SW from Davenport & Murchison Ranges
Edinburgh Ck DAV DAV 525 425 390 15
McClaren Ck DAV TAN 556 390 340 25
Wauchope Ck. DAV TAN 500 425 350 15
Wycliffe Ck. DAV TAN 570 390 350 30
Skinner Ck. DAV TAN 625 450 385 35
Murray Ck. DAV TAN 605 460 385 35
flowing N into or towards the Tanami Desert
Hanson R (Woodforde R & Bloodwood Ck
BRT TAN 1,001 625 350 250
Taylor Ck. BRT TAN 697 Mt Gwynne
540 400 75
There are no surface water gauging stations within the study region (A. Pye, pers. comm.).
Water flows into or across the floodout as either sheet-flow or by minor channels, which can occur in
braided patterns (also called anastomosing or reticulated). In extreme rainfall events water may flow
across the land surface in vast sheets for substantial periods of time (days and possibly weeks).

Assessment of Groundwater Resources in the Western Davenport Plains Water Control District
Revision No: 0 E204629 Aug 2009
51
Palaeodrainage channels occur in some of the flat areas. These are subterranean features where
relatively unconsolidated sediments have filled in ancient valleys and watercourses, providing a
conduit for groundwater flows.
There is a small S � N drainage line through the Centrefarm Block 1. Satellite images there appears to
be a relict drainage line extending back to the gap in the Osborne Range through which Taylors Creek
flows (the pass used by the Stuart Highway through the range). Currently Taylors Creek flows to the
NNW from this pass; but may have once flowed through parts of Centrefarm�s block or environs.
There also could be palaeochannels associated with ancient flows of Taylors Creek, but there is no
stratigraphic evidence to date.
5.2 Wetlands
Figure 2-1 indicates the locations of ephemeral swamps and pans draped on a DEM.
Whilst Environment Australia (2001) cites there are no �nationally important wetlands4� in the study
region5, Duguid, et al. (2005) indicates otherwise, as expounded below. Reference is also made to
http://www.nt.gov.au/nreta/wildlife/nature/aridwetlands.html
The following areas within the WCD hold significant arid �wetlands�:
Chabalowe and Thring ephemeral swamps;
Bluebush bore ephemeral �lake�;
intermittent clay-pans;
waterholes associated with deeply incised creeks and rocky outcrop country in the ranges;
in-stream waterholes within The Plains e.g. Wycliffe Well; and,
Murray Creek Floodout.
Floodouts such as the one along Murray Creek can flood up to 0.5 m deep over an area estimated to
be 183 km2. Floodwater can spill out of the floodouts onto adjacent plains over periods of weeks.
This has occurred quite frequently over the main Alekarenge, Murray Downs Homestead access road
S and SW of Bottom Bore on Murray Downs (NRETA, 2007C).
The ephemeral lake at Bluebush Bore and Chabalowe Bore swamp appear to have formed as a result
of relatively recent geological barriers across the main NW drainage line. These may be calcrete or
4 The definition of a wetland used in the Directory is that adopted by the Ramsar Convention under Article 1.1, namely: �wetlands are areas of marsh, fen, peat land or water, whether natural or artificial, permanent of temporary, with water that is static or flowing, fresh, brackish or salt, including areas of marine water the depth of which at low tide does not exceed six metres.� �modified slightly to suit the Australian situation in describing wetlands of national importance. Notable alterations to the Ramsar classification system included the addition of non-tidal freshwater forested wetlands and rock pools. 5 The nearest one catalogued is Lake Surprise (Yinapaka) of area 800 ha in the Tanami west of the study region.

Project title - Report name Revision No: 0 Document ID number Report date
52
sand, gravel and calcrete barriers formed from formation of the limestone and deposition of fluvial and
alluvial deposits (NRETA, 2007C).
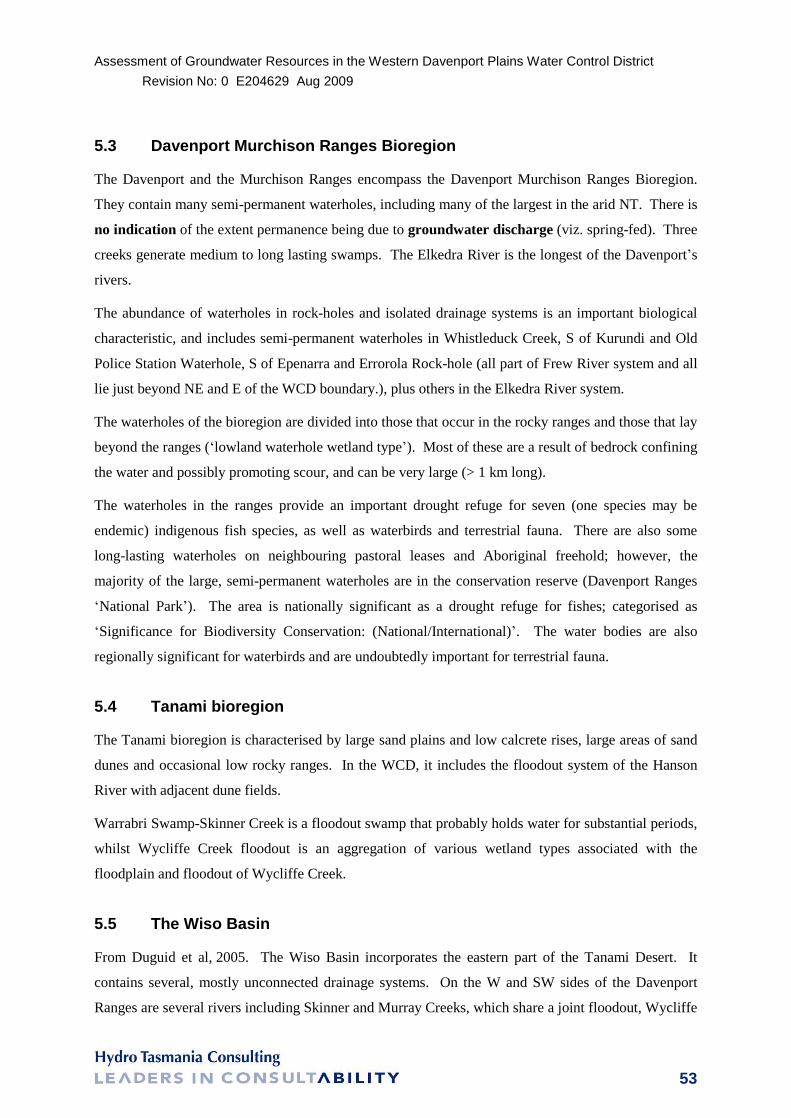
Assessment of Groundwater Resources in the Western Davenport Plains Water Control District
Revision No: 0 E204629 Aug 2009
53
5.3 Davenport Murchison Ranges Bioregion
The Davenport and the Murchison Ranges encompass the Davenport Murchison Ranges Bioregion.
They contain many semi-permanent waterholes, including many of the largest in the arid NT. There is
no indication of the extent permanence being due to groundwater discharge (viz. spring-fed). Three
creeks generate medium to long lasting swamps. The Elkedra River is the longest of the Davenport�s
rivers.
The abundance of waterholes in rock-holes and isolated drainage systems is an important biological
characteristic, and includes semi-permanent waterholes in Whistleduck Creek, S of Kurundi and Old
Police Station Waterhole, S of Epenarra and Errorola Rock-hole (all part of Frew River system and all
lie just beyond NE and E of the WCD boundary.), plus others in the Elkedra River system.
The waterholes of the bioregion are divided into those that occur in the rocky ranges and those that lay
beyond the ranges (�lowland waterhole wetland type�). Most of these are a result of bedrock confining
the water and possibly promoting scour, and can be very large (> 1 km long).
The waterholes in the ranges provide an important drought refuge for seven (one species may be
endemic) indigenous fish species, as well as waterbirds and terrestrial fauna. There are also some
long-lasting waterholes on neighbouring pastoral leases and Aboriginal freehold; however, the
majority of the large, semi-permanent waterholes are in the conservation reserve (Davenport Ranges
�National Park�). The area is nationally significant as a drought refuge for fishes; categorised as
�Significance for Biodiversity Conservation: (National/International)�. The water bodies are also
regionally significant for waterbirds and are undoubtedly important for terrestrial fauna.
5.4 Tanami bioregion
The Tanami bioregion is characterised by large sand plains and low calcrete rises, large areas of sand
dunes and occasional low rocky ranges. In the WCD, it includes the floodout system of the Hanson
River with adjacent dune fields.
Warrabri Swamp-Skinner Creek is a floodout swamp that probably holds water for substantial periods,
whilst Wycliffe Creek floodout is an aggregation of various wetland types associated with the
floodplain and floodout of Wycliffe Creek.
5.5 The Wiso Basin
From Duguid et al, 2005. The Wiso Basin incorporates the eastern part of the Tanami Desert. It
contains several, mostly unconnected drainage systems. On the W and SW sides of the Davenport
Ranges are several rivers including Skinner and Murray Creeks, which share a joint floodout, Wycliffe

Project title - Report name Revision No: 0 Document ID number Report date
54
Creek, Bonney Creek, McClaren Creek and Gilbert Creek. Inspection of satellite imagery indicates
that the floodouts of several of these creeks may be joined in large flood events. Skinner and Murray
Creeks probably join in typical floods. Skinner Creek then floods out towards Thring Swamp and
Wycliffe Creek. Bonney Creek is probably joined by Gilbert and McClaren Creek in large floods.
Taylor Creek rises in the hills around Barrow Creek Roadhouse and floods out to the N of the Osborne
Ranges. Satellite imagery and anecdotal evidence indicate that the floodwaters of the Taylor can reach
those of Wycliffe Creek.
The Hanson River rises in the Anmatjira Range to the SW of Ti-Tree Community, and flows N,
flooding out into the Tanami Desert. It has several large tributaries and is connected to Stirling swamp
(located within the Ti-Tree WCD). There are no natural permanent waterholes in this drainage system
and no documented major swamps in the terminal floodout, but two major swamps in the mid reaches;
a large complex of wetland types at Stirling Swamp, which is connected and adjacent to the river; and
a large gum-barked Coolabah swamp at Mud Hut Well on Bloodwood Creek. Surface water in this
floodout extends for over 1 km wide in places and many kilometres long. Several broader basins have
been identified from imagery, but neither their vegetation nor longevity has been investigated.
5.6 Possible Groundwater Dependent Ecosystems
Thring and Warrabri swamps may be locations of ecosystems associated with presumed
groundwater discharge zones (indicated by shallow SWLs).
These swamps are dominated by Eucalyptus victrix (gum-barked Coolabah). It is likely that
maintenance of the biomass an ecosystem is reliant on periodic flooding with surface water (rather
than groundwater discharge). However, large perennial plants and trees may tap groundwater and
therefore perhaps can be dependent on it.
5.6.1 Thring Swamp
Thring swamp located on the southern side of Wycliffe Creek is a tiered set of discontinuous clay
pans from E to W. In actuality it is more a drainage line than a swamp.
Adjacent to the salt pans within the swamp are small grassy plains with open to dense woodland
of mallee, acacia (including tall mulga) melaleuca sp. and other trees and shrubs.
NRETA (2007C) has undertaken preliminary, exploratory soil surveys over Thring swamp. There is
minimal salt on the surface of the soil (and none at Warrabri swamp). Surface pH is slightly alkaline
in sand increasing to very high levels in sand and clay by 0.7 m bgl in the unsaturated zone. The pH
of the soil then reduces to �normal� with depth above decomposed rock in the saturated zone.

Assessment of Groundwater Resources in the Western Davenport Plains Water Control District
Revision No: 0 E204629 Aug 2009
55
In the few investigation bores drilled below the swamp, groundwater salinity has improved with
depth.
Since 2004 there has been surface water in clay pans in Thring swamp. The water table is ~ 5 m bgl
(at January 2007 ?), though the potentiometric surface of the deep aquifers is ~ 2.5 m bgl, and there
was water lying on the surface of the clay pans at January 2007 ? (NRETA, 2007C).
5.6.2 Piggery Bore �swamp�
Piggery Bore swamp is situated near Alekarenge. This swamp appears to be more like a collapsed
doline NRETA (2007C). A creek flows into this swamp from the Murray Creek floodout to the SE;
when full the lake overflows to the NE into Warrabri swamp. There was water lying on the surface at
piggery at January 2007 ? (NRETA, 2007C).
5.7 Catchment Yield
The discussion below is summarised from NRETA (2007C).
Significant recharge to groundwater systems and growth of the floodout vegetation biomass is
dependent on major rainfall events resulting in major runoff and flooding. Historically these major
events have occurred about once every 30 - 35 years (based on interpretation of the long term rainfall
records at Barrow Creek and Tennant Creek).
There is no long term river gauging station providing scientific data on the runoff estimates of the hard
rock catchments.
To provide an estimate of the average annual runoff6 from the Davenport Catchment, a catchment
yield of 10 % was used to estimate the annual average yield of a 100 mm rainfall event by
Paul (2005). He estimated that with such an event, 3,530 ML of runoff would flow off the Davenport
Range portion of the Murray Creek catchment. This preliminary estimate is considered to be ultra
conservative, as the actual catchment yield is likely to be much greater than 10 %.
The average catchment yield currently used for catchments within the arid zone of the NT is 7 %. The
actual catchment yield is known to vary considerably between catchments and for each catchment
depending on catchment condition. The Todd River catchment up-gradient of Alice Springs has a
catchment yield varying between about 3 % and 21 % depending on catchment and antecedent
conditions.
6 Average annual catchment yield provides average 0estimates of volumes of annual stream flow. Actual annual runoff varies significantly and is dependent on rainfall intensity, areal extent of rain, duration of the rainfall and catchment antecedent conditions.

Project title - Report name Revision No: 0 Document ID number Report date
56
The catchment area of Murray Creek is 1,426 km2; comprising its floodout east of Alekarenge
(183 km2), and rocky range and hill country (1,100 km2). The catchment yield is probably closer to
two to three times, Paul�s calculation (NRETA, 2007C).
Using a catchment of 7 %, the volume of runoff generated by an extreme rainfall event, say, 300 mm,
is calculated to be some 55 GL from the western side of the Davenport Range.
Using a catchment of 7 %, the volume of runoff generated by an extreme rainfall event, say, 300 mm,
is calculated to be some 170 GL from the Osborne / Crawford / Watt / Forster Ranges, roughly
50 % draining onto the WDP via Taylor Creek, and 50 % draining to Stirling Swamp and possibly
into the Hanson River.

Assessment of Groundwater Resources in the Western Davenport Plains Water Control District
Revision No: 0 E204629 Aug 2009
57
6. Hydrogeology
6.1 Introduction
Regional investigations have not covered the whole WP uniformly, but have concentrated on areas
where there was believed to be moderate to high yields of good quality groundwater; i.e. TDS less
than 1,000 mg/L, or for Aboriginal town or outstation water supplies.
Currently there are groundwater data over a 40 year period at Alekarenge, intermittent data over the
40 years period in the Wycliffe Well region, intermittent data in a number of other locations but only
minimal data across much of the WDP Plains with large knowledge gaps of regional groundwater
level changes.
6.2 Aquifers
Six major aquifers and a range of limited, localised aquifers are considered by NRETA (2007C) to
underlie the WDP. They are summarised below as Table 6-1.
Table 6-1 Hydrostratigraphy
Aquifer Lithology Aquifer Type Yields Basin Comments
Cainozoic calcrete, sand & sandstones, silt & clay
Quaternary gravel
Primary porosity; some secondary porosity in calcretes, etc.
Semi-unconfined
< 96 m thick; wedge out along Plains / Ranges boundary.
9-30 L/s in chalcedony/silcrete; 2-5 L/s in calcrete, sand or gravel beds.
Shallow Tertiary basin across the WDP overlying the Cambrian & isolated outliers over granite and Hatches Ck. Gp.
Shallow phreatic to semi-unconfined aquifer.
Widespread & localised
Lake Surprise Sandstone
Well-sorted, fine-medium sandstone
Primary porosity.
Semi-confined?
Up to 20 L/s ? Wiso Occur W of Stuart Hwy. NW sector of The Plains � lack of hydrogeological study & drilling in region
Dulcie Sandstone
Sandstone well sorted fine-medium qtz arenite
Dual porosity 10 - 20 L/s ? Georgina Occurs just inside Plains southern groundwater catchment boundary in SE.
Tomahawk Beds Sandstone qtz arenite
Thin siltstone interbeds of micaceous slst, shale & minor dolostone
Fractured (?dual porosity)
5 L/s ? Georgina Limited to outside southern groundwater catchment boundary.
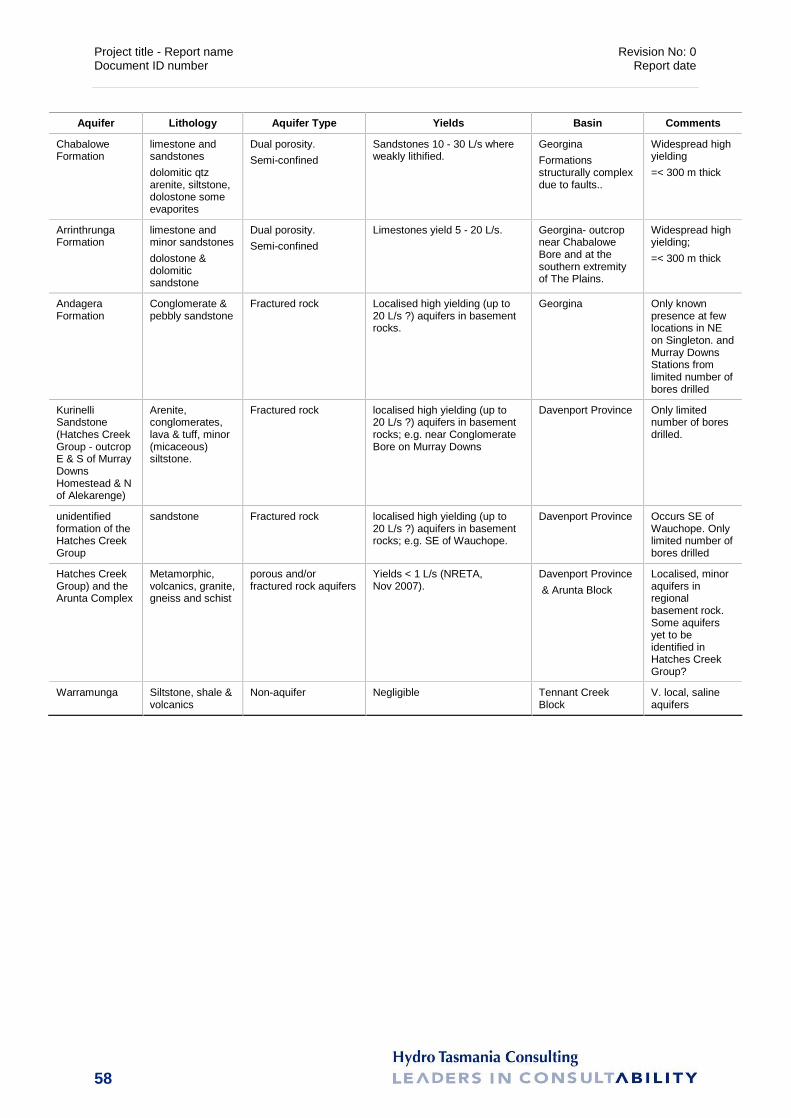
Project title - Report name Revision No: 0 Document ID number Report date
58
Aquifer Lithology Aquifer Type Yields Basin Comments
Chabalowe Formation
limestone and sandstones
dolomitic qtz arenite, siltstone, dolostone some evaporites
Dual porosity.
Semi-confined
Sandstones 10 - 30 L/s where weakly lithified.
Georgina
Formations structurally complex due to faults..
Widespread high yielding
=< 300 m thick
Arrinthrunga Formation
limestone and minor sandstones
dolostone & dolomitic sandstone
Dual porosity.
Semi-confined
Limestones yield 5 - 20 L/s. Georgina- outcrop near Chabalowe Bore and at the southern extremity of The Plains.
Widespread high yielding;
=< 300 m thick
Andagera Formation
Conglomerate & pebbly sandstone
Fractured rock Localised high yielding (up to 20 L/s ?) aquifers in basement rocks.
Georgina Only known presence at few locations in NE on Singleton. and Murray Downs Stations from limited number of bores drilled
Kurinelli Sandstone (Hatches Creek Group - outcrop E & S of Murray Downs Homestead & N of Alekarenge)
Arenite, conglomerates, lava & tuff, minor (micaceous) siltstone.
Fractured rock localised high yielding (up to 20 L/s ?) aquifers in basement rocks; e.g. near Conglomerate Bore on Murray Downs
Davenport Province Only limited number of bores drilled.
unidentified formation of the Hatches Creek Group
sandstone Fractured rock localised high yielding (up to 20 L/s ?) aquifers in basement rocks; e.g. SE of Wauchope.
Davenport Province Occurs SE of Wauchope. Only limited number of bores drilled
Hatches Creek Group) and the Arunta Complex
Metamorphic, volcanics, granite, gneiss and schist
porous and/or fractured rock aquifers
Yields < 1 L/s (NRETA, Nov 2007).
Davenport Province
& Arunta Block
Localised, minor aquifers in regional basement rock. Some aquifers yet to be identified in Hatches Creek Group?
Warramunga Siltstone, shale & volcanics
Non-aquifer Negligible Tennant Creek Block
V. local, saline aquifers

Assessment of Groundwater Resources in the Western Davenport Plains Water Control District
Revision No: 0 E204629 Aug 2009
59
6.3 Alluvial Aquifers
It appears that no investigation has taken place of alluvial aquifers within the WDP. Given the
extensive creek network, there is probably a large volume of water stored temporarily within these
sediments that either infiltrates into Cainozoic aquifers (or �bedrock� where creeks flow over the rocky
ranges) or is evapo-transpirated when held above clayey substrate and/or tapped directly by tree roots.
BMR (1980) notes that alluvium of the Hanson River floodout (situated in the eastern Lander River
map-sheet) yielded �seepages of water with low salt content�.
6.4 Cainozoic Aquifers
A large portion of the WDP is covered with Cainozoic sediments that contain aquifers including a
regional aquifer overlying the Wiso and Georgina Basins. There is also a veneer of Cainozoic
sediments covering the granite and Hatches Creek Group rocks, possibly including unmapped
palaeochannels.
The high yields from the Cainozoic are associated with calcrete and chalcedony deposits (vuggy
porosity).
Thicknesses vary from about 5 to 65 m with 1 to 40 m saturated thickness. The base of the Cainozoic
in the WDP proper has an almost ubiquitous sandy clay (rarely claystone) layer up to 25 m thick that
may retard the vertical recharge of water to the Cambrian formations. However, this may be expected
to provide delayed drainage upon regional pumping creating a driving head that may sustain
production from the Cambrian aquifers.
6.5 Cambrian Sedimentary Aquifers
The only bores drilled in the W are situated along the Hanson River (on eastern margin of Lander
River map-sheet in the Wiso Basin) as part of a 1979 BMR mapping investigation, (BMR, 1980).
Stratigraphic drill-holes, BMR Lander River 1 - 5 and Bonney Well 1 - 2 yielded flows of 0.8 �
1.6 L/s of �generally good quality stock water� in the Hanson River Beds. Three stratigraphic holes
(BMR Land River 1, 6 and 7) penetrated very porous Lake Surprise Sandstone, yielding 1.6 � 3.3 Ls
of �good quality stock water�.
Along with overlying Cainozoic sediments, the Georgina Basin Cambrian aquifers, namely the
Arrinthrunga and Chabalowe Formations constitute the regional aquifers of the WDP.
Sumner (2008) produced a handy summary of the stratigraphy reproduced as

Project title - Report name Revision No: 0 Document ID number Report date
60
Table 6-2.
Table 6-2
Regional interpretation of geological depths from bores drilled for Western Davenport Plains
Assessment and Alekarenge PMG Farm (reproduced from Sumner, 2008 [Table 2]).
Note: RN 18118 378.3 m AHD to TOC (Paul, 2005).
The top sandstone beds in the (Arrinthrunga?) sequence are found below limestone in some locations,
and are filled with calcite and are chemically altered so that groundwater occurs in fractures. The
underlying (Chabalowe?) beds have a calcite matrix with some interstitial porosity and fracture
porosity along bedding, and the deeper beds are non-calcareous and exhibit excellent primary porosity
and possibly secondary porosity (bedding planes) (G. Ride, pers. comm. via A. Pye). The
Arrinthrunga Formation is ubiquitous in the SE of the WDP-Central and WDP-SE WRAZs (refer
Section 7.2). It is generally harder and has more fracture (secondary) porosity than the Chabalowe.
Structurally, the formations appear to be block faulted (ibid.). The presence of faulting is likely to
complicate the hydrogeological interpretation. Recent test pumping undertaken at PMG Farms
block 1 indicates leakage from Cainozoic and possibly Cainozoic / Cambrian junction, but also the
presence of hydraulic barrier boundaries, often of a subtle nature (in one case obvious) that could
indicate intra-formational facies changes and/or faults. Paul (2005) in discussing rapid changes in
TDS (< 600 mg/L at RN18113 to ~ 1000 mg/L at Alekarenge in 1 km to W) suggested that these bores
are situated in separate, poorly connected groundwater systems.
From a regional perspective, the current interpretation is that the Wiso and Georgina Basins� aquifers
are interconnected based on the current potentiometric surface drawn from both levelled standing
water levels and AHD estimated water levels.
SWL is deeper in some locations in the SE sector and generally shallower in the NW sector of the
main aquifer zone.

Assessment of Groundwater Resources in the Western Davenport Plains Water Control District
Revision No: 0 E204629 Aug 2009
61
6.6 Groundwater Quality
The TDS map (NRETA, 2007C) provides one composite interpretation of salinity from water samples
from different aquifers from bores at different periods in the natural recharge / discharge cycle.
Salinity varies with depth, distance from recharge zones, permeability of the aquifer, aquifer type and
in some locations phase when sampled and age of the groundwater. The lack of an even spread of
sampling points affects the accuracy of the map particularly in areas where there are few bores.
To enable groundwater storage estimates to be calculated for the WRAZs a 1:250,000 scale
groundwater salinity zone map was produced by NRETA (2007C). Salinity zones were demarcated
for ranges < 1,000 mg/L, 1,000 to 1,500 mg/L, 1,500 to 2,000 mg/L and > 2,000 mg/L TDS.
The direction of groundwater flow shows salinity improves down-gradient within the �Spinifex
assessment zone� (includes Centrefarm�s commercial block on the Warrabri ALT; located in lower
salinity groundwater within this WRAZ).
Generally, there is an increase in salinity down-gradient. Paul�s (2005) Durov diagrams confirm this
trend (decrease in bicarbonate and increase in chloride). Paul interpreted a trend line from some bores
as the mixing of two different groundwaters, one reflecting recharge and the other water that has been
in the system for a long time.
Anomalously, localised TDS highs occur; e.g. at bore RN 14355 near Chabalowe stock bore on
Murray Downs, and RN 2047 adjacent to Thring Swamp on Singleton Station. The data E of
Bluebush Bore RN 1259 is also anomalous in that there is conflicting interpretations of samples from a
series of bores. This may be due to samples taken from different aquifers at different periods of the
natural recharge/ discharge phase.
Nitrate higher values near the groundwater catchment divide to the SE, near the Murray Downs /
Alyawarra ALT boundary reducing to the NW to Thring Swamp. There are a few locations where
there are localised higher values along this gradient e.g. E of Bottom Bore on Murray Downs. There
are locations with high yielding aquifers with low nitrate e.g. Conglomerate Bore area on Murray
Downs.
Fluoride exhibits moderate to high concentrations in the Alekarenge region, reasonably high in the
Thring Swamp and Wycliffe Well area then reduces to the NW. Very high values were present at
depth in RN 18111 (6.2 mg/L from 120 mbgl), 5 km west of Alekarenge but reduced significantly to
low values measured from investigation bores at the Warrabri Centrefarm block 1 (RN 18117
< 1.5 mg/L).

Project title - Report name Revision No: 0 Document ID number Report date
62
Uranium is elevated in an area of 20 km by 40 km N - S in the Alekarenge area extending just S of
Nelsons Bore on Murray Downs with a concentration =< 10 ug/L7. Surface uranium levels shown on
airborne radiometric maps indicate that these relative low, uranium levels are probably quite extensive
across the WDP particularly in association with calcretes and adjacent source basement rock (see
Figure B-4).
6.6.1 Aquifer Storage
NRETA (2007A) estimated groundwater storage volume E of the Stuart Highway as 37,500 GL based
on an aquifer area of 5,000 km2 (assumed that only 10 % of this volume was groundwater with a TDS
< 1,000 mg/L). This assessment was refined using the same aquifer hydraulic parameters but adjusted
to reflect TDS map and simplified hydrogeological sections (NRETA, 2007C). The area of the four
main WRAZs E of the Stuart Highway (Spinifex, Conglomerate, Shirley and Chabalowe) is estimated
at 3,127 km2. The estimated total groundwater storage is 28,200 GL; nearly 12,000 GL of
< 1,000 mg/L TDS and 21,000 GL < 1,500 mg/L TDS.
6.6.2 Aquifer Throughflow
NRETA (2007A) estimated throughflow in a (Cainozoic aquifer) section through Blue Bush Bore
(RN 1259) as 7,300 - 36,500 ML/a; based on an estimated aquifer transmissivity, 1,000 - 5,000 m2/d
and a hydraulic gradient of 0.0005 (1:2,000).
The NTGS stratigraphic holes (Section 3.4) indicate a 25 km wide, wedge-shaped cross-section to the
aquifer in the central sector of the WDP with Chabalowe wedging out towards the E and, whereas the
southern sector has a greater width of aquifer (~ 60 km) with a more complete and thicker sequence
of Cambrian. Hence throughflow is �funnelled� through the section Alekarenge to Wycliffe well as
reflected by greater hydraulic gradients than to the S of Alekarenge (see Dwg NRASP264, etc.
NRETA,2007C)
Using a gradient of 0.001, T = 1,000 m2/d and W = 25 km give a throughflow of 9 GL/a. Using a
more conservative gradient of 0.005, T = 80 m2/d (cf Arrinthrunga) and W = 25 km gives a
throughflow of 3.6 GL/a
There are likely to be significant changes to the gradient in various locations during the different
recharge / discharge phases. In some locations such as SE of Bluebush Bore gradients will be reversed
for a period following major recharge events (NRETA, 2007C).
7 This map is somewhat misleading in that it reflects analyses from only a few bores which are concentrated mainly in the immediate vicinity of Alekarenge (NRETA, 2007C).

Assessment of Groundwater Resources in the Western Davenport Plains Water Control District
Revision No: 0 E204629 Aug 2009
63
6.6.3 Recharge
Hydrochemistry, the potentiometric surface and SWL measurements at different times indicate that
there are significant recharge zones across the WDP (NRETA, 2007C).
Appendix C presents an exercise that attempts to classify hydrochemical signatures into zones of like
groundwater chemistry. The class scatter plots indicate prominent recharge source is water flowing
off the Davenport Range, centred especially on Wycliffe and Skinner Creeks where they disgorge
from the foothills. Poorer water quality is associated with the granites of the Forster Range. There is
complex mixing within the Plains proper caused by a �belt� of poorer quality water that appears to be
associated with Taylor�s Fault that results in a �plume of brackish groundwater (on Neutral Junction
PL, mapped E of the Stuart Highway). Groundwater salinity increase uniformly down-gradient to the
N and NE, N of Wauchope.
The water chemistry time series plots C-8 to C-11 of Appendix C indicate historical recharge pulses
associated with the 1973/4 floods and lesser rainfall events of 1968 and 1991. Paul (2005) documents
hydrographs that show the impact of the 2000/1 rainfall event, too on SWLs
Between November 1975 and June 1978 the net regional water level rise was 5 m. Based on a Sy of
5 - 7 %, recharge during this period equated to 250 - 350 mm (Paul, 2002).
NRETA (2007A) estimated annual recharge for the area E of the Stuart Highway in the order of 25 -
60 GL; based on an area of 5,000 km2.
Using the area covered by the four WRAZs E of the Stuart Highway (Spinifex, Conglomerate, Shirley
and Chabalowe) of 3,127 km2 the recharge estimates are 16 - 38 GL/a, or about 18 - 40 GL/a when the
Turkey and part of the Braitling WRAZs are included.
The runoff yield calculated for this study took 5 mm effective rainfall (i.e. infiltrating) over the
Davenport Range catchment area of some 2,500 km2 (draining S onto the WDP) was 12.74 GL
available for recharge.
The runoff yield calculated for this study took 2 mm effective rainfall (i.e. infiltrating) over the
Osborne / Crawford / Watt / Forster Ranges catchment area of some 1,300 km2 (draining W to Stirling
Swamp and an equal area draining W onto the WDP) was a total of 8.5 GL available for recharge.
6.6.4 Discharge
NRETA (2007C) states that groundwater discharge zones are likely to be present in many areas where
the water table is shallow (cf Thring Swamp). Others occur in the Wycliffe Well area and other areas

Project title - Report name Revision No: 0 Document ID number Report date
64
to the NW. NRETA (2007C) concludes that there is insufficient data to draw definitive volume
discharged by evapotranspiration but as identified by NRETA (2007A), it is probably in the order of
1 mm/day.
6.6.5 Other Aquifers
There are aquifer systems of limited areal extent outside the major aquifer zone of the WDP e.g.
significant aquifers at Murray Downs Homestead and Imangara Aboriginal Outstation, and localised,
useful aquifers at Wauchope. It is also likely there are aquifers with useful yields and with good to
fair salinity groundwater within the adjacent Davenport Range and possibly in the Mungkarta ALT, E
and N of Wauchope.
Other, yet to be identified, significant aquifers may occur in the Hatches Creek Group underlying the
WDP e.g. at Conglomerate Bore, Paul (2002) tentatively identified Kurinelli Sandstone underlying
Cainozoic sediments.
Figure 6-1 provides a very simple section taken across the WDP from SW to NE. No attempt has been
made to differentiate the various Cambrian sedimentary rocks into their component formations.
Figure 6-2 provides a schematic block diagram based on this section. This illustration could be used
as a basis of presenting a simple water balance once more study is done (see Section 9).

Assessment of Groundwater Resources in the Western Davenport Plains Water Control District Revision No: 0 E204629 Aug 2009
65
Figure 6-1 Schematic Hydrogeological Section across WDP

Assessment of Groundwater Resources in the Western Davenport Plains Water Control District
Revision No: 0 E204629 Aug 2009
67
7. Water Resource Assessment Zones
7.1 NRETA�s (2007C) WRAZs
To assist assessment of the water resources and future water resource planning and development of the
WDP, nine WRAZs were identified by NRETA (2007C). The boundaries of these zones were said to
have been determined from �geological, hydrogeological and hydrological boundaries and/or system
boundaries�.
The estimated volume of groundwater in storage and its chemical quality were calculated for each
zone. The regional throughflow was not calculated for each WRAZ. Initial cross sections were
produced to perform storage calculations.
A summary description of the WRAZs is presented in Table 7-1.
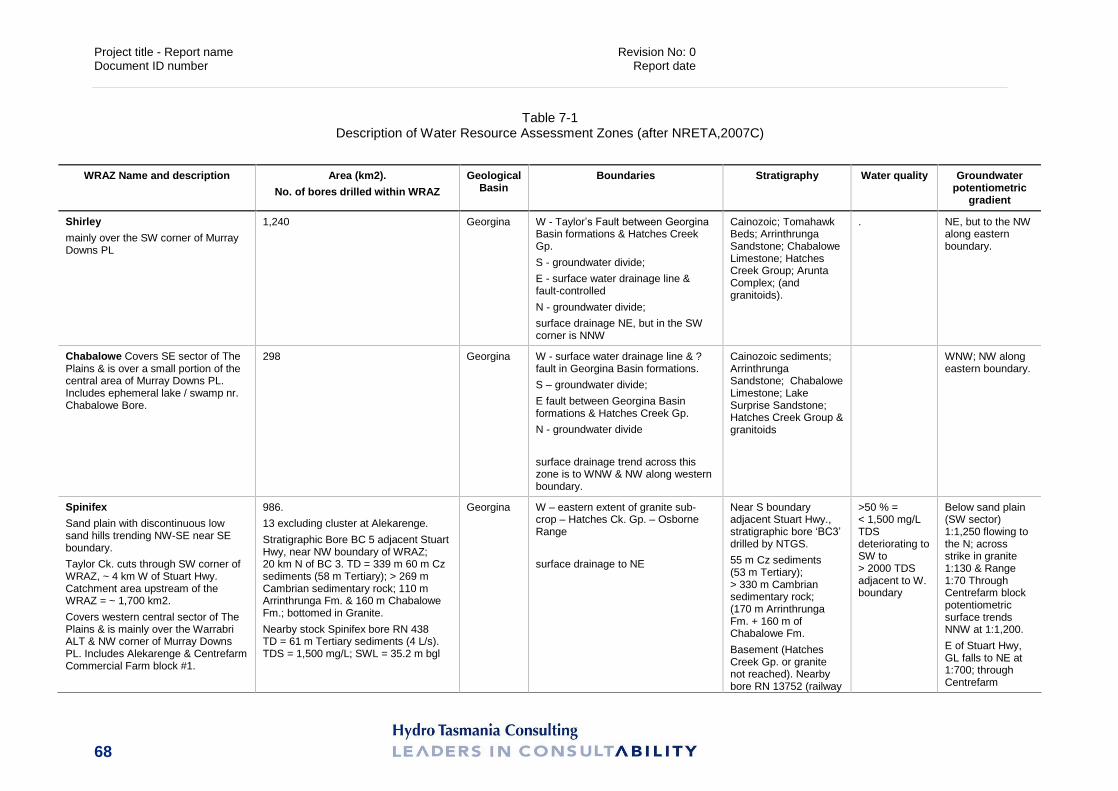
Project title - Report name Revision No: 0 Document ID number Report date
68
Table 7-1 Description of Water Resource Assessment Zones (after NRETA,2007C)
WRAZ Name and description Area (km2).
No. of bores drilled within WRAZ
Geological Basin
Boundaries Stratigraphy Water quality Groundwater potentiometric
gradient
Shirley
mainly over the SW corner of Murray Downs PL
1,240 Georgina W - Taylor�s Fault between Georgina
Basin formations & Hatches Creek Gp.
S - groundwater divide;
E - surface water drainage line & fault-controlled
N - groundwater divide;
surface drainage NE, but in the SW corner is NNW
Cainozoic; Tomahawk Beds; Arrinthrunga Sandstone; Chabalowe Limestone; Hatches Creek Group; Arunta Complex; (and granitoids).
. NE, but to the NW along eastern boundary.
Chabalowe Covers SE sector of The Plains & is over a small portion of the central area of Murray Downs PL. Includes ephemeral lake / swamp nr. Chabalowe Bore.
298 Georgina W - surface water drainage line & ? fault in Georgina Basin formations.
S � groundwater divide;
E fault between Georgina Basin formations & Hatches Creek Gp.
N - groundwater divide
surface drainage trend across this zone is to WNW & NW along western boundary.
Cainozoic sediments; Arrinthrunga Sandstone; Chabalowe Limestone; Lake Surprise Sandstone; Hatches Creek Group & granitoids
WNW; NW along eastern boundary.
Spinifex
Sand plain with discontinuous low sand hills trending NW-SE near SE boundary.
Taylor Ck. cuts through SW corner of WRAZ, ~ 4 km W of Stuart Hwy. Catchment area upstream of the WRAZ = ~ 1,700 km2.
Covers western central sector of The Plains & is mainly over the Warrabri ALT & NW corner of Murray Downs PL. Includes Alekarenge & Centrefarm Commercial Farm block #1.
986.
13 excluding cluster at Alekarenge.
Stratigraphic Bore BC 5 adjacent Stuart Hwy, near NW boundary of WRAZ; 20 km N of BC 3. TD = 339 m 60 m Cz sediments (58 m Tertiary); > 269 m Cambrian sedimentary rock; 110 m Arrinthrunga Fm. & 160 m Chabalowe Fm.; bottomed in Granite.
Nearby stock Spinifex bore RN 438 TD = 61 m Tertiary sediments (4 L/s). TDS = 1,500 mg/L; SWL = 35.2 m bgl
Georgina W � eastern extent of granite sub-crop � Hatches Ck. Gp. � Osborne Range
surface drainage to NE
Near S boundary adjacent Stuart Hwy., stratigraphic bore �BC3�
drilled by NTGS.
55 m Cz sediments (53 m Tertiary); > 330 m Cambrian sedimentary rock; (170 m Arrinthrunga Fm. + 160 m of Chabalowe Fm.
Basement (Hatches Creek Gp. or granite not reached). Nearby bore RN 13752 (railway
>50 % = < 1,500 mg/L TDS deteriorating to SW to > 2000 TDS adjacent to W. boundary
Below sand plain (SW sector) 1:1,250 flowing to the N; across strike in granite 1:130 & Range 1:70 Through Centrefarm block potentiometric surface trends NNW at 1:1,200.
E of Stuart Hwy, GL falls to NE at 1:700; through Centrefarm

Assessment of Groundwater Resources in the Western Davenport Plains Water Control District Revision No: 0 E204629 Aug 2009
69
construction); TD of 101 m encountered low yielding Tertiary aquifers (0.5 L/s); Arinthrunga Fm. (fractured siltstone sandstone 3 L/s. 1,990 mg/L TDS; SWL = 35.2 m bgl
Block 1 trends NNE at 1:600 with same gradient at Stuart Hwy. trending N
Conglomerate Over NW corner of Murray Downs PL & portions of Warrabri ALT & Singleton PL. incls. E boundary of Alekarenge.
601 W - surface water drainage line & fault within Georgina Basin
S - ground water divide
E - hydrogeological boundary between high yielding Adagera Fm. aquifers to W & Hatches Creek Gp. to E.
N - extension of N boundary of Spinifex zone to NE & matches surface water catchment
Surface drainage is to WSW & NW along western boundary.
Cainozoic; Arrinthrunga Sandstone; Chabalowe Limestone; Hatches Creek Gp.
E & SE to NW along eastern boundary
Ghost Gum
Covers western central sector of Plains; over a portion of Singleton & Neutral Jcn. PLs.
1,001 Georgina / Wiso
W - fault (Taylor�s fault);
S - partly located on basis of flow-net & partly on characteristics of surface water catchment.
E - surface water drainage line & ? fault within Georgina / Wiso Basin;
N - ground water divide
Surface drainage trend to N.
Cainozoic; Arrinthrunga Sandstone; Chabalowe Limestone, Hatches Creek Gp. / Arunta Complex (and granitoids)
NNE, with one area to S in a SE.
Young-Husband
covers NW sector of Plains over the western portion of Singleton PL & areas within Karlantijpa S & Mungkarta ALTs.
1,859 SW - partly based on boundary between Wiso Basin & Hatches Creek Gp.;
SE - groundwater divide;
NE - fault between Wiso Basin & Hatches Creek Gp. which forms Young Husband Range;
N - surface water catchments.
Hansen River Beds, Lake Surprise sandstone; Hatches Creek Group (or granitoids).
N.
Surface drainage trend to N.

Project title - Report name Revision No: 0 Document ID number Report date
70
7.2 Revised WRAZs and Groundwater Storage Volumes
NRETA�s (2007C) WRAZs have been examined and simplified; bearing in mind that these original
WRAZs did not cover the whole WCD.
This revision is described in Table 7-2 including reasoning behind selection of the boundaries.
Figure 7-1 maps the revised WRAZs.
Table 7-3 summarises groundwater storages for each WRAZ.
Figure C-7 presents a hydrochemical facies map. The boundaries interpreted as (subtle) changes in
groundwater chemistry are broadly similar to those determined by interpretation of the physical
hydrogeology.
Key information is:
Groundwater storage available from Cainozoic aquifers underlying the plains proper is in the
order of 12,800 GL
Groundwater storage available from Cambrian aquifers underlying the plains proper is in the
order of 16,000 GL
Total groundwater storage available from the aquifers underlying the plains proper is in the
order of 28,800 GL
Total groundwater storage available from the above aquifers having TDS concentrations less
than 1,000 mg/L (i.e. suitable for long term irrigation) underlying the plains proper is in the
order of 8,600 GL;
Total groundwater storage available from local-scale, fractured aquifers underlying the
Davenport Range is in the order of 70 GL;
Total groundwater storage available from local-scale, fractured aquifers underlying the
Osborne / Crawford / Watt / Forster Ranges is in the order of 150 GL;
These are the amounts that, effectively, are considered to be the best available estimates based on
present understanding of the aquifer systems available for allocation.
They are conservative estimates (for instance only 20 % of the thickness of the Cambrian formations
has been considered to be saturated (i.e. allowance has been made for discrete aquifer horizons
associated with fracture conditions; e.g. bedding plan fractures and dissolution (�micro-karst�)

Assessment of Groundwater Resources in the Western Davenport Plains Water Control District
Revision No: 0 E204629 Aug 2009
71
features, particularly in the Arrinthrunga Formation. Further, the Cainozoic saturated thicknesses used
are extremely conservative). Lastly, only 10 % the thickness of the fractured sedimentary rocks and
granites of the Davenport and Osborne and other ranges has been considered to be saturated (i.e.
allowance has been made for discrete aquifer horizons associated with fracture conditions and
weathered surfaces (�palaeosols�). Furthermore, conservative specific storage values have been used.

Project title - Report name Revision No: 0 Document ID number Report date
72
Table 7-2 Revised Description of Water Resource Assessment Zones
WRAZ Name and description Area (km2)
No. of bores drilled within WRAZ (with some useful data)
Geological Basin
Boundaries Stratigraphy Water quality Groundwater potentiometric gradient
Davenport Range
Occupies the Davenport Range. Occupies much of the Mungkarta & Erlterlapentye ALTs.
5,096
60
Davenport Geosyncline
S - Boundary between Davenport Province to N & Georgina Basin
TMI map (Fig B-2) shows Hatches Ck Gp.
Hatches Creek Gp. & Warramunga Gp. in far N
Regionally poor. Pods of good quality
Groundwater catchment divide along top of Davenport Range. SW, S of Range, & NE N of Range.
Western Davenport Plains � NW Covers NW sector of Plains over the western portion of Singleton PL & areas within Karlantijpa S & Mungkarta ALTs.
4,092
3
Wiso SW - based on boundary between Wiso Basin & Hatches Creek Gp.;
SE - groundwater divide;
NE - fault between Wiso Basin & Hatches Creek Gp. which forms Young Husband Range.
DEM (Fig B-1) indicates low elevation. Gravity map (Fig B-3) g low � indicates thick Wiso sediments.
Cainozoic sediments; Lake Surprise Sandstone; Arrinthrunga Sandstone; Chabalowe Limestone; Hatches Creek Group & granitoids
Good; poor N of Wauchope
N & NW
Western Davenport Plains - Central Covers central sector of Plains; over a portion of Singleton, Neutral Jcn. & Murray Downs PLs & all of Warrabri ALT; includes Alekarenge & Centrefarm Commercial Farm block #1.
4,278
109
Georgina / Wiso
W - fault (Taylor�s fault);
SE � groundwater catchment divide
N & NE - Boundary between Davenport Province to N & Georgina Basin to S.
Fig B-3 g intermediate � indicates Georgina sediments.
Cainozoic; Arrinthrunga Sandstone; Chabalowe Limestone.
Good; poor in SW pod associated with granite (fault)
NW & N.
Western Davenport Plains � SE 2,613
4
Georgina N � groundwater catchment divide.
W � Spring Range fault + change in water chemistry
Fig B-3 g intermediate � indicates Georgina sediments.
Thin Cainozoic; Duclie Sandstone, (Tomahawk Beds � Arrinthrunga Sdst.; Chabalowe Limestone.
Good? � extent unknown
NE to E
Osborne / Crawford / Watt / Forster Ranges
Occupies S part of Murray Dns PL & NW part of Alyawarra ALT. Peneplain country.
8,499
117
Georgina / Arunta Block
E � Taylor Fault
N � Hatches Ck. /granite sub-crop with Georgina
TMI map (Figure B-2) shows Hatches Ck Gp. Gravity map (Fig B-3 g high � indicates Arunta rocks. Fig B 4 � high radiometric count
Andagera Fm incl. Central Mt Stuart & Octy Fms., granites, granites, schists
Poor. Pods of good quality
Stuart Hwy. follows groundwater divide. W to W of Hwy. & E to E. of Hwy.


Project title - Report name Revision No: 0 Document ID number Report date
74
Table 7-3 Calculation of order of magnitude Storage Volumes of Groundwater available for Allocation
WRAZ Area Sub-area SWL (m2) (m2) (m bgl)
Cz Camb Cz Camb Cz Camb Cz Camb Cz Camb Total Cz Camb TotalWestern Davenport Plains - NW 4,092,450,725 5 12 200 7 40 28,647,155,077 163,698,029,013 0.07 0.03 2,005 4,911 6,916 602 1473
Western Davenport Plains - Central 4,278,047,584 15 45 250 30 50 128,341,427,507 213,902,379,178 0.07 0.03 8,984 6,417 15,401 2695 1925Western Davenport Plains - SE 2,613,018,041 15 25 300 10 60 26,130,180,409 156,781,082,456 0.07 0.03 1,829 4,703 6,533 549 1411
10,983,516,350 12,818 16,031 28,850 3,845 4,809 8,655
Sdst Sdst SdstDavenport Range 5,096,462,469 26 54 2.8 14,270,094,914 0.005 71
Sdst Sdst SdstOsborne / Crawford /Watt / Forster Ranges 8,498,567,258 4,249,283,628.80 20 54 3.4 28,895,128,676 0.005 144
granite granite granite8,498,567,258 4,249,283,628.80 25 28 0.3 2,549,570,177 0.001 3
147
storage (GL)TDS <1000 mg/L(m) (GL)(kL)
groundwater storageav strata thickness av aquifer thickness saturated volume specific yield

Assessment of Groundwater Resources in the Western Davenport Plains Water Control District
Revision No: 0 E204629 Aug 2009
75
8. Conclusions
8.1 Current and future Water Use
The annual extraction from the aquifers is estimated to be less than 200 ML/a;
At PMG Farm the projected irrigation water demand indicated that some 190 GL of
groundwater would be extracted over some 45 years (AGT,2007B);
8.2 Aquifer Recharge
Annual recharge of 5 - 12 ML/km2 equates to 25 - 60 GL for an area (~ 5000 km2) of the
aquifer E of Stuart Highway underlying Warrabri, Singleton and Murray Downs
(NRETA, 2007A);
In 1990 annual recharge was estimated to be 6 - 40 GL for �Area 1� (Carosone, 1990);
Annual recharge estimate = 10 - 50 GL/a for aquifer system in Murray Downs/Alekarenge/
Singleton area (NRETA, 2007A);
This study assumed an effective rainfall of 5 mm from the Davenport Range and 2 mm the
Osborne, etc. ranges that could potentially recharge aquifers giving:
o 12.7 GL from the Davenport Range sub-catchment area (~ 2,500 km2);
o 8.5 GL from the Osborne / Crawford / Watt / Forster Ranges catchment areas
(~ 1,300 km2)
o Some 34 GL would also directly recharge (using 2 mm effective rainfall) the aquifers
giving;
o a cumulative recharge of some 55 GL.
8.3 Aquifer Throughflow
At Bluebush Bore aquifer section throughflow was calculated to be 7.3 to 36.5 GL/a
(NRETA, 2007A);
This study, [using a gradient of 0.005 - 0.001, an aquifer width of 25 km (along Murray Downs
homestead access road), and transmissivity of 80 -1,000 m2/d] gives:
o throughflow of 3.6 - 9 GL/a;

Project title - Report name Revision No: 0 Document ID number Report date
76
There are likely to be significant changes to the gradient in various locations during the different
recharge / discharge phases. In some locations such as SE of Bluebush Bore gradients will be
reversed for a period following major recharge events (NRETA, 2007C).
8.4 Aquifer Storage
Approximate volume in storage = 37,500 GL (NRETA, 2007A);
~ 10 % of storage, say, 4,000 GL appears to contain water with < 1,000 mg/L TDS
(NRETA, 2007A);
~ 1,500 - 5,000 GL with < 1,000 mg/L TDS (Area 1); Carosone (1990);
Volume of good quality water in Murray Downs/Alekarenge/ Singleton area order of 2,000 -
4,000 GL (NRETA, 2007A);
NRETA, (2007C) estimated total groundwater storage as 28,200 GL; nearly 12,000 GL of
< 1,000 mg/L TDS and 21,000 GL < 1,500 mg/L TDS;
This study estimates groundwater storage as follows:
o Groundwater storage available from Cainozoic aquifers underlying the plains proper is in
the order of 12,800 GL
o Groundwater storage available from Cambrian aquifers underlying the plains proper is in
the order of 16,000 GL
o Total groundwater storage available from the aquifers underlying the Plains proper is in
the order of 28,800 GL
o Total groundwater storage available from the above aquifers having TDS concentrations
less than 1,000 mg/L (i.e. suitable for long term irrigation) underlying the Plains proper
is in the order of 8,600 GL;
o Total groundwater storage available from local-scale, fractured aquifers underlying the
Davenport Range is in the order of 70 GL;
o Total groundwater storage available from local-scale, fractured aquifers underlying the
Osborne / Crawford / Watt / Forster Ranges is in the order of 150 GL;
8.5 Surface Water Yields
The main surface water catchment within the WCD occupies some 14,850 km2;

Assessment of Groundwater Resources in the Western Davenport Plains Water Control District
Revision No: 0 E204629 Aug 2009
77
Paul (2005) used a catchment yield of 10 % to estimate the annual average yield of a 100 mm
rainfall giving 3.5 GL of runoff from the Davenport Range portion of the Murray Creek
catchment.
This study, using a runoff coefficient of 0.07, the volume of runoff generated by an extreme rainfall
event, say, 300 mm, would be some:
55 GL from the western side of the Davenport Range;
170 GL from the Osborne / Crawford / Watt / Forster Ranges, roughly 50 % draining onto
the WDP via Taylor Creek, and 50 % draining to Stirling Swamp and possibly into the
Hanson River.
8.6 Water Dependent Ecosystems
The Davenport Murchison Ranges Bioregion encompasses the Davenport Range that contains
many semi-permanent waterholes, including many of the largest in the arid NT. There is no
indication of the permanence being due to groundwater discharge (including being spring-
fed);
Thring and Warrabri swamps may be locations of ecosystems associated with presumed
groundwater discharge zones (indicated by shallow SWLs). Other �swamps� occur in the
Wycliffe Well area and other areas to the NW;
The ecosystem of these swamps is probably reliant on periodic flooding with surface water
(rather than groundwater discharge). However, large perennial plants and trees may tap
groundwater and therefore perhaps can be dependent on it;
Significant recharge to groundwater systems and growth of the floodout vegetation is dependent
on major rainfall events resulting in major runoff and flooding. Historically these major
rainfall events have occurred about once every 30 - 35 years;
Evapotranspiration, as identified by NRETA (2007A), is probably in the order of 1 mm/day
from these swamps;
In modelling the proposed PMG farm borefield, AGT (2007B) concluded:
o under the pumping regime envisaged (2008 - 2010) an average, instantaneous production
of 80.5 L/s increasing to 145 L/s post-2011 (with various bore Nos. / configurations), the
pumping cone of influence to the 5 m drawdown contour is 2.3 km;
o radius of influence is predicted to extend to a radius of ~ 7.5 km after 43 years of
production;

Project title - Report name Revision No: 0 Document ID number Report date
78
o drawdown is restricted to ~ 0.5 m in Cainozoic aquifer at Alekarenge (closest third-
party water supply) after 43 years of production;
o all other users, chiefly Murray Downs and Singleton Stations and Wycliffe Roadhouse,
are situated far beyond the radius of influence;
o possible GDEs; chiefly Thring Swamp and Wycliffe Creek, are situated well beyond
the radius of influence;
o Piggery Bore Swamp lies ~ 800 m E of the modelled zero drawdown contour and, on
this basis, will be unaffected, too;
o The downstream outlet of Warrabri Swamp (at bore, RN 2881) lies at about the 2 m
drawdown contour;

Assessment of Groundwater Resources in the Western Davenport Plains Water Control District
Revision No: 0 E204629 July 2009
79
9. Recommendations
9.1 Water Balance
A conceptual hydrogeological model needs to be formulated for the WDP that is represented
visually as a block diagram(s) with associated sections;
A formal water balance for the WDP needs to be prepared;
The North Australian Sustainable Yields project (CSIRO, 2009 - current) will examine a range
of different climate and development scenarios for the NT. Its data and models generated could
be used in the water balance to run scenarios (e.g. more intense but less frequent rainfall events)
for water planning;
Numerical modelling should be undertaken following extraction of 4-5 GL/a (per
NRTA, 2007A recommendation) from PMG Farm with input from monitoring data on SWLs
and groundwater chemical quality changes. This model could assist in refining aquifer storage
estimates and identify any impact on any �groundwater dependent ecosystems�.
9.2 Groundwater Monitoring
The existing groundwater monitoring bore network is clustered geographically into six
monitoring areas (Ali-Curung-Warrabri / Warrabri / Murray Downs / Neutral Junction /
Singleton Station / �Railway Corridor�). (Also, it is somewhat unclear what aquifers are being
monitored by these bores; most monitor Cainozoic aquifers - author). An evenly spread bore
monitoring (including water quality) network with properly constructed bores, particularly
targeting the Cambrian aquifers needs to be set-up;
SWLs in Wycliffe Swamp and in underlying aquifers need to be monitored in a specially
constructed monitoring bore (piezometer).
9.3 Aquifer Yields
The majority of bores have only been air-lifted at completion of drilling. Such air-lift yields
tend to underestimate the yield of the aquifer and are of little use in determining aquifer
sustainable yields (and wellfield yields or capacity). Only a limited number of high yielding
production bores have been drilled and test-pumped for short durations. Therefore, investment
needs to be made in undertaking long-duration (24-48 hours), large discharge test-pumping with

Project title - Report name Revision No: 0 Document ID number Report date
80
associated observation bores. (Also a separate database is needed by NRETAS to make access
to this data easier - author);
9.4 Aquifer Correlation
Per NRETA (2008A), (to correlate the aquifers to assist with the development of the conceptual
model) it is recommended to:
o review all geophysical bore logs for the Plains; especially the gamma data;
o log calliper, temperature/fluid conductivity and gamma as a minimum standard in all
future bores drilled;
o survey AHDs of all geologically significant bores in the Plains, and compile sections to
compare SWLs, gamma and geological logs;
o contact NTGS and Geoscience Australia to access any further basement modelling
results;
o inspect �Ozseebase� Proterozoic and Palaeozoic datasets for basement interpretation
o (Also a separate geophysical logging database is needed by NRETAS to make access to
this data easier - author).
9.5 Surface Water Yields
A relationship between rainfall and runoff for the Davenport Range need to be established by:
o constructing gauging stations (or as a minimum perform cross- and longitudinal surveys)
on Wycliffe, Taylor and Skinner creeks to monitor flood flows and baseflow recession;
o rating a gauging station, G0290003, operated near Epenarra homestead on the Frew River
from 1975 to 1987. [This station was never rated (Paul, 2005)];

Project title -Report name Revision No: 0 Document ID number Report date
Addendum RECHARGE AND CLIMATE CHANGE All scenarios take the 50 percentile level of prediction for ‘medium’ scenario emissions to years, 2030 and 2050 (using year, 1990 as baseline). Season Year Rainfall change
(%) Temperature change (0C)
Potential Evapotranspiration
change (%) summer 2030 0 + 1.0 - 1.5 2 to 4
2050 0 + 1.5 - 2.0 2 to 4 possibly up to ~ 6 in N sector
winter 2030 - 5 to - 10 + 1.0 - 1.5 2 to 4 2050 - 10 to - 20 + 1.5 - 2.0 2 to 4
The rainfall change is considered to be insignificant as most recharge events come from summer storms. Further, it is predicted that whilst rainfall frequency may decrease (i.e. longer dry spells), rainfall events may increase in their intensity. (This increase in intensity is likely to occur more in northern Australia than in southern Australia). Given that recharge to groundwater over the WDP is said to occur from extreme events over very infrequent (decadal) intervals, then the volume of rainfall-runoff available for recharge (from such events) may actually increase. However, on the debit side of the water balance, from increase in temperature (and solar radiation and relative humidity), there is the probability of greater evapotranspiration. Given the increased (but possibly less frequent) runoff events, if water is ponded before infiltration (that seems the case in many of the run-on area of the Plains [where anecdotal reports speak of ponding of huge volumes (and depths of water)] then more water may be lost through evapotranspiration before it can infiltrate to recharge groundwater. Reference: http://www.climatechangeinaustralia.gov.au/ FURTHER RECOMMENDATION • Consideration should be given to further understanding and estimating groundwater recharge /
discharge in the WDP by tracer studies, using: •
• environmental tracers; especially Chloride (but also Oxygen isotopes, and possibly Strontium and Bromide) as a simple tool with measurements of Cl taken from a number rainfall events, from cored holes through the vadose zone, as well as from groundwater from the Cainozoic and Cambrian aquifers);
• Radioactive isotopes such as Sulphur35, tritium and/or chlorofluorocarbons (for modern water), carbon-14 (for 200 to 20,000 year-old waters), and chlorine-36 (for ancient waters) to date the groundwater.

Assessment of Groundwater Resources in the Western Davenport Plains Water Control District
Revision No: 0 E204629 July 2009
81
10. References
Australian Groundwater Technologies (2007A). Alekarenge Horticultural Project, Warrabri ALT
� Water Supply Borefield Development � Stage 1, Hydrogeological Review. Prepared for
Centrefarm Aboriginal Horticulture Ltd
Australian Groundwater Technologies (2007B). Alekarenge Horticultural Project, Warrabri ALT
� Water Supply Borefield Development � Stage 2, Borefield Siting and Design. Prepared for
Centrefarm Aboriginal Horticulture Ltd
Bureau of Mineral Resources (P.J. Kennewell & M.B. Huleatt) (1980). Geology of the Wiso
Basin, Northern Territory. Australia. Bureau of Mineral Resources, Geology and Geophysics).
BMR Bulletin 205. ISBN 0 642 05621 8
Carosone, F., 1989. Singleton-Murray Downs Groundwater Resources Study Interim Report
Power & Water Authority, Water Directorate, Water Resources Branch. Report WRD09003
Carosone, F., 1990. Singleton Murray Downs Groundwater Resource Evaluation stage 1. Power
& Water Authority, Water Resources Branch; AGC and Water Resources Division. Report
WRD09012
Duguid, A., Barnetson, J., Clifford, B., Pavey, C., Albrecht, D., Risler, J. and McNellie,
M. (2005). Wetlands in the arid Northern Territory. A report to Environment Australia on the
inventory and significance of wetlands in the arid NT. Parks and Wildlife Commission of the
Northern Territory. Alice Springs.
Department of the Environment, Water, Heritage and the Arts (2008) Australian Natural Resources
Atlas http://www.anra.gov.au/topics/rangelands/overview/nt/ibra-dmr.html\
Department Natural Resources, Environment and the Arts, Land and Water Division (2006). Tara
Monitoring Review, 2006. Report No. 43/2006A
Department Natural Resources, Environment and the Arts, Land and Water Division (2007A).
Notes regarding current estimates of throughflow and water in storage. Peter Jolly (PEWR)
26/3/07. March 2007

Project title - Report name Revision No: 0 Document ID number Report date
82
Department Natural Resources, Environment and the Arts, Land and Water Division (2007B).
File: WDP supplementary info volumes gw. GR 17 5 07.doc. May 2007
Department Natural Resources, Environment and the Arts, Land and Water Division (2007C).
Land and Water Resources of the Western Davenport Plains � Preliminary Technical Overview.
WRA07022. August 2007
Department Natural Resources Environment and the Arts, Land & Water Division (Graham
Ride) (2007D). File: Western Davenport Plains Non Technical Overview. GR 11.11.07.doc.
November 2007
Department Natural Resources Environment and the Arts, Land and Water Division (2007E).
Groundwater potential of Mungkarta (McLaren Creek). Report No. 31/2007A. November 2007
ISBN 1 920772 67 7
Department Natural Resources Environment and the Arts, Land and Water Division (2008A).
Iliyarne ALT Investigation Bore RN018401. Report No. 11/2008A. May 2008
Department Natural Resources Environment and the Arts, Land and Water Division (2008B).
Bore Completion Report - Neutral Junction, 2008 � RN 18402, 18403, 18404 & 18405 RN 18346,
18347 & 18348. Report No: 29/2008A. November 2008
Environment Australia (2001). A Directory of Important Wetlands in Australia, Third Edition.
Environment Australia, Canberra.
Environment Australia (2001). Drainage divisions and river basins refined as defined by the
Australian Water Resources Commission
Frogtech, 2006, Oz Seebase Proterozoic Basins Study
Gilbert, L (AGC) and Jolly, P (WRB), 1990. Singleton � Murray Downs Groundwater Resource
Evaluation � Stage 1 � Summary Report, NTG Power & Water Authority. Report WRD09045
Haines, P. W., Bagas, L., Wyche, S., Simons, B. and Morris, D. G., 1991. Barrow Creek,
Northern Territory - 1:250,000 geological map series. Northern Territory Geological Survey,
Explanatory Notes SE53-6

Assessment of Groundwater Resources in the Western Davenport Plains Water Control District
Revision No: 0 E204629 July 2009
83
Hamstead Consulting Pty Ltd (2008). An Approach to Water Allocation Planning in the Northern
Territory. A Report Prepared for the Northern Territory Department of Natural Resources,
Environment, The Arts and Sport. Draft. October 2008
Department Natural Resources Environment, the Arts & Sport, Land & Water Division, 2009.
Catalogue of Groundwater Monitoring Bores in the Southern Region of NT 36. Western
Davenport Ranges Water Control District
Northern Territory Groundwater Map and Explanatory Notes http://www.nt.gov.au/nreta/water/ground/map.html and
http://www.nt.gov.au/nreta/water/ground/pdf/WRD08012D.pdf
Northern Territory Government. Understanding Water Allocation Planning In the Northern
Territory. Fact Sheet. Undated
Paul, R.J., 2003. Warrabri � Murray Downs Groundwater Investigation; NTG, Department
Lands Planning & Environment, Natural Resources Division, Water Resources Branch. Report
WRD02013
Paul, R.J., 2005. Groundwater Investigation for Horticulture: 2004 Western Davenport Plains
Locality. NTG Department Natural Resources Environment and the Arts, Land & Water
Division, Water Resources Branch. Report WRD05004
Verhoeven, TJ and Read, RE., 1978. Warrabri Community Water Supply, Project 26. NTG
Department Transport and Works, Water Division, Water Resources Branch. Report WRD09004
Wyche, S. and Simons, B., 1987, Bonney Well, Northern Territory - 1:250,000 geological map
series. Northern Territory Geological Survey, Explanatory Notes SE53-2.