assessment of groundwater resources management in wadi el - doi
TRANSCRIPT

IOSR Journal of Engineering (IOSRJEN)
e-ISSN: 2250-3021, p-ISSN: 2278-8719, www.iosrjen.org Volume 2, Issue 10 (October 2012), PP 69-78
www.iosrjen.org 69 | P a g e
Assessment of Groundwater Resources Management in Wadi El-
Farigh Area Using MODFLOW
T. Youssef 1, M. I. GAD
2 and M. M. ALI
3
1Prof. Dr., of Irrigation, Faculty of Engineering Mataria, Helwan University, Egypt. 2Prof. Dr., Hydrology Division, Desert Research Center, Cairo, Egypt.
3Assistance lecture, of Irrigation, Faculty of Engineering Mataria, Helwan University, Egypt.
Abstract: To face the sharp increase of population in Egypt, new areas are being reclaimed. In the new
reclaimed areas of Wadi El-Farigh in Western Desert, the groundwater is considered the unique water resource
for the irrigation purposes. Sustainable management of these groundwater resources is of crucial importance
for Wadi El-Farigh where freshwater supply is naturally limited. The mild morphologic features of Wadi El-
Farigh encourage the agricultural development beside new reclamation projects. In order to optimize and
conserve the use of groundwater in these areas, some strategies should be considered, such as managing the
supply and the demand, improving the efficiency of groundwater use, reducing the waste water and ensuring
sustainability. For predicting the change in the groundwater system of the El-Moghra Aquifer In Wadi El-
Farigh (MAIWF) as a result of random reclamation projects, a quasi-three dimensional groundwater flow model (MODFLOW) for planning and managing the groundwater problems was applied in this paper.
The results of the model threaten the sustainability of the development in MAIWF. The maximum
groundwater decline applying the current exploitation strategy (303703 m3/day) will reach 30m after 7 years
while the decline will reach 35m in case of increasing the pumping rate by 15%. In addition, construction of the
proposed new irrigation canal in the NE direction of MAIWF will improve the groundwater recharge (maximum
groundwater decline of 16m).
To conserve the MAIWF storage for longer time, it is recommended to reduce the number of the
pumping wells (not more than 800 wells), reduce the initial and running time (not more than 12 hours),
applying discrete irrigation system and achieving the objective of implementing the development policy with the
groundwater recharge from the proposed new canal.
Keywords: Groundwater Management, Miocene aquifer, MODFLOW, Wadi El-Farigh, Egypt.
I. INTRODUCTION
In many areas of limited freshwater resources, the productive potential of surface water such as rivers
or lakes is not sufficient to cover the increasing sectoral demands for fresh water. Therefore, exploitation of groundwater resources has greatly increased on a worldwide scale during the second half of the 20th century.
Where available in appropriate quantity and quality, groundwater aquifers are a convenient freshwater storage.
Due to over-abstraction, groundwater levels have regionally declined in different areas of the world over this
time period. This phenomenon is an indication of non-sustainable resource utilization. It characterizes situations
of resource mining where mean recharge to the resource is inferior to what is being abstracted over a prolonged
period of time [1]. In most cases, falling groundwater levels have undesired consequences. First, lowered water
tables induce rising provision costs due to increased energy requirements for water lift. Second, hydraulic
change in the groundwater can cause pollution of pumped water where natural contamination or anthropogenic
pollution sources are present. As an example, mining of aquifers in coastal regions can cause large-scale inland
saltwater intrusion. These undesired and negative effects resulting from resource exploitation call for careful
management of groundwater systems.
The groundwater in Egypt, especially in the Western Desert region, is considered a strategic water reserve, because of water scarcity in the region. The study area located in the western fringes of the Nile Delta
occupied an area of about 800,000 feddan. According to the National Water Resources Plan 2017, the horizontal
expansion projects irrigated by groundwater in the El-Moghra Aquifer In Wadi El-Farigh (MAIWF) is 60,000
feddan the total cultivated area completed by 2004 reaches about 15,000 feddan and which under
implementation is 45,000 feddan, achieved mainly by private investors.
The purpose of this research is to detect the effect of the previous investments on the groundwater
potentialities especially in the MAIWF under applied developing policy and the other future supposed scenarios

Assessment of Groundwater Resources Management in Wadi El-Farigh Area Using MODFLOW
www.iosrjen.org 70 | P a g e
by invoking a groundwater mathematical model (Visual MODFLOW) to forecast the impacts of these
exploitations to insure sustainable development in this promising MAIWF.
1.1 Location and climate of the study area
The study area lies in the western fringes of the Nile Delta, Egypt, between longitudes 30º 00' and 30º
50' E and latitudes 30º 00' and 30º 33' N (Figure 1). It extends from km 62 (Cairo-Alex. Desert Highway) in the
south to El-Alamin Desert Road at km 126 to the north, covering an area of 800,000 Fadden. It encompasses
Wadi El-Farigh, Wadi El-Natrun and adjacent areas. The climate is characterized by a long hot summer and a
short warm winter, low rainfall and high evaporation.
MEDITERRANEAN SEA
RE
D SE
A
SINAI
Cairo
Assiut
Qena
Aswan
LakeNasser
Siwa Q
atta
ra
Dep
ress
ion
El-Bahariya
El-Farafra
El-Dakhla
El-Kharga
W E
S T E R
N
D E
S E R
T
E A
S T E R
N D
E S E
R T
Gilf Kebir Plateau
25 00 30 00 35 00
2200
2600
3000
0 100 200 300 400km
Alexandria
Figure 1: Well location map of the study area
1.2 Geomorphological and geological setting
Shata, et al., (1962), Said, (1962), Omara, and Sanad, (1962), El-Fayoumy (1964), Sanad, (1973), El-
Ghazawi, (1982), and Abdel-Baki, (1983) studied the geomorphology and geology of the study area. They
concluded that the study area comprises three geomorphological units. The Alluvial plains (young and old
alluvial plains) which are characterized by an average gradient of 0.l m/km. The elevation varies from +12 m to
+14 m for the young alluvial plains, and between 60 m and 20 m for the old alluvial plains. The lowest point in
Wadi El-Natrun and Wadi El-Farigh depressions are -23m and -4m respectively. The Structural plains
(depressions, folded ridges and structural plateaux) which have an elevation ranges between 110 m at Gebal
Hamza and 200 m at Abu Roash (the ridges bounding Wadi El-Farigh). The Tablelands which are differentiated
into Maryut tableland and marginal tableland. The sedimentary succession in the study area ranges in age from
Late Tertiary which is differentiated into Oligocene at 400 m, Miocene at 200 m and Pliocene at 150 m to Quaternary at 300m. The study area also is affected by a number of faults having NW-SE and NE-SW trends
(Figure 2).
1.3 Groundwater hydrology
There are three main aquifers in the study area, namely; The Nilotic sand and gravel (Pleistocene
aquifer), Wadi El-Natrun sand and clay (Pliocene aquifer) and El-Moghra quartizitic sand (El-Sheikh, 2000 and
Ibrahim 2005). The present study will concentrate on the MAIWF, according to its high transmisivity and water
quality.
The lateral and vertical distributions of the encountered aquifers as well as their inter-relationships are
well illustrated through two cross sections as shown in Figure 3. Regarding this Figure, the Pleistocene aquifer
exists at the northeast part of the study area to the east of Wadi El-Natrun with thickness range of 65 m to 75 m. The Pliocene aquifer exists at Wadi El-Natrun depression with thickness of 50 m to 70 m. The MAIWF exists at
Wadi El-Farigh depression to the south and west of Wadi El_Natrun having a thickness of about 100m. The
basaltic sheets were detected along the southeastern part of the study area and is considered as the base of the
MAIWF and as a marker bed separating the overlying Miocene aquifer and the underlying Oligocene aquifer.
The faults play an important role in the connections between the different aquifers as well as the direct effect on
the saturated zones. The depth to water ranges between zero at the ground surface at Wadi El-Natrun lakes to
180 m from the ground surface to the west of Wadi El-Natrun. Generally, the depth to water increases from
Wadi El-Natrun to the other directions. The general trends of the groundwater movement are from east to west,
from northeast to southwest, from south to north and from southwest to northwest. The contour lines make a

Assessment of Groundwater Resources Management in Wadi El-Farigh Area Using MODFLOW
www.iosrjen.org 71 | P a g e
closer around Wadi El-Natrun and reach its minimum level -22 m. This means Wadi El-Natrun depression is
recharged from the surrounding aquifers, in other words it acts as a drain for these aquifers.
II. Materials And Methods The materials used in this paper were collected through carrying out field trips in West Delta area
during the period 2009-10. Two field trips were achieved with the team work of the Desert Research Center
(DRC) to monitor seasonally periodic groundwater level records. The hydrologic data of some of the
groundwater wells’ sites were obtained during these field trips. In addition, the archival data such as long term
groundwater level records were collected from the DRC library beside the recent records from the team work of
the ministry of water resources and irrigation (WRRI). The basic hydrologic data of the studied wells were
obtained during these field trips beside the data from two data loggers were installed by REGWA team work in
the observation wells in north and south of the reclaimed area of Wadi El-Farigh (Table 1). These materials include collection of archival data (well drilling reports, REGWA 2006), registration of discharge, distribution
of wells, proposed operating systems for both groundwater supply and reclaimed area beside recording depth to
water for groundwater level changes.
The methodological approach used in this paper is based on the mathematical modeling techniques
applying visual MODFLOW computer program. Visual MODFLOW version 3 is a 3D finite difference based
groundwater simulation system. It is initially written by McDonald and Harbaugh (1988). The model is capable
of modeling time-dependent flow as well as mass and heat transport problems. The time-dependent data that
should be included into the FDM model has to be stored outside in database or GIS systems. The model
describes groundwater flow of constant density under non-equilibrium conditions in a heterogeneous and
anisotropic medium according to the following equation (Bear, 1979):
t
hSSw
z
hk
zy
hk
yx
hk
xzzyyxx
)()()(
……………..1 Where
KXX, Kyy and Kzz are the hydraulic conductivity along the x, y, and z coordinate axes, (Lt-l); h is the potentiometric head (L); W is a volumetric flux per unit volume and represents sources and/or sinks of water (t-
l); Ss, is the specific storage of the porous material (L-l); and t is time (t). In general, SS, KXX, Kyy, and KZZ may be
functions of space (SS = Ss(x,y,z), Kxx = KXX(x,y,z), etc.) and W may be a function of space and time (W =
W(x,y,z,t)). Equation 1 describes ground-water flow under non-equilibrium conditions in a heterogeneous and
anisotropic medium and provided the principal axes of hydraulic conductivity are aligned with the coordinate
directions.
This equation was solved using the Adams-Bashforth/Trapezoid rule (AB/TR) predictor-corrector time
stepping scheme and best-accurate Galerkin-based formulation no upwinding method and the finite difference
technique (Warner, 1987). The budget analyzer in the numerical MODFLOW model computes quantities of
fluid masses entering or exiting the simulated region, sub-regions or boundary sections. The balance
computation takes into account only grid cells occupied by values for areal recharge or boundary conditions.
Under steady state conditions when the total balancing for the entire region is calculated, the imbalance represents a measure for the accuracy of the computations. Characteristics of the groundwater flow mechanism
and its spatial and temporal variation, as well as its future behavior, were thoroughly investigated by means of
the mentioned numerical model.
Construction of the groundwater flow model
The construction of the groundwater flow model of the MAIWF requires the definition of the
conceptual model, the model domain with flow boundary conditions and the aquifer material properties.
Conceptual model of MAIWF
To enable studying groundwater potentiality in Wadi El-Farigh area, the conceptual model of the
MAIWF has been constructed. It based on the geology and the petro physics of the Moghra Formation. Its thickness is about 75 m in the northern portion, 150 m in some localities at Wadi El Farigh, 250 m in Wadi El
Natrun and gradually increases northwestward with a maximum thickness of about 900 m at El Qattara
Depression (Omara and Sanad, 1973). The basaltic sheets are separating the overlying MAIWF and the Daba’a
shale Formation, it has variable thickness ranging between 20 to 30 meters and located at different vertical
levels.
The hydrogeologic system was concerned unconfined and confined of one layer type. The variations of
the hydraulic conductivity are resulting from the variation in the saturated thickness through the flow section as
well as the variation in the transmisivity resulting from the change in the Potentiometric level.

Assessment of Groundwater Resources Management in Wadi El-Farigh Area Using MODFLOW
www.iosrjen.org 72 | P a g e
Model domain and boundary conditions
The simulation procedure was started by dividing the MAIWF domain into a suitable grid pattern on
which all the input items are performed via input menus. The total surface area of the model domain reaches 3600 km2 (60 km in length and 60 km in width). The computational grid for the aquifer domain in the study area
is divided into 3600 cells (60 columns and 60 rows). The dimension of the cell nodes reaches 1000m for the
cultivated and reclaimed areas (Figure 5).
The boundary conditions are represented by the outer boundaries which are chosen to be natural
boundaries to the system taking into account that the boundaries should be taken remote enough from the effect
of wells field. These constant head boundaries were assigned in the NE direction with constant value of 8 m asl,
in the east direction with variable values ranged between 8 to 2 m asl, in the south western direction with
variable values ranged between 16 to 20 m usl and finally in the south west direction with values ranged
between 20 to 22 m usl (Figure 5).
Aquifer characteristics The input parameters for the MAIWF simulation include aquifer hydraulic parameters (permeability
and storage coefficients), aquifer geometry (vertical and areal extent of the aquifer) and aquifer stresses
(recharge and discharge). The hydraulic parameters of the MAIWF are given in Table 1.
The United States Geological Survey (USGS) has converted the topographic maps of Egypt into digital
elevation model (DEM) files. These files represent the land surface as a matrix (grid) of elevation values at a
given space (resolution) apart. The 1:250,000 map series has been converted into 3 arc-second (approximately
90 m) resolution DEMs. DEM data is used in WMS to automatically delineate topography and ground elevation
of the model domain (Figure 6). The depth to impermeable bed (bottom of the aquifer) is used to estimate the
aquifer thickness of every cell in the modeled area (Figure 6).
Table 1: Hydraulic parameters from different sources for all three aquifers in the area of study
Assessment of Groundwater Resources Management in Wadi El-Farigh Area Using MODFLOW
www.iosrjen.org 73 | P a g e
Aquifer stresses The recharge to the modeled aquifer system may be from the Nile Delta area in the East and the Tahrir
Province in the north as well as rainfall. The annual estimated rainfall in this arid area can be neglected. The
discharge from the aquifer may be from natural discharge represented in the evapotranspiration from Wadi El-Natrun depression and it is neglected. Artificial discharge is mainly through water extraction for the
development projects and this is the source of discharge in the model domain. The total annual losses due
pumping reaches 303.7 Million m3/year, from number of wells reached 696 well.
Initial hydraulic head distribution The water level measurements through the bore hole piezometers in the model domain during
November, 1991 were used to construct a contour map for the initial hydraulic head distribution (Figure 7).
Calibration and verification of the model
The initial data of the hydraulic parameters such as hydraulic conductivity (K) and specific yield (S)
have been entered to the model with initial values based on data collected after different authors in the study
area. These data have very wide different ranges all over the modeled area. Every once these data entered to the
Figure 8: The calculated head vs the observed
head for the steady calibration in the MAIWF
Figure 7: Observed piezometric head contour
map of the MAIWF (after Mostafa 1993)
Al-Alamin Road
Oil Line
Cairo Alex. Highway
El-Khatatba R
oadEl-S
adat Road
Wadi El-Natrun
Wadi El-Farigh
210000 220000 230000 240000 250000 260000 270000
3320000
3330000
3340000
3350000
3360000
3370000
3380000
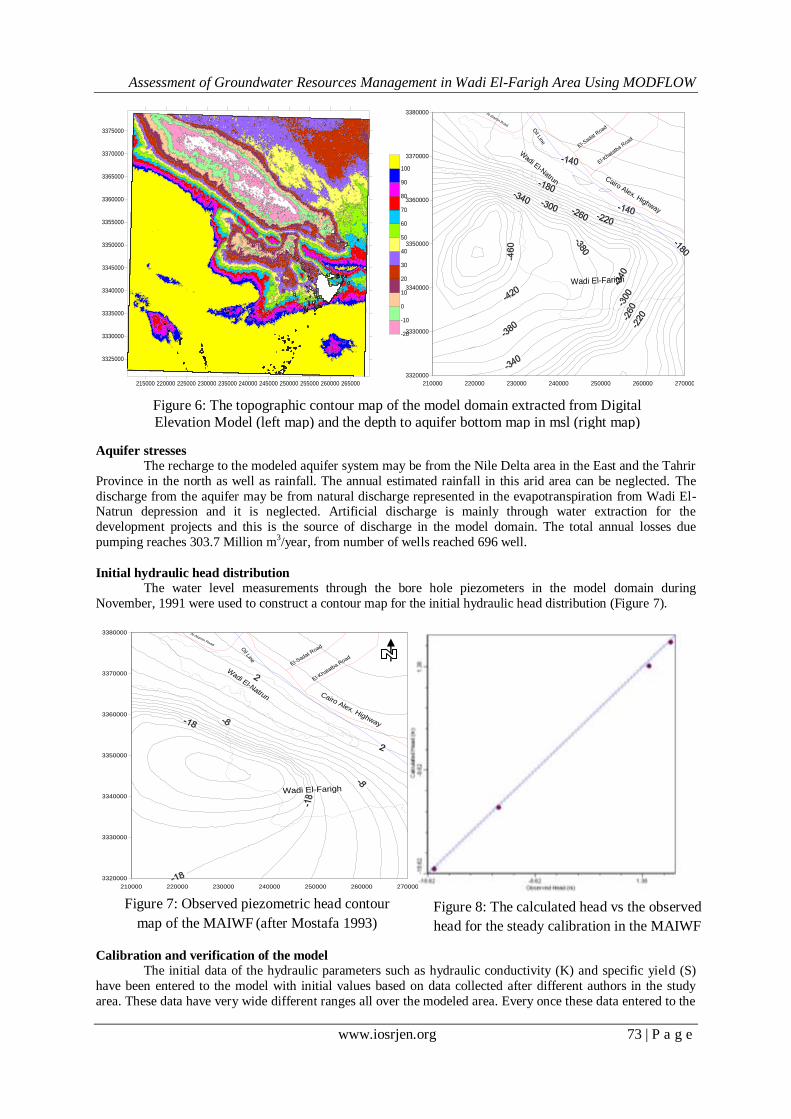
Figure 6: The topographic contour map of the model domain extracted from Digital
Elevation Model (left map) and the depth to aquifer bottom map in msl (right map)
215000 220000 225000 230000 235000 240000 245000 250000 255000 260000 265000
3325000
3330000
3335000
3340000
3345000
3350000
3355000
3360000
3365000
3370000
3375000
-20
-10
0
10
20
30
40
50
60
70
80
90
100
Al-Alamin Road
Oil Line
Cairo Alex. Highway
El-Khata
tba R
oad
El-Sadat R
oad
Wadi El-Natrun
Wadi El-Farigh
210000 220000 230000 240000 250000 260000 270000
3320000
3330000
3340000
3350000
3360000
3370000
3380000

Assessment of Groundwater Resources Management in Wadi El-Farigh Area Using MODFLOW
www.iosrjen.org 74 | P a g e
constructed model, is allowed to run. If there is a convergence between the observed heads and calculated heads,
an input data error is present which should be repaired time after time until running process goes successfully.
This means that the model successes for computing the heads of the aquifer at every cell. As a result, a water level contour map namely calibrated head map is constructed by using these calculated heads. It differs from
the map plotted from the actual field head measurements namely observed head map. The relation between the
calculated and the observed heads is checked every run from the calculated- observed head curve. The
calibration process is very important to minimize the variance to a lower possible value. After many times of
changing the K values, the variance between the observed and the calculated heads was minimized to 1.623%
(Figure 8).
Testing scenarios After completing the stage of calibration, the output of the first round was used to replace the initial
condition with the condition of implementing the exploitation policies. The testing scenarios included three
proposed water exploitation policies. The first proposed water exploitation policy (existing Policy) was the initial proposed strategy of total pumping rate of 303703 m3/day from 696 productive wells with an operating
time of 10 hours, and study the expected change in groundwater level during time of simulation (44 years) in
five arbitrary observation wells covering the model domain (Figure 9).
The second proposed water exploitation scenario tested an increase of the operating time or increasing
the pumping rates from the productive wells by 15% or increasing the number of the productive wells as a result
of the increase in cultivated areas during the next 44 years.
The third proposed scenario tested the effect of the presence of a new water course on the groundwater
regime in the study area. To improve the West Delta project, the Egyptian government decided to construct a
new canal attached between Nasiri Rayah and El-Bostan canal and crossing the northeastern parts of the study
area (Figure 9). This canal will provide the study area by 2.1 million m3 /day to facilitate the agricultural
investments in this promising area.
III. RESULTS AND DISCUSSIONS The diffusivity (T/S), which expresses the MAIWF potentiality, ranges between 12672 and 16.2x10⁶
m2/day (Eastern part of Wadi El-Natrun and Wadi El-Farigh respectively (Table 1). This indicates that the
northern part of the MAIWF has groundwater potentiality less sixteen times its value in the southern part.
Accordingly, the location of the future reclamation activities in the northern part of MAIWF may not be in the
proper site before construction of the new canal.
In addition, the results of the simulation process reveal that the implementation impacts of the current
development policy have serious impacts on the MAIWF storage. This was detected through the arbitrary five
observation wells in the model domain (Figure 9). Figure 10 shows the predicted hydraulic head after time of
simulation of 44 years in the MAIWF 's drilled wells for each locality applying the three different proposed
scenarios. It is noticed from the figure that, under the exploitation strategy of 303703 m3/day (first proposed
scenario), the total drawdown points to 30m, 19m, 4m, 2m and 1m as shown by the blue curved line characterizing wells of the NW locality (observation point No 1), green curved line characterizing wells of the
Figure 9: Location map of the five arbitrary observation wells (left) and sketch shows the location
of the proposed canal (right) in the model domain of the MAIWF

Assessment of Groundwater Resources Management in Wadi El-Farigh Area Using MODFLOW
www.iosrjen.org 75 | P a g e
Wadi El-Natrun locality (observation point No.2), yellow curved line characterizing wells of the middle locality
(observation point No. 3), black curved line characterizing wells of the eastern locality (observation point No.
4), and red curved line characterizing wells of the southern locality (observation point No. 5) respectively (Figure 10-A). The decline in the predicted hydraulic head in the southern part of the MAIWF compared with
the other aquifer localities may be attributed to the increase in aquifer thickness, increase in sand ratio and high
lineaments density due south (GAD, 2010). Moreover, the decline in the hydraulic head will continue till about
seven years of the simulation period of 44 years. After this interval, the groundwater system in the MAIWF will
be balanced.
The results of the simulation process applying the second proposed scenario (an increase in the daily
pumping rate for all operating wells by 15%, i.e. 45555 m3/day, Figure 10) indicates that the anticipated
drawdown applying pumping rate of 349258 m3/day will reach 35m, 22m, 5m, 2m and 1m as shown by the blue
curved line characterizing wells of the NW locality (observation point No 1), green curved line characterizing
wells of the Wadi El-Natrun locality (observation point No.2), yellow curved line characterizing wells of the
middle locality (observation point No. 3), black curved line characterizing wells of the eastern locality (observation point No. 4), and red curved line characterizing wells of the southern locality (observation point
No. 5) respectively (Figure 10-B). The decline in the hydraulic head will continue till about 9 years from the
beginning of the simulation period of 44 years followed by aquifer natural balance state.
On the other side, the third proposed scenario shows opposite results (Figure 10-C). The simulated new
proposed canal (with flow rate 2.1 million m3/day) will recharge the groundwater regime in the model domain
and will affect the predicted hydraulic head of the MAIWF. The average drawdown points to 16m, 3m, 2m and
0.5m as shown by the blue curved line characterizing wells of the NW locality (observation point No 1), yellow
curved line characterizing wells of the middle locality (observation point No. 3), black curved line
characterizing wells of the eastern locality (observation point No. 4), and red curved line characterizing wells of
the southern locality (observation point No. 5) respectively (Figure 10-C).
Figure 10: The predicted drawdown after 44
years in the model domain applied 1st scenario
(A), 2nd
scenario (B) and 3rd
scenario (C)
Figure 11: The predicted
potentiometric maps of the model
domain after 44 years applying1st
scenario (upper), 2nd
scenario
(middle) and 3rd
scenario (lower)

Assessment of Groundwater Resources Management in Wadi El-Farigh Area Using MODFLOW
www.iosrjen.org 76 | P a g e
Otherwise, the green curved line characterizing wells of the Wadi El-Natrun locality (observation point No.2)
reflects an increase in groundwater level by 8m as a result of low topography characterizing the Wadi El-Natrun
area. However, the predicted potentiometric surface change applying the three proposed scenarios of
different pumping rates is given in Figure 11. The change in the potentiometric surface after 44 years of
simulation, applying the first proposed scenario, shows that the potentiometric surface of 4 masl defines the end
of the resulted cone of depression (Figure 11). The curvature of this potentiometric surface reflects the critical
situation of aquifer deterioration as a result of the present high pumping rate (Figure 11).
As the pumping rate increases from 303703 to 349258 m3/day (the second proposed scenario), the
potentiometric surface of 4 masl in the model domain will be more or less straight and move, after 44 years,
towards south for a distance of 3 km (Figure 11). The figure also shows a presence of curvature potentiometric
surface south and west of the model domain which reflects beginning of depression cone surrounding these
localities. In the same time, the potentiometric surface of 4, 6 and 8 masl in the middle part of the model domain
show flat groundwater potentiometric surface slopes after the same period of simulation. This may be attributed to the high sand ratio in the southern part than that in the northern part (Gad, 2010). The flat groundwater
piezometric slopes of the western part of the MAIWF model domain reveal a high hydraulic conductivity of the
water-transmitting material. Hence, the narrow spacing of contour lines in the northern part of the MAIWF
reflects the low hydraulic conductivity of the water-transmitting material. This demonstrates a considerable
consistency with the hydraulic conductivity measurements (Table 1).
Generally speaking, the MAIWF encompasses a large number of "flow domains" related to the
appeared drawdown cone after simulation period of 44 years, as the pump rate increases to 349258 m3/day. This
condition will result in piezometeric head lowering within the area followed by local groundwater flow from
south, east and west directions towards the productive wells (Figure 11). The larger flow systems consist of
relatively permeable deposits and constitute preferential zones for groundwater flow (Gad et al 2011). The
equipotential contour lines show concentric shapes quite suddenly towards the northern part of the model
domain. Higher hydraulic gradients in this location may be attributed either to a higher flow density or to a lower transmissivity of the MAIWF system (Gad and Abuel-Lohom, 2011). Moreover, the appeared drawdown
cone will continue to expand laterally for some period after stresses in case of applying second scenario. This
means that water continues to be derived from storage in the MAIWF. An abrupt decrease in the flow density is
unlikely, because groundwater discharge is insignificant in the indicated transition zone (northern part of the
model domain) and divergence of flow lines has a gradual and limited effect only. The conclusion is that the
southern part of the MAIWF apparently is thicker and/or is composed of other, more permeable deposits than in
the northern places.
Moreover, the natural recharge from the new proposed canal assuming recharge rate of 2.1 million
m3/day through NE aquifer boundary of 12.5 km length (third proposed scenario) will replenish the MAIWF
storage and causing the potentiometric surface of zero level to spilt the huge cone of depression into two small
depression cones although the increase in pumping rate with 15% (Figure 11). More studies are needed to assure this point. Also, the presence of the curvatures in the potentiometric surface passing through the southern
locality (potentiometric surface of 2 masl) may be attributed to the effect of local structures which retard the
groundwater flow comparing with the other localities (Salem et al., 2010 and Moharram et al, 2011).
In addition, the interference of the depression cones is predicted in the wells of both northern and
middle localities applying second scenario more than that in case of first scenario. This is traced from the
predicted crowded potentiometric surfaces representing the resulted well heads of the north locality after 44
years applying pumping rate 349258 m3/day (Figure 11). Moreover, the predicted boundary conditions of the
MAIWF applying the second proposed scenario show that the western boundary will change from out flux head
boundary in case of applying first scenario to influx boundary due to the expected recharge from the adjacent
aquifers due to head decline which may improve the MAIWF conditions in the west. The more replenishment of
MAIWF storage by applying the third proposed scenario returns the northern boundary to the initial state
(Figure 11).
IV. Conclusion And Recommendations The sustainable development in MAIWF suffers from some hydrologic problems especially
groundwater depletion as a result of improper groundwater exploitation policies. Both over pumping and
inadequate well locations are the main causes of this problem. A trial to mitigate this problem was carried out in
this paper via predicting the change in groundwater levels in the MAIWF under different water exploitation
polices applying suitable groundwater flow model (MODFLOW). The MAIWF was simulated and discretized
into one complex confined layer. The computational grid for the aquifer domain is divided into 3600 cells (60
columns and 60 rows). The boundary conditions are represented by the outer boundaries which are chosen to be natural boundaries to the system taking into account that the boundaries should be taken remote enough from the

Assessment of Groundwater Resources Management in Wadi El-Farigh Area Using MODFLOW
www.iosrjen.org 77 | P a g e
effect of wells field. These constant head boundaries were assigned in the NE direction with constant value of 8
m asl, in the east direction with variable head values ranged between 8 m asl to 2 m asl, and finally in the south
west direction with head values ranged between 20 m usl to 22 m usl. The aquifer material properties of the MAIWF included the transmissivity (from 95 to 3034 m2/day), the storage coefficient (from 1.2x10⁻⁴ to 7.5x10-
3) and the hydraulic conductivity (from 9.8 to 77.76 m/day). The model was calibrated in steady state condition
and unsteady state condition based on the piezometric heads at 1992 and 2006.
Three scenarios were tested to choose the proper water exploitation policy. The first proposed scenario
kept the proposed discharge from the present 696 productive wells (303703 m3/day). The predicted groundwater
level decline after simulation period of 44 years, applying this scenario, will reach 30m, 19m, 4m, 2m and 1m
in the wells of the NW locality, wells of the Wadi El-Natrun locality, wells of the middle locality, wells of the
eastern locality, and wells of the southern locality respectively. The second proposed scenario kept the initial
conditions and proposed an increase of the daily pumping rate by 15%. The predicted decline in the
groundwater level after simulation period of 44 years will reach 35m, 22m, 5m, 2m and 1m in wells of the NW
locality, wells of the Wadi El-Natrun locality, wells of the middle locality, wells of the eastern locality, and wells of the southern locality respectively. The third proposed scenario shows an average drawdown points to
16m, 3m, 2m and 0.5m characterizing wells of the NW locality, wells of the middle locality, wells of the eastern
locality, and wells of the southern locality respectively. Otherwise, the wells of the Wadi El-Natrun locality
reflects an increase in groundwater level by 8m as a result of low topography characterizing the Wadi El-Natrun
area. The MAIWF will encompass a large number of "flow domains" related to the appeared drawdown cone
after the end of the simulation period of 44 years under the pump rate of 303703 m3/day. This condition will
result in piezometeric head decline within the area followed by local groundwater flow from south, east and
west directions towards the wells of the NE parts.
To conserve the MAIWF storage for longer time, it is recommended to reduce the number of the
pumping wells (not more than 800 wells), reduce the initial and running time (not more than 12 hours), applying
discrete irrigation system and achieving the objective of implementing the development policy with the
groundwater recharge from the proposed new canal. It is highly recommended to construct of monitoring network to assure the recharge from the proposed new canal after construction.
References [1] Abdel-Baki, A. A. (1983): Hydrogeological and hydrochemical studies on the area west of Rossetta branch and
south El-Nasr canal. Ph. D. Thesis, Fac. Sci., Ain Shams Univ., Egypt, 156 p. [2] Ahmed S. A., (1999): Hydrological and isotpe assessment of groundwater in Wadi El-Natrun and Sadat City,
Egypt. Faculty of science, Ain Shams University, Cairo, Egypt, p 237. [3] Bear, J. (1979): “Hydraulics of Groundwater.” McGraw-Hill, New York.
[4] Dawoud, M.A., Darwish, M.M., and El-Kady, M.M., (2005): GIS-Based Groundwater Management Model for Western Nile Delta. Water Resources Management, 19(5), pp.585–604.
[5] Diab, M. S., Gad, M. I., Abdel-Baki, A. A. and El Sheikh A. E. (2002): Study the effect of new reclamation projects on the groundwater system in the area northwest wadi El-Natrun and south El-Nasr canal by using mathematical modeling. Proceedings of the 3rd International Conference of Groundwater Level Control Inside Urbanized Areas, Fac. of Eng., Mansoura Univ. pp 279-292.
[6] El-Fayoumy I. F. (1964): Geology of groundwater studies in Wadi El-Natrun area. M. Sc. Thesis, Fac. Sci., Cairo Univ., Egypt, 109 p.
[7] El-Ghazawi, M. M. (1982): Geological studies of the Quaternary Neogene aquifers in the northwest Nile Delta. M. Sc. Thesis, Fac. Sci., Al-Azhar Univ., Cairo, Egypt, 170 p.
[8] El-Kashouty, M. and Sabbagh, A., (2011). Distribution and immobilization of heavy metals in Pliocene aquifer sediments in Wadi El Natrun depression, Western Desert. Arabian Journal of Geosciences, 4(5-6), pp.1019–1039.
[9] El-Shazly E. M, Abdel Hady M., El-Ghawably H., El-Kassas K., Khawasik S. M., El-Shazly M. M. and Sanad S., (1975): Geological interpretation of Landsat satellite images for west Nile Delta area:, Remote Sensing Center, Acad. Of Scientific Research and Technology , Cairo, Egypt, P. 38.
[10] El-Sheikh, A. E. A. (2000): Hydrogeology of the area north and west of wadi el-natrun. M. Sc., Thesis, Fac., of Sci.,
Minufiya Univ. 177 p. [11] GAD, M. I. (2010): Towards a proposed policy of groundwater management in Nubian Sandstone aquifer in Bir El-
Shab area, South Western Desert, Egypt. Egypt. J. P. Sci. Vol. 48: 13 - 36. [12] GAD, M. I., and Abuel-Lohom, N. (2011): Water Resources Management in an Arid Area: Estimation of
Groundwater Depletion in Sana’a Basin, Yemen”. 1st Int., Renewable Energy & Technology Conf., (IRETC 1), Hurghada, Egypt.
[13] GAD, M. I., El Sheikh A. E. and El Osta M. M. (2011): Optimal management for groundwater of Nubian aquifer in El Dakhla depression, Western Desert, Egypt”. IJWFEE Vol. 3(8), pp. 111-122.
[14] Geirnaert, W., (1992): Composition and history of ground water in the western Nile Delta. Journal of Hydrology,
138, pp.169–189. [15] Ibrahim S. M. M., (2000): Groundwater hydrology of El-Khatatba area and its vicinities, West Nile Delta, Egypt.
M. Sc. Thesis, Faculty of Engineer, Ain Shams University, Cairo, P. 124.

Assessment of Groundwater Resources Management in Wadi El-Farigh Area Using MODFLOW
www.iosrjen.org 78 | P a g e
[16] Ibrahim S. M, (2005): Groundwater resources management in Wadi El-Farigh and its vicinities for sustainable agricultural development. PhD Faculty of engineering, Ain Shams University, Cairo.
[17] McDonald, M.G., and Harbaugh, A.W., (1988): A modular three-dimensional finite-difference ground-water flow model – MODFLOW. U.S. Geological Survey Technique of Water Resources Investigations, Book 6, 1988.
[18] Moharram, S.H., GAD, M. I., Saafan, T. A. and S.I. Khalaf (2011): “Optimal Groundwater Management Using Genetic Algorithm in El-Farafra Oasis, Western Desert, Egypt”. Water Resour. Manage., DOI 10.1007/s11269-011-9865-3
[19] Molla, El, A.M. et al., (2005): INTEGRATED MANAGEMENT OF WATER RESOURCES IN WESTERN NILE DELTA 1-BUILDING AND CALIBRATING THE GROUNDWATER MODEL. pp.1–12.
[20] Mostafa N. E., (1993): Hydrogeological and hydrostudies on Wadi El-Farigh area, Western Desert, Egypt. M. Sc. Thesis, Faculty of Science, El-Minoufiya University, Shibin El-Kom, Egypt. P. 132.
[21] Omara, S. M. and Sanad, S. (1962): Rock Stratigraphy and structural features of the area between Wadi El-Natrun and the Moghra Depression, Western Desert, Egypt. Geol. J. B. 16, Hanover, , 1975, pp 45-73.
[22] Pavlov M., (1962): Hydrology in preliminary report on the geology, hydrology and groundwatyer hydrology of Wadi El-Natrun and the adjacent areas. Part 2, Cairo, U. A. R., Desert Institut, The General Development Organization,
P.63. [23] REGWA, the General Company for Research and Groundwater (2006): Composite well logs. Internal reports.
Ministry of Agriculture and Land Reclamation. [24] RIGW/IWACO, (1990): "Development and Management of Groundwater Resources in the Nile Valley and Delta:
Assessment of Groundwater Pollution from Agricultural Activities". Research Inst. For Groundwater, Kanater El-Khairia, Egypt.
[25] Saad K. F., (1964): Groundwater hydrology in preliminary report on the geology, hydrology and groundwatyer hydrology of Wadi El-Natrun and the adjacent areas. Part 3, Cairo, U. A. R., Desert Institut, The General Development Organization, P.61.
[26] Said, R., (1962): The Geology of Egypt. El-Sevier Pub. Co., Amesterdam, New York. [27] Salem, B.B., Gad, M.I., and King, C.M., (2010): Report to the International Project on Groundwter and Human
Security Case Studies (GWAHS-CS): Beni Salama Case Study, Egypt, United Nations University. [28] Sallouma M. K.,(1974): Geology and geomorphology of Beni Salama area at Wadi El-Natrun. M. Sc. Thesis,
Faculty of science, Ain Shams University, Cairo, Egypt, P. 145. [29] Sanad, S., (1973): Geology of the area between Wadi El-Natrun and Moghra Depression. Ph.D. Thesis, Fac. Sci.,
Assuit University, Assuit, Egypt. 184 p. [30] Shata, A. A., Pavlov, M., and Saad, K. F., (1962): Preliminary report on geology, hydrogeology and groundwater
hydrology of Wadi El-Natrun and adjacent areas. Internal report Desert Institute, Cairo, Egypt, p 159. [31] The National Water Resources Plan 2017, (2007): Ministry of water Resources and Irrigation, Planning sector. [32] Warner, J. (1987): Mathematical Development of the Colorado State University Finite Element 2-Dimensional
Groundwater Flow Model. Groundwater Technical Report 2, Colorado, USA. [33] Warner, J.W. et al., (1984): Hydraulic Conductivity and Vertical Leakage in the Clay-Silt Layer of the Nile
Alluvium in Egypt, Water Distribution Research Institute, Water Research Centre, Ministry of Irrigation, Government of Egypt.