assessment of hydraulic conductivity in coastal floodplain ... · title: assessment of hydraulic...
TRANSCRIPT

R E P O R T P R E P A R E D F O R T H E S I X N O R T H C O A S T C O U N C I L S O F N S W , M A R C H 2 0 0 9
Assessm
ent o
f hyd
raulic co
nd
uctivity in
coastal flo
od
plain
acid su
lfate soils o
n th
e no
rth co
ast of N
SW
Assessment of hydraulic conductivity in coastal floodplain acid sulfate soils on the north coast of NSW
W W W. I N D U S T R Y. N S W. G O V. A U

Title: Assessment of hydraulic conductivity in coastal floodplain acid sulphate soils on the north coast of NSW
Authors: Phillip Hirst, Technical Officer, Industry & Investment NSW, Peter Slavich, Research Leader, Industry & Investment NSW, Scott Johnston, Research Associate, Southern Cross University, Simon Walsh, Conservation Officer, Industry & Investment NSW.
© State of New South Wales through Department of Industry and Investment (Industry & Investment NSW) 2009. You may copy, distribute, display, download and otherwise freely deal with this publication for any purpose, provided that you attribute the department as the owner. However, you must obtain permission if you wish to charge others for access to the publication (other than at cost); include the publication in advertising or a product for sale; modify the publication; or re‑publish the publication on a website. You may freely link to the publication on the Industry & Investment NSW website
For updates to this publication, check www.dpi.nsw.gov.au/ Published by Industry & Investment NSW First published November 2009 ISBN 978 1 74256 004 5
Acknowledgements: The North Coast of NSW Floodplain Network group and participating councils.
Cover design by the Publication and Communications Industry & Investment NSW. Cover photos: Groundwater sampling in the Kempsey Frogmore site by Belinda Allman. Insert photo one, is surface iron deposits found at Roches in the Manning, photo two, macropores visible in a ped in the Richmond, photo three, corrosion of a concrete fence post in an acid sulfate soil environment on the Clarence. Photographs in report by principle author.
DISCLAIMeR The information contained in this publication is based on knowledge and understanding at the time of writing (September 2009). However, because of advances in knowledge, users are reminded of the need to ensure that information on which they rely is up to date and to check the currency of the information with the appropriate officer of Industry & Investment NSW or the user’s independent advisor.
Job No: 9459

____________________________
Assessment of hydraulic
conductivity in coastal floodplain acid sulfate soils on the
North Coast of NSW
____________________________ Report prepared for the six north coast councils of NSW Prepared by: Phillip Hirst1, Peter Slavich1, Scott Johnston2, Simon Walsh1 1 NSW Department of Primary Industries 2 Southern Cross University March 2009 An initiative of the Floodplain Network Consultative Group in association with the North Coast Catchment Management Authority. Jointly funded by the Tweed Shire Council, Richmond River County Council, Clarence Valley Council, Kempsey Shire Council, Port Macquarie-Hastings Council, Greater Taree City Council and NSW Department of Primary Industries.

North Coast NSW Acid Sulfate Soil Ksat Project 2
Contents Table of Figures .......................................................................................................................4 Tables.......................................................................................................................................6 1. Introduction .......................................................................................................................7
1.1 Hydraulic conductivity of acid sulfate soils................................................................7 1.2 Aims..........................................................................................................................9
2. Methodology........................................................................................................................9 2.1 Study area ................................................................................................................9 2.2 Hydraulic conductivity.............................................................................................10
2.2.1 Pit geometry........................................................................................................11 2.2.2 Additional data collected.....................................................................................12
3. Interpreting data ..............................................................................................................13 3.1 Ksat graphs ..............................................................................................................13 3.2 Graph and Table interpretation...............................................................................13 3.3 EM38 charts ...........................................................................................................14
4. Results ............................................................................................................................15 4.1 Tweed River Catchment Sites ................................................................................15
4.1.1 Blacks Drain........................................................................................................16 4.1.2 McLeods Creek...................................................................................................18 4.1.3 Clothiers Creek ...................................................................................................20 4.1.4 Chinderah ...........................................................................................................22 4.1.5 Christies..............................................................................................................24
4.2 Richmond River Catchment Sites...........................................................................26 4.2.1 Scanlans drain ....................................................................................................27 4.2.2 Haughwood road and Bora-Codrington ..............................................................30 4.2.3 Kilgin near Woodburn .........................................................................................32 4.2.4 Gollan and Swan Bay .........................................................................................33 4.2.5 Rocky Mouth Creek ............................................................................................35 4.2.6 Braziers Drain .....................................................................................................36
4.3 Clarence River Catchment Sites.............................................................................37 4.3.1 Clarence Site at Ensbys .....................................................................................38 4.3.2 Wooloweyah Lagoon ..........................................................................................40 4.3.3 Crows Nest at Tucabia .......................................................................................43 4.3.4 The Broadwater at Arndilly .................................................................................45 4.3.5 Farlows next to the pacific highway ....................................................................47
4.4 Macleay River Catchment Sites..............................................................................50 4.4.1 Rogars property ..................................................................................................51 4.4.2 Clancys Drain .....................................................................................................53 4.4.2 Frogmore area ......................................................................................................55
4.5 Hastings River Catchment Sites.............................................................................57 4.5.1 Rossglen.............................................................................................................58 4.5.2 Hacks Ferry and Torrens Island .........................................................................60
4.6 Manning River Catchment Sites .............................................................................63 4.6.1 Cattai Creek........................................................................................................63 4.6.2 Templeman.........................................................................................................66 4.6.3 Roches................................................................................................................67

North Coast NSW Acid Sulfate Soil Ksat Project 3
5. Summary data and discussion ........................................................................................72 6. Conclusions.....................................................................................................................78 7. Acknowledgements .........................................................................................................81 8. References ......................................................................................................................82
Appendix 1: Ksat Survey Project GPS Co-ordinates.....................................................84 Appendix 2: Summary of completed field work............................................................88 Appendix 3: Glossary...................................................................................................89 Appendix 4: Field Notes...............................................................................................91 Appendix 5: Ksat site means per catchment .................................................................93 Appendix 6: Soil profile description at Braziers Drain Richmond.................................95 Appendix 7: Acid Sulfate Soil Risk Map Codes ...........................................................96 Appendix 8: Soil Profile Pit Descriptions......................................................................97 Appendix 9: Field Pit Methodology ............................................................................104

North Coast NSW Acid Sulfate Soil Ksat Project 4
Table of Figures Figure 1. Groundwater seepage pathways. .............................................................................8 Figure 2. Broadwater wetland on the Clarence. .......................................................................9 Figure 3. Northern NSW study area. ......................................................................................10 Figure 4. The geometry of excavations used in pit bailing methods. .....................................11 Figure 5. Thor Aaso using a gouge auger in a Ksat pit, in the Hastings. .................................12 Figure 6. Chrisy Clay and Phil Hirst with EM38 meter. ..........................................................12 Figure 7. EM38 at Farlows on the Clarence...........................................................................14 Figure 8. Tweed site...............................................................................................................15 Figure 9. Five Ksat pit locations and two EM38 transects (Legend: appendix 7). ...................16 Figure 10. Normalised water level recovery rate over time, Stainley cane field.....................16 Figure 11. Blacks drain transect across cane field.................................................................17 Figure12. Seven Ksat pit locations and an EM38 transect at McLeods Creek. .......................18 Figure 13. Normalised water level recovery rate over time, Quirks cane field. ......................18 Figure 14. EM38 Quirk cane field...........................................................................................19 Figure 15. Five Ksat pits and an EM38 transect. .....................................................................20 Figure 16. Normalised water level recovery rate over time, at Clothiers................................20 Figure 17. Clothiers Creek EM38 transect. ............................................................................21 Figure 18. Five Ksat pits and an EM38 transect. .....................................................................22 Figure 19. Normalised water level recovery rate over time, Chinderah cane field site. .........22 Figure 20. Chinderah EM38 transect .....................................................................................23 Figure 21. Four Ksat pits and an EM38 transect, at Christies coastal oak forest. ...................24 Figure 22. Normalised water level recovery rate over time, at Christies. ...............................24 Figure 23. EM38 transect, Christies Creek. ...........................................................................25 Figure 24. Richmond sites......................................................................................................26 Figure 25. Two Ksat pits plus three EM38 transects................................................................27 Figure 26. Normalised water level recovery rate over time, Scanlans two sites. ...................27 Figure 27. EM38 transect from pit 2. ......................................................................................28 Figure 28. EM38 transect from main drain to a cross drain along cane headland. ................29 Figure 29. EM38 transect moving away from drain to middle of field....................................29 Figure 30. Two Ksat pits at Haughward road and one at Bora-Codrington. ............................30 Figure 31. Normalised water level recovery rate over time, at Haughward............................30 Figure 32. EM38 transect at Haughward Drain. .....................................................................31 Figure 33. Three Ksat pits plus two soil pits for profile description. .........................................32 Figure 34. Normalised water level recovery rate over time, at Kilgin. ....................................32 Figure 35. First Ksat pit on Coraki road at Gollan second pit at Swan bay road......................33 Figure 36. Normalised water level recovery rate over time, in Woodburn area. ....................34 Figure 37. Four Ksat pits at Rocky Mouth Creek. ....................................................................35 Figure 38. Normalised water level recovery rate over time, at Rocky Mouth Creek. .............35 Figure 39. Three Ksat pits in Kilgin area. .................................................................................36 Figure 40. Clarence sites. ......................................................................................................37 Figure 41. Three Ksat pits in Ensbys backswamp plus two EM38 transects. ..........................38 Figure 42. Normalised water level recovery rate over time, at Ensby Lawrence. ..................38 Figure 43. EM38 transect in pasture area from swamp to fenced main drain........................39 Figure 44. EM38 transect in pasture area. .............................................................................40 Figure 45. Two Ksat pits and two EM38 transects at Wooloweyah Lagoon. ...........................40

North Coast NSW Acid Sulfate Soil Ksat Project 5
Figure 46. Normalised water level recovery rate over time, at Wooloweyah Lagoon. ...........41 Figure 47. EM38 transect one at Wooloweyah. .....................................................................42 Figure 48. EM38 transect two at Wooloweyah.......................................................................42 Figure 49. Three Ksat pits in and one EM38 transect at Crows Nest. .....................................43 Figure 50. Normalised water level recovery rate over time, at Crows Nest wetland, .............43 Figure 51. EM38 transect at the forks on the coldstream.......................................................44 Figure 52. Four Ksat pits and two EM38 transects at Arndilly. ................................................45 Figure 53. Normalised water level recovery rate over time, at Arndilly. .................................45 Figure 54. EM38 transect one at scald site, Arndilly. .............................................................46 Figure 55. EM38 transect on north side of The Broadwater...................................................47 Figure 56. One Ksat pit and two EM38 transects, at Farlows. .................................................47 Figure 57. Normalised water level recovery rate over time, at Farlows. ................................48 Figure 58. EM38 transect at Farlows. ....................................................................................49 Figure 59. Clarence site, effect of marine salt intrusion on Melaleuca forest.........................49 Figure 60. Macleay sites. .......................................................................................................50 Figure 61. Five Ksat pits and one EM38 transect, at Rogars...................................................51 Figure 62. Normalised water level recovery rate over time, on Rogars wetland. ...................51 Figure 63. EM38 transect at Rogars property. .......................................................................52 Figure 64. Five Ksat pits and an EM38 transect. .....................................................................53 Figure 65. Normalised water level recovery rate over time, at Clancys Drain........................53 Figure 66. EM38 transect at Clancys drain. ...........................................................................54 Figure 67. Five Ksat pits and an EM38 transect. .....................................................................55 Figure 68. Normalised water level recovery rate over time, Frogmore pasture area. ............55 Figure 69. EM38 transect at Lancaster Drain.........................................................................56 Figure 70. Hastings sites........................................................................................................57 Figure 71. Five Ksat pits and two EM38 transects, at Rossglen..............................................58 Figure 72. Normalised water level recovery rate over time, at Rossglen. ..............................58 Figure 73. Two EM38 transects at Rossglen. ........................................................................59 Figure 74. Hacks ferry Ksat pits. ..............................................................................................60 Figure 75. One Ksat pit in a previous scald area at Torrens Island. ........................................60 Figure 76. Normalised water level recovery rate over time, at Hastings. ...............................61 Figure 77. EM38 transects at Hacks Ferry on the Maria River system ..................................62 Figure 79. Manning sites. .......................................................................................................63 Figure 80. Five Ksat pits and one EM38 transect, at Cattai Creek. .........................................63 Figure 81: Normalised water level recovery rate over time, at Cattai creek...........................64 Figure 82. EM38 Cattai transect from open pasture into Juncus sp and Melaleucas. ...........65 Figure 83. Three Ksat pits, at Templeman...............................................................................66 Figure 84. Normalised water level recovery rate over time, at Templeman. ..........................66 Figure 85. Eight Ksat pits and two EM38 transects, at Roches. ..............................................67 Figure 86. Normalised water level recovery rate over time, at Roches..................................68 Figure 87: EM38 transect, at Roches.....................................................................................69 Figure 88. Roches pit 2 EM38 transect. .................................................................................70 Figure 89. Roches pit 3 EM38 transect. .................................................................................70 Figure 90. Roches EM38 transect pit 4. .................................................................................71 Figure 91. Roches pit 2 in the Manning..................................................................................71 Figure 92. Catchment mean hydraulic conductivity (note: log scale on the y-axis)................72 Figure 93. The frequency distribution of Ksat values for individual pits. ..................................73

North Coast NSW Acid Sulfate Soil Ksat Project 6
Figure 94. The cumulative frequency of Ksat for individual pits and site means ....................74 Figure 95. Standard deviation analysis on Ksat site means. ...................................................75 Figure 96. pH means of groundwater from Ksat pits per catchment........................................76 Figure 97. EC means of groundwater from Ksat pits per catchment. ......................................77
Tables Table 1. Apparent Electrical Conductivity (mS/m) categories in estuarine clay. ....................14 Table 2. Blacks Drain at Tweed, pit water quality and quantitative Ksat data. .........................17 Table 3. Quirks at Tweed, pit water quality and quantitative Ksat data....................................19 Table 4. Clothiers at Tweed, pit water quality and quantitative Ksat data. ...............................21 Table 5. Chinderah at Tweed, pit water quality and quantitative Ksat data..............................23 Table 6. Christies at Tweed, pit water quality and quantitative Ksat data. ...............................25 Table 7. Scanlans Drain at Richmond, pit water quality and quantitative Ksat data. ...............28 Table 8. Haughward at Richmond, pit water quality and quantitative Ksat data. .....................31 Table 9. Coombes at Richmond, pit water quality and quantitative Ksat data. ........................33 Table 10. Woodburn area at Richmond, pit water quality and quantitative Ksat data. .............34 Table 11. Rocky Mouth Creek at Richmond, pit water quality and quantitative Ksat data. ......36 Table 12. Braziers Drain at Richmond, pit water quality and quantitative Ksat data. ...............36 Table 13. Ensby at Clarence, pit water quality and quantitative Ksat data...............................39 Table 14. Wooloweyah at Clarence, pit water quality and quantitative Ksat data. ...................41 Table 15. Crows Nest at Clarence, pit water quality and quantitative Ksat data. .....................44 Table 16. Arndilly at Clarence, pit water quality and quantitative Ksat data.............................46 Table 17. Farlows at Clarence, pit water quality and quantitative Ksat data. ...........................48 Table 18. Rogars at Macleay, pit water quality and quantitative Ksat data. .............................52 Table 19. Clancys Drain at Macleay, pit water quality and quantitative Ksat data. ..................54 Table 20. Frogmore at Macleay, pit water quality and quantitative Ksat data. .........................56 Table 21. Rossglen at Hastings, pit water quality and quantitative Ksat data. .........................59 Table 22. Maria River at Hastings, pit water quality and quantitative Ksat data.......................61 Table 23. Cattai at Manning, pit water quality and quantitative Ksat data................................65 Table 24. Templeman at Manning, pit water quality and quantitative Ksat data. .....................67 Table 25. Roches at Manning, pit water quality and quantitative Ksat data. ............................69 Table 26. Summary of Ksat rates from survey grouped into categories. .................................79

North Coast NSW Acid Sulfate Soil Ksat Project 7
1. Introduction Estuarine wetlands are characterised by complex interactions between vegetation type, surface water fluxes and porewater movement. Hydrology is a key determinate in species distribution, in wetland biomass productivity, nutrient cycling and availability. To be able to understand the intimate relationship between estuarine wetland ecology and hydrology, knowledge of wetland hydrology is critical if we are able to predict and manage change in wetland environments. These include both long-term gradual changes such as climate change and projected sea-level rise, and sudden changes resulting from human interference such as hydraulic modifications to drainage systems and or tidal flow (Hughes et al. 1998). Saturated hydraulic conductivity (Ksat) is a measure (quantitative expression) of a saturated soil’s ability to transmit water when subjected to a hydraulic gradient. Influences include gradients, soil ripeness, macropores, soil type, flow direction, flow rates. Ksat is a critical variable affecting the hydrology and acid export dynamics of drained acid sulfate soils (ASS). Assessment of Ksat in ASS is important in order to design appropriate management strategies for broadacre remediation projects. It has a controlling influence upon the lateral movement of solutes and rates of acidic groundwater drainage plus the behaviour of the groundwater table relative to adjacent drains (Cook et al. 1999; Cook and Rassam, 2002; Johnston et al. 2004).
1.1 Hydraulic conductivity of acid sulfate soils Acidic groundwater seepage towards drains: In ASS the two main hydrological pathways for acid export are surface runoff and groundwater seepage (Fig. 1). When deep, artificial drains intersect sulfuric horizons with high Ksat, groundwater seepage is likely to be a major component of the acid flux and drain water acidity can be acute (Johnston et al. 2002). This is particularly the case if the sulfuric horizons are significantly higher in elevation than tidally influenced low water levels in the adjacent drain (Fig. 1). Saline seepage from drains to soils: High hydraulic conductivity increases the connectivity between drains and adjacent groundwater levels in ASS backswamps. Whilst tidal drawdown in the drain can lower groundwater levels, resulting in a pathway for acidity and other oxidation products, and conversely, high drain water levels can help recharge shallow groundwater and seepage of saline drain water solutes into shallow groundwater for significant distances across the backswamp (Johnston et al. 2005). Shallow groundwater (<1m from the surface) in a backswamp can have high concentrations of acidic metal cations such as iron and aluminium. When combined with a dense drainage network and high hydraulic conductivity soils, groundwater seepage can be an efficient pathway for rapid acid export. Figure 1 following illustrates some typical dynamics and features associated with the two main pathways of acid flux from ASS, groundwater seepage and surface run-off.

North Coast NSW Acid Sulfate Soil Ksat Project 8
Figure 1. Groundwater seepage pathways.
(source: Johnston et al., 2003b)
The Ksat of sulfuric horizons in coastal ASS is a critical factor governing the hydrological behaviour of ASS backswamp groundwater. Therefore some site specific knowledge of Ksat is ideally required to identify skilful management options for the remediation of ASS sites, particularly with regards to:
Identifying pathways of acid export (groundwater seepage vs surface water runoff) Identifying different types of containment strategies Opening floodgates and potential for lateral salt seepage.
Current knowledge of the range and spatial variability of Ksat in sulfuric horizons within ASS in NSW is very limited. To date there have been no systematic spatial surveys of Ksat in coastal ASS floodplains using consistent methodology. There is currently little data on the variability of sulfuric horizon Ksat within floodplain geomorphic units or across individual coastal ASS floodplains.

North Coast NSW Acid Sulfate Soil Ksat Project 9
1.2 Aims This study aims to conduct a quantitative strategic assessment of the range and spatial variability of saturated hydraulic conductivity (Ksat) in shallow sulfuric horizons at important coastal acid sulfate soil (ASS) locations on the North Coast of NSW. A major component of the project is the informal, hands-on training opportunity for local council floodplain officers to conduct the simple and semi-quantitative form of this test (Johnston and Slavich, 2003), and to analyse and interpret data from the Ksat pit tests.
2. Methodology
2.1 Study area The study area consists of six catchments on the North coast of NSW (Tweed, Richmond, Clarence, Hastings, Macleay, and Manning). A number of sites were selected within each catchment in high risk ASS areas in consultation with local council floodplain officers. Ksat can be highly variable over short distances and often varies vertically down the soil profile according to the characteristics of the soil horizons. Ksat can also be different in the horizontal and vertical planes within an individual soil horizon. In ASS backswamps Ksat may be related to the geomorphic history and origins of the underlying sediments, and thus may show some trends related to site topography. Typically, Ksat is highly spatially heterogeneous. The number of pit-tests conducted and location of pits should be related to your data needs. If you want some idea of the variability of Ksat it will be important to construct a number of pits across a site.
Figure 2. Broadwater wetland on the Clarence.

North Coast NSW Acid Sulfate Soil Ksat Project 10
Figure 3. Northern NSW study area.
2.2 Hydraulic conductivity Saturated hydraulic conductivity (Ksat) is a measure (quantitative expression) of a saturated soil’s ability to transmit water when subjected to a hydraulic gradient. Factors which influence Ksat include -soil structure, soil texture, soil ripeness, macropores and soil type. The field measurement of saturated hydraulic conductivity normally combines both macropore and soil matrix flow. Macropores are defined as large voids in the soil, such as from decayed root channels, worm holes or crab burrows and may include structural cleavage or cracks (Australia Soil and Land Survey, 1984). Water flux which is the quantity of water moving through a cross-sectional area per unit time, and is commonly expressed on a volume basis m3m-2s-1, this simplifies to a velocity unit ms-1. Flux is not a velocity rate but represents a volume (discharge) through a cross-sectional area per unit time measure. The (Ksat) of sulfuric horizons documented in this report was measured using an in-situ recovery test based on shallow pit-bailing techniques (Bouwer and Rice, 1983; Boast and Langebartel, 1984; Johnston and Slavich, 2003 pp.1-9).

North Coast NSW Acid Sulfate Soil Ksat Project 11
The Pit-test method (Appendix 9) was selected in part for its simplicity and practicality as a training tool and extension technique. In addition, it is a relatively large scale method, better able to account for high degrees of spatial heterogeneity typical in many soil properties. This is an important consideration for coastal ASS landscapes which may have extensive macropore networks (Johnston et al. 2004). The spatial heterogeneity of Ksat in shallow coastal ASS aquifers means that realistic field scale estimates based on small scale methods (i.e. auger hole slug tests, permeameters, particle size analysis) can be unrepresentative (Millham and Howes, 1995). This is particularly true when groundwater flow is dominated by macropores whose size and spatial variability are high relative to the size of area sampled (Bouma, 1991). For this reason, tests which average aquifer response over larger areas (i.e. pit bailing or tidal signal damping) are far more likely to be representative of actual field Ksat values. This field pit test has a number of advantages and limitations listed in Johnston and Slavich 2003. It was chosen for this project because a) it is amenable to providing an informal learning opportunity, b) it is useful as an extension tool, c) the water level recovery data can be quantitatively analysed using well established methods (i.e. Bouwer and Rice, 1983; Boast and Langebartel, 1984) it is well suited to assessing shallow sulfuric horizons. This single technique was replicated in all six catchments, for comparative assessment. 2.2.1 Pit geometry Shallow rectangular pits (up to 0.6 m deep and 0.5 m2) were excavated at strategic locations in each surveyed backswamp, with sites chosen in consultation with local council officers. Pit dimensions and the equilibrium water level before bailing were recorded (Fig. 3). The water was bailed rapidly using a 10 L bucket to remove ~50-90% of the total water in the pit. Water level recovery was measured every 5 or 20 seconds on a ruler with 1mm graduations. Two tests were conducted in each pit. Ksat was quantitatively calculated according to the methods of Bouwer and Rice (1983) and Boast and Langebartel (1984). In the latter case shape factors developed specifically for rectangular pit geometries were used (Boast and Langebartel 1984, pp 12). Pit dimensions were chosen to reduce the range of L/W (Fig. 3) encountered and thus constrain the range of shape factors employed by the different methods.
Figure 4. The geometry of excavations used in pit bailing methods.
A full description of the physical aspects of the method provided in Appendix 9.

North Coast NSW Acid Sulfate Soil Ksat Project 12
Figure 5. Thor Aaso using a gouge auger in a Ksat pit, in the Hastings. 2.2.2 Additional data collected Additional information collected in the field with the pit infill data includes:
1. A soil profile description, 2. A sample of groundwater (GW) collected from infill after bailing. Measurements include pH, and Electrical Conductivity (EC), with a TPS 90FLMV portable water quality meter. 3. The Geonics EM38 electromagnetic induction meter used to determine rootzone salinity in areas with shallow saline water tables. This EM38 survey technique used at a number of Ksat sites to survey apparent soil EC, both at the surface and at a depth of ~1 m. The EM38 is non-invasive, is timely and allows surveys over a wide area. 4. GPS co-ordinates of sites listed in appendix 1.
Figure 6. Chrisy Clay and Phil Hirst with EM38 meter.

North Coast NSW Acid Sulfate Soil Ksat Project 13
3. Interpreting data
3.1 Ksat graphs The pit refill graphs indicate the raw values collected in the field. The resultant plot shows the normalised pit refill rate verses time. The plot line will fall into one of four broad categories listed below which approximate the following Ksat ranges. Note that this method of plotting the data provides an approximation only. Actual quantitative Ksat values are listed in Tables and are derived using two methods - Bouwer and Rice, 1983 and Boast and Langebartel, 1984.
Low = less than 1.5m day-1 Medium = 1.5 to 15m day-1 High = 15 to 100m day-1 Extreme = greater than 100m day-1
3.2 Graph and Table interpretation Sites with Low range Ksat, the risk of lateral water seepage is likely to be minimal, either influent (i.e. the drain water level is higher than the groundwater level) or effluent. For sites in the medium Ksat range, further quantitative assessment of Ksat may be warranted in order to assess the risk of lateral salt seepage due to a floodgate opening. Monitoring the response of drain and ground water levels during a freshwater floodgate opening event may also be useful. If a sites Ksat falls in the high to extreme range there is a substantial probability that groundwater seepage may be a major hydrological pathway of acid export. If the shallow groundwater is also highly acidic then a containment strategy will likely be an important management option. This includes options such as containing groundwater by a) reducing drainage density via infilling or shallowing drains, or b) by using a retention structure to keep drain water levels high and stable to prevent the development of effluent groundwater gradients through tidal drawdown. If floodgates opened and saline water introduced into a drain there is also a possibility that this saline water could move laterally away from the drain over considerable distances. Other factors to consider which will influence a sites hydrological behaviour include,
the elevation of acidic horizons relative to local low tide levels in adjacent drains, whether the drain intercepts those high Ksat soil horizons, whether there is the existence of semi-confining layers via pugging and blockages of
macropores at the drain bank face, post-deposition vegetation history.

North Coast NSW Acid Sulfate Soil Ksat Project 14
3.3 EM38 charts The Geonics electromagnetic induction soil conductivity meter, measures apparent electrical conductivity (ECa) of soil in situ. Two types of ECa measurements can be made, horizontal readings (EMh) for surface salts and vertical readings (EMv) measures from 1m to 1.5m at depth. If EMh>EMv then salts are highest near the surface. In low lying floodplain environments high ECa readings are often correlated with acidic and/or marine solutes and thus can be a useful surrogate to indicate oxidised acid sulfate soils or areas of past/present tidal inundation. Table 1. Apparent Electrical Conductivity (mS/m) categories in estuarine clay.
Coastal floodplain Low Medium High Very High
Estuarine clay dominate landscape <100 100-200 200-400 >400
Figure 7. EM38 at Farlows on the Clarence.

North Coast NSW Acid Sulfate Soil Ksat Project 15
4. Results
4.1 Tweed River Catchment Sites
Figure 8. Tweed site

North Coast NSW Acid Sulfate Soil Ksat Project 16
4.1.1 Blacks Drain
Figure 9. Five Ksat pit locations and two EM38 transects (Legend: appendix 7). (source: Naylor et al., 1998)
0.0
0.1
0.2
0.3
0.4
0.5
0.6
0.7
0.8
0.9
1.0
0 100 200 300 400 500 600
Time (seconds)
% o
f bai
led
volu
me
High KsatExtreme Ksat
Low Ksat
Moderate Ksat
Tweed: Blacks Drain 121107
Pit 2
Pit 1
Pit 3
Pit 4
Pit 5
Figure 10. Normalised water level recovery rate over time, Stainley cane field.
Soil description: Few to common mottling in all pits, macropores both vertical and
horizontal orientation, few in abundance but fine to medium in diameter. Occasional old solid roots at depth, may indicate old forest area.

North Coast NSW Acid Sulfate Soil Ksat Project 17
Table 2. Blacks Drain at Tweed, pit water quality and quantitative Ksat data. Ground water
quality Hydraulic conductivity (m day-1)
EC Pit No. Pit depth
(cm)
Water table depth (cm)
pH (ds m-1)
Bouwer and Rice
(1983)
Boast and Langebartel
(1984) L/W
1 55 34.4 3.63 1.39 3.25 4.59 0.66 2 50 25.0 3.60 2.06 5.04 7.12 0.77 3 50 34.3 1.65 2.00 0.42 4 57 18.4 4.00 0.65 1.03 1.88 0.93 5 60 46.3 3.65 2.40 1.30 1.82 0.44
Tweed: Blacks Drain(Stainley)
0
20
40
60
80
100
120
140
160
0 4 10 30 50 70 90 110 130 150 170 190 210 230 1 3 5 7 9
(m)
(mS/
m) E
stim
ate
App
aren
tC
ondu
ctiv
ity
Vertical Horizontal
Main discharge drain
laneway/headland
Infield wet drain
Figure 11. Blacks drain transect across cane field.
Transect from main drain to lower elevation area, intersects infield drain at 230m,
drain holding water. Second transect continues perpendicular to infield drain finishing in centre of mounded cane bed.

North Coast NSW Acid Sulfate Soil Ksat Project 18
4.1.2 McLeods Creek
Figure12. Seven Ksat pit locations and an EM38 transect at McLeods Creek.
(source: Naylor et al., 1998)
0.0
0.1
0.2
0.3
0.4
0.5
0.6
0.7
0.8
0.9
1.0
0 100 200 300 400 500 600
Time (seconds)
% o
f bai
led
volu
me
High KsatExtreme Ksat
Low Ksat
Moderate Ksat
Tweed: Quirk 131107 and 151107
High Ksat
Pit 5
Pit 3
Pit 7
Pit 1
Pits 2,4,6
Figure 13. Normalised water level recovery rate over time, Quirks cane field.
Pits located in ratoon cane paddock adjacent to tidal main drain.

North Coast NSW Acid Sulfate Soil Ksat Project 19
Soil description: Alluvial topsoil to medium clay subsoil. Few orange red mottles present in all pits. Macropores common, fine diameter, vertical orientation more dominate, pores visible above water table. Jarosite and old reed/root remnants found at depth.
Table 3. Quirks at Tweed, pit water quality and quantitative Ksat data.
Ground water quality Hydraulic conductivity (m day-1)
EC Pit No. Pit depth
(cm)
Water table depth (cm)
pH (ds m-1)
Bouwer and Rice
(1983)
Boast and Langebartel
(1984) L/W
1 56 21.9 4.02 3.23 3.27 6.14 1.12
2 51 24.9 3.71 3.49 3.20 5.27 0.76
3 50 18.5 3.62 3.70 1.59 3.41 0.91
4 63 20.9 3.76 7.03 3.94 8.09 1.07
5 60 42.3 3.71 5.43 6.60 10.83 0.65
6 65 54.3 3.78 8.14 3.47 4.05 0.35
7 60 47.9 3.83 7.03 3.12 3.73 0.37
Tweed: McLeods Creek
0
50
100
150
200
250
300
350
0 5 10 20 40 60 80 100 120 140 160 180(m)
(mS/
m) E
stim
ate
App
aren
tC
ondu
ctiv
ity
Vertical Horizontal
Main tidal drain
Figure 14. EM38 Quirk cane field.
EM38 transect from main tidal drain moving perpendicular into lower elevation area of
cane field.

North Coast NSW Acid Sulfate Soil Ksat Project 20
4.1.3 Clothiers Creek
Figure 15. Five Ksat pits and an EM38 transect.
(source: Naylor et al., 1998)
0.0
0.1
0.2
0.3
0.4
0.5
0.6
0.7
0.8
0.9
1.0
0 100 200 300 400 500 600
Time (seconds)
% o
f bai
led
volu
me
High KsatExtreme Ksat
Low Ksat
Moderate Ksat
Tweed: Clothiers 141107
High Ksat
Low Ksat
Moderate Ksat
Pit 4
Pit 1
Pit 5 Pit 2
Pit 3
Figure 16. Normalised water level recovery rate over time, at Clothiers.
Clothiers hotspot remediation site, number of drains filled in, extensive soil
disturbance reflected in range of Ksat rates and soil profile descriptions.

North Coast NSW Acid Sulfate Soil Ksat Project 21
Soil description: Alluvial/peat topsoil with peat to depth. Little to no mottling observed, medium to common macropores, horizontal orientation the common.
Table 4. Clothiers at Tweed, pit water quality and quantitative Ksat data.
Ground water quality Hydraulic conductivity (m day-1)
EC Pit No. Pit depth
(cm)
Water table depth (cm)
pH (ds m-1)
Bouwer and Rice
(1983)
Boast and Langebartel
(1984) L/W
1 38 11.5 3.13 4.19 19.34 33.03 0.75
2 46 18.7 3.86 1.50 3.15 6.41 0.76
3 44 6.9 3.06 3.89 2.19 5.14 1.05
4 53 10.2 3.16 3.93 56.25 104.46 1.06
5 44 16.9 3.25 2.43 10.32 16.98 0.75
Tweed: Clothiers Creek
0
20
40
60
80
100
120
0 40 70 130 180 240 340 345 350 360 370 380 390 400(m)
(mS/
m) E
stim
ate
App
aren
tC
ondu
ctiv
ity
Vertical Horizontal
Ponding
Figure 17. Clothiers Creek EM38 transect.
Transect, between ponded areas abundant with water couch, crossing drain at about
340m.

North Coast NSW Acid Sulfate Soil Ksat Project 22
4.1.4 Chinderah
Figure 18. Five Ksat pits and an EM38 transect.
(source: Naylor et al., 1998)
0.0
0.1
0.2
0.3
0.4
0.5
0.6
0.7
0.8
0.9
1.0
0 100 200 300 400 500 600
Time (seconds)
% o
f bai
led
volu
me
High KsatExtreme Ksat
Moderate Ksat
Tweed: Chinderah 141107
High Ksat
Low Ksat
Moderate Ksat
Pits 1,2,3,4,5
Figure 19. Normalised water level recovery rate over time, Chinderah cane field site.
Soil description: Soil sandy alluvial to a yellow sand at depth. Very few mottles,
orange in color, very few macropores. Slight slumping of pit sides in water table and only one pit bailing per pit completed.

North Coast NSW Acid Sulfate Soil Ksat Project 23
Table 5. Chinderah at Tweed, pit water quality and quantitative Ksat data.
Ground water quality Hydraulic conductivity (m day-1)
EC Pit No. Pit depth
(cm)
Water table depth (cm)
pH (ds m-1)
Bouwer and Rice
(1983)
Boast and Langebartel
(1984) L/W
1 65 58.6 4.17 0.306 1.17 1.06 0.21
2 65 56.1 4.66 0.157 1.02 0.95 0.24
3 57 46.0 4.60 0.195 0.50 0.51 0.33
4 55 41.3 4.60 0.224 0.83 0.86 0.40
5 60 40.1 4.65 0.160 0.44 0.59 0.62
Tweed: Chinderah
0
1
2
3
4
5
6
7
8
9
10
0 20 40 60 80 100 120 140 160 180 200 220 240 260 280 300
(m)
(mS/
m) E
stim
ate
App
aren
tC
ondu
ctiv
ity
Vertical Horizontal
Tidal drain
Cane area
Cane fallow
Figure 20. Chinderah EM38 transect
Transect across cane field from tidal drain to cane fallow area, finishing next to infield
drain. Low Apparent EC levels indicated. Sand dominate profile.

North Coast NSW Acid Sulfate Soil Ksat Project 24
4.1.5 Christies
Figure 21. Four Ksat pits and an EM38 transect, at Christies coastal oak forest.
(source: Naylor et al., 1998)
0.0
0.1
0.2
0.3
0.4
0.5
0.6
0.7
0.8
0.9
1.0
0 100 200 300 400 500 600
Time (seconds)
% o
f bai
led
volu
me
High Ksat
Extreme Ksat
Low Ksat
Moderate Ksat
Tweed: Christies 151107
Pits 1,2,3, 4
Figure 22. Normalised water level recovery rate over time, at Christies.

North Coast NSW Acid Sulfate Soil Ksat Project 25
Soil description: Soil a black silty peaty loam to depth. Weak mottling found, jarosite at depth. Pits rapid infill, many macropores i.e. coarse diameter with dominate horizontal orientation.
Site description: An extreme site (highest recorded in survey) to sample, difficult to
bail pit due to extremely rapid infil. Pit walls began to crumble from groundwater movement due to soils peat content. Site heavily forested with a dense green broadleaf ground cover. Site on western side of coastal forest, 2.4km from coast.
Table 6.Christies at Tweed, pit water quality and quantitative Ksat data.
Ground water quality Hydraulic conductivity (m day-1)
EC Pit No. Pit depth
(cm)
Water table depth (cm)
pH
(ds m-1)
Bouwer and Rice
(1983)
Boast and Langebartel
(1984) L/W
1 50 38.6 3.56 4.13 >500 >500 0.33
2 51 37.9 3.61 6.61 >500 >500 0.42
3 50 36.4 3.80 4.98 >500 >500 0.40
4 56 36.3 3.91 4.52 >500 >500 0.51
Tweed: Christies Creek
0
50
100
150
200
250
300
0 10 20 30 40 50 60 70 80 90 100 110 120 130 140 150 160 170
(m)
(mS/
m) E
stim
ate
App
aren
tC
ondu
ctiv
ity
Vertical Horizontal
Main drain
Dense oak forest and groundcover
Figure 23. EM38 transect, Christies Creek.
EM38 readings consistent (i.e. between Vertical and Horizontal readings), EC
increasing moving further into oak forest under forest canopy.

North Coast NSW Acid Sulfate Soil Ksat Project 26
4.2 Richmond River Catchment Sites
Figure 24. Richmond sites.

North Coast NSW Acid Sulfate Soil Ksat Project 27
4.2.1 Scanlans drain
Figure 25. Two Ksat pits plus three EM38 transects. (source: Naylor et al., 1998)
0.0
0.1
0.2
0.3
0.4
0.5
0.6
0.7
0.8
0.9
1.0
0 100 200 300 400 500 600
Time (seconds)
% o
f bai
led
volu
me
High KsatExtreme Ksat
Low Ksat
Moderate Ksat
Richmond: Scanlans Drain 201107
High Ksat
Low Ksat
Moderate Ksat
Pit 1
Pit 2
Figure 26. Normalised water level recovery rate over time, Scanlans two sites.
Pit 1 edge of cane field and drain, and Pit 2, in forest area 100m from Scanlans
drain.

North Coast NSW Acid Sulfate Soil Ksat Project 28
Soil description: Pit 1, Black topsoil to a brown peat and into a dark clay peat at depth, abundant roots to depth. No mottling or macropores visible. A low Ksat site. Vegetation a mix of setaria and paspalum. Pit 2, Black topsoil to a light coloured clay to a clay sand at depth. Very few reddish mottles. Fine common macropores, visible, both vertical and horizontal orientation.
Table 7. Scanlans Drain at Richmond, pit water quality and quantitative Ksat data.
Ground water quality
Hydraulic conductivity (m day-1)
EC Pit No. Pit depth
(cm)
Water table depth (cm)
pH (ds m-1)
Bouwer and Rice
(1983)
Boast and Langebartel
(1984) L/W
1 48 25.95 4.31 0.49 1.13 1.45 0.60
2 40 28.25 3.47 1.19 18.03 20.46 0.37
Richmond: Scanlan Drain(Pit 2)
0
5
10
15
20
25
30
35
40
45
50
0 20 40 60 80 100 120
(m)
(mS/
m) E
stim
ate
App
aren
tC
ondu
ctiv
ity
Vertical Horizontal
Pit 2 ScanlanDrain
Drain levee
Figure 27. EM38 transect from pit 2.
From a mixed forest of melaleuca, casuarina, and camphor laurel, to main drain.

North Coast NSW Acid Sulfate Soil Ksat Project 29
Richmond: Scanlan Drain(NR1)
0
20
40
60
80
100
120
140
160
180
200
0 2 10 20 40 60 80 100 120 140 160 180 200
(m)
(mS/
m) E
stim
ate
App
aren
tC
ondu
ctiv
ity
Vertical Horizontal
Drain Small crossdrain
Figure 28. EM38 transect from main drain to a cross drain along cane headland.
Transect parallel to drain and next to cane field. Casuarina seedlings invading cane
field. Management of drain under review.
Richmond: NR1(Meat-E-Vite)
0
10
20
30
40
50
60
70
80
0 20 40 60 80 100 120 140 160 180 200 220
(m)
(mS/
m) E
stim
ate
App
aren
tC
ondu
ctiv
ity
Vertical Horizontal
DrainMid-field
Shallow water-filleddrain
Figure 29. EM38 transect moving away from drain to middle of field.
Possibly lower elevation away from the shallow water-filled drain. Hill area
approximately 500m further on, with a draft plan subdivision.

North Coast NSW Acid Sulfate Soil Ksat Project 30
4.2.2 Haughwood road and Bora-Codrington
Figure 30. Two Ksat pits at Haughward road and one at Bora-Codrington. (source: Naylor et al., 1998)
0.0
0.1
0.2
0.3
0.4
0.5
0.6
0.7
0.8
0.9
1.0
0 100 200 300 400 500 600
Time (seconds)
% o
f bai
led
volu
me
High KsatExtreme Ksat
Low Ksat
Moderate Ksat
High Ksat
Low Ksat
Moderate Ksat
Pit 1Pit 2
Richmond: Haughward 211107
Figure 31. Normalised water level recovery rate over time, at Haughward.
Pit 1 about 30m from main drain, Pit 2 about 400m from drain.

North Coast NSW Acid Sulfate Soil Ksat Project 31
Soil description: At south pasture, a black peat clay to a clay loam at depth. Roots abundant to depth, mottling in root channels, few reddish mottles. Few fine macropores both vertical and horizontal, jarosite at depth.
Table 8. Haughward at Richmond, pit water quality and quantitative Ksat data.
Ground water quality Hydraulic conductivity (m day-1)
EC Pit No. Pit depth
(cm)
Water table depth (cm)
pH
(ds m-1)
Bouwer and Rice
(1983)
Boast and Langebartel
(1984) L/W
1 55 37.9 3.37 1.97 174.28 231.19 0.54
2 60 48.0 3.59 1.84 11.33 12.71 0.40
Richmond: Haughward Drain
0
20
40
60
80
100
120
0 20 40 60 80 100 120 140 160 180 200 220 240 260 280 300 320 340 360
(m)
(mS/
m) E
stim
ate
App
aren
tC
ondu
ctiv
ity
Vertical Horizontal
Fence line
Main drain
Pit 1Pit 2
Figure 32. EM38 transect at Haughward Drain.
Pasture area, history of chronic black water events. Possible old cropping area due
to observations of mounded beds. (i.e. shallow surface drains every 20m).

North Coast NSW Acid Sulfate Soil Ksat Project 32
4.2.3 Kilgin near Woodburn
Figure 33. Three Ksat pits plus two soil pits for profile description. (source: Naylor et al., 1998)
0.0
0.1
0.2
0.3
0.4
0.5
0.6
0.7
0.8
0.9
1.0
0 100 200 300 400 500 600
Time (seconds)
% o
f bai
led
volu
me
High KsatExtreme Ksat
Low Ksat
Moderate Ksat
Richmond: Kilgin 020408
High KsatHigh Ksat
Pit 1
Pit 2
Pit 3
Figure 34. Normalised water level recovery rate over time, at Kilgin.
Coombes pasture block at Kilgin, encompassed by cane fields.

North Coast NSW Acid Sulfate Soil Ksat Project 33
Soil description: Pits in the moderate Ksat range, but all soil profiles show evidence of Fe migration. Few bright orange and prominent mottles. Fine common macropores with greater vertical orientation. Iron (Fe) in swirls and nodules (coarse grit), at mid depths and Jarosite at depth. Pit 3 nearest main drain.
Table 9. Coombes at Richmond, pit water quality and quantitative Ksat data.
Ground water quality Hydraulic conductivity (m day-1)
EC Pit No. Pit depth
(cm)
Water table depth (cm)
pH (ds m-1)
Bouwer and Rice
(1983)
Boast and Langebartel
(1984) L/W
1 50 27.75 5.22 5.43 4.30 6.28 0.67
2 50 30.9 5.51 3.25 3.40 4.51 0.56
3 50 20.2 3.73 7.02 1.76 2.72 0.76
4.2.4 Gollan and Swan Bay
Figure 35. First Ksat pit on Coraki road at Gollan second pit at Swan bay road. (source: Naylor et al., 1998)

North Coast NSW Acid Sulfate Soil Ksat Project 34
0.0
0.1
0.2
0.3
0.4
0.5
0.6
0.7
0.8
0.9
1.0
0 100 200 300 400 500 600
Time (seconds)
% o
f bai
led
volu
me
High KsatExtreme Ksat
Low Ksat
Moderate Ksat
Richmond: 140508
High Ksat
Low Ksat
Moderate Ksat
High Ksat
Pit 1 at Gollan
Pit 2 atSwan Bay
Pit 3 atBora-Codrington
Figure 36. Normalised water level recovery rate over time, in Woodburn area.
Pit 1 west of Woodburn, next to laneway and drain. Pit 2 north-west of Woodburn in a
low fallowed cultivated cane field. Pit 3 at Bora-Codrington.
Soil description: Pit 1, edge of laneway between cane and shallow drain. Compacted surface layers to 50cm, strong H2S odour. Black topsoil to grey clay to orange peat to clay peat at depth. Mottling very few dull red. Vertical few and fine macropores. Pit 2, Black soil down to 1m, to orange peat clay to black peat clay at depth. Possible soil disturbance in this low area. No mottles but horizontal fine few (3 large pores prominent) macropores. Infield drain 10m holding water, thick Fe flocc coating drain walls and water crystal clear. Pit 3 open pasture black peat topsoil to grey clay to peat clay at depth. Very few mottling in old root channels. Vertical medium few macropores.
Table 10. Woodburn area at Richmond, pit water quality and quantitative Ksat data.
Ground water quality Hydraulic conductivity (m day-1)
EC Pit No. Pit depth
(cm)
Water table depth (cm)
pH (ds m-1)
Bouwer and Rice
(1983)
Boast and Langebartel
(1984) L/W
1 55 41.9 3.00 2.10 13.83 15.72 0.42
2 64 39.4 3.70 1.67 4.92 7.65 0.78
3 39 25.9 3.62 1.18 29.26 30.80 0.42

North Coast NSW Acid Sulfate Soil Ksat Project 35
4.2.5 Rocky Mouth Creek
Figure 37. Four Ksat pits at Rocky Mouth Creek. (source: Naylor et al., 1998)
0.0
0.1
0.2
0.3
0.4
0.5
0.6
0.7
0.8
0.9
1.0
0 100 200 300 400 500 600
Time (seconds)
% o
f bai
led
volu
me
High KsatExtreme Ksat
Low Ksat
Moderate Ksat
Pit 1 on 190907
Richmond: Rocky Mouth Creek 190907 and 301008Pits 2 and 4Pit 3
Figure 38. Normalised water level recovery rate over time, at Rocky Mouth Creek.
Site description: Pit located approximately 40m from new weir structure. Result
indicates the potential for high connectivity for this large wetland.

North Coast NSW Acid Sulfate Soil Ksat Project 36
Table 11. Rocky Mouth Creek at Richmond, pit water quality and quantitative Ksat data.
Ground water quality Hydraulic conductivity (m day-1)
EC Pit No. Pit depth
(cm)
Water table depth (cm)
pH
(ds m-1)
Bouwer and Rice
(1983)
Boast and Langebartel
(1984) L/W
1 45 23 36.94 58.78 0.73 2 72 53 3.59 4.98 133.89 160.66 0.48 3 70 48 3.66 5.49 75.68 98.38 0.54 4 64 41 3.78 5.45 109.96 148.91 0.59
4.2.6 Braziers Drain
Figure 39. Three Ksat pits in Kilgin area. (source: Naylor et al., 1998)
Table 12. Braziers Drain at Richmond, pit water quality and quantitative Ksat data.
Ground water quality
Hydraulic conductivity (m day-
1)
EC Pit No.
Pit depth (cm)
Water table depth (cm)
pH
(ds m-1)
Bouwer and Rice
(1983)
Boast and Langebartel
(1984) L/W
3 50 50 3.74 4.93
North Coast NSW Acid Sulfate Soil Ksat Project 37
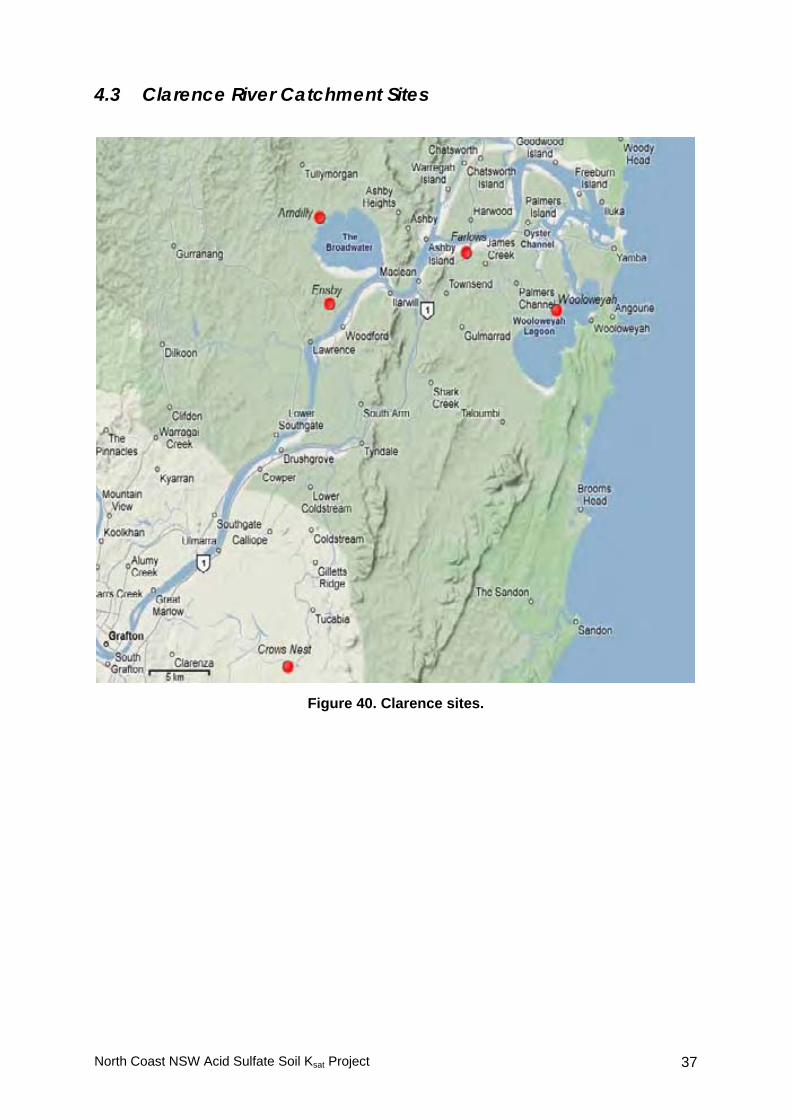
4.3 Clarence River Catchment Sites
Figure 40. Clarence sites.

North Coast NSW Acid Sulfate Soil Ksat Project 38
4.3.1 Clarence Site at Ensbys
Figure 41. Three Ksat pits in Ensbys backswamp plus two EM38 transects. (source: Naylor et al., 1998)
0.0
0.1
0.2
0.3
0.4
0.5
0.6
0.7
0.8
0.9
1.0
0 100 200 300 400 500 600
Time (seconds)
% o
f bai
led
volu
me
High Ksat
Low Ksat
Moderate Ksat
High Ksat
Low Ksat
High KsatExtreme Ksat
Low Ksat
Pit 3
Pit 2
Pit 1
Clarence: Ensby (Lawrence) 120308
Figure 42. Normalised water level recovery rate over time, at Ensby Lawrence.

North Coast NSW Acid Sulfate Soil Ksat Project 39
Soil description: Soil profile black alluvial topsoil down to medium clay subsoil, thin sand lens about 60-70cm depth. Pits 1 and 2 mottling many and prominent orange colour. Pit 3 in second paddock, very few mottles dark red in color. Macropores both vertical and horizontal in orientation.
Table 13. Ensby at Clarence, pit water quality and quantitative Ksat data.
Ground water quality Hydraulic conductivity (m day-1)
EC Pit No. Pit depth
(cm)
Water table depth (cm)
pH
(ds m-1)
Bouwer and Rice
(1983)
Boast and Langebartel
(1984) L/W
1 47 32.5 3.95 4.98 4.39 5.77 0.45
2 50 40.9 4.00 4.78 6.65 7.31 0.30
3 52 38.0 4.98 4.58 5.95 7.68 0.45
Clarence: Ensby 1
0
20
40
60
80
100
120
140
160
180
200
220
0 10 20 30 40 50 60 70 80 90 100
(m)
(mS/
m) E
stim
ate
App
aren
tC
ondu
ctiv
ity
Vertical Horizontal
Ponded area
fence line next to main drain
Figure 43. EM38 transect in pasture area from swamp to fenced main drain.

North Coast NSW Acid Sulfate Soil Ksat Project 40
Clarence: Ensby 2
0
20
40
60
80
100
120
140
160
180
200
0 10 20 30 40 50 60 70 80 90 100 110 120
(m)
(mS/
m) E
stim
ate
App
aren
t C
ondu
ctiv
ity
Vertical Horizontal
low depression area
paddock central
Small hill(possible old levee)
Figure 44. EM38 transect in pasture area.
Transect passes through a drained depression area.
4.3.2 Wooloweyah Lagoon
Figure 45. Two Ksat pits and two EM38 transects at Wooloweyah Lagoon. (source: Naylor et al., 1998)

North Coast NSW Acid Sulfate Soil Ksat Project 41
0.0
0.1
0.2
0.3
0.4
0.5
0.6
0.7
0.8
0.9
1.0
0 100 200 300 400 500 600
Time (seconds)
% o
f bai
led
volu
me
High KsatExtreme Ksat
Low Ksat
Moderate Ksat
Clarence: Wooloweyah 130308
High Ksat
Low Ksat
Moderate Ksat
Pit 1
Pit 2
Figure 46. Normalised water level recovery rate over time, at Wooloweyah Lagoon.
Pits located between Wooloweyah Lagoon and Palmers channel.
Soil description: Couch pasture, soil profile from dark grey black topsoil to silty grey
clay increasing in sand content. No mottling observed with very few macropores evident.
Table 14. Wooloweyah at Clarence, pit water quality and quantitative Ksat data.
Ground water quality Hydraulic conductivity (m day-1)
EC Pit No. Pit depth
(cm)
Water table depth (cm)
pH
(ds m-1)
Bouwer and Rice
(1983)
Boast and Langebartel
(1984) L/W
1 55 32.32 6.11 45.0 1.59 2.22 0.69
2 48 22.2 6.15 38.2 2.16 3.03 0.76

North Coast NSW Acid Sulfate Soil Ksat Project 42
Clarence: Wooloweyah 1
0
200
400
600
800
1000
1200
0 5 10 15 20 25 30 35 40 45 50 55 60 65 70 75 80 85 90 95 100 105 110 115 120
(m)
(mS/
m) E
stim
ate
App
aren
t C
ondu
ctiv
ity
Vertical Horizontal
Ponded
Gravel road
Palmers channel
Figure 47. EM38 transect one at Wooloweyah.
Transect from palmers channel across gravel road to ponded area. Transect
approximately 100m from shoreline of lake. Salt water intrusion possible at peak tides. Extremely high values consistent with marine salt intrusion at both depth and on the surface.
Clarence: Wooloweyah 2
0
200
400
600
800
1000
1200
0 5 10 15 20 25 30 35 40 45 50 55 60 65 70 75 80 85 90
(m)
(mS/
m) E
stim
ate
App
aren
tC
ondu
ctiv
ity
Vertical Horizontal
Ring drain
Ponded
Figure 48. EM38 transect two at Wooloweyah.
Second transect perpendicular to first transect. Originates at ring drain
(approximately 80m from palmers channel) finishing at a ponded area.
North Coast NSW Acid Sulfate Soil Ksat Project 43
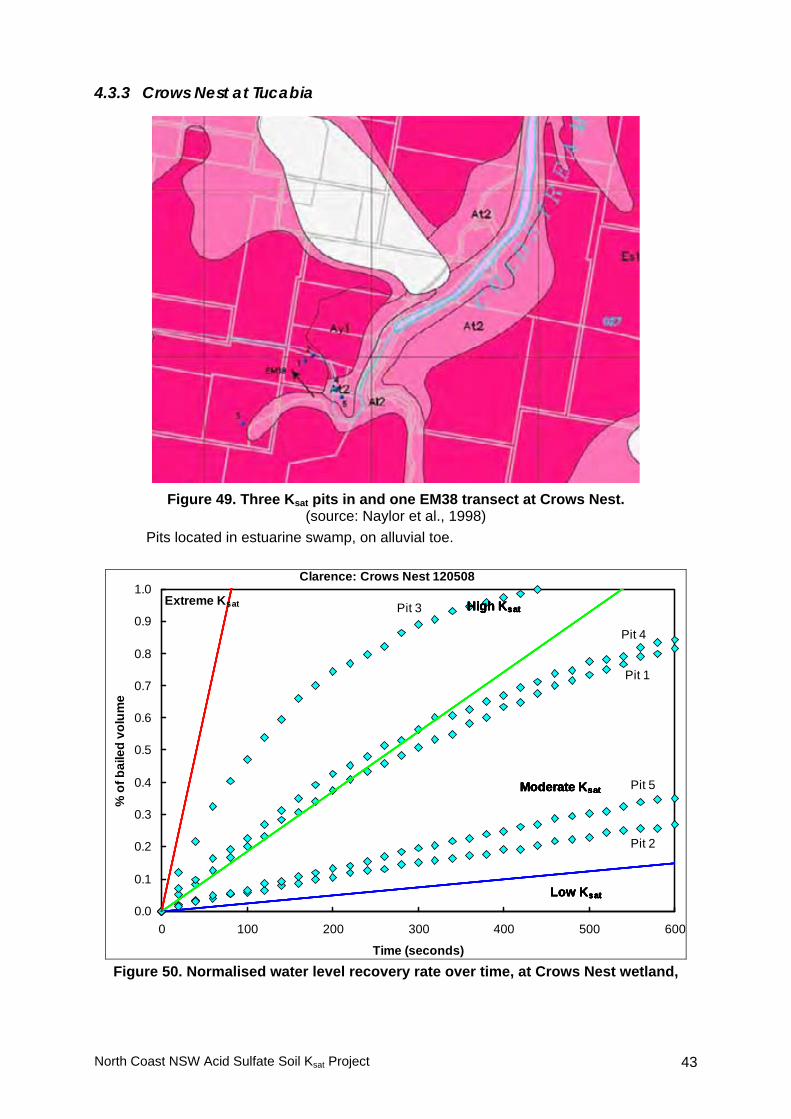
4.3.3 Crows Nest at Tucabia
Figure 49. Three Ksat pits in and one EM38 transect at Crows Nest.
(source: Naylor et al., 1998) Pits located in estuarine swamp, on alluvial toe.
0.0
0.1
0.2
0.3
0.4
0.5
0.6
0.7
0.8
0.9
1.0
0 100 200 300 400 500 600
Time (seconds)
% o
f bai
led
volu
me
High KsatExtreme Ksat
Low Ksat
Moderate Ksat
Clarence: Crows Nest 120508
High Ksat
Low Ksat
Moderate Ksat
High Ksat
Low Ksat
Moderate Ksat
High Ksat
Low Ksat
Moderate Ksat
High Ksat
Low Ksat
Moderate Ksat
Pit 3
Pit 4
Pit 1
Pit 5
Pit 2
Figure 50. Normalised water level recovery rate over time, at Crows Nest wetland,

North Coast NSW Acid Sulfate Soil Ksat Project 44
Soil description: Pit 2, located 30m from floodgates, possible previous soil disturbance, compared to Pit 1, located 60m from floodgates, abundant fine old root channels. Pit 3 mid wetland, history of long periods of inundation, macropores common with vertical orientation with some dull red mottling. Pit 4 located in shallow drain, few red mottles with vertical macropores. Pit 5, in shallow scald depression, few vertical macropores with very few orange/red mottles. Soil Profil, black topsoil to medium clay gels at depth.
Table 15. Crows Nest at Clarence, pit water quality and quantitative Ksat data.
Ground water quality Hydraulic conductivity (m day-1)
EC Pit No. Pit depth
(cm)
Water table depth (cm)
pH (ds m-1)
Bouwer and Rice
(1983)
Boast and Langebartel
(1984) L/W
1 34 20.3 5.65 6.53 9.02 10.61 0.39
2 44 26.1 5.41 5.45 1.70 2.26 0.54
3 30 19.6 5.09 3.36 36.00 34.74 0.26
4 33 19.1 4.56 5.69 11.28 12.78 0.40
5 38 22.4 4.58 6.37 3.22 3.94 0.48
Clarence: Crows Nest
0
50
100
150
200
250
300
0 10 20 30 40 50 60 70 80 90 100 110 120
(m)
(mS/
m) E
stim
ate
App
aren
tC
ondu
ctiv
ity
Vertical Horizontal
Edge of Forks drain
Built up headland
Ponded areaDecreasing
elevation
Figure 51. EM38 transect at the forks on the coldstream.
Transect from the edge of the Forks drain over a wide built-up (possible drain spoil)
headland out into pasture finishing on edge of ponded area. Note the increase in Apparent EC progressing into wetland.

North Coast NSW Acid Sulfate Soil Ksat Project 45
4.3.4 The Broadwater at Arndilly
Figure 52. Four Ksat pits and two EM38 transects at Arndilly.
(source: Naylor et al., 1998) Pits located between estuarine swamp and alluvial floodplain.
0.0
0.1
0.2
0.3
0.4
0.5
0.6
0.7
0.8
0.9
1.0
0 100 200 300 400 500 600
Time (seconds)
% o
f bai
led
volu
me
High Ksat
Low Ksat
Moderate Ksat
High Ksat
Low Ksat
Moderate Ksat
High Ksat
Low Ksat
Moderate Ksat
High KsatExtreme Ksat
Low Ksat
Moderate Ksat
Clarence: Arndilly 130508
Pit 3
Pit 4
Pit 2
Pit 1
Figure 53. Normalised water level recovery rate over time, at Arndilly.

North Coast NSW Acid Sulfate Soil Ksat Project 46
Soil description: Pits 1 and 2 Surface scalds, medium clay subsoil, mottles abundance common, colour pale yellow to yellow, few visible macropores with vertical and horizontal orientation. Pit 3, peat surface into clay sand profil, no visible macropores. Pit 4 salt water couch dominate, mottles with vertical macropores.
Table 16. Arndilly at Clarence, pit water quality and quantitative Ksat data.
Ground water quality Hydraulic conductivity (m day-1)
EC Pit No. Pit depth
(cm)
Water table depth (cm)
pH
(ds m-1)
Bouwer and Rice
(1983)
Boast and Langebartel
(1984) L/W
1 42 27.55 3.87 23.3 5.93 6.97 0.41
2 34 14.07 3.81 23.4 5.77 7.90 0.57
3 49 24.54 5.22 22.8 1.31 2.16 0.76
4 40 24.25 3.75 22.6 6.20 7.75 0.46
Clarence: Arndilly scald area
0
100
200
300
400
500
600
700
0 5 10 15 20 25 30 35 40 45 50 55 60 65 70 75 80 85
(m)
(mS/
m) E
stim
ate
App
aren
tC
ondu
ctiv
ity
Vertical Horizontal
Scald area
Pasture
Figure 54. EM38 transect one at scald site, Arndilly.
Iron (Fe) salts present on surface in scald area. High EM38 values indicate both acid
and marine salts present supported by observations and high groundwater Electrical Conductivity values (Table 16).
North Coast NSW Acid Sulfate Soil Ksat Project 47
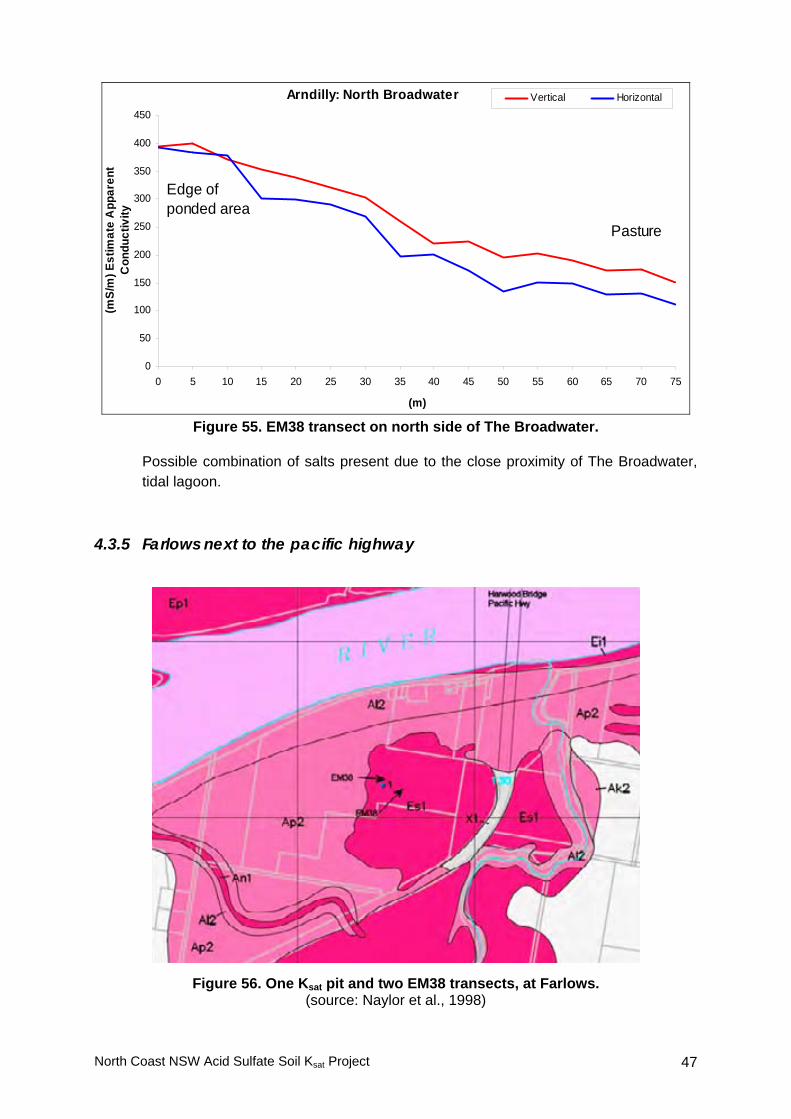
Arndilly: North Broadwater
0
50
100
150
200
250
300
350
400
450
0 5 10 15 20 25 30 35 40 45 50 55 60 65 70 75
(m)
(mS/
m) E
stim
ate
App
aren
t C
ondu
ctiv
ity
Vertical Horizontal
Edge of ponded area
Pasture
Figure 55. EM38 transect on north side of The Broadwater.
Possible combination of salts present due to the close proximity of The Broadwater,
tidal lagoon. 4.3.5 Farlows next to the pacific highway
Figure 56. One Ksat pit and two EM38 transects, at Farlows. (source: Naylor et al., 1998)

North Coast NSW Acid Sulfate Soil Ksat Project 48
0.0
0.1
0.2
0.3
0.4
0.5
0.6
0.7
0.8
0.9
1.0
0 100 200 300 400 500 600
Time (seconds)
% o
f bai
led
volu
me
High KsatExtreme Ksat
Low Ksat
Moderate Ksat
Clarence: Farlows 210907
Pit 1
Figure 57. Normalised water level recovery rate over time, at Farlows.
Soil description: Forest (Pit 1 site) appears to be in transition from Melaleuca to
Casuarina stand of trees. High incident of dead Melaleucas, being replaced by thick stand of young Casuarinas. Black topsoil, Fe staining on surface and in profile, few macropores.
Table 17. Farlows at Clarence, pit water quality and quantitative Ksat data.
Ground water quality Hydraulic conductivity (m day-1)
EC Pit No. Pit depth
(cm)
Water table depth (cm)
pH
(ds m-1)
Bouwer and Rice
(1983)
Boast and Langebartel
(1984) L/W
1 43 31.7 12.55 12.79 0.32

North Coast NSW Acid Sulfate Soil Ksat Project 49
Clarence: Farlows
0
100
200
300
400
500
600
700
10 30 50 70 90 110 130 145 165 185 205 225 245
(m)
(mS/
m) E
stim
ate
App
aren
tC
ondu
ctiv
ity
Vertical Horizontal
Cultivation (fallow)
Top of levee bank (lane-way)
Forest (Melaleucas + Casuarinas)
Low end of cultivation
Figure 58. EM38 transect at Farlows.
Farlows transect from fallow cane field across levee and drain into forest area.
Anecdotal history of marine salt intrusion from chronic leaking floodgates into survey area.
Figure 59. Clarence site, effect of marine salt intrusion on Melaleuca forest.

North Coast NSW Acid Sulfate Soil Ksat Project 50
4.4 Macleay River Catchment Sites
Figure 60. Macleay sites.

North Coast NSW Acid Sulfate Soil Ksat Project 51
4.4.1 Rogars property
Figure 61. Five Ksat pits and one EM38 transect, at Rogars.
(source: Naylor et al., 1998)
0.0
0.1
0.2
0.3
0.4
0.5
0.6
0.7
0.8
0.9
1.0
0 100 200 300 400 500 600
Time (seconds)
% o
f bai
led
volu
me
High KsatExtreme Ksat
Low Ksat
Moderate Ksat
Macleay: Rogars 011107
High Ksat
Low Ksat
Moderate Ksat
High Ksat
Low Ksat
Moderate Ksat
High Ksat
Low Ksat
Moderate Ksat
High Ksat
Low Ksat
Moderate Ksat
Pit 5
Pit 1
Pit 2Pit 3
Pit 4
Figure 62. Normalised water level recovery rate over time, on Rogars wetland.
Consistent high Ksat pits located in the Jerseyville/Kitchener area.

North Coast NSW Acid Sulfate Soil Ksat Project 52
Soil description: Past marine intrusion (anecdotal from owner). Soil silty clay loam topsoil to medium clays with sand lenses at varying depths. Few mottles dark red to orange, common abundance and diameter of macropores, jarosite at depth, iron coated root channels, abundant roots both vertical and horizontal root direction.
Table 18. Rogars at Macleay, pit water quality and quantitative Ksat data.
Ground water quality Hydraulic conductivity (m day-1)
EC Pit No. Pit depth
(cm)
Water table depth (cm)
pH (ds m-1)
Bouwer and Rice
(1983)
Boast and Langebartel
(1984) L/W
1 35 15.0 3.85 12.67 19.59 28.30 0.50 2 46 30.0 3.78 21.53 17.05 19.62 0.54 3 50 24.6 3.92 19.5 18.43 28.07 0.62 4 35 22.2 3.68 27.43 12.27 15.05 0.56 5 50 24.9 3.91 8.19 21.13 32.80 0.55
Macleay: Rogars
0
100
200
300
400
500
600
700
800
0 40 80 120 160 200 240 280 320 360 400 440 480 520 560 600 640 680 720
(m)
(mS/
m) E
stim
ate
App
aren
tC
ondu
ctiv
ity
Vertical Horizontal
Tidal Creek
Oak standShallow fielddrain
Depression:scald patches
Fence line:Improved pastures
Pit 2
Figure 63. EM38 transect at Rogars property.
History of salt water intrusion anecdotal by owner. Creek is tidal, position in estuary
near river entrance. High values indicate acid and marine salts present. Scald area low elevation, with high EM38 and groundwater EC values. Dominate Juncus sp. in clumps with some Phragmities regrowth.

North Coast NSW Acid Sulfate Soil Ksat Project 53
4.4.2 Clancys Drain
Figure 64. Five Ksat pits and an EM38 transect.
(source: Naylor et al., 1998)
0.0
0.1
0.2
0.3
0.4
0.5
0.6
0.7
0.8
0.9
1.0
0 100 200 300 400 500 600
Time (seconds)
% o
f bai
led
volu
me
High KsatExtreme Ksat
Low Ksat
Moderate Ksat
Macleay: Clancy's Drain 021107
High Ksat
Low Ksat
Moderate Ksat
High Ksat
Low Ksat
Moderate Ksat
High Ksat
Low Ksat
Moderate Ksat
High Ksat
Low Ksat
Moderate Ksat
Pit 5Pit 2
Pit 3Pit 1
Pit 4
Figure 65. Normalised water level recovery rate over time, at Clancys Drain.
Pasture area, with consistent extreme Ksat rates.

North Coast NSW Acid Sulfate Soil Ksat Project 54
Soil description: Black topsoil to medium clay subsoil. Few to common mottling,
reddish in colour. Few to common macropores abundance with medium diameter size (i.e. a few major contributing pores). Vertical and horizontal macropores, abundant vertical roots, with jarosite swirls at depth.
Table 19. Clancys Drain at Macleay, pit water quality and quantitative Ksat data.
Ground water quality Hydraulic conductivity (m day-1)
EC Pit No. Pit depth
(cm)
Water table depth (cm)
pH (ds m-1)
Bouwer and Rice
(1983)
Boast and Langebartel
(1984) L/W
1 55 42.5 3.85 4.89 156.98 154.77 0.40
2 60 48.6 3.70 6.91 216.93 222.78 0.36
3 58 46.1 3.94 7.59 143.07 148.09 0.38
4 42 31.1 3.95 4.94 111.47 127.41 0.35
5 42 29.9 4.00 4.34 196.49 216.14 0.36
Macleay: Clancy's Drain
0
20
40
60
80
100
120
140
160
180
200
0 20 40 60 80 100 120 140 160 180 200 220 240 260 280
(m)
(mS/
m) E
stim
ate
App
aren
tC
ondu
ctiv
ity
Vertical Horizontal
low area,drain
Figure 66. EM38 transect at Clancys drain.
Pasture area with EM38 transect perpendicular to shallow field drain. Large expanse
of pasture area, new floodgate structure in place.

North Coast NSW Acid Sulfate Soil Ksat Project 55
4.4.2 Frogmore area
Figure 67. Five Ksat pits and an EM38 transect. (source: Naylor et al., 1998)
0.0
0.1
0.2
0.3
0.4
0.5
0.6
0.7
0.8
0.9
1.0
0 100 200 300 400 500 600
Time (seconds)
% o
f bai
led
volu
me
High KsatExtreme Ksat
Low Ksat
Moderate Ksat
Macleay: Frogmore 041207
High Ksat
Low Ksat
Moderate Ksat
High Ksat
Low Ksat
Moderate Ksat
High Ksat
Low Ksat
Moderate Ksat
High Ksat
Low Ksat
Moderate Ksat
Pit 3
Pit 2
Pit 1
Pit 4Pit 5
Figure 68. Normalised water level recovery rate over time, Frogmore pasture area.
Pits 1, 2 and 3 at Lancaster Drain, adjacent to drain depression. Pits 4 and 5 in upper
Frogmore area.

North Coast NSW Acid Sulfate Soil Ksat Project 56
Soil description: Pits 1 to 3. Black topsoil to clay/medium clay subsoil. Little to no mottling, very fine to few macropores, both vertical and horizontal pores. Iron staining in root channels. Pits 4 and 5. Soils mix of charcoal, light and grey clays. Very fine to few macropores, both vertical and horizontal pores. Abundant vertical roots.
Table 20. Frogmore at Macleay, pit water quality and quantitative Ksat data.
Ground water quality Hydraulic conductivity (m day-1)
EC Pit No. Pit depth
(cm)
Water table depth (cm)
pH (ds m-1)
Bouwer and Rice
(1983)
Boast and Langebartel
(1984) L/W
1 32 16.4 3.84 1.59 11.76 15.32 0.50
2 38 19.8 4.06 2.00 18.86 26.02 0.54
3 41 20.7 4.08 2.05 11.21 15.34 0.62
4 38 17.6 4.32 2.58 41.90 58.58 0.56
5 41 24.1 4.20 2.69 42.22 53.81 0.55
Macleay: Lancaster Drain
0
10
20
30
40
50
60
70
80
90
0 20 40 60 80 100 120 140 160 180 200 220 240 260 280 0
(m)
(mS/
m) E
stim
ate
App
aren
t C
ondu
ctiv
ity
Vertical Horizontal
Main drain
Pit 1 Pit 3
Figure 69. EM38 transect at Lancaster Drain.
Transect along edge of drain depression passing next to Ksat pits. Open pasture
grazing area, beef and dairy cattle present.

North Coast NSW Acid Sulfate Soil Ksat Project 57
4.5 Hastings River Catchment Sites
Figure 70. Hastings sites.

North Coast NSW Acid Sulfate Soil Ksat Project 58
4.5.1 Rossglen
Figure 71. Five Ksat pits and two EM38 transects, at Rossglen.
(source: Naylor et al., 1998)
0.0
0.1
0.2
0.3
0.4
0.5
0.6
0.7
0.8
0.9
1.0
0 100 200 300 400 500 600
Time (seconds)
% o
f bai
led
volu
me
High KsatExtreme Ksat
Low Ksat
Moderate Ksat
Hastings: Rossglen 051207
High Ksat
Low Ksat
Moderate Ksat
High Ksat
Low Ksat
Pit 2
Pit 5
Pit 1
Pit 4
Pit 3
Figure 72. Normalised water level recovery rate over time, at Rossglen.
a hotspot remediated site,

North Coast NSW Acid Sulfate Soil Ksat Project 59
Soil description: Pits 1, 2, and 3 on east side of road. Wet area, Black topsoil to
grey clay to medium clay with Fe staining. Mottling from little to few, dark red to orange. Few to fine macropores with more vertical orientation. Roots vertical growth to depth. Pit 3 adjacent to weir, only OM present as a red colour as Fe flocc.
Pits 4 and 5 west side of road open pasture, old race course area. Black topsoil to light grey medium clay. Few to common mottles reddish/orange in colour. Few to fine macropores with more vertical orientation. Fe staining in old root channels and jarosite swirls and concretions at depth.
Table 21. Rossglen at Hastings, pit water quality and quantitative Ksat data.
Ground water quality Hydraulic conductivity (m day-1)
EC Pit No. Pit depth
(cm)
Water table depth (cm)
pH (ds m-1)
Bouwer and Rice
(1983)
Boast and Langebartel
(1984) L/W
1 40 21.55 3.63 6.91 10.07 13.03 0.55 2 40 20.70 3.55 6.08 6.26 7.51 0.39 3 36 22.90 4.08 5.45 10.52 12.05 0.36 4 30 19.75 3.36 5.84 12.69 12.80 0.3 5 32 11.60 3.26 7.79 6.82 9.34 0.56
Hastings: Rossglen 051207 (East and West side)
0
50
100
150
200
250
300
350
400
0 10 20 30 40 50 60 70 80 0 40 65 105 145 185 210 250 290
(m)
(mS/
m) E
stim
ate
App
aren
tC
ondu
ctiv
ity
Vertical Horizontal
Edge of casurinas
Pit 1
[ Scald area ]
Pit 5Drain
Drain edge
[Scald area]
Figure 73. Two EM38 transects at Rossglen.
Surface scalds present along both transects.

North Coast NSW Acid Sulfate Soil Ksat Project 60
4.5.2 Hacks Ferry and Torrens Island
Figure 74. Hacks ferry Ksat pits.
(source: Naylor et al., 1998) Pits 1 and 2 located in ti-tree plantation and pits 4 and 5 in low swamp area.
Figure 75. One Ksat pit in a previous scald area at Torrens Island.
(source: Naylor et al., 1998)

North Coast NSW Acid Sulfate Soil Ksat Project 61
0.0
0.1
0.2
0.3
0.4
0.5
0.6
0.7
0.8
0.9
1.0
0 100 200 300 400 500 600
Time (seconds)
% o
f bai
led
volu
me
High KsatExtreme Ksat
Low Ksat
Moderate Ksat
Hastings: Maria 061207
High Ksat
Low Ksat
Pit 5
Pit 4
Pit 3
Pit 1
Pit 2
Figure 76. Normalised water level recovery rate over time, at Hastings.
Soil description: Pit 1 and 2, edge of drain on Ti-tree plantation, Maria River. Black
topsoil to light grey clay to plastic medium clay at depth. Fe coated root channels, very few to common mottles reddish colour. Few, fine to medium macropores with both horizontal and vertical orientation. Possible marine influence. Pit 3 Torrens Island previous scald now grazing area, water couch dominate. Dark brown topsoil to silty clay to a fine sand clay at depth. Roots abundant to depth. Very few mottles, dark red colour, Fe staining in old root channels at depth. Few to fine macropores with more vertical orientation. Pits 4 and 5 Hacks Ferry hotspot area, light to nil grazing pressure. Surrounded .by melaleuca and casuarina forests. Black peat topsoil, to light grey clay to plastic medium clay at depth. Few to common mottles red to orange in colour. Fe concretions at 50-80cm. Many to medium macropores both vertical and horizontal orientation.
Table 22. Maria River at Hastings, pit water quality and quantitative Ksat data.
Ground water quality Hydraulic conductivity (m day-1)
EC Pit No.
Pit depth (cm)
Water table depth (cm)
pH (ds m-1)
Bouwer and Rice
(1983)
Boast and Langebartel
(1984) L/W
1 45 35.3 4.40 19.56 4.24 3.95 0.32 2 40 17.6 4.86 17.84 4.83 6.19 0.57 3 52 42.5 4.70 16.84 6.11 5.29 0.33 4 30 5.1 4.01 0.62 55.13 77.89 0.69 5 25 6.9 4.20 0.42 37.98 47.66 0.51

North Coast NSW Acid Sulfate Soil Ksat Project 62
Hastings: Maria 061207
0
10
20
30
40
50
60
0 20 40 60 80 100 120 140 160 180 200 220 240 260 280 0 20 40 60 80 0 20 40 60 80 100 110
(m)
(mS/
m) E
stim
ate
App
aren
t C
ondu
ctiv
ity
Vertical Horizontal
Edge of wetland
Open pasture
Edge of wetland
Figure 77. EM38 transects at Hacks Ferry on the Maria River system
Triangular transect origin on the edge of wet area moving into open pasture area then
back to a second wet area, returning through a casuarina forest, back to the edge of the originating wet area.
Figure 78. Infilling pit in the Hastings catchment.

North Coast NSW Acid Sulfate Soil Ksat Project 63
4.6 Manning River Catchment Sites
Figure 79. Manning sites.
4.6.1 Cattai Creek
Figure 80. Five Ksat pits and one EM38 transect, at Cattai Creek.
(source: Naylor et al., 1998)

North Coast NSW Acid Sulfate Soil Ksat Project 64
0.0
0.1
0.2
0.3
0.4
0.5
0.6
0.7
0.8
0.9
1.0
0 100 200 300 400 500 600
Time (seconds)
% o
f bai
led
volu
me
High KsatExtreme Ksat High Ksat
Low Ksat
Moderate Ksat
Manning: Cattai 111207 and 160408
Pit 1a on 111207
Pit 2
Pit 1
Pit 3
Figure 81: Normalised water level recovery rate over time, at Cattai creek.
Soil description: Pit 1a completed on 11/12/07. Mid location in wetland, salt water
couch area. Black brown topsoil to light grey to dark grey medium clay at depth. Fine sand at 105cm. Very few to few red orange mottles. Abundant vertical roots, Fe staining and concretions in old root channels. Few to common and fine to medium macropores both vertical and horizontal. Pit 1 located between finger toe and ponded area. Second pit in this area to confirm slow rate of infil. Black topsoil to dark grey to grey clay, appears mixed soil at depth (i.e. swirls of black soil mixed in). Common red orange mottling. Few to fine vertical macropores. Pit 2 edge of casuarinas and drain, marine influence possible. Black topsoil to light coloured clay and to a dark grey sand. Common red yellow mottles, yellow swirls at depth. Few to very fine more horizontal macropores. Pit 3 narrow leaf melaleuca expansion area. Black topsoil to coarse sand, grey to dark blue grey sand. No mottling, roots vertical. Few to very fine more vertical macropores. Vertical roots Pit 4 very slow rate of infil, not completed.

North Coast NSW Acid Sulfate Soil Ksat Project 65
Table 23. Cattai at Manning, pit water quality and quantitative Ksat data.
Ground water quality Hydraulic conductivity (m day-1)
EC Pit No.
Pit depth (cm)
Water table depth (cm)
pH
(ds m-1)
Bouwer and Rice
(1983)
Boast and Langebartel
(1984) L/W
1a 35 21.6 3.69 21.30 9.14 10.86 0.43
1 40 26.7 4.52 9.83 0.86 1.07 0.43
2 39 24.0 4.45 18.40 2.79 3.36 0.42
3 53 27.8 4.24 2.28 1.30 1.88 0.83
Manning: Cattaii(Pit 3)
0
100
200
300
400
500
600
700
0 2 4 6 8 10 12 14 16 18 20 22 24 26 28 30 32 34 36 38 40 42 44 46 48 50
(m)
(mS/
m) E
stim
ate
App
aren
tC
ondu
ctiv
ity
Vertical Horizontal
edge of drain
[ melaleucas ]Open pasture Juncus sp
Figure 82. EM38 Cattai transect from open pasture into Juncus sp and Melaleucas.
Possible decline in elevation from pasture into a young thick patch of melaleucas,
possible marine salt intrusion from drain.

North Coast NSW Acid Sulfate Soil Ksat Project 66
4.6.2 Templeman
Figure 83. Three Ksat pits, at Templeman.
(source: Naylor et al., 1998)
0.0
0.1
0.2
0.3
0.4
0.5
0.6
0.7
0.8
0.9
1.0
0 100 200 300 400 500 600
Time (seconds)
% o
f bai
led
volu
me
High KsatExtreme Ksat
Low Ksat
Moderate Ksat
Manning: Templeman 140408
High Ksat
Low Ksat
Moderate Ksat
High Ksat
Low Ksat
Moderate Ksat
Pit 2
Pit 1
Pit 3
Figure 84. Normalised water level recovery rate over time, at Templeman.

North Coast NSW Acid Sulfate Soil Ksat Project 67
Soil description: Pit 1 located on old headland. Topsoil black mixed with clay to light grey yellowish clay to medium clay with jarosite swirls at depth. No mottling or macropores observed. Pits 2 and 3 black topsoil to light coloured clay to heavy plastic dark grey clay at depth. Jarosite swirls plus some jarosite in old root channels, gritty texture. No mottling found. Common Fine macropores with both vertical and horizontal orientation. Pit 3 near drain. Abundant roots both vertical and horizontal in all pits
Table 24. Templeman at Manning, pit water quality and quantitative Ksat data.
Ground water quality Hydraulic conductivity (m day-1)
EC Pit No. Pit depth
(cm)
Water table depth (cm)
pH (ds m-1)
Bouwer and Rice
(1983)
Boast and Langebartel
(1984) L/W
1 28 17.0 4.04 11.06 3.15 3.21 0.31
2 30 3.7 3.66 3.37 9.87 14.70 0.71
3 31 5.5 4.02 7.05 6.09 8.57 0.67
4.6.3 Roches
Figure 85. Eight Ksat pits and two EM38 transects, at Roches.
(source: Naylor et al., 1998)

North Coast NSW Acid Sulfate Soil Ksat Project 68
0.0
0.1
0.2
0.3
0.4
0.5
0.6
0.7
0.8
0.9
1.0
0 100 200 300 400 500 600
Time (seconds)
% o
f bai
led
volu
me
High KsatExtreme Ksat
Low Ksat
Moderate Ksat
Manning: Roches 150408
High Ksat
Low KsatLow KsatLow KsatPit 1
Pit 2Pit 7
Pit 9
Pit 3
Pit 4Pit 5
Pit 8
Figure 86. Normalised water level recovery rate over time, at Roches.
Ksat results indicate site variability.
Soil description: Pits 1, 7, 8 and 9 within a 40m area. Pit 1 black brown colours
topsoil to blue grey clay with fine sand at depth. No mottling. Few to very fine macropores, jarosite swirls at depth. Pit 1 with the occurrence of fine sand at depth may indicate previous soil disturbance. In contrast pits 7, 8 and 9 higher infill rate, black topsoil to light grey clay to blue grey medium clay. Jarosite swirls and paste at depth. Common red mottling, Fe coated root channels. Common to medium course macropores, both vertical and horizontal orientation. Pit 2 scald area, new ti-tree regrowth area. Topsoil Fe staining on surface Peat black charcoal topsoil to light grey to darker medium clay with bright yellow jarosite paste at depth. Few reddish mottling. Common, fine to medium macropores, both vertical and horizontal. Pit 3 scald area new regrowth ti-trees, Mono-sulfidic Black Ooze(MBO) visible on surface, Fe flocc coated on surface with yellowish paste (jarosite) under this coat. Dark black topsoil to light grey clay to dark medium clay with abundant jarosite paste at depth. Vertical roots common. Few red mottles. Common medium macropores, vertical orientation. Pit 4 pasture, black topsoil to light grey clay to dark clay with jarosite mottles gritty at depth. Medium, few to common yellow mottles. Common fine macropores more vertical orientation. Pit 5 open pasture, black topsoil to light clay to dark medium clay with yellow jarosite swirls and gritty at depth. Common medium macropores vertical.

North Coast NSW Acid Sulfate Soil Ksat Project 69
Table 25. Roches at Manning, pit water quality and quantitative Ksat data.
Ground water quality Hydraulic conductivity (m day-1)
EC Pit No. Pit depth
(cm)
Water table depth (cm)
pH (ds m-1)
Bouwer and Rice
(1983)
Boast and Langebartel
(1984) L/W
1(6) 56 33.1 4.92 28.32 0.44 0.80 0.74 2 46 22.0 3.36 28.20 3.57 6.26 0.71 3 31 15.9 3.13 20.28 8.65 11.28 0.40 4 43 29.9 3.20 9.23 9.27 11.12 0.38 5 28 9.0 15.43 21.80 0.58 7 40 4.6 3.38 31.60 4.84 9.31 0.98 8 40 19.8 22.33 29.03 0.60 9 41 14.0 5.45 8.87 0.72
Manning: Roches 150408(Pit 1)
0
100
200
300
400
500
600
700
0 2 4 6 8 10 12 14 16 18 20
(m)
(mS/
m) E
stim
ate
App
aren
tC
ondu
ctiv
ity
Vertical Horizontal
PondingMain drain
Pit 1
Figure 87: EM38 transect, at Roches.
Transect bisects pits 1, 7, 8 and 9. Transect from main discharge drain to ponded
area.

North Coast NSW Acid Sulfate Soil Ksat Project 70
Manning: Roches 150408(Pit 2)
0
100
200
300
400
500
600
700
800
0 2 4 6 8 10 12 14 16 18 20 22 24 26 28 30 32 34 36 38 40 42 44 46 48 50
(m)
(mS/
m) E
stim
ate
App
aren
tC
ondu
ctiv
ity
Vertical Horizontal
Levee
ScaldPonding
Short Melaleucas
Figure 88. Roches pit 2 EM38 transect.
Scald in old Melaleuca regrowth area. Possible soil disturbance from cropping
activity.
Manning: Roches 150408
0
100
200
300
400
500
600
0 2 4 6 8 10 12 14 16 18 20 22 24 26 28 30 32 34 36 38 40 42 44
(m)
(mS/
m) E
stim
ate
App
aren
tC
ondu
ctiv
ity
Vertical Horizontal
Levee
[ Scald ]
Ponding
Melaleucas
Figure 89. Roches pit 3 EM38 transect.
Severe scald regrowth Melaleuca area. Transect from drain levee to ponded water.
Thick coating of orange Fe flocc on surface.

North Coast NSW Acid Sulfate Soil Ksat Project 71
Manning: Roches 150408(Pit 4)
0
50
100
150
200
250
300
0 5 10 15 20 25 30 35 40 45 50
(m)
(mS/
m) E
stim
ate
App
aren
t C
ondu
ctiv
ity
Vertical Horizontal
Main drainPonding
Pit 4Raised laneway
Figure 90. Roches EM38 transect pit 4.
Transect from main drain with a built-up laneway/levee into open pasture up to
ponded area.
Figure 91. Roches pit 2 in the Manning.

North Coast NSW Acid Sulfate Soil Ksat Project 72
5. Summary data and discussion This chapter summarizes all the data collected for the project including an overall summary of Ksat, individual pit frequency, cumulative frequency, standard deviation and ground water means for pH and electrical conductivity. All summary charts are based on the Bouwer and Rice (1983) method for quantitative Ksat calculation as it is slightly more conservative (i.e. generally produces lower values) than Boast and Langebartel (1984) method due to differences in the calculation of shape factors.
0.1
1.0
10.0
100.0
1000.0
Tweed n = 26
Richmond n=19
Clarence n=32
Macleay n=17
Hastings n=22
Manning n=24
Hyd
raul
ic c
ondu
ctiv
ity (m
day
-1)
Figure 92. Catchment mean hydraulic conductivity (note: log scale on the y-axis).
(Error Bars indicate the range of Ksat values encountered within each catchment)
Two important points emerge from Figure 92: The range of values encountered within each catchment floodplain is large. Sulfuric
horizon Ksat is highly varied, both within individual floodplain coastal ASS geomorphic units and across whole floodplains.
Sulfuric horizon Ksat is capable of being extraordinarily high, and some locations with very high Ksat values were found on each floodplain.
This highlights the need for appropriate scale in situ, site specific investigations of soil hydraulic properties prior to implementing acid management strategies. This is particularly important if those strategies include attempts to contain acidic solutes within the landscape or involve floodgate opening and exchange of saline estuarine waters within drains.

North Coast NSW Acid Sulfate Soil Ksat Project 73
0
5
10
15
20
25
30
35
40
45
50
>500200-500
50-20020-50
5 to 202 to 5
0.5 to 2
<0.5
North Coast ASS - Ksat (m day-1)
Indi
vidu
al p
it fre
quen
cy (n
= 1
40)
Figure 93. The frequency distribution of Ksat values for individual pits.
Figure 93 demonstrates that sulfuric horizon Ksat values measured in this study span over four orders of magnitude (<0.5 m day-1 to >500 m day-1). The distribution of values follows a log normal trend, which is typical for Ksat spatial variability. In addition, the majority of individual pit values fall in the 5 to 20 m day-1, which corresponds to Intermediate to High Ksat range.

North Coast NSW Acid Sulfate Soil Ksat Project 74
0%
10%
20%
30%
40%
50%
60%
70%
80%
90%
100%
0.1 1.0 10.0 100.0 1000.0
North Coast ASS - Ksat (m day-1)
Cum
ulat
ive
frequ
ency
(n p
its =
140)
Individual pitsSite means
Figure 94. The cumulative frequency of Ksat for individual pits and site means
(note: log scale on the x-axis). Figure 94 illustrates that:
A similar Ksat distribution pattern is evident between individual pits and site means About 52% of pits had Ksat values less than 15 m day-1, while 48% have values
greater than 15 m day-1 (High Ksat range). More significantly, about 18% of pits have Ksat rates greater than 100 m day-1
(Extreme Ksat range).

North Coast NSW Acid Sulfate Soil Ksat Project 75
y = 0.48x + 1.06R2 = 0.77
0
20
40
60
80
100
120
140
0 50 100 150 200 250 300
North Coast ASS - Site means Ksat (m day-1)
Stan
dard
dev
iatio
n
Figure 95. Standard deviation analysis on Ksat site means.
The solid line in Figure 95 indicates that standard deviations exhibit a strong positive relationship (r2 = 0.77) with site mean Ksat, further demonstrating the inherently high degree of landscape variability in Ksat values. It also reflects the resilience of the pit bailing technique in contrasting ASS backswamp environments.

North Coast NSW Acid Sulfate Soil Ksat Project 76
Ksat Groundwater QualityMean pH
0
1
2
3
4
5
6
7
Tweed Richmond Clarence Macleay Hastings Manning
pH
Figure 96. pH means of groundwater from Ksat pits per catchment.
(Error bars indicate the range of pH values from each catchment)
Groundwater quality means from pH 3.8 to 4.8. Error bars range from pH 3 to 6 depending on site and catchments.
Indicates that groundwater from the coastal acid sulfate landscapes surveyed are generally low in pH, which is consistent with the occurrence of sulfuric horizons.
Site selection had a large influence on means. For example, the Clarence at Lake Wooloweyah, with periodic tidal inundation in close proximity to river entrance accounts for an elevated mean pH for this catchment.

North Coast NSW Acid Sulfate Soil Ksat Project 77
Ksat Groundwater QualityMean EC (dsm-1)
0
5
10
15
20
25
30
35
40
45
Tweed Richmond Clarence Macleay Hastings Manning
EC (d
sm-1
)
Figure 97. EC means of groundwater from Ksat pits per catchment.
(Error bars indicate the range of EC values from each catchment)
Groundwater Electrical Conductivity is highly variable both between and within catchments.
Influencing factors include: site in relation to estuary entrance; distance from drains and river, degree of connectivity to river, current management plans.
EC is highly site dependent (mean trends consistent with pH factors).

North Coast NSW Acid Sulfate Soil Ksat Project 78
6. Conclusions This study has provided an in-depth examination of the range and spatial variability of saturated hydraulic conductivity (Ksat) in shallow sulfuric horizons at important acid sulfate soil (ASS) locations on the North Coast of NSW. There is an extremely high spatial variability of Ksat values in North Coast ASS backswamps ranging from 0.44 up to >500 m day-1. Values span four orders of magnitude and vary both within individual floodplains and across geomorphic units. This has important implications for assessment of Ksat on a catchment level and highlights the need for appropriate scale in situ, site specific investigations of soil hydraulic properties prior to implementing acid management strategies. The extreme values (>100 m day-1) are comparable with what might be expected from poorly sorted gravel. Many of the Ksat values presented here are substantially higher than would be predicted on the basis of texture alone. The strong association between very high Ksat and the occurrence of large tubular macropores appears to be an important feature of the coastal ASS examined in this study. This behaviour is consistent with preferential flow dynamics in soils with macropores where a small number of large pores can contribute large quantities of water, as the liquid transmission capacity of pores is proportional to r4 for tubular channels (r = radius) and d3 for planar voids (d = width) (Bouma, 1991). Backswamps vary in size, geomorphic and hydrological complexity. This data demonstrates soil hydraulic properties in sulfuric horizons can be complex, requiring either intensive in situ assessment and/or a compilation of a number of indicators. Assessment of factors such as Ksat, soil profile and drain elevations, water table ranges, local climatic data (Rainfall, ET), EM38 monitoring pre and post changes may be required in order to appropriately characterise the local sulfuric horizon hydrology to assess management implications. Sites with high to extreme Ksat sites are less amenable to a DACS (dry acid containment model approach - Tualu 2007), simply due to the higher degree of connectivity between drains and adjacent shallow groundwater that results from higher sulfuric horizon Ksat. While ever hydraulic gradients are effluent in such landscapes - which is periodically unavoidable due to seasonal rainfall - there is a very high likelihood of uncontrolled acid groundwater discharge. In contrast, the Wet Acid Containment Strategy (WACS) objective is to contain acid and other oxidation products within the soil and surface waters (Tualu 2007), effective in soils with high to extremely high Ksat rates. Acid groundwater may be contained by infilling or shallowing drains or by using in-drain retention structures to keep drain water levels high and stable during key periods thus preventing the development of effluent groundwater gradients through tidal drawdown. The highest frequency distribution of individual pits is in the 5 to 20 m day-1 which corresponds to Intermediate to High Ksat range. Management of such sites require a thorough assessment to determine most appropriate management options.

North Coast NSW Acid Sulfate Soil Ksat Project 79
The table below lists the percentages of pits in each Ksat category referenced in the field excel spreadsheet. Table 26. Summary of Ksat rates from survey grouped into categories.
(mday-1) Pits %Extreme >100 26 18.6%High 15-100 42 30.0%Mod 1.5-15 61 43.6% 43.6%Low <1.5 11 7.9% 7.9%
48.6%
The Ksat range categories shown in Table 26 are in broad agreement with the cumulative frequency distribution analysis of quantitative Ksat values shown in Figure 89. This survey of coastal ASS sites indicates that 48% of pits in the range of High to Extreme. About 18% of data come from locations with Ksat rates greater than 100 m day-1 (Extreme Ksat range), thus demonstrating that sulfuric horizon Ksat is capable of being extraordinarily high and that high Ksat is relatively common. The Low category represents 8% of total pits sampled. For sites with Low Ksat rates (<1.5 m day-1), the risk of lateral salt seepage into soil profile if floodgate structures opened is likely to be minimal. Moderate to High Ksat values account for 73% of results, providing evidence that groundwater seepage is likely to be more common than previously appreciated.
The fact that moderate Ksat values account for 43% of sites has implications for assessment. Such areas may require more intensive sampling and assessment to identify site variability and range of Ksat values. Assessment may include identifying potential hotspots such as scalds, ti-tree areas and low depression areas, topography, drainage patterns and position of site in the estuary. Quantifying shallow groundwater acidity and examining drainage water acidity dynamics over time may give clues about a sites likely hydrological behaviour and provide indications about the degree of connectivity between drains and sulfuric horizon groundwater. Additional indicators to observe during pit excavations may include soil texture and identifying macropore numbers, abundance and size.
Remediation of an ASS wetlands should be based on adaptive management principles and include a monitoring program that provides feedback on the effectiveness of the management strategy, to provide signs of any environmental degradation or improvements and to evaluate and modify the management of the project as necessary (Tulau 2007). The EM38 conductivity meter was used to determine root zone salinity in areas with shallow saline water tables. Previous research indicate strong relationships are possible between soil EC (1:5 extract) in the upper 1m of the soil profile and mean EC as determined by EM38 in coastal ASS landscapes (Johnston et al. 2004). This makes the EM38 meter a useful tool for monitoring potential saline seepage and is conducive to rapid spatial surveys over time.

North Coast NSW Acid Sulfate Soil Ksat Project 80
Additional comparisons from this study include: 1. There is a low overall predictive capacity by relating elevation/landform codes from ASS risk maps with site mean Ksat values. This may improve with a higher number of samples and more site intensive assessment. 2. The weak relationship between Ksat and geomorphic units is possibly more of a reflection on the origin and genesis of macropores at each site. This is an area requiring further research. It reinforces the extreme variability of Ksat and the need for Ksat assessment on a site specific basis. For example the Tweed floodplain is strongly influenced by varied land-use such as infilled drains, constructed levees and vehicle access roads, resulting in highly variable Ksat values. The effect of compaction on macropores is a factor contributing to variability which enhances the need for site specific assessment. Sulfuric horizon Ksat in ASS is a critical variable due to its controlling influence upon the lateral movement of solutes. This study has shown that there is extreme variability in the sulfuric horizon Ksat on the coastal floodplains of northern NSW. Therefore, the results of this study indicate that site specific assessments of sulfuric horizon Ksat via pit techniques or other similar in situ Ksat assessment techniques need to be included as a standard part of risk management analysis when making changes in backswamp hydrology during broad acre ASS remediation projects.

North Coast NSW Acid Sulfate Soil Ksat Project 81
7. Acknowledgements This project was an initiative of the Floodplain Network Consultative Group in association with the North Coast Catchment Management Authority. The Floodplain Network is a group of predominantly local government floodplain resource managers who work on the floodplains from the Camden Haven River to the Tweed River. The group meets regularly to exchange ideas and methods on floodplain management. The Northern Rivers Catchment Management Authority coordinates the group with individual councils organising field trips and meetings. Thanks to local council floodplain officers who assisted with field survey work includes Marty Hancock and Sebastien Garcia-Cuenca from Tweed Shire Council, Graeme Robertson from Richmond River County Council, Stuart Murphy from Clarence Valley Council, Belinda Allman from Kempsey Shire Council, Thor Aaso form Port Macquarie Hastings Council and Bob McDonnell and Graeme Stone from Greater Taree City Council. Thanks to many landholders for providing access to backswamp areas. Editorial comments provided by Peter Slavich (DPI), Simon Walsh (DPI) and Scott Johnston (SCU). Scott also provided statistical analysis assistance in preparing this report. Acid Sulfate Soil Risk Maps sourced by Glenn Atkinson from Department Environment and Climate Change. Additional acknowledgements for support and assistance from Christina Clay, Adrianne Burke, Jenny Fredrickson, Michael Wood, Peter Wilson, Ron Kemsely, Brett Curie, Simon Proust, Mitch Tulau.

North Coast NSW Acid Sulfate Soil Ksat Project 82
8. References Boast CW and Langebartel RG (1984) Shape factors for seepage into pits. Soil Science Society of America 48, 10-15. Bouma, J., 1991. Influence of soil macroporosity on environmental quality. In: Sparks, D.L. (Ed.), Advances in Agronomy, vol. 46Academic Press, pp. 1–37, 538. Bouwer H (1989) The Bouwer and Rice slug test – and update. Groundwater 27, 304-309. Bouwer H and Rice RC (1983) The pit bailing method for hydraulic conductivity measurement of isotropic or anisotropic soil. American Society of Agricultural Engineering 26, 1435-1439. Bouwer H and Rice RC (1976) A slug test for determining hydraulic conductivity of unconfined aquifers with completely or partially penetrating wells. Water Resources Research 12, 423-428. Cook FJ and Rassam DW (2002) An analytical model for predicting water table dynamics during drainage and evaporation. Journal of Hydrology 263, 105-113. Cook FJ, Rassam DW, Blunden BG, Gardner EA, Carlin GD (1999) Irrigation and drainage: effects on acid export from acid sulfate soils. In ‘Proceedings of Workshop on Remediation and Assessment of Broadacre Acid Sulfate Soils, Lismore’ (Ed. Slavich P) pp. 78-87. (Acid Sulfate Soils Management Advisory Committee: Wollongbar) Hughes CE., Binning P., Willgoose GR., 1998. Characterisation of the hydrology of an estuarine wetland, Journal of Hydrology, 211, 34-39. Johnston SG, Slavich PG and Hirst P (2002) DAN 13 Milestone Report, 2002. Unpublished report prepared for Land and Water Australia. Johnston and Slavich, (2003a), Hydraulic conductivity – a simple field test for shallow coastal acid sulfate soils. Pp 1-9. (NSW DPI: Wollongbar). Website link http://www.dpi.nsw.gov.au/__data/assets/pdf_file/0009/168408/hc-field-test-instructions.pdf Johnston S, Kroon F, Slavich P, Cibilic A and Bruce A (2003b) Restoring the balance: Guidelines for managing floodgates and drainage systems on coastal floodplains. NSW Agriculture: Wollongbar, Australia, pp 1-47. ISBN 0 7347 1518 8 Johnston, S.G., Slavich, P.G., Hirst, P., 2003d. Hydraulic conductivity in the sulfuric horizons at Partridge Creek acid sulfate soil hotspot. Report DAN13/1, NSW Agriculture, Wollongbar, Australia, 9 pp. Johnston, S.G., Slavich, P.G., Hirst, P., 2004a. The acid flux dynamics of two artificial drains in acid sulfate soil backswamps on the Clarence River floodplain, Australia. Australian Journal of Soil Research. 42 (6), 623–637.

North Coast NSW Acid Sulfate Soil Ksat Project 83
Johnston, S.G., Slavich, P.G., Hirst, P., 2004b. The effects of a weir on reducing acid flux from a drained coastal acid sulphate soil backswamp. Australian Journal of Agricultural Water Management 69 (1), 43–67. Lomen DO, Warrick AW, Zhang R (1987) Determination of hydraulic conductivity from auger holes and pits – an approximation. Journal of Hydrology 90, 219-229. McDonald R.C., Isbell R.F., Speight J.G., Walker J., Hopkins M.S., (1990). Australian Soil and Land Survey, Field Handbook, 2nd Edition. Millham NP and Howes BL (1995) A comparison of methods to determine K in a shallow coastal aquifer. Groundwater 33, 49-57. Naylor S.D., Chapman G.A., Atkinson G., Murphy C.L., Tulau M.J., Flewin T.C., Milford H.B., Morand D.T., (1998), Acid Sulfate Soil Risk Maps, 2nd ed., Department of Environment and Climate Change, Sydney. Rupp DE, Owens JM, Warren KL, Selker JS (2004). Analytical methods for estimating saturated hydraulic conductivity in a tiled-drained field. Journal of Hydrology 289, 111-127. Tulau MJ. (2007). Acid Sulfate Soils Remediation Guidelines for Coastal Floodplains in New South Wales. Department of Environment and Climate Change.

North Coast NSW Acid Sulfate Soil Ksat Project 84
Appendix 1: Ksat Survey Project GPS Co-ordinates
Grid Lat/Lon hdddーmm.mmm' Datum WGS 84 Date in Field Latitude Longitude Type Pit No. Catchment Area
14-Sep-07 S29 31.855 E153 12.639 Moloneys In-drain weir Clarence
12-Mar-08 S29 28.318 E153 07.194 Ksat 1 Clarence Ensby 12-Mar-08 S29 28.350 E153 07.195 Ksat 2 Clarence Ensby 12-Mar-08 S29 28.457 E153 07.263 Ksat 3 Clarence Ensby 13-Mar-08 S29 28.811 E153 18.683 Ksat 1 Clarence Wooloweyah 13-Mar-08 S29 28.779 E153 18.683 Ksat 2 Clarence Wooloweyah 12-May-08 S29 42.161 E153 05.432 Ksat 1 Clarence Crows Nest 12-May-08 S29 42.157 E153 05.448 Ksat 2 Clarence Crows Nest 12-May-08 S29 42.349 E153 05.180 Ksat 3 Clarence Crows Nest 12-May-08 S29 42.257 E153 05.523 Ksat 4 Clarence Crows Nest 12-May-08 S29 42.271 E153 05.533 Ksat 5 Clarence Crows Nest 13-May-08 S29 25.229 E153 05.541 Ksat 1 Clarence Arndilly 13-May-08 S29 25.196 E153 05.550 Ksat 2 Clarence Arndilly 13-May-08 S29 25.503 E153 05.822 Ksat 3 Clarence Arndilly 13-May-08 S29 24.249 E153 06.602 Ksat 4 Clarence Arndilly 12-Mar-08 S29 28.320 E153 07.198 EM 38 Start Clarence Ensby 12-Mar-08 S29 28.372 E153 07.190 EM 38 Stop Clarence Ensby 12-Mar-08 S29 28.465 E153 07.278 EM 38 Start Clarence Ensby 12-Mar-08 S29 28.434 E153 07.229 EM 38 Stop Clarence Ensby 13-Mar-08 S29 28.809 E153 18.751 EM 38 Start Clarence Wooloweyah 13-Mar-08 S29 28.805 E153 18.677 EM 38 Stop Clarence Wooloweyah 13-Mar-08 S29 28.825 E153 18.685 EM 38 Start Clarence Wooloweyah 12-May-08 S29 42.277 E153 05.455 EM 38 Start Clarence Crows Nest 12-May-08 S29 42.232 E153 05.417 EM 38 Stop Clarence Crows Nest 13-May-08 S29 25.198 E153 05.548 EM 38 Start Clarence Arndilly 13-May-08 S29 25.186 E153 05.495 EM 38 Stop Clarence Arndilly 13-May-08 S29 24.248 E153 06.603 EM 38 Start Clarence Arndilly 13-May-08 S29 24.224 E153 06.638 EM 38 Stop Clarence Arndilly
05-Dec-07 S31 39.245 E152 43.532 Ksat 1 Hastings Rossglen 05-Dec-07 S31 39.276 E152 43.560 Ksat 2 Hastings Rossglen 05-Dec-07 S31 39.405 E152 43.650 Ksat 3 Hastings Rossglen 05-Dec-07 S31 39.385 E152 43.434 Ksat 4 Hastings Rossglen 05-Dec-07 S31 39.399 E152 43.396 Ksat 5 Hastings Rossglen 06-Dec-07 S31 20.607 E152 50.402 Ksat 1 Hastings Maria river 06-Dec-07 S31 20.630 E152 50.393 Ksat 2 Hastings Maria river 06-Dec-07 S31 18.264 E152 51.011 Ksat 3 Hastings Maria Torrens 07-Dec-07 S31 19.759 E152 48.838 Ksat 5 Hastings Maria Hacks 07-Dec-07 S31 19.877 E152 48.785 Ksat 6 Hastings Maria Hacks 07-Dec-07 S31 19.730 E152 48.849 EM 38 Start Hastings Maria Bob K 07-Dec-07 S31 19.870 E152 48.841 EM 38 Stop/Start Hastings Maria Bob K 07-Dec-07 S31 19.861 E152 48.798 EM 38 Stop/Start Hastings Maria Bob K 07-Dec-07 S31 19.816 E152 48.820 EM 38 Stop Hastings Maria Bob K 05-Dec-07 S31 39.225 E152 43.526 EM 38 Start Hastings Rossglen 05-Dec-07 S31 39.275 E152 43.552 EM 38 Stop Hastings Rossglen 05-Dec-07 S31 39.310 E152 43.437 EM 38 Start Hastings Rossglen 05-Dec-07 S31 39.414 E152 43.351 EM 38 Stop Hastings Rossglen

North Coast NSW Acid Sulfate Soil Ksat Project 85
Ksat Survey Project GPS Co-ordinates
Grid Lat/Lon hdddーmm.mmm' Datum WGS 84 Date in Field Latitude Longitude Type Pit No. Catchment Area
1/11/2007 S30 56.688 E153 01.996 Ksat 1 Macleay Rogars 1/11/2007 S30 56.699 E153 02.082 Ksat 2 Macleay Rogars 1/11/2007 S30 56.648 E153 02.032 Ksat 3 Macleay Rogars 1/11/2007 S30 56.656 E153 01.962 Ksat 4 Macleay Rogars 1/11/2007 S30 56.708 E153 01.937 Ksat 5 Macleay Rogars 2/11/2007 S30 59.363 E152 57.466 Ksat 1 Macleay Clancys 2/11/2007 S30 59.284 E152 57.517 Ksat 2 Macleay Clancys 2/11/2007 S30 59.197 E152 57.568 Ksat 3 Macleay Clancys 2/11/2007 S30 59.007 E152 57.677 Ksat 4 Macleay Clancys 2/11/2007 S30 58.921 E152 57.697 Ksat 5 Macleay Clancys 4/12/2007 S31 03.092 E152 54.281 Ksat 1 Macleay Lancaster 4/12/2007 S31 03.071 E152 54.142 Ksat 2 Macleay Lancaster 4/12/2007 S31 03.069 E152 54.003 Ksat 3 Macleay Lancaster 4/12/2007 S31 03.478 E152 53.684 Ksat 4 Macleay Lancaster 4/12/2007 S31 03.455 E152 53.597 Ksat 5 Macleay Lancaster 1/11/2007 S30 56.700 E153 02.113 EM 38 Start Macleay Rogars 1/11/2007 S30 56.631 E153 01.731 EM 38 Stop Macleay Rogars 2/11/2007 S30 59.278 E152 57.611 EM 38 Start Macleay Clancys 2/11/2007 S30 59.298 E152 57.458 EM 38 Stop Macleay Clancys 4/12/2007 S31 03.075 E152 54.374 EM 38 Start Macleay Lancaster 4/12/2007 S31 03.082 E152 54.210 EM 38 Stop Macleay Lancaster
11/12/2007 S31 50.001 E152 38.590 Ksat 1 Manning Cattai 14/04/2008 S31 50.108 E152 35.670 Ksat 1 Manning Templeman 14/04/2008 S31 50.203 E152 35.601 Ksat 2 Manning Templeman 14/04/2008 S31 50.161 E152 35.551 Ksat 3 Manning Templeman 15/04/2008 S31 49.619 E152 34.413 Ksat 2 Manning Roches 15/04/2008 S31 49.633 E152 34.215 Ksat 3 Manning Roches 15/04/2008 S31 49.737 E152 34.291 Ksat 4 Manning Roches 15/04/2008 S31 49.717 E152 34.632 Ksat 5 Manning Roches 15/04/2008 S31 49.594 E152 34.653 Ksat 6(1) Manning Roches pits 15/04/2008 S31 49.606 E152 34.664 Ksat 7 Manning Roches 15/04/2008 S31 49.582 E152 34.660 Ksat 8 Manning Roches 15/04/2008 S31 49.585 E152 34.698 Ksat 9 Manning Roches 16/04/2008 S31 50.125 E152 38.197 Ksat 5 Manning Cattai 16/04/2008 S31 50.121 E152 38.183 Ksat 2 Manning Cattai 16/04/2008 S31 50.089 E152 38.480 Ksat 1 Manning Cattai 16/04/2008 S31 50.364 E152 38.076 Ksat 4 Manning Cattai 16/04/2008 S31 50.285 E152 37.976 Ksat 3 Manning Cattai 15/04/2008 S31 49.623 E152 34.220 EM 38 Start Manning Roches Pit 2a 15/04/2008 S31 49.641 E152 34.201 EM 38 Stop Manning Roches 15/04/2008 S31 49.735 E152 34.279 EM 38 Start Manning Roches pit 4 15/04/2008 S31 49.744 E152 34.314 EM 38 Stop Manning Roches 16/04/2008 S31 50.113 E152 38.159 EM 38 Start Manning Cattai 16/04/2008 S31 50.125 E152 38.197 EM 38 Stop Manning Cattai

North Coast NSW Acid Sulfate Soil Ksat Project 86
Ksat Survey Project GPS Co-ordinates
Grid Lat/Lon hdddーmm.mmm' Datum WGS 84 Date in Field Latitude Longitude Type Pit No. Catchment Area
19/09/2007 S29 06.208 E153 19.179 Ksat 1 Richmond Rocky Mouth Cr 30/10/2008 S29 06.774 E153 19.016 Ksat 2 Richmond Rocky Mouth Cr 30/10/2008 S29 06.776 E153 19.005 Ksat 3 Richmond Rocky Mouth Cr 30/10/2008 S29 06.772 E153 18.980 Ksat 4 Richmond Rocky Mouth Cr 20/11/2007 S28 45.623 E153 34.146 Ksat 1 Richmond Scanlans 20/11/2007 S28 46.370 E153 34.299 Ksat 2 Richmond Scanlans 21/11/2007 S29 00.810 E153 22.189 Ksat 1 Richmond Braziers 21/11/2007 S29 01.137 E153 22.382 Ksat 2 Richmond Braziers 21/11/2007 S29 03.385 E153 14.358 Ksat 1 Richmond Haughwood 21/11/2007 S29 03.271 E153 14.406 Ksat 2 Richmond Haughwood 1/04/2008 S29 00.920 E153 22.692 Ksat 1 Richmond Coombes 1/04/2008 S29 01.028 E153 22.556 Ksat 2 Richmond Coombes 1/04/2008 S29 01.082 E153 22.535 Ksat 3 Richmond Coombes 4/04/2008 S29 02.449 E153 22.012 Ksat 1 Richmond Kilgin 4/04/2008 S29 02.449 E153 22.010 Ksat 1 Richmond Kilgin 4/04/2008 S29 03.170 E153 21.290 Ksat 2 Richmond Kilgin 4/04/2008 S29 02.962 E153 21.563 Ksat 3 Richmond Kilgin
14/05/2008 S29 01.584 E153 18.693 Ksat 1 Richmond Gollan 14/05/2008 S29 03.103 E153 16.952 Ksat 1 Richmond Swan Bay 14/05/2008 S29 02.256 E153 13.607 Ksat 1 Richmond Bora Codrington 20/11/2007 S28 46.369 E153 34.300 EM 38 Start Richmond Scanlans 20/11/2007 S28 46.408 E153 34.327 EM 38 Stop Richmond Scanlans 20/11/2007 S28 47.495 E153 33.717 EM 38 Start Richmond NR1 20/11/2007 S28 47.390 E153 33.726 EM 38 Stop Richmond NR1 20/11/2007 S28 47.393 E153 33.241 EM 38 Start Richmond NR1 20/11/2007 S28 47.302 E153 33.144 EM 38 Stop Richmond NR1 21/11/2007 S29 03.384 E153 14.359 EM 38 Start Richmond Haughwood 21/11/2007 S29 03.200 E153 14.408 EM 38 Stop Richmond Haughwood 4/04/2008 S29 02.947 E153 21.556 EM 38 Start Richmond Kilgin 4/04/2008 S29 02.961 E153 21.583 EM 38 Stop Richmond Kilgin

North Coast NSW Acid Sulfate Soil Ksat Project 87
Ksat Survey Project GPS Co-ordinates
Grid Lat/Lon hdddーmm.mmm' Datum WGS 84 Date in Field Latitude Longitude Type Pit No. Catchment Area
12/11/2007 S28 20.511 E153 24.815 Ksat 1 Tweed Blacks Dr 12/11/2007 S28 20.504 E153 24.823 Ksat 2 Tweed Blacks Dr 12/11/2007 S28 20.492 E153 24.831 Ksat 3 Tweed Blacks Dr 13/11/2007 S28 20.482 E153 24.845 Ksat 4 Tweed Blacks Dr 13/11/2007 S28 20.457 E153 24.841 Ksat 5 Tweed Blacks Dr 13/11/2007 S28 17.024 E153 30.470 Ksat 1 Tweed McLeods 13/11/2007 S28 17.022 E153 30.447 Ksat 2 Tweed McLeods 13/11/2007 S28 17.022 E153 30.425 Ksat 3 Tweed McLeods 13/11/2007 S28 17.019 E153 30.401 Ksat 4 Tweed McLeods 13/11/2007 S28 17.018 E153 30.383 Ksat 5 Tweed McLeods 15/11/2007 S28 17.008 E153 30.411 Ksat 6 Tweed McLeods 15/11/2007 S28 17.030 E153 30.409 Ksat 7 Tweed McLeods 14/11/2007 S28 19.204 E153 30.801 Ksat 1 Tweed Clothiers 14/11/2007 S28 19.187 E153 30.812 Ksat 2 Tweed Clothiers 14/11/2007 S28 19.118 E153 30.762 Ksat 3 Tweed Clothiers 14/11/2007 S28 19.105 E153 30.740 Ksat 4 Tweed Clothiers 14/11/2007 S28 19.055 E153 30.727 Ksat 5 Tweed Clothiers 14/11/2007 S28 15.406 E153 32.265 Ksat 1 Tweed Chinderah 14/11/2007 S28 15.402 E153 32.250 Ksat 2 Tweed Chinderah 14/11/2007 S28 15.403 E153 32.238 Ksat 3 Tweed Chinderah 14/11/2007 S28 15.399 E153 32.216 Ksat 4 Tweed Chinderah 14/11/2007 S28 15.395 E153 32.192 Ksat 5 Tweed Chinderah 15/11/2007 S28 22.508 E153 32.865 Ksat 1 Tweed Christies 15/11/2007 S28 22.481 E153 32.865 Ksat 2 Tweed Christies 15/11/2007 S28 22.465 E153 32.869 Ksat 3 Tweed Christies 15/11/2007 S28 22.451 E153 32.874 Ksat 4 Tweed Christies 13/11/2007 S28 20.529 E153 24.801 EM 38 Start Tweed Blacks Dr 13/11/2007 S28 20.528 E153 24.805 EM 38 Stop Tweed Blacks Dr 13/11/2007 S28 17.027 E153 30.480 EM 38 Start Tweed McLeods to pit 5 14/11/2007 S28 19.207 E153 30.809 EM 38 Start Tweed Clothiers 14/11/2007 S28 19.137 E153 30.768 EM 38 Stop Tweed Clothiers 15/11/2007 S28 15.404 E153 32.276 EM 38 Start Tweed Chinderah 15/11/2007 S28 15.383 E153 32.125 EM 38 Stop Tweed Chinderah 15/11/2007 S28 22.518 E153 32.856 EM 38 Start Tweed Christies 15/11/2007 S28 22.454 E153 32.880 EM 38 Stop Tweed Christies

North Coast NSW Acid Sulfate Soil Ksat Project 88
Appendix 2: Summary of completed field work.
Catchment Site Field Date Pits Completed
Details
Tweed Stainley Quirk Clothiers Ck Chinderah Christies Ck
12/11/07 13/11/07 14/11/07 14/11/07 15/11/07
5 7 5 5 4
Ksat + EM38 Ksat + EM38 Ksat + EM38 Ksat + EM38 Ksat + EM38
Richmond Scanlans Haughward Braziers Coombes Crusio Gollan Gardiner Davies Rocky MC
20/11/07 21/11/07 21/11/07
1/4/08 4/4/08
14/5/08 14/5/08 14/5/08 19/9/07
2 2 2 3 3 1 1 1 4
Ksat + EM38 Ksat + EM38 Soil Profile Ksat Soil Profile Ksat Ksat Ksat Ksat
Clarence Ensby Wooloweyah Crows Nest Crows Nest N Arndilly
12/3/08 13/3/08 12/5/08 12/5/08 13/5/08
3 2 3 2 4
Ksat + EM38 Ksat + EM38 Ksat + EM38 Ksat + EM38 Ksat + EM38
Macleay Rogars Clancys Dr Frogmore Dr Frogmore Up
1/11/07 2/11/07 4/12/07 4/12/08
5 5 3 2
Ksat + EM38 Ksat + EM38 Ksat + EM38 Ksat +EM38
Hastings Rossglen Maria Tea Maria Torans Maria Hacks
5/12/07 6/12/07 6/12/08 6/12/08
5 2 1 1
Ksat + EM38 Ksat + EM38 Ksat + EM38 Ksat + EM38
Manning Cattai Templeman Roches Cattai
11/12/07 14/4/08 15/4/08 16/4/08
1 3 8 4
Ksat Ksat + EM38 Ksat + EM38 Ksat + EM38
Total = 95 Total = 5
Ksat Soil Profile

North Coast NSW Acid Sulfate Soil Ksat Project 89
Appendix 3: Glossary
Soil Horizons: O: Horizons: horizons dominated by organic materials in varying stages of decomposition that have accumulated on the mineral soil surface. P Horizons: Peat horizons dominated by organic materials in various stages of decomposition that have accumulated either under water or in conditions of excessive wetness. A: Horizons: horizons either consisting of one or more surface mineral horizons with some organic accumulation and darker in color than the underlying horizons, or consisting of surface and subsurface horizons that are lighter in color but have a lower content of silicate clay and/or sesquioxides than the underlying horizons. B: Horizons: horizons consist of one or more mineral layers such as a concentration of silicate clay, iron, aluminium and organic material. Horizon may consist of 3 sub-horizons B1, B2 and B3. G: Horizon indicating pyritic material in gel form, associated with Potential Acid Sulfate Soil (PASS). Horizon suffixes: g: strong gleying. Gleying is indicative of permanent or periodic intense reduction due to wetness and is characterised by greyish, bluish or greenish colors, generally of low chroma. Mottling may be prominent. Roots may have rusty or yellowish outlines. p: ploughing, tillage practices or other disturbance by man such as deep ripping, laneways. j: presence of jarosite, occurring generally in acid sulfate soil oxidation processes. Field Texture: Soil texture is determined by the size distribution of mineral particles finer than 2mm. L: Loam about 25% clay content CL: Clay Loam from 30% to 35% clay SC: Sandy Clay from 35% to 40% clay LC: Light Clay from 35% to 40% clay MC: Medium Clay from 45% to 55% clay HC: Heavy Clay from 50% or more clay Mottles: Mottles are spots or blotches or streaks of subdominant colors different from the matrix color and also different from the color of the ped surface, nodules or concretions. Mottle abundance: 0 No mottles 1 Very few <2% 2 Few 2% to 10% 3 Common 10% to 20% 4 Many 20% to 50% Mottle size: 1 Fine <5mm 2 Medium 5-15mm 3 Coarse 15-30mm 4 Very coarse >30mm

North Coast NSW Acid Sulfate Soil Ksat Project 90
Mottle contrast: F Faint indistinct D Distinct readily evident P Prominent striking and conspicuous Mottle color: R Red O Orange B Brown Y Yellow G Grey etc Voids: A general term for pore space and other openings in soils not occupied by solid mineral mater. Two basic types, cracks and pores which are approximately circular in cross-section. Pores are divided into: Micropores less than 0.075mm diameter and Macropores greater than 0.075mm diameter, Quantity of macropores: Very fine and fine macropores less than 2mm diameter and medium coarse macropores greater than 2 mm diameter 1 Few <1 per 100mm2 2 Common 1-5 per 100mm2 3 Many >5 per 100mm2 Diameter of macropores: 1 Very fine 0.075-1mm 2 Fine 1-2mm 3 Medium 2-5mm 4 Coarse >5mm Orientation: V Vertical H Horizontal Segregations refers to discrete segregations that have accumulated in the soil because of the concentration of some constituent, usually by chemical or biological action. Forms of segregation includes: C Concretions crudely concentric internal fabric can be seen with naked eye N Nodules no concentric or symmetric internal fabric, can have hollow interior. V Vein T Tubules Roots vary in orientation (Horizontal to Vertical), size (from very fine to coarse) and abundance (no roots to abundant).

North Coast NSW Acid Sulfate Soil Ksat Project 91
Appendix 4: Field Notes
1. Site selection: Selection of individual pits within a site proved a challenge on a number of occasions. Water table height proved to be the major factor when visiting a site to undertake pit tests. (Ideal WT 5cm to 50cm from soil surface). Added factors that may influence pit sites include:
1. Wetland areas not symmetrical, some areas small and shaped while others elongated meandering in relation to creeks/rivers, others with depositional fingers transecting wet areas,
2. Access to areas, barriers such as fences, drains, forest, 3. Vegetation from open grassland to dense forest, 4. Variable water table depth, i.e. ponded areas to WT 60cm below surface, 5. Soil type may vary, from clay to sand subsoil, 6. Greater the gradient, increase in potential ground water flow rates, 7. Elevation changes at times difficult to determine on site, 8. Vegetation type, past and present, and influence of tree roots, 9. Laneways and compaction issues and some sites with high drain-banks, 10. Previous soil disturbance not readily visible such as drain infilling, tree removal, laser
levelling, 11. Distances between sites, may result in less pits with increase in distances to travel, 12. Identify point sources of acid discharge, 13. Rainfall events.
2. Pit test observations:
1. Initial indicators of water table prior to digging maybe drain or furrow water levels, surface ponding,
2. Pits with low to medium Ksat ranges i.e. relatively slow infil rate are easily dug too deep, therefore WL may increase in pit that is outside the ratio 0.2 to 0.75 i.e. WL in pit (L) over average pit width ((W+B)/2). Square pits make field calculation simpler,
3. Flat shovel preferred when squaring sides of pits, curved (fencing) shovel an advantage in initial digging of pit especially with a thick cover of vegetation such as couch,
4. Waterproof material to kneel on or lie on when reading measurements off ruler during a timed infill event,
5. Gouge auger valuable in measuring depth to sulfidic and observing change in soil profil at depth,
6. Some sites ideal to dig a number of sites consecutively then return to start for infil readings. (Note 2, digging pits deeper than required, possibly outside of pit ratio range),
7. Low Ksat sites, pit bailings between runs left until WL approaches static i.e. to allow WT to stabilise in the immediate area,
8. Pits all have GPS readings for reference, and compare with ASS risk maps. 9. Observe for: drains or creek interference, vegetation changes, 10. Variable infill rates between pits may require additional pits. A small number of sites
had visible macropores above the water table indicating that further pit testing may be required at a later date.

North Coast NSW Acid Sulfate Soil Ksat Project 92
3. Soil observations: The geomorphology of deposition of material is extremely variable between pit sites, wetlands and catchments.
Sites investigated ranged from course sands, silty clay loams to medium/heavy clays with occasional sand lenses at depth,
Majority of soil profiles consist of OM horizon, a black alluvial topsoil to light grey clays into a heavier darker clay at depth (Appendix 8),
Macropores found in majority of soil pits, orientation both Vertical (V) and/or Horizontal (H), from few to many in abundance and range in diameters. High infill flow rates can be achieved with a small number of large macropores,
Connectivity of macropores, evident by high Ksat pits which can be bailed out a number of times followed by a rapid, infil with a short settlement period,
Fe coated macropores common, generally as a dull red color, lightly coated to heavy coated pipe tubules formation i.e. pipe construction which can be difficult to crush with finger pressure. Fe coatings visible in crack like plates in soil, mottled in soil profile and can be gritty to feel,
Jarosite commonly found ranging from specs to light mottling, to swirls, gritty congregations, from depth up to relatively close to soil surface.
4. Project work It is suggested that a comprehensive Ksat survey be undertaken on a per site basis. The major advantage to survey a key site is in selecting field survey periods to best coincide with ground water levels in relation to soil surface. Additional factors may include tide influence, AHD levels, access, size of survey area, identifying point sources of acid discharge.

North Coast NSW Acid Sulfate Soil Ksat Project 93
Appendix 5: Ksat site means per catchment.
Tweed
0.1
1.0
10.0
100.0
1000.0
McLeods Chinderah Christies Clothiers Stainley (Blacksdrain)
Fiel
d H
ydra
ulic
con
duct
ivity
(m d
ay-1)
Richmond
0.1
1.0
10.0
100.0
1000.0
Haughward Scanlans Rock MouthCreek
KilganWoodburn -Coombes
WoodburnGolan
Swan Bay -Gardiner
Bora-Codrington
Tuckean
Fiel
d H
ydra
ulic
con
duct
ivity
(m d
ay-1
)
Clarence
0.1
1.0
10.0
100.0
1000.0
Blanches Shark Creek EdwardsCreek
Arndilly Ensbys WooloweyahCrows Nest Farlows
Fiel
d H
ydra
ulic
con
duct
ivity
(m d
ay-1
)

North Coast NSW Acid Sulfate Soil Ksat Project 94
Macleay
0.1
1.0
10.0
100.0
1000.0
Clybucca Clancys Drain Lancaster Drain Rogars, Jerseyville
Fiel
d H
ydra
ulic
con
duct
ivity
(m d
ay-1
)
Hastings
0.1
1.0
10.0
100.0
1000.0
Partridge Ck Bernes Maria Maria Tea TreePlantation
Torons Island Hacks Ferry,Kentwell
Rossglenn
Fiel
d H
ydra
ulic
con
duct
ivity
(m d
ay-1
)
Manning
0.1
1.0
10.0
100.0
1000.0
Cattai Ck Cattai Dickenson Ck Moto - Roaches Landsdowne -Templemans
Fiel
d H
ydra
ulic
con
duct
ivity
(m d
ay-1
)

North Coast NSW Acid Sulfate Soil Ksat Project 95
Appendix 6: Soil profile description at Braziers Drain Richmond. Table R6: Pit located between cane field and open pasture.
Catchment: Richmond Location: Braziers Drain (North)
Site Between pasture area and cane fields separated by large drain
Date 21/11/2007 Time 11:30 Note: pit in drain depression, profil description only Pit number 1 Details Mottles Macropores Hor Depth Ab Color Dia Oreint Ab
(cm) (0-4) (1-4) (H-V) (1-3)
0-25 Black to grey topsoil 1 dull red Abundant roots
25-40 Med to heavy clay 3 dull red
no visible signs of pores, fine roots
40+ light clay sand light coloured grey Table R6a: Pit soil data, water table below limits of test. Pit located in cane inter-row,
recently harvested in wet conditions and Fe staining on soil surface to infield drain.
Catchment: Richmond Location: Braziers Drain (North of Sykes Shed)
Site Between pasture area and cane fields separated by large drain
Date 21/11/2007
Time 11:30 Note: profil description only
Pit number 2 Ratoon cane, Recently harvested in wet conditions, surface Fe staining in tracks
Details Mottles Macropores Particulars Hor Depth Ab Color Dia Oreint Ab (cm) (0-4) (1-4) (H-V) (1-3) 0-15 Black topsoil 1 slight mottling
15-45 MC 3 dark red 1 H=V 1 dark color
45+ MC Light colored

North Coast NSW Acid Sulfate Soil Ksat Project 96
Appendix 7: Acid Sulfate Soil Risk Map Codes

North Coast NSW Acid Sulfate Soil Ksat Project 97
Appendix 8: Soil Profile Pit Descriptions APPENDIX 8: SOIL PIT PROFILE DESCRIPTION
Catchment: Tweed
Details Mottles Macropores ParticularsHorizon Hor. Depth AbundanceColor Dia Oreint. Abundance
(cm) (0-4) (1-4) (H-V) (1-3)Location: Blacks DrainSite Stainley A 0-30 Black mature peat old ti-tree area (old roots at depth)Date 12/11/2007 Bg 30-100 light grey 2 2 H=V 1 mottling, tubules 2-3mm dia andTime 15:00 Bj 100-106 MC (some slaking?) wall thickness, strong structurallyPit number 1 2-3 pores main pores infilling
Site Stainley A 0-30 Black mature peat Cane fieldDate 12/11/2007 Bg 30-80 light grey 2 2 H=V 1 mottling, tubules 2-3mm dia andTime 15:45 Bj 80-106 MC (some slaking?) wall thickness, strong structurallyPit number 2 Gr 106+ 2-3 pores main pores infilling
Site Stainley A 0-30 Black mature peatDate 12/11/2007 Bg 30-70 light grey 2 2 H=V 1 mottling, tubules 2-3mm dia andTime 16:20 Bj 70-106 MC wall thickness, strong structurallyPit number 3 Gr 106+ 2-3 pores main pores infilling
Site Stainley A 0-40 Black mature peatDate 13/11/2007 Bg 40+ light grey 2 2 H=V 1 pipe structures easily visibleTime 9:28 106+Pit number 4
Site Stainley A 0-40 Black mature peatDate 13/11/2007 Bg 40+ light grey 2 2 H=V 1 pipe structures easily visibleTime 10:00 106+Pit number 5
Location: McLeods CkSite Rob Quirk A 0-30 Alluvial/topsoil Ratoon cane fieldDate 13/11/2007 Bg 30-80 Clay,mottling 1 orange/red 1 H<V 1 pores visible above water tableTime 11:20 Bj 80-106 Clay 2 red/pale swirls mottles + jarositePit number 1 Gr 106+ Clay blue/grey
Site Rob Quirk A 0-25 AlluvialDate 13/11/2007 Bg 25-40 Clay,mottling 1 orange/red 2 H=V 1 pores visible above water tableTime 12:00 Bj 40-85 Clay 2 red/pale swirls mottles + jarositePit number 2 Gr 85+ PASS blue/grey
Site Rob Quirk A 0-30 Alluvial 2-3 main pores dischargingDate 13/11/2007 Bg 30-75 Light grey,mottl 1 orange/red 2 H=V 1 pores visible above water tableTime 13:00 Gr 75+ M/H Clay mottles + jarositePit number 3 blue/grey, old reed roots
Site Rob Quirk A 0-30 Alluvial 2-3 main pores dischargingDate 13/11/2007 Bg 30-70 Light grey 1 orange/red 2 H<V 2 weak mottling, pores visible Time 13:30 Bj 70-90 MC mottles + jarositePit number 4 Gr 90+ PASS blue/grey, old reed roots
Site Rob Quirk A 0-25 Alluvial 2-3 main pores dischargingDate 13/11/2007 Bg 20-50 Light grey 1 orange/red 2 V>H 2 moderate mottling, pores visibleTime 14:30 Bj 50-80 MC weak mottles + jarositePit number 5 Gr 80+ PASS blue/grey
Site Rob Quirk A 0-25 Alluvial/black topsoil 2-3 main pores dischargingDate 15/11/2007 Bg 20-60 Light grey 1 orange/red 2 V>H 2 moderate mottling, pores visibleTime 14:00 Bj 60-90 MC strong jarosite Pit number 6 Gr 90+ PASS, blue/grey root/reed reminates at depth
Site Rob Quirk A 0-25 Alluvial/black topsoil 2-3 main pores dischargingDate 15/11/2007 Bg 20-60 Light grey 1 orange/red 2 V>H 2 moderate mottling, pores visibleTime 14:30 Bj 60-90 MC strong jarosite Pit number 7 Gr 90+ PASS blue/grey, root/reed reminants
Location: Clothiers CkSite Hotspot rem. O 0-2 couch/ carpet grass ponded waterDate 14/11/2007 A 2-53 Black peat 3 H 1Time 11:00 Bj 53-83 light grey colorPit number 1 Gr 83+
Site Hotspot rem. O 0-2 couch/ summer grassDate 14/11/2007 A 2-25 Mixed clayTime 11:30 25-40 peat colored nilPit number 2 40-55 Extensive layer peat old ti-tree bark and roots
Gr 55+ Blue grey

North Coast NSW Acid Sulfate Soil Ksat Project 98
Catchment: Tweed
Details Mottles Macropores ParticularsHorizon Hor. Depth AbundanceColor Dia Oreint. Abundance
(cm) (0-4) (1-4) (H-V) (1-3)Site Hotspot rem. O 0-2 couch/ summer grassDate 14/11/2007 A 2-36 peat/alluvial 2 H 1 2 large pores Time 12:35 B 36-45 peat coloredPit number 3 Bg 45-60 Extensive layer peat
Gr 60+ Blue grey86 sand grit in grey/blue gel
Site Hotspot rem. O 0-2 couch/ summer grassDate 14/11/2007 A 2-25 black peat 4 H 1 2 large pores Time 13:00 B 25-30 peat coloredPit number 4 Bg 30-60 Extensive layer 1 reddish light mottling
Gr 60+ Blue grey
Site Hotspot rem. O 0-2 couch/ summer grass dense pastureDate 14/11/2007 A 2-35 black peat 2 H=V 2 several pores Time 13:30 B 35-40 peat coloredPit number 5 Bg 40-60 Extensive layer 1 reddish light mottling
Bj 60-8080+ Blue grey
Location: ChinderahSite Cane Area A 0-25 Sandy alluvial plant caneDate 14/11/2007 B 25-60 sandy clay 1 orangeTime 15:30 B1 60-80 pure sand nil crumblyPit number 1 80+ Yellowish sand
Site Cane Area A 0-25 Sandy alluvial plant caneDate 14/11/2007 B 25-60 sandy clay 1 orangeTime 16:00 B1 60-80 pure sand nil minor slumpingPit number 2 80+ Yellowish sand
Site Cane Area A 0-25 Sandy alluvial plant caneDate 14/11/2007 B 25-60 sandy clay 1 orangeTime 16:00 B1 60-80 pure sand nil minor slumpingPit number 3 80+ Yellowish sand
Site Cane Area A 0-20 Sandy alluvial fallowDate 14/11/2007 B 20-50 Grey mottling 1 orange 1 H=V 1 Fe deposit around poreTime 16:00 B1 50+ pure sand nil slumping edges at depthPit number 4
Site Cane Area A 0-20 Sandy alluvial fallowDate 14/11/2007 B 20-50 Grey mottling 1 orangeTime 16:28 B1 50-80 pure sand nil slumping edges at depthPit number 5 80+ bluish sand
Location: Christies CkSite Oak Forest O 0-4Date 15/11/2007 A 4-36 black loam 4 H 3 rapid refillTime 10:30 B 36-80 silty loamPit number 1 Bj 80-90 jarosite
90+ PASS
Site Oak Forest O 0-4 organic peatDate 15/11/2007 B 4-80 Peat layer 4 H 3 rapidTime 11:00 Bj 80-100 jarosite contentPit number 2 Gr 100+
Site Oak Forest O 0-4Date 15/11/2007 A 4-80 peaty,weak mottling 4 H 2Time 11:30 Bj 8-95 jarosite presentPit number 3 Gr 95+
Site Oak Forest O 0-4Date 15/11/2007 A 4-80 peat/weak mottling 4 H 2 many pores, 3 large poresTime 12:00 Bj 80-100 clay eg 5cm * 2.5cmPit number 4 100+

North Coast NSW Acid Sulfate Soil Ksat Project 99
Catchment: Richmond
Details Mottles Macropores ParticularsHorizon Hor. Depth AbundanceColor Dia Oreint. Abundance
(cm) (0-4) (1-4) (H-V) (1-3)Location: NewrybarSite Scanlans Dr O 0-1 Setaria and paspalumDate 20/11/2007 A 1-20Time 9:30 B 20-47Pit number 1 B1 47-85 Brown peat nil nil Roots abundant
Bg 85-115 Dark clay peat
Site Scanlans Dr A 0-20 1 reddish Forest areaDate 20/11/2007 B 20-90 Light colored clay 2 H=V 2 visible poresTime 11:00 B1 90-100 Clay sandPit number 2
Location: Haughward Drain SouthSite Main drain O 0-2 Organic/brown loamDate 21/11/2007 B 2-53 peaty loam 2 reddish 2 H=V 1 Strong mottling in root channelsTime 13:30 Bg 53-75 Black/peat clay roots to depthPit number 1 Gr 75+ MC gel
Site Main drain O 0-2 Organic/brown loamDate 21/11/2007 A 2-15 Black/peat clayTime 15:00 Bg 15-100 Peat clay loam 2 reddish 2 H=V 1 roots abundant to depth, Pit number 2 Gr >100 jarasite evident mottling in root channels
Location: KilginSite Coombes A 0-20 Black soil Drain depressionDate 1/04/2008 B 20-35 Plastic clay 2 dull orangeTime 10:30 B2 35-45 Med Clay 4 orange+ 2 V>H 2 Fe swirlsPit number 1 B3 45-120 MC to HC Fe swirls
Bg 120-125 MC to HC Fe nodules, course grit125-145 MC to HC Dark Fe and jarosite
145+ MC to HC plastic texture, dryer
Site Coombes A 0-18 Black soil drain depressonDate 1/04/2008 B 18-50 Grey clay 3 orange 1 V>H 1Time 11:30 B2 50-65 Black silty clayPit number 2 Bg 65-110 Clay Fe deposites
110-130 Clay Fe + Jarosite deposites130-140 Clay Fe deposites
Site Coombes A 0-20 Black topsoil Drain depression, white salts on Date 1/04/2008 B 20-35 grey clays surfaceTime 13:00 B2 35-50 grey clays/ color 4 orange+ 2 V>H 2 Bright Fe lensPit number 3 B3 55-60 grey sand lens Possible an old drain crossing
Bg 60-90 Grit layer Fe and JarositeGr 90+ MC Grey color, less Fe
Evidence of strong Fe migrationMany visible maropores not flowing
Location: Woodburn AreaSite Gollan A 0-100 Black soil 0 2 H 1 Cultivation, low areaDate 14/05/2008 B 100-140 Orang peat/clay layer 3 large pores infillingTime 9:00 Bg 140-150 Black peaty clayPit number 1
Site Nev Gardiner A 0-15 Black soilDate 14/05/2008 Ap 15-70 grey/black 1 dull red 2 V 1 compacted layer to 50cmTime 11:15 B 70-84 Orange peat 1 macroporePit number 1 B3 84-100 clay peat infil from peat, odour plus
Site Boro-Cod A 0-50 Black/peat soil 0 3 V 1 Open pastureDate 14/05/2008 B 50-60 Grey clayTime 13:15 B3 60-85 peat clay orange fleck, some FePit number 1 Bg 85-115 peat orange in root channels
Location: Braziers Drain (North)Site: Cane/pasture A 0-25 Topsoil 1 dull red Abundant rootsDate 21/11/2007 B 25-40 M to H clay 3 dull red nil no visible signs of pores,fine rootsTime 11:30 40+ light clay sand light colored greyPit number 1
Site: Cane/pastureDate 21/11/2007 A 0-15 Topsoil 1 slight mottlingTime 12:00 Bg 15-45 3 dark red 1 H=V 1 dark colorPit number 2 45+ MC Light colored

North Coast NSW Acid Sulfate Soil Ksat Project 100
Catchment: Richmond
Details Mottles Macropores ParticularsHorizon Hor. Depth AbundanceColor Dia Oreint. Abundance
(cm) (0-4) (1-4) (H-V) (1-3)Location: KilginSite Crusio B 0-39 mottles plus 4 dark red/oran 2-3 H=V 3 Extensive mottling and JarasiteDate 4/04/2008 Bg >39 2 H=V 2 deposites in root/old reed channels Time 10:00 prolific roots, even into pyritic layerPit number 1 profil: wetting and drying cycle
Site Crusio A 0-30 black alluvial prolific roots at depthDate 4/04/2008 B 30-50 layering 3 dark red 1 H=V 1 strong layers, charcoal layers,Time 11:00 Bg 50+ dark grey color tree reminants, Fe stainingPit number 2 roots and staining to depth
Site Crusio AB 0-70 Fe staining 4 dark red/oran 1 H=V 1 Extensive Fe staining, + JarasiteDate 4/04/2008 Bg 70-100 & MBO's slow transition to GrTime 12:00 Gr 100-120 Fe + Jarasite swirls at depthPit number 3
Location: Rocky Mouth CreekSite RMC O 0-2 Organic Dense pasture growthDate 30/10/2008 A 2-30 Black alluvial Abundant rootsTime 11:15 B 30-65 MC grey 3 yellow swirls 3 H>V 2 concretions/pipesPit number 2 G 65-104 MC to HC grey brown clay
Gr 104 + HC Dark balck greyPit number 3 Gr 90+ HC Dark balck greyPit number 4 Gr 85+ HC Dark balck grey
Catchment: Clarence
Details Mottles Macropores ParticularsHorizon Hor. Depth AbundanceColor Dia Oreint. Abundance
(cm) (0-4) (1-4) (H-V) (1-3)Location: Kings Creek Road, LawrenceSite Nathan Ensby O 0-2 Couch Swamp areaDate 12/03/2008 A 2-14 Black alluvial Abundant rootsTime 11:00 B 14-28 clay 4 orange 1 V>H 1 jarasite evidencePit number 1 B2 28-65 Clay white
Bg 65-80 Sand greyGr 80- Black mud
Site Nathan Ensby O 0-2 couch Near main drainDate 12/03/2008 A 2-28 Black alluvialTime 12:30 B 28-34 Clay 4 dark orange 1 H=V 1 Prominent mottlesPit number 2 B2 34-70 Clay
Bg 70-84 Grey sandGr 84- MC
Site Rod Ensby O 0-2 Couch Pasture areaDate 12/03/2008 A 2-32 Black alluvial low depression in shallow drainTime 14:30 B 32-64 dull mottling 1 dark red 1 H=V 1Pit number 3 Bg 64-88 MC grey blue
Gr 88- sand
Location: Lake WooloweyahSite Ring Drain O 0-1 OM couch couch browned off Date 13/03/2008 A 1-15 dark topsoil 0 ie flooding/army wormsTime 13:00 B1 15-70 silty clay grey 1 V>H 1 plastic, sparse orange streaksPit number 1 C 70- sand no structure
Site Ring Drain O 0-1 OM couch browned off/army worms?Date 13/03/2008 A 1-18 Topsoil browny/black roots vertical with Fe stainingTime 13:40 B 18-60 clay with sand grit 1 H=V 0 slow dischargePit number 2 B2 60-80 sandy clay
B3 80-100 grey sand lensBg 100-140 sandy peat more clay

North Coast NSW Acid Sulfate Soil Ksat Project 101
Catchment: Clarence
Details Mottles Macropores ParticularsHorizon Hor. Depth AbundanceColor Dia Oreint. Abundance
(cm) (0-4) (1-4) (H-V) (1-3)Location: ColdstreamSite Crows Nest Swp O 0-1 OM Couch and water couchDate 12/05/2008 A 1-20 Black soil Abundant rootsTime 9:30 B 20-70 Black/grey soil 0 1 H=V 1 old root channels barely visiblePit number 1 Bg 70-100 light orange grey clay
Gr 100+ Blue grey
Site Crows Nest Swp O 0-1 OM Couch pastureDate 12/05/2008 A 1-25 Blach topsoil Fine rootsTime 10:00 B 25-40 Mix black/grey s 0 1 V>H 1 Fine old root channelsPit number 2 Bg 40-110 light orange grey clay
Gr 110+ clay gel
Site Crows Nest Swp O 0-1 Water couch and common couchDate 12/05/2008 AB 1-110 Black soil 1 Dull Or/red 2 V 2 Abundant roots, Faint mottlesTime 12:30 Gr 110+ clay gel in old root channelsPit number 3 Some roots visible
Site Crows Nest Swp O 0-2 OM Dead couch materialDate 12/05/2008 A 2-30 Black soil 2 Dark red 1 V 1 Abundant roots/ soil cracksTime 13:30 B 30-100 Light black soil Some visible maropores, old rootsPit number 4 Gr 100+ Clay gel Gradual change to gel
Site Crows Nest Swp O 0-1 OM Dead plant material, salt wickingDate 12/05/2008 A 1-9 Black topsoil Abundant rootsTime 14:30 B2 9-11 Sand lense Course white sandPit number 5 B 11-60 Black/orange cl 1 Or/red 1 V 1 Mottling in old root channels
B3 60-100 Dark black and soil cracksBg 100+ clay
Location: The BroadwaterSite Arndilly A 0-15 Black soil Scald, Fe staining on surfaceDate 13/05/2008 B 15-40 plastic grey/blac 3 Pale yellow 1 H=V 2 some rootsTime 10:45 B2 40-70 MC grey odd roots, no Fe stainingPit number 1 Bg 70+ course grey sand prominent change
Site Arndilly A 0-15 Black soil Scald, Fe surface stainingDate 13/05/2008 B 15-30 Greyish brown 3 pale yellow 1 H=V 2 macropores not readily visibleTime 11:30 Bg 30-85 Grey clay, L/MC some roots, no mottlesPit number 2 Gr 85+ course grey sand
Site Arndilly P 0-2 Peat Scald, dead leaf matDate 13/05/2008 A 2-18 Black soil 1 dull redTime 14:00 B 18-34 Grey plastic cla 1 yellow Yellow swirls and mottlesPit number 3 B2 34-80 Course sand Prominent change
B3 80-100 Black sandGr 100+ Blue grey gel/clay basic consistency
Site Arndilly O 0-2 OM Salt water couchDate 13/05/2008 A 2-15 Black soilTime 14:30 B 15-65 3 yellow 1 V 1 mottles and swirlsPit number 4 Bg 65-100 Grey clay
Gr 100-102 Gritty Jarasite layer swirls102-110 slow change to gel
110+ Gel
Catchment: Macleay
Details Mottles Macropores ParticularsHorizon Hor. Depth Abundance Color Dia Oreint. Abundance
(cm) (0-4) (1-4) (H-V) (1-3)Location: Jerseyville/KitchenerSite Bob Rogars O 0-2 0 past marine intrusionDate 1/11/2007 B 2-10 1 reddish Fe deposits in root channelsTime 12:00 Bg 10-20 light grey color 2 reddish 2 H>V 2 Abundant roots at depth toPit number 1 Bg 20-40 L to MC 2 H>V 2 sulfidic horizon
Bj 40-62 Clay sand jarasite st 60cm62+ Grey sandy Clay
Site Bob Rogars A 0-5 Topsoil Fe in fine root channelsDate 1/11/2007 B 5-15 Burnt peat laye 2 (Oak area)Time 12:00 Bg 15-20 LC 3 red/orange Fe in root channels dominatePit number 2 20-50 3 H=V 1
50+ Silty sand
Site Bob Rogars O 0-2 organic 0 (open area)Date 1/11/2007 A 2-10 Silty loamTime 14:00 B 10-50 Silty LC 1 H 2 roots verticalPit number 3 B3 50-70 sand lens Fe flocc in older
Bg 70+ Dark grey silty sand decayed root channels

North Coast NSW Acid Sulfate Soil Ksat Project 102
Catchment: Macleay
Details Mottles Macropores ParticularsHorizon Hor. Depth Abundance Color Dia Oreint. Abundance
(cm) (0-4) (1-4) (H-V) (1-3)Site Bob Rogars O 0-2 organicDate 1/11/2007 B 2-20 3 Dark redTime 14:40 Bg 20-40 MC 2 Dark red 1 H<V 2 Old root channels + soil cracksPit number 4 Bg1 40-55 MC 0 1 H<V 1
55+ Black material/sand
Site Bob Rogars O 0-2Date 1/11/2007 A 2-18 1 Dark red Abundant rootsTime 15:00 B 18-50 LC 3 Dark red 1 H=V 1 Root channel FePit number 5 B2 50-60 Sand lens
B3 60-75 Clay sandBg 75+ Dark grey Clay sand
Location: Clancys DrainSite M&S Argue O 0-2 OM Pasture areaDate 2/11/2007 A 2-6 LC 1Time 9:45 B 6-42 MC 2 reddish 1 V=H 2 charcoal layer at 20cmPit number 1 Bg 42-100 MC 2 reddish 3 V<H 2 A few major contributing pores
Bj 100-125 MC Jarasite present, 125+ in root channels
Site M&S Argue O 0-2 OMDate 2/11/2007 A 2-6 LC 1Time 10:30 B 6-42 MC 2 reddish 1 V=H 2Pit number 2 Bj 42-120 MC 2 reddish 4 H>V 1 A few major contributing pores
120+ MC Jarasite increase from 80cm, in root channels
Site M&S Argue O 0-2 OMDate 2/11/2007 A 2-6 LC 1Time 11:00 B 6-42 MC 2 reddish 1 V=H 2Pit number 3 Bj 42-125 MC 2 reddish 4 H>V 1 A few major contributing pores
125+ MC Jarasite abundant from 65cm, in root channels
Site M&S Argue O 0-1 OMDate 2/11/2007 A 1-22 black color 2 reddish 1 V=H 2 Abundant vertical rootsTime 12:00 B 22-30 to light grey 3 reddish A few major contributing poresPit number 4 Bg 30-80 MC 3 reddish 4 H>V 1 Abundant mottles
Bj 80+ start of Jarasite swirls
Site M&S Argue O 0-1 OMDate 2/11/2007 A 1-22 black color 2 reddish 1 V=H 2 Abundant vertical rootsTime 13:00 B 22-30 to light grey 3 reddish A few major contributing poresPit number 5 Bg 30-70 MC 3 reddish 4 H>V 1 Abundant mottles
Bj 70+ Jarasite swirls
Location: Lancaster Dran Laterial 1Site Frogmore O 0-5 Couch Pasture area/dairyDate 4/12/2007 A 5-15 Black soilTime 11:42 B 15-37 some Fe sraininnil dark red in root channelsPit number 1 Bg 37-60 one large macropore at depth 1 V>H 1 mixed profil Clay and charcoal
Site Frogmore O 0-4 OM, couch, smartweedDate 4/12/2007 A 4-9 Black soilTime 12:15 B 9-50 Light clay 0 1 V>H 1 minor Fe in root channelsPit number 2 Bg 50-70 minor Fe in root channels
70+ Vert roots
Site Frogmore O 0-2Date 4/12/2007 A 2-20 Black topsoil 1 reddish minor Fe in root channelsTime 13:50 Bg 20-82 LC 1 V=H 1 minor Fe in root channelsPit number 3 82-102 Light grey clay at 36cm, large pores visible
Site S & H Prop. O 0-5 Couch/smartweed Pasture area/beefDate 4/12/2007 A 5-20 Mixed profile, light colored lensTime 15:15 B 20-90 Mixed profile, charcoal and clays 1 H>V 1 3-4 main pores contributingPit number 4
Site S & H Prop. O 0-2Date 4/12/2007 A 2-6 1 reddish roots verticalTime 13:45 B 6-22 1 reddish slight mottling, old root channelsPit number 5 Bj 22-75 Mixed/ Clay and charcoal 1 H=V 2 several main porse contributing
75+ MC

North Coast NSW Acid Sulfate Soil Ksat Project 103
Catchment: Hastings
Details Mottles Macropores ParticularsHorizon Hor. Depth Abundance Color Dia Oreint. Abundance
(cm) (0-4) (1-4) (H-V) (1-3)Location: RossglenSite Barry Par O 0-2 Kikuyu/sedgeDate 5/12/2007 A 2-14 Black alluvial vertical rootsTime 9:00 B 14-24 Light grey clay/mixed orangePit number 1 B1 24-40 light grey clay
Bg 40-80 Fe staining in MC 1 V>H 180- MC and roots
Site Barry Par O 0-2 paspalum/soft rush+ Date 5/12/2007 A 2-16 Black color 2 dark red/orange umbrella sedgeTime 10:00 B 16-26 Black colorPit number 2 26-28 Ash layer/ yellow orange
B1 28-30 Black colorBg 30-40 light grey color 1 V>H 1 Fe staining
40-90 light grey color/ 2 dark red/orange Fe staining in root channels90- light grey MC
Site Barry Par O 0-2 Dead veg, red colorDate 5/12/2007 A 2-18 Black topsoilTime 11:00 B 18-55 light grey 1 V>H 2 vertical rootsPit number 3 B2 55-85 soft sandy lens Fe staining, reddish
Bj 85- PASS/ some Fe Roots growing into fissures
Site Barry Par O 0-2 Dark West side of roadDate 5/12/2007 A 2-20 Dark/some mot 1 reddishTime 13:00 Bg 20-32 light grey 3 reddish 1 V>H 2 Fe stainingPit number 4 Bj 32-90 light MC Fe staining
Site Barry Par O 0-2 Dark colorDate 5/12/2007 A 2-18 Dark color some root channel Fe stainingTime 14:00 Bg 18-30 light grey/MC 2 red/orange 1 V>H 1Pit number 5 Bj 30-90 jarosite mottling swirls and concretions
90- PASS/ old root channels
Location: Maria RiverSite tree Plantation A 0-20 mud/alluvial black Drain depression/next to ti-treesDate 5/12/2007 B 20-36 high in OM, blackTime 9:00 Bg 36-50 light grey clay 1 reddish 1 H>V 0-1 some Fe mottlingPit number 1 C 50-115 plastic MC no mottling no mottling
Gr 115- PASS
Site tree Plantation A 0-15 Black mud Abundant rootsDate 5/12/2007 B 15-30 Fe in root channe 1 reddish 1 V=H 2Time 10:00 Bg 30-60 mottles and swirl 3 reddishPit number 2 G 60-120 MC no mottles
Gr 120- Pass
Site Torons Island O 0-2 Water couch/sedge previous scald areaDate 6/12/2007 A 2-26 dark grey/brownnil roots abundant to depthTime 12:00 B 26-50 SC to CS 1 dark red Fe staining along old root channelsPit number 3 Bg 50-85 orange light 1 V>H 1 very small pores
C 85-130 Clay sand/fine no Fe staining in new root growth
Site Hacks Ferry O 0-2 OM and peat Abundant WC, previous hotspotDate 7/12/2007 A 2-28 Black soil Abundant rootsTime 9:00 B 28-50 light grey color 1 dull red 3 H=V 2 Fe staining in root channels +Pit number 4 Bj 50-80 Fe concretions 3 Bright orange mix several major pores
80+ MC, light grey color plastic
Site Hacks Ferry O 0-2 OM carpet grass, water couchDate 7/12/2007 A 2-22 Black/alluvial Abundant roots/ verticalTime 10:00 Bj 22-80 light grey clay 3 orange 2-3 H=V 2-3 Fe concretions, bright orange swirlsPit number 5 80-90 plain grey 0
90+ Catchment: Manning
Details Mottles Macropores ParticularsHorizon Hor. Depth Abundance Color Dia Oreint. Abundance
(cm) (0-4) (1-4) (H-V) (1-3)Location: Lansdowne RiverSite Templman A 0-33 Black soil, mixed no Abundant roots H & VDate 14/04/2008 B 33-55 Light brown, yellowish clay nilTime 14:00 Bj 55-105 Clay, jarasite swirls nil swirls with gritty feelPit number 1
Site Templman A 0-25 Black soil, Abundant roots Carpet grass dominate area,Date 14/04/2008 B 25-50 Grey black no 2 H=V 2 slight elevation increase Time 14:00 B3 50-80 clay brownPit number 2 Bj 80-110 grey clay,jara swirls Jarasite swirls plus gritty feel
Site Templman A 0-28 Black topsoil Abundant roots to depthDate 14/04/2008 Bj 28-45 light colored clay no 2 H=V 1 patchy macroporesTime 14:00 Bj 45-90 Jarasite swirlsPit number 3 Gr 90+ dark grey some jarasite in old root channels

North Coast NSW Acid Sulfate Soil Ksat Project 104
Catchment: Manning
Details Mottles Macropores ParticularsHorizon Hor. Depth Abundance Color Dia Oreint. Abundance
(cm) (0-4) (1-4) (H-V) (1-3)Location: Motto AreaSite Roches O 0-3 Peat, fine leaf juncusDate 15/04/2008 A 3-23 Black to brown colors Mixed colorsTime 13:00 B 23-80 Fine sand in clay 1 H=V 1 Fe staining in root channelsPit number 1 (6) Bj 80-130 Jarasite swirls Jarasite swirls,mottles
Gr 130+ Blue grey color in root channels
Site Roches P 0-5 Peat, Fe staining 1 reddish Old ti-tree areaDate 15/04/2008 A 5-15 Black, some charcoalTime 9:00 B 15-45 Light grey 2 reddish 3 H=V 2 Abundant jarasite, Pit number 2 B2 45-65 Changing to darker grey mottling and sheet(soil fructures)
Bj 65-90 MC jarasite bright yellow swirls 90-130 jarasite abundant and Fe staining root channels
Site Roches P 0-3 Peat, Fe staining Old ti-tree areaDate 15/04/2008 A 3-15 Dark BlackTime 12:00 B 15-30 Light grey 2 red 3 V>H 2 Abundant vertical rootsPit number 3 Bj 30-110 semi dark MC Abundant jarasite paste
Gr 110 dark grey some jarasite swirls
Site Roches P 0-4 Peat Carpet grassDate 15/04/2008 A 4-14 Black topsoil Vertical rootsTime 11:30 B 14-24 LC, light grey Dull Fe staining, abundant rootsPit number 4 Bg 24-60 MC 2 yellow 2 V>H 2 Jarasite mottles
Bj 60-62 MC 3 yellow Jarasite mottles and grit layerBj 62-130 MC jarasite swirlsGr 130 Dark grey
Site Roches O 0-4 Peat, carpet grass Abundant rootsDate 15/04/2008 A 4-14 Black topsoilTime 12:40 B 14-16 LCPit number 5 B1 16-21 black charcoal color possible fire period
B2 21-50 Light colored clay 3 V>H 2Bg 50-85 MC, dark grey Jarasite swirls and gritBj 85-118 Dark grey Yellow jarasite
Site Roches O 0-3 Peat, thin needle sedgeDate 15/04/2008 A 3-20 Dark black topsoilTime 14:30 B 20-50 light grey clay 3 dull red 3 H=V 2 root channelPit number 7 Bj 50-86 LC/MC jarasite paste dominate
Bj 86-110 MC some jarasite evidentGr 110 Dark grey/blue
Site Roches O 0-3 peaty pastureDate 15/04/2008 A 3-20 Black topsoilTime 15:00 B 20-80 Light colored C 2 dull red 4 H=V 2 large pores, Fe coating+jarasitePit number 8 Bj 80-110 Dark grey Jarasite swirls
Gr 110 Blue grey
Site Roches O 0-3 Peaty pastureDate 15/04/2008 A 3-20 TopsoilTime 15:30 B 20-45 Light colored C 3 dull red 4 H=V 2 large pores, Fe coating + jarasitePit number 9 Bj 45-77 MC more jarasite swirls, vertical roots
Gr 77-110 Blue grey MC more jarasite swirls, vertical roots
Location: Cattai WetlandSite Lower wetland O 0-2 Peaty soil Salt water couch, JuncusDate 11/12/2007 A 2-12 Black/brown color Abundant roots, verticalTime 9:00 B 12-28 brown soil 1 dark red 1 H=V 1 Fine macropores, Fe lining rt chPit number 1 Bj 28-45 light grey color 2 dark red 3 H=V 2 Fe staining, fine macropores
Bg 45-105 nodules, concret 3 red/orange plastic, L/MC. roots, sand grit Gr 105+ dark grey sand evident, SLC
Site Sth Side A 0-20 Black topsoil Roots vertical, peat layer 0-3 cmDate 16/04/2008 B 20-70 Dark grey 2 dull red 1 V 1Time 12:00 B3 70-120 mixed soils 3 dull orange sticky plastic, vertical black Pit number 1 Bg 120-140 grey clay soil swirls
Site Sth Side A 0-20 Black topsoil Ab fine roots, peat layer 0-3cmDate 16/04/2008 B 20-105 light grey clay 3 dull red+ye 1 H>V 1 Yellow swirls increase with depthTime 11:00 Bg 105-122 Dark grey sand course sand lensePit number 2
Site Sth Side A 0-25 Black topsoil Roots vertical, OM peat layerDate 16/04/2008 B 25-90 Course sand 1 V>H 1 Small pores, Fe staining in rt chTime 15:00 B3 90-126 Grey sand No mottling or fleck colorPit number 3 Bg 126 Dark blue grey
Site Sth Side O 0-6 OM peatDate 16/04/2008 A 6-20 Black topsoil Fibrous rootsTime 14:30 B 20-50 CS +fine clay 1 orange very few rootsPit number 4 B3 50-78 CS + clay
Bg 78 grey sand pure grey sand, no mottling

Johnston and Slavich (2003) pp. 1-9. (NSW Agriculture:Wollongbar)
Hydraulic conductivity – a simple field test for shallow coastal acid sulfate soils 105
Appendix 9:
Hydraulic conductivity – a simple field test for
shallow coastal acid sulfate soils
Disclaimer: The information contained in this publication is based on knowledge and understanding at the time of writing (December 2003). However, because of advances in knowledge, users are reminded of the need to ensure that information upon which they rely is up to date and to check currency of the information with the appropriate officer of New South Wales Department of Agriculture or the user's independent adviser.

Johnston and Slavich (2003) pp. 1-9. (NSW Agriculture:Wollongbar)
Hydraulic conductivity – a simple field test for shallow coastal acid sulfate soils 106
Hydraulic conductivity – a simple field test for shallow
coastal acid sulfate soils S.G. Johnston and P.G. Slavich
NSW Agriculture, Wollongbar Agricultural Institute, Bruxner Highway, NSW 2477, Australia.
1. Outline of the method, its limitations and uses.
This is a simple, semi-quantitative field method for assessing the likely range of saturated hydraulic
conductivity (Ksat) in shallow coastal acid sulfate soils (ASS). It has been developed for extension
officers, landholders and field workers who work with ASS. It is based on established field based
methods for assessing Ksat in shallow pits (Bouwer and Rice, 1983; Boast and Langebartel, 1984). Ksat is
a critical variable affecting the hydrology and acid export dynamics of drained ASS. Assessment of Ksat
in ASS is important in order to design appropriate management strategies for broad acre remediation
projects.
Ksat can vary greatly, particularly in ASS, which undergo unique, one way structural changes due to
chemical dissolution of clay minerals, precipitation of iron minerals and physical ripening processes.
While Ksat can often be low (<1 m day-1
-Cook and Rassam, 2002), recent work has demonstrated that
Ksat can be extraordinarily high (>100 m day-1
) in the sulfuric horizons in some drained ASS
backswamps (Johnston et al., 2003). High values are generally associated with extensive soil
macropore networks (Hamming and van den Eelaart , 1993; Johnston et al., 2003).
The spatial heterogeneity of Ksat in shallow coastal ASS aquifers means that realistic field scale
estimates based on small scale methods (ie slug tests, permeameters, particle size analysis) can be
subject to significant errors (Millham and Howes, 1995). This is particularly true when groundwater flow
is dominated by macropores whose size and spatial variability are high relative to the size of area
sampled (Bouma, 1991). For this reason, tests which average aquifer response over larger areas (ie pit
bailing or tidal signal damping) are more likely to be representative of actual field Ksat values. This
method is designed to complement existing methods. It has a number of advantages and limitations
which are listed below. These should be understood before conducting the test.
Advantages
• It allows rapid, semi-quantitative assessment of Ksat in shallow ASS environments. • It is simple to conduct, only very basic equipment is required.
• It avoids complex mathematics. • Data collected in this method can be used* to derive a quantitative measurement of Ksat based on Bouwer and Rice (1983) or Boast and Langebartel (1984). (*Use in this fashion is user dependant).

Johnston and Slavich (2003) pp. 1-9. (NSW Agriculture:Wollongbar)
Hydraulic conductivity – a simple field test for shallow coastal acid sulfate soils 107
• It can be useful as an extension tool to undertake with landholders. • It can help assess whether substantial lateral groundwater seepage (to the drain /
from the drain) is likely to occur (ie during opening of floodgates).
Limitations
2. Equipment required • A flat shovel
• Stopwatch
• 50 cm ruler with 1 mm graduations
• 10 L bucket •
• Pen/pencil
• Two people
• It can help assess what hydrological pathway (groundwater seepage or surface runoff)
may dominate the acid flux at a given site.
3. Soil features to look out for Soil texture, soil structure and visible soil features such as macropores are important to look out for.
Macropores can play a very important role in water movement through ASS. Tubular macropores
associated with old root channels greater than 20 mm in diameter have been observed in some ASS.
The existence of clearly visible soil pores rapidly discharging groundwater after bailing the pit can be an
excellent indicator of high Ksat soils. When excavating the pit notes should be made on the following
features according to MacDonald et al. (1998).
• Soil texture • Ripeness (Dent, 1986) • Macropores – size, shape, density, orientation • Water flow via visible pores • Peat, organic matter, root material.
than 0.5 m from the surface. • In this form it is semi-quantitative only and provides a Ksat estimate within certain ranges (ie Low / Medium / High / Extreme). • It requires the user to stay within defined ranges for pit size, water levels and bail out volumes. • It is a ‘bulk’ estimate and does not allow discrimination between horizontal and vertical flow components.
• It can only be used when the water table is below the ground surface, but no deeper
• It can only be used to assess Ksat in shallow soil horizons (ie not more than about 0.6 m below the ground surface).

Johnston and Slavich (2003) pp. 1-9. (NSW Agriculture:Wollongbar)
Hydraulic conductivity – a simple field test for shallow coastal acid sulfate soils 108
4. Locating your pit
Choose sites that are representative of the area you wish to assess. Ksat can be highly variable over
short distances and often varies vertically down the soil profile according to the characteristics of the soil
horizons (Fig. 1). For example, Ksat is often low in the unoxidised, gel-like sulfidic horizons. Ksat can also
be different in the horizontal and vertical planes within an individual soil horizon. In ASS backswamps
Ksat may be related to the geomorphic history and origins of the underlying sediments, and thus may
show some trends related to site topography. The number of tests you conduct and where you locate
them should be related to your data needs. If you want some idea of the variability of Ksat it will be
important to construct a number of pits across the site.
Fig. 1. Schematic diagram of how hydraulic conductivity may vary with depth. The sulfuric horizon is most significant from an acid export point of view as it may contain a large store of acid groundwater, and being closer to the ground surface, is more likely to be intercepted by a drain.
5. Pit construction – dimensions, size limits, water table boundaries
While the data analysis component of this test avoids complex mathematics, it has been field calibrated
only within a certain range of pit dimensions and water table heights. This point is important. Pit
excavation should follow these instructions closely (see Fig. 2). Failure to do so will compromise the
accuracy of the test.
• The pit should be as square as possible with vertical sides and a ‘flat’ (as possible) bottom (see Fig. 2 for pit geometry and abbreviations). Avoid excessive smearing of pit faces. • Minimum area of 30 cm x 30 cm (W x B). • Maximum area of 50 x 50 cm (W x B). • Maximum depth of pit from ground surface (D) = 60 cm. • A minimum of 10 cm water depth is required in the bottom of the pit (L) at equilibration with the surrounding water table.

Johnston and Slavich (2003) pp. 1-9. (NSW Agriculture:Wollongbar)
Hydraulic conductivity – a simple field test for shallow coastal acid sulfate soils 109
D= to base of pit below
ground surface
W = width
B = breadth
L = depth to base of pit
below equilibrium water
table
Fig. 2. Example of pit geometry and abbreviations.
• B and W should be as equal as possible (ie a square pit). • The ratio L/W must be between 0.2 and 0.75. This is important as the data processing is calibrated to these ranges. See Table 1 for example pit dimensions which generate an acceptable L/W ratio. • The pit water level at equilibration with surrounding water table must be at least 5 cm below ground surface. • Bail out between 50% to 90% of water volume in the pit.
Table 1: Example of pit dimensions (L, W) which generate acceptable ratios of L/W (0.2 to 0.75).
L (cm)
6. Recording field information • When recording L (where L = average depth to base of pit below equilibrium water table, see Fig. 2) make at least 10 random measurements across the pit. More can be made if required. The mean of these measurements will be used in the data analysis component of this test. This will help reduce errors from having a slightly uneven pit base. • Record pit dimensions on the record sheet provided with this method as per the example of pit geometry provided in Fig. 2. The mean of several measurements of B and W may be required if the pit is slightly uneven. Use your discretion.
W (cm) 10 15 20 25 30 35
30 0.33 0.50 0.67 - - -
40 0.25 0.38 0.50 0.63 - - 50 0.20 0.30 0.40 0.50 0.60 0.70

Johnston and Slavich (2003) pp. 1-9. (NSW Agriculture:Wollongbar)
Hydraulic conductivity – a simple field test for shallow coastal acid sulfate soils 110
7. Conducting the test • Dig the pit so that the dimensions accord to the instructions outlined in section 5 ‘Pit construction’. Observe and record soil features as outlined in section 3. • Wait until the pit water level has reached equilibration with the surrounding water table. • Record the pit dimensions and water table depth parameters on a record sheet (provided with this method). • Insert the 50 cm ruler vertically several centimetres into sediment in the base of the pit in one corner where you can easily read it. Make sure the ruler is stable. Note – make sure you record the raw equilibrium water level depth on the ruler. (ie L might be ~20 cm but you insert the ruler several cm into the sediment so the raw water level reading on ruler before bailing is 24 cm). This is vital for later calculations. • Rapidly bail out the water in pit using 10 L bucket. Be slow and steady during the last bail to minimise ‘sloshing’ and water level oscillation in the pit. • Have one person start the stopwatch immediately after the last bail and begin counting the seconds out loud. Have the other person watching the water level on the ruler and recording the level from zero seconds onwards. • Record the water level approximately every 5 seconds (on record sheet) for a minimum of 3 minutes or until at least ~80% of the pit bail out volume is replaced, up to a maximum of 30 minutes if required. • If the pit infill rate is slow, then record the water level at time intervals which are long enough to allow accurate measurement (ie rise in water level of at least 1 mm per time increment). Adjust the time intervals on your record sheet accordingly. • Wait until equilibrium level is obtained and repeat the test at least once in the same pit.
8. Data entry and plotting
The data you record should be entered onto the Excel spreadsheet provided with this method.
Instructions for data entry are provided within the spreadsheet (Ksat pit test data analysis.xls). Read
the instructions thoroughly before entering data. The spreadsheet also calculates the ratio L/W and the
percentage of the pit water volume you bailed out so that you can check to see if it is within the
permissible ranges listed in section 5 ‘Pit construction’.
The spreadsheet will perform very simple calculations and plotting automatically. No responsibility is
taken if you alter the calculations in any way! After you enter your data the resultant plot will show the
normalised pit refill rate vs time and should look something like Fig. 3. The plot line will fall into one of
four pre-set categories listed below which approximate the following Ksat ranges*. • Low = less than 1.5 m day
-1
• Medium = 1.5 to 15 m day-1
• High = 15 to 100 m day
-1
• Extreme = greater than 100 m day-1
*Note: This is an approximation only. Quantitative assessment of Ksat from the data collected in this method will require the user
to apply the calculation method(s) outlined in Bouwer and Rice (1983) or Boast and Langebartel (1984).

Johnston and Slavich (2003) pp. 1-9. (NSW Agriculture:Wollongbar)
Hydraulic conductivity – a simple field test for shallow coastal acid sulfate soils 111
Fig. 3. An example of pit refill data after plotting in spreadsheet.
9. Interpreting data and assessing Ksat
The example pit refill data shown in Fig. 3 shows a Ksat in the high range (ie between approximately 15
to 100 m day-1
).
If a sites Ksat falls in the high or extreme range, then depending on other factors (ie elevation of acid
horizons relative to local low tide levels, whether the drain intercepts those high Ksat soil horizons, any
‘pugging’ and blockage of macropores at the drain bank face), there is a very real probability that
groundwater seepage may be a major hydrological pathway of acid export. In this case, a containment
strategy will likely be an important management option. Acid groundwater may be contained by infilling
or shallowing drains, or by using a retention structure to keep drain water levels high and stable and
prevent the development of effluent groundwater gradients through tidal drawdown (Fig. 4).
High or extreme range Ksat also means that if floodgates are opened and saline water introduced into a
drain there is a possibility that this saline water could move laterally away from the drain over substantial
distances. However, this will also be dependant on the driving head and will only occur if the gradients
are influent (ie the drain water level is higher than the groundwater level).
If a sites Ksat falls in the low range then the risk of lateral salt water seepage if floodgates are opened is
likely to be minimal.
If a sites Ksat falls in the medium range then further quantitative assessment of Ksat may be warranted in
order to assess the risk of lateral salt water seepage due to floodgate opening. Monitoring the response
of the water table adjacent to the drain during a freshwater floodgate opening event may also be useful.

Johnston and Slavich (2003) pp. 1-9. (NSW Agriculture:Wollongbar)
Hydraulic conductivity – a simple field test for shallow coastal acid sulfate soils 112
Fig. 4. A schematic representation of (a) the development of effluent groundwater gradients during low tides, leading to acid groundwater seepage and (b) the use of a retention structure (weir) to prevent tidal draw down in drain water levels and thereby reduce gradients and subsequent groundwater seepage.
10. Availability of this method
This method, including these instructions, recording sheets and an Excel spreadsheet for data entry, is
available on CD from NSW Agriculture at Wollongbar Agricultural Institute. Alternatively, copies of the
above can be downloaded for free at www.agric.nsw.gov.au/reader/floodgate-guidelines.
11. References and suggested further reading Beven K and Germann P (1982) Macropores and water flow in soils. Water Resources Research 18, 1311-1325.
Boast CW and Langebartel RG (1984) Shape factors for seepage into pits. Soil Science Society of America 48, 10 15.
Bouma J (1991) Influence of soil macroporosity on environmental quality. In ‘Advances in agronomy -Volume 46’. (Ed. DL Sparks) pp.1-37. (Academic Press)

Johnston and Slavich (2003) pp. 1-9. (NSW Agriculture:Wollongbar)
Hydraulic conductivity – a simple field test for shallow coastal acid sulfate soils 113
Bouwer H and Rice RC (1976) A slug test for determining hydraulic conductivity of unconfined aquifers with completely or partially penetrating wells. Water Resources Research 12, 423-428.
Bouwer H and Rice RC (1983) The pit bailing method for hydraulic conductivity measurement of isotropic or
anisotropic soil. American Society of Agricultural Engineering 26, 1435-1439.
Bouwer H (1989) The Bouwer and Rice slug test – and update. Groundwater 27, 304-309.
Butler JJ (1996) Slug tests in site characterisation: some practical considerations. Environmental Geosciences 3,
154-163.
Cook FJ, Rassam DW, Blunden BG, Gardner EA and Carlin GD (1999) Irrigation and drainage: effects on acid
export from acid sulfate soils. In ‘Proceedings of Workshop on Remediation and Assessment of Broadacre Acid
Sulfate Soils, Lismore’ (Ed. Slavich P) pp. 78-87. (Acid Sulfate Soils Management Advisory Committee: Wollongbar)
Cook FJ and Rassam DW (2002) An analytical model for predicting water table dynamics during drainage and
evaporation. Journal of Hydrology 263, 105-113.
Dent D (1986) ‘Acid Sulphate Soils: a Baseline for Research and Development.’ ILRI Publication No. 39.
(International Institute for Land Reclamation and Improvement: Wageningen)
Hamming AFJ and van den Eelaart ALJ (1993) Soil permeability, interflow and actual acidity in acid sulphate soils,
South Kalimantan, Indonesia. In ‘Selected Papers of the Ho Chi Minh City Symposium on Acid Sulphate Soils.’
pp.155-159 (Eds Dent DL and van Mensvoort MEF) (ILRI: Wageningen)
Lomen DO, Warrick AW and Zhang R (1987) Determination of hydraulic conductivity from auger holes and pits – an
approximation. Journal of Hydrology 90, 219-229.
Johnston SG, Slavich PG and Hirst P (2003) Hydraulic conductivity in the sulfuric horizons at Partridge Creek acid
sulfate soil hotspot. Report to Hastings Council no. DAN13/1, 9 pp. (NSW Agriculture, Wollongbar, Australia)
MacDonald RC, Isbell RF, Speight JG, Walker J and Hopkins MS (1998) Australian Soil and Land Survey – Field
Handbook, 2nd
edition. (CSIRO, Canberra)
Millham NP and Howes BL (1995) A comparison of methods to determine K in a shallow coastal aquifer.
Groundwater 33, 49-57.

Assessm
ent o
f hyd
raulic co
nd
uctivity in
coastal flo
od
plain
acid su
lfate soils o
n th
e no
rth co
ast of N
SW
Assessment of hydraulic conductivity in coastal floodplain acid sulfate soils
on the north coast of NSW
W W W. I N D U S T R Y. N S W. G O V. A U