assessment of image quality in abdominal ct: potential ...€ mbir’s main advantage is its...
TRANSCRIPT

COMPUTED TOMOGRAPHY
Assessment of image quality in abdominal CT: potentialdose reduction with model-based iterative reconstruction
Bharti Kataria1 & Jonas Nilsson Althén2& Örjan Smedby3 & Anders Persson1
&
Hannibal Sökjer4 & Michael Sandborg2
Received: 28 February 2017 /Revised: 23 August 2017 /Accepted: 29 September 2017 /Published online: 24 January 2018# The Author(s) 2017. This article is an open access publication
AbstractPurpose To estimate potential dose reduction in abdominalCT by visually comparing images reconstructed with filteredback projection (FBP) and strengths of 3 and 5 of a specificMBIR.Material and methods A dual-source scanner was used toobtain three data sets each for 50 recruited patients with 30,70 and 100% tube loads (mean CTDIvol 1.9, 3.4 and 6.2mGy). Six image criteria were assessed independently by fiveradiologists. Potential dose reduction was estimated withVisual Grading Regression (VGR).Results Comparing 30 and 70% tube load, improved imagequality was observed as a significant strong effect of log tubeload and reconstruction method with potential dose reductionrelative to FBP of 22–47% for MBIR strength 3 (p < 0.001).For MBIR strength 5 no dose reduction was possible for im-age criteria 1 (liver parenchyma), but dose reduction between34 and 74% was achieved for other criteria. Interobserverreliability showed agreement of 71–76% (κw 0.201–0.286)and intra-observer reliability of 82–96% (κw 0.525–0.783).Conclusion MBIR showed improved image quality com-pared to FBP with positive correlation between MBIR
strength and increasing potential dose reduction for all butone image criterion.Key Points• MBIR’s main advantage is its de-noising properties, whichfacilitates dose reduction.
• MBIR allows for potential dose reduction in relation to FBP.• Visual Grading Regression (VGR) produces direct numericalestimates of potential dose reduction.
•MBIR strengths 3 and 5 dose reductions were 22–34 and 34–74%.
•MBIR strength 5 demonstrates inferior performance for liverparenchyma.
Keywords Dose . Computed tomography . Iterativereconstruction . Abdomen . FBP
AbbreviationsADMIRE Advanced Modeled Iterative ReconstructionALARA As low as reasonably achievableCT Computed tomographyFBP Filtered back projectionIR Iterative reconstructionkV KilovoltMBIR Model-based iterative reconstructionmAs Milliampere-secondmSv MillisievertQref Quality referenceVGR Visual Grading Regression
Introduction
Technical developments and new applications have led to anincrease in the use of computed tomography (CT) in medical
* Bharti [email protected]
1 Department of Radiology, Department of Medical and HealthSciences, Center for Medical Image Science and Visualization(CMIV), Linköping University, S-581 85 Linköping, Sweden
2 Department of Medical Physics, Department of Medical and HealthSciences, Linköping University, Linköping, Sweden
3 School of Technology and Health (STH), KTH Royal Institute,Stockholm, Sweden
4 Department of Medical and Health Sciences, Linköping University,S-581 83 Linköping, Sweden
Eur Radiol (2018) 28:2464–2473https://doi.org/10.1007/s00330-017-5113-4

imaging and the associated population doses that arise from it[1, 2]. CT contributes up to 70% of the collective effectivedose, although it accounts for only 10–15% of the total med-ical imaging procedures that use ionising radiation [3–6].Multiphase examinations are more common in abdominalCT, and approximately 30% of CT examinations are abdom-inal and pelvic, which deliver an effective dose of approxi-mately 6–8 mSv [7]. In recognition of benefits of CT [8], theoptimisation of the clinical protocols is motivated to keep thedose as low as reasonably achievable (ALARA principle) [9,10].
Modern CT equipment presents a number of dose-reduction strategies such as automatic tube current modu-lation, iterative reconstruction algorithms (IR), dynamiccollimation and dose efficient detectors, among others[1, 10, 11].
IR selectively reduces statistical noise in the imagesthus improving image quality of subtle details, and mayfacilitate dose reduction. There has been successful im-provement in performance of the IR algorithms as theyhave evolved in the past decade from statistical tomodel-based algorithms (MBIR) [11, 12]. MBIR, whichmay be applied at different strengths, perform noise re-duction in both raw data and image domains and incorpo-rate physical models to accurately correct for a variety ofimage degrading effects [13, 14]. Several studies indicatethat an increase in the strength of IR allows for largerdose reductions [13, 15, 16]. Evaluations of radiologicalimaging methods can be performed either by studyingtheir ability to provide correct diagnoses [17] or by visualassessment of well-defined image quality features (visualgrading) [18]. However, to our knowledge, there are nostudies that directly estimate the dose-reduction potentialof the Advanced Modeled Iterative Reconstruction(ADMIRE, Siemens, Erlangen, Germany) algorithm inthe clinical setting using pair-wise comparison of images.
The aim of this study was to assess visual imagequality between filtered back projection (FBP) andADMIRE strengths 3 and 5 (out of 5) in abdominalCT, and to estimate the dose-reduction potential of thereconstruction algorithm.
Material and methods
This was a regional ethical board-approved prospective studyconducted at the Centre for Medical Image Science andVisualization (CMIV), Linköping University, Sweden.
A Somatom Force 192-slice dual source CT (Siemens) wasused to obtain three data sets of images per patient at 30, 70and 100% dose levels from a single abdominal acquisition.These were achieved without additional patient exposure asthe 30 and 70% tube loads were obtained simultaneouslyusing the dual sources. The acquisition parameters from astandard clinical abdominal protocol are presented inTable 1. Due to a 35.5-cm diameter restriction of the smalldetector scan field of view (SFoV), ethical approval was ob-tained for 90 patients as anatomical fit to the smaller SFoVcould only be determined after the scan was performed.
Patients were informed as to the intent of the study andwritten consent and approval were obtained. Inclusion criteriawere patients over the age of 18 years undergoing a clinicalabdominal CT with appropriate patient body habitus deter-mined by visual estimation and use of a calliper to estimatepatient size before the scan. Forty patients were excluded dueto size and anatomical variations.
Of the 50 examinations, 25 were contrast-enhanced and 25non-enhanced examinations.
Critical care was taken in patient positioning at isocentre inthe gantry. Demographical data such as age, height and weightwere also recorded.
Procedure
The images were anonymised so as to avoid identification ofindividual patients.
Images at each dose level (30, 70 and 100%) were recon-structed with FBP and ADMIRE strengths 3 and 5. Pairwisevisual grading was carried out independently by five radiolo-gists with varying experience (6–20 years), using four modi-fied criteria (C1–C4) from the European guidelines for imagequality in abdominal CT [19] together with image noise (C5)and overall image quality (C6) [20] to suit the purpose of thisstudy. The criteria used were as follows:
Table 1 Acquisition parameters for dual source Somatom Force (Siemens, Erlangen, Germany) for tube A and tube B (smaller detector) and DualEnergy Composition (DE comp) set at 0.5 i.e. equal kV weighting for each x-ray tube
Source U (kV) Qref (mAs) Acquisition Rotation (s) Pitch Care Dose 4D Kernel Dose level Slice thickness/Increment (mm)
Tube A+B 120 140 192 × 0.6 0.5 0.6 Yes Br36 100% 3/2
Tube A 120 98 192 × 0.6 0.5 0.6 Yes Br36 70% 3/2
Tube B 120 42 192 × 0.6 0.5 0.6 Yes Br36 30% 3/2
Qref quality reference
Eur Radiol (2018) 28:2464–2473 2465
C1. Visually sharp reproduction of the liver parenchymaC2. Visually sharp reproduction of the pancreas contourC3. Visually sharp reproduction of the contours of thekidneys and proximal uretersC4. Visually sharp reproduction of the contours of lymphnodes smaller than 15 mmC5. Image noise not affecting interpretationC6. Overall image quality for diagnostic purposes.
All of the radiologists had 3–4 years’ of experience withSAFIRE strength 3 and one radiologist has been working withADMIRE strength 3 for a year.
Prior to the study the participating radiologists werecoached in grading the different aspects of subjective imagequality so as to form a similar understanding of interpretationof the image criteria in order to minimise inter-observer vari-ation. The data sets used in the coaching session were notincluded in the study population. Each reader rated the criteriain a randomised, blinded and pair-wise approach on DICOM-calibrated (EIZO RX 240) PACS version 17.3 (Sectra,Linköping, Sweden) workstations. The image pairs weregraded on a 5-point Likert-type scale (Table 2).
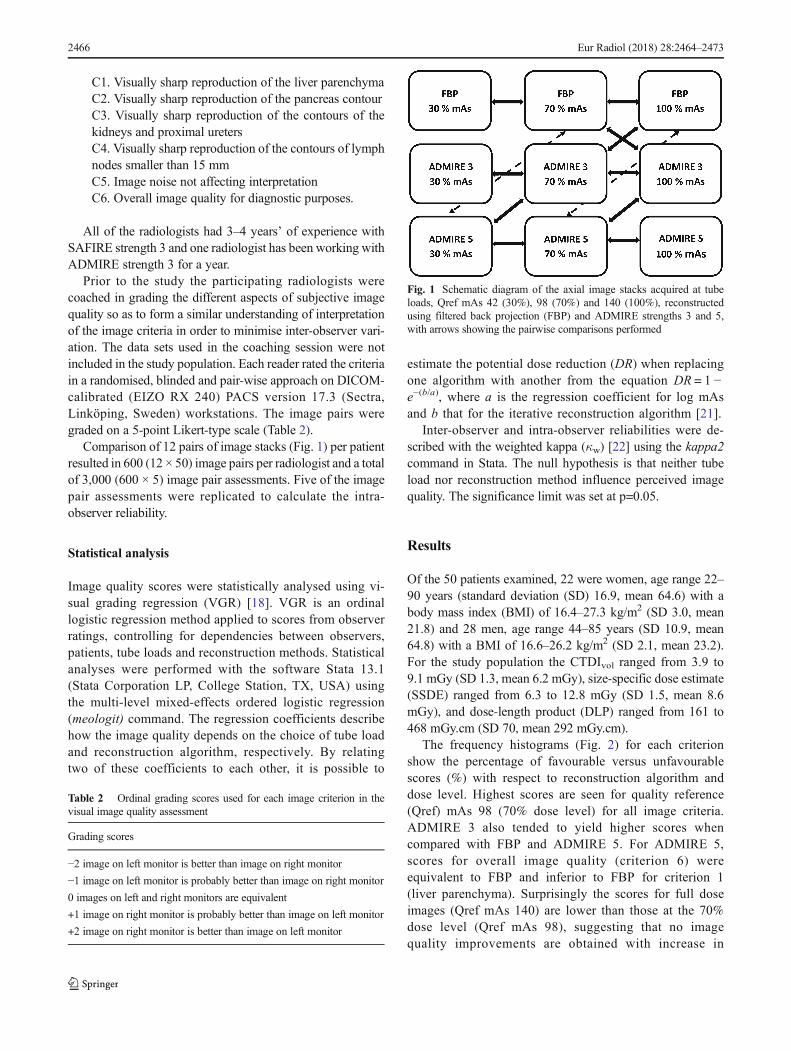
Comparison of 12 pairs of image stacks (Fig. 1) per patientresulted in 600 (12 × 50) image pairs per radiologist and a totalof 3,000 (600 × 5) image pair assessments. Five of the imagepair assessments were replicated to calculate the intra-observer reliability.
Statistical analysis
Image quality scores were statistically analysed using vi-sual grading regression (VGR) [18]. VGR is an ordinallogistic regression method applied to scores from observerratings, controlling for dependencies between observers,patients, tube loads and reconstruction methods. Statisticalanalyses were performed with the software Stata 13.1(Stata Corporation LP, College Station, TX, USA) usingthe multi-level mixed-effects ordered logistic regression(meologit) command. The regression coefficients describehow the image quality depends on the choice of tube loadand reconstruction algorithm, respectively. By relatingtwo of these coefficients to each other, it is possible to
estimate the potential dose reduction (DR) when replacingone algorithm with another from the equation DR = 1 −e−(b/a), where a is the regression coefficient for log mAsand b that for the iterative reconstruction algorithm [21].
Inter-observer and intra-observer reliabilities were de-scribed with the weighted kappa (κw) [22] using the kappa2command in Stata. The null hypothesis is that neither tubeload nor reconstruction method influence perceived imagequality. The significance limit was set at p=0.05.
Results
Of the 50 patients examined, 22 were women, age range 22–90 years (standard deviation (SD) 16.9, mean 64.6) with abody mass index (BMI) of 16.4–27.3 kg/m2 (SD 3.0, mean21.8) and 28 men, age range 44–85 years (SD 10.9, mean64.8) with a BMI of 16.6–26.2 kg/m2 (SD 2.1, mean 23.2).For the study population the CTDIvol ranged from 3.9 to9.1 mGy (SD 1.3, mean 6.2 mGy), size-specific dose estimate(SSDE) ranged from 6.3 to 12.8 mGy (SD 1.5, mean 8.6mGy), and dose-length product (DLP) ranged from 161 to468 mGy.cm (SD 70, mean 292 mGy.cm).
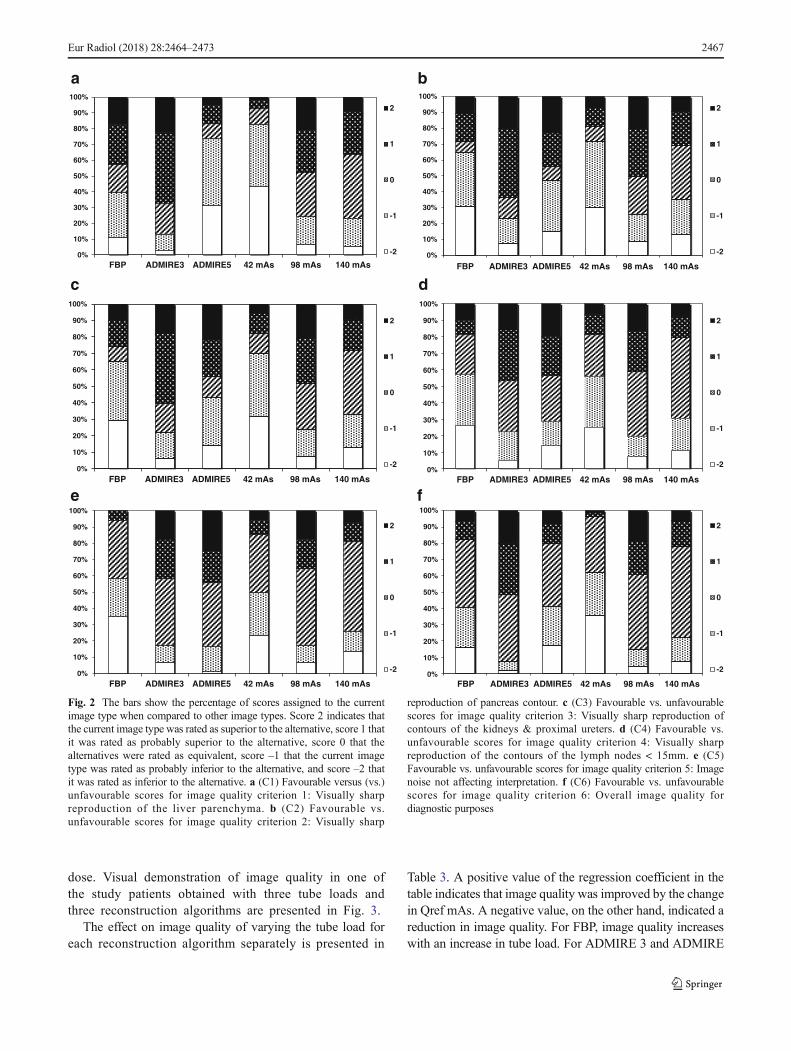
The frequency histograms (Fig. 2) for each criterionshow the percentage of favourable versus unfavourablescores (%) with respect to reconstruction algorithm anddose level. Highest scores are seen for quality reference(Qref) mAs 98 (70% dose level) for all image criteria.ADMIRE 3 also tended to yield higher scores whencompared with FBP and ADMIRE 5. For ADMIRE 5,scores for overall image quality (criterion 6) wereequivalent to FBP and inferior to FBP for criterion 1(liver parenchyma). Surprisingly the scores for full doseimages (Qref mAs 140) are lower than those at the 70%dose level (Qref mAs 98), suggesting that no imagequality improvements are obtained with increase in
Table 2 Ordinal grading scores used for each image criterion in thevisual image quality assessment
Grading scores
−2 image on left monitor is better than image on right monitor
−1 image on left monitor is probably better than image on right monitor
0 images on left and right monitors are equivalent
+1 image on right monitor is probably better than image on left monitor
+2 image on right monitor is better than image on left monitor
Fig. 1 Schematic diagram of the axial image stacks acquired at tubeloads, Qref mAs 42 (30%), 98 (70%) and 140 (100%), reconstructedusing filtered back projection (FBP) and ADMIRE strengths 3 and 5,with arrows showing the pairwise comparisons performed
2466 Eur Radiol (2018) 28:2464–2473
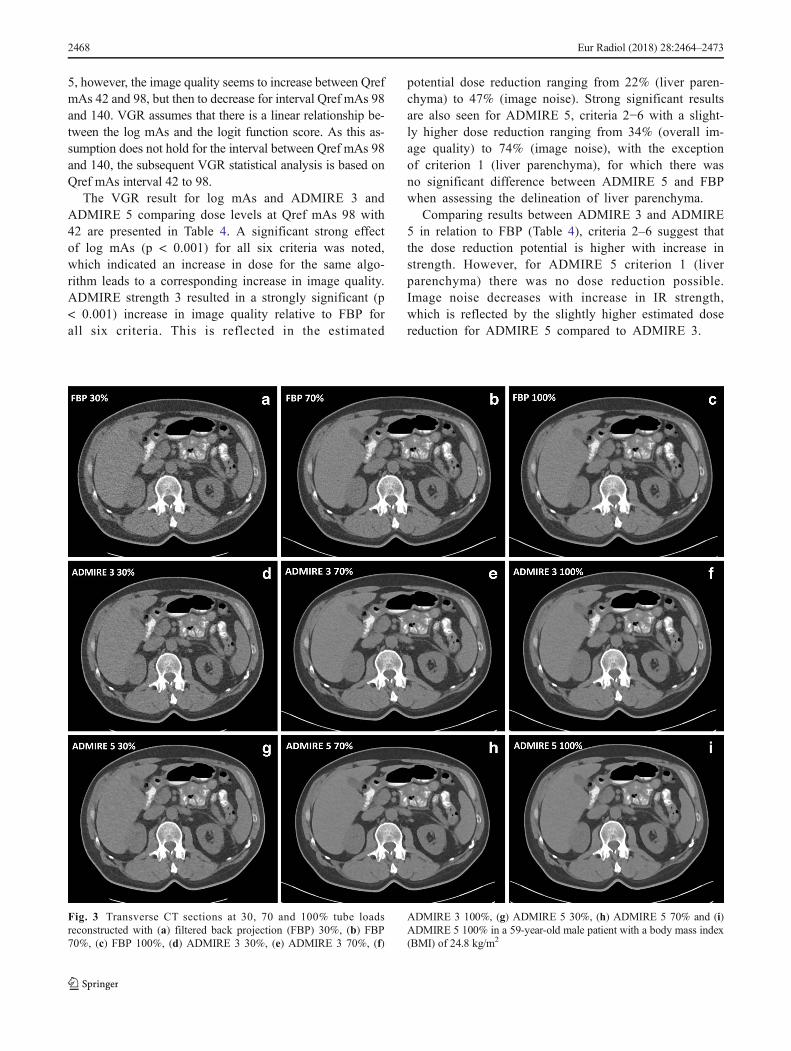
dose. Visual demonstration of image quality in one ofthe study patients obtained with three tube loads andthree reconstruction algorithms are presented in Fig. 3.
The effect on image quality of varying the tube load foreach reconstruction algorithm separately is presented in
Table 3. A positive value of the regression coefficient in thetable indicates that image quality was improved by the changein Qref mAs. A negative value, on the other hand, indicated areduction in image quality. For FBP, image quality increaseswith an increase in tube load. For ADMIRE 3 and ADMIRE
0%
10%
20%
30%
40%
50%
60%
70%
80%
90%
100%
FBP ADMIRE3 ADMIRE5 42 mAs 98 mAs 140 mAs0%
10%
20%
30%
40%
50%
60%
70%
80%
90%
100%
FBP ADMIRE3 ADMIRE5 42 mAs 98 mAs 140 mAs
2
1
0
-1
-2
2
1
0
-1
-2
2
1
0
-1
-2
2
1
0
-1
-2
2
1
0
-1
-2
2
1
0
-1
-2
0%
10%
20%
30%
40%
50%
60%
70%
80%
90%
100%
FBP ADMIRE3 ADMIRE5 42 mAs 98 mAs 140 mAs0%
10%
20%
30%
40%
50%
60%
70%
80%
90%
100%
FBP ADMIRE3 ADMIRE5 42 mAs 98 mAs 140 mAs
0%
10%
20%
30%
40%
50%
60%
70%
80%
90%
100%
FBP ADMIRE3 ADMIRE5 42 mAs 98 mAs 140 mAs0%
10%
20%
30%
40%
50%
60%
70%
80%
90%
100%
FBP ADMIRE3 ADMIRE5 42 mAs 98 mAs 140 mAs
a b
c
e f
d
Fig. 2 The bars show the percentage of scores assigned to the currentimage type when compared to other image types. Score 2 indicates thatthe current image type was rated as superior to the alternative, score 1 thatit was rated as probably superior to the alternative, score 0 that thealternatives were rated as equivalent, score –1 that the current imagetype was rated as probably inferior to the alternative, and score –2 thatit was rated as inferior to the alternative. a (C1) Favourable versus (vs.)unfavourable scores for image quality criterion 1: Visually sharpreproduction of the liver parenchyma. b (C2) Favourable vs.unfavourable scores for image quality criterion 2: Visually sharp
reproduction of pancreas contour. c (C3) Favourable vs. unfavourablescores for image quality criterion 3: Visually sharp reproduction ofcontours of the kidneys & proximal ureters. d (C4) Favourable vs.unfavourable scores for image quality criterion 4: Visually sharpreproduction of the contours of the lymph nodes < 15mm. e (C5)Favourable vs. unfavourable scores for image quality criterion 5: Imagenoise not affecting interpretation. f (C6) Favourable vs. unfavourablescores for image quality criterion 6: Overall image quality fordiagnostic purposes
Eur Radiol (2018) 28:2464–2473 2467
5, however, the image quality seems to increase between QrefmAs 42 and 98, but then to decrease for interval Qref mAs 98and 140. VGR assumes that there is a linear relationship be-tween the log mAs and the logit function score. As this as-sumption does not hold for the interval between Qref mAs 98and 140, the subsequent VGR statistical analysis is based onQref mAs interval 42 to 98.
The VGR result for log mAs and ADMIRE 3 andADMIRE 5 comparing dose levels at Qref mAs 98 with42 are presented in Table 4. A significant strong effectof log mAs (p < 0.001) for all six criteria was noted,which indicated an increase in dose for the same algo-rithm leads to a corresponding increase in image quality.ADMIRE strength 3 resulted in a strongly significant (p< 0.001) increase in image quality relative to FBP forall six criteria. This is reflected in the estimated
potential dose reduction ranging from 22% (liver paren-chyma) to 47% (image noise). Strong significant resultsare also seen for ADMIRE 5, criteria 2−6 with a slight-ly higher dose reduction ranging from 34% (overall im-age quality) to 74% (image noise), with the exceptionof criterion 1 (liver parenchyma), for which there wasno significant difference between ADMIRE 5 and FBPwhen assessing the delineation of liver parenchyma.
Comparing results between ADMIRE 3 and ADMIRE5 in relation to FBP (Table 4), criteria 2–6 suggest thatthe dose reduction potential is higher with increase instrength. However, for ADMIRE 5 criterion 1 (liverparenchyma) there was no dose reduction possible.Image noise decreases with increase in IR strength,which is reflected by the slightly higher estimated dosereduction for ADMIRE 5 compared to ADMIRE 3.
Fig. 3 Transverse CT sections at 30, 70 and 100% tube loadsreconstructed with (a) filtered back projection (FBP) 30%, (b) FBP70%, (c) FBP 100%, (d) ADMIRE 3 30%, (e) ADMIRE 3 70%, (f)
ADMIRE 3 100%, (g) ADMIRE 5 30%, (h) ADMIRE 5 70% and (i)ADMIRE 5 100% in a 59-year-old male patient with a body mass index(BMI) of 24.8 kg/m2
2468 Eur Radiol (2018) 28:2464–2473

When comparing ADMIRE strength 3 with ADMIREstrength 5 (Table 5), the regression yielded significant(p<0.001) values for most criteria when dose levels for thesame algorithm strength are compared, confirming thatADMIRE 5 is superior to ADMIRE 3. However, for criterion1 (liver parenchyma) the negative coefficient value (−0.98)indicates that image quality in ADMIRE 5 is significantlylower compared to ADMIRE 3 and hence does not allow forany further dose reduction. Also, overall image quality with aregression coefficient value of −0.85 was not significant. Forthe criteria assessed, ADMIRE strengths 3 and 5 are superiorwhen compared to FBP individually except for criterion 1(ADMIRE 5). When it comes to delineation of the liver pa-renchyma and overall image quality, ADMIRE 5 was inferiorto ADMIRE 3 with no dose reduction possible.
There were marginal differences in the results of the VGRanalysis between the groups of patients who received intrave-nous contrast material and those who did not (data not shown).
The inter-observer agreement was fair, 71–76% with κwranging from 0.201 (confidence interval (CI) 0.175–0.228)to 0.286 (CI 0.258–0.314). The intra-observer κw valuesranged from 0.525 (CI 0.209–0.840) to 0.783 (CI 0.577–1.021), showing a moderate to substantial agreement between82 and 96% for all the criteria.
Discussion
In radiology, several analysis methods can be used to describeimage quality. The receiver operating characteristic (ROC)
Table 3 Dependency on tube load for different reconstruction algorithms. Visual grading regression (VGR) coefficients for log (mAs) in pairwisecomparisons of two quality reference (Qref) mAs values
Criterion Reconstruction algorithm
FBP ADMIRE 3 ADMIRE 5
42 mAs vs. 98mAs
98 mAs vs. 140mAs
42 mAs vs. 98mAs
98 mAs vs. 140mAs
42 mAs vs. 98mAs
98 mAs vs. 140mAs
1. Liver parenchyma – 3.36** 2.20*** –0.28° 1.49* –0.37°
2. Pancreatic contours – 1.89** 2.41*** –0.89* 1.37*** –2.62***
3. Kidneys and proximal ureters 7.25* 2.39* 2.29*** –0.92* 1.46*** –2.20***
4. Lymph nodes < 15 mm indiameter
6.50* 2.09** 1.83*** –1.93*** 1.14*** –2.20*
5. Image noise 5.49** 4.70** 3.07** – 4.79* 1.07°
6. Overall image quality – – 3.68* 0.03° 3.74** –1.27**
* p < 0.05, ** p < 0.01, *** p < 0.001, ° not significant
– Convergence was not achieved with the statistical software available
Table 4 Visual grading regression (VGR) coefficients for all six criteria with estimated dose reduction values for comparison of images reconstructedwith ADMIRE 3, ADMIRE 5 and filtered back projection (FBP) for dose interval between quality references (Qref) mAs 98 and 42
Criterion Regression coefficients Estimated dose reduction(95% confidence limits)
log (mAs) ADMIRE 3 ADMIRE 5 ADMIRE 3 ADMIRE 5
1. Liver parenchyma 2.28*** 0.57*** –0.08° 22%(11%; 33%)
−
2. Pancreatic contours 2.00*** 0.92*** 1.73*** 37%(26%; 48%)
58%(53%; 63%)
3. Kidneys and proximal ureters 2.21*** 1.11*** 2.09*** 40%(31%; 49%)
61%(57%; 66%)
4. Lymph nodes < 15 mm in diameter 1.72*** 1.05*** 1.93*** 46%(35%; 57%)
67%(63%; 72%)
5. Image noise 2.38*** 1.50*** 3.16*** 47%(39%; 55%)
74%(71%; 76%)
6. Overall image quality 2.69*** 1.06*** 1.10*** 33%(24%; 41%)
34%(27%; 40%)
***p < 0.001, ° not significant
Eur Radiol (2018) 28:2464–2473 2469

analysis method is used to evaluate and compare diagnosticperformance [17, 23]. When determining potential dose re-duction in the optimisation process, visual grading experi-ments may be useful [21, 24]. VGR seems to be the onlyanalysis method that produces direct numerical estimates ofpotential dose reductions for new acquisition, reconstructionand post-processing techniques while image quality is main-tained [25].
The present study aimed to estimate the dose reduc-tion potential of ADMIRE strengths 3 and 5 comparedwith FBP in a standard-dose abdominal CT. It suggeststhat ADMIRE while preserving image quality allows fora dose reduction relative to FBP of 22−47% (ADMIRE3) for all criteria assessed, and 34−74% (ADMIRE 5)for criteria 2–6 with the exception of liver parenchymavisualisation. Similar results are reported by Greffieret al, who studied the performance of SAFIRE strengths1–5 compared to FBP in two data sets at 30 and 70%dose levels. They concluded that a 40–60% reduction indose is possible [26]. Gordic et al. [27] evaluated bothquantitative and qualitative image quality parameters inabdominal CT using ADMIRE. Results from their studyshowed an improved image quality with lower noisewhen comparing ADMIRE with FBP, where the amountof noise reduction (53% for ADMIRE 5) could be trans-lated to a reduction in radiation dose (e.g. reduction ineffective mAs). However, their study differs from thepresent study in that they evaluated visibility of onlysmall structures such as small blood vessels, adrenalglands and lymph nodes.
In the present study, the VGR analysis in Table 3 revealedthat the 70% dose level (Qref mAs 98) scores were, for theiterative algorithms, higher than full dose (Qref mAs 140)scores for all image criteria. This was an unexpected finding.For FBP, the results were in agreement with the general rulethat image quality increases with increasing tube load. For theiterative reconstruction algorithms, one might speculate that acertain amount of noise is required for the algorithm to workoptimally. It should be noted that due to technical advance-ments the Somatom Force scanner has been found to givebetter image quality than other Siemens equipment [28]. Apossible conclusion is that the 70% dose level provides im-ages of sufficiently high image quality. Thus, one can optimisethe standard clinical abdominal protocol for the SomatomForce using ADMIRE 3 by reducing the tube load fromQref mAs 140 to 98 without changing the strength of thealgorithm. However, as demonstrated in Table 5, by replacingADMIRE 3 with ADMIRE 5, further dose reduction can beachieved for certain aspects of the image quality, but not all.
With ADMIRE strength 5 there is still a problem asnon-linear effects of IR lead to smoothing of the ana-tomical features and a change in appearance of the anat-omy in the images [29]. Mieville et al. [30] reported achange in the appearance of the MBIR images. Certainsmall objects that were not identified on the FBP im-ages were visualised on the low-dose MBIR images.Suboptimal performance when evaluating small or sub-tle abdominal structures (i.e. common bile duct, adrenalglands and pancreatic duct) was also reported by Padoleet al. [31] when comparing FBP with reduced doseMBIR and Adaptive Statistical Iterative Reconstruction(ASIR). This compromise in the visibility of structurescould be attributed to the blotchy, pixelated and plastic-like appearance of the images. The liver parenchyma isa low-contrast object and although image quality is im-proved using MBIR, it is possible that no improvementis seen in detection of low-contrast details as was thecase in the phantom study of Euler et al. [32]. Contraryresults were presented by Solomon et al. [13] who stud-ied low-contrast detectability using ADMIRE. There is apossibility that assessing low-contrast detectabilityin vivo is different to phantom images as the task ofclinical assessment by a radiologist, who has access tofull image data and patient information, is relativelycomplex compared to the simple task of assessing subtlelesions in a phantom. Solomon et al. [33] used a similarmethod to the present study to estimate the dose reduc-tion potential of SAFIRE relative to FBP. They alsoinvestigated virtual liver lesion detectability in hybridimages. Although their study was simple compared toclinical reality, such experiments do provide valuableinformation about how different algorithms render thesame lesion differently. In the present study, reader
Table 5 Visual grading regression (VGR) coefficients for all six criteriawith estimated dose reduction values for comparison between ADMIRE3 and ADMIRE 5 in the dose interval quality references (Qref) mAs 98and 42
Criterion Regression coefficients Estimated dosereduction(95% confidencelimits)
log(mAs)
ADMIRE 5Reconstruction
1. Liver parenchyma 1.88*** –0.98*** –68%(–102%; –35%)
2. Pancreatic contours 1.84*** 0.61*** 27%(18%; 37%)
3. Kidneys and proximalureters
2.06*** 0.77*** 31%(23%; 39%)
4. Lymph nodes< 15 mm in diameter
1.49*** 0.68*** 37%(26%; 47%)
5. Image noise 2.42*** 1.66*** 50%(45%; 55%)
6. Overall image quality 3.18*** –0.85° −
***p < 0.001, ° not significant
2470 Eur Radiol (2018) 28:2464–2473

confidence in determining the visually sharp reproduc-tion of liver parenchyma was lower for ADMIRE 5 thanfor FBP. Change in image texture due to the denoisingproperties of the reconstruction algorithm influences thepotential dose reduction depending on the diagnostictask [30]. This may explain the slightly lower estimateddose reduction for ADMIRE 3 and the non-significantresult for ADMIRE 5 when assessing the liverparenchyma.
On the other hand, anatomical contour assessments werenot a problem even though the higher strength images weresmoother in appearance. As our readers pointed out during thecoaching session, when intra-abdominal fat is present, thedelineation of contours is further enhanced. This was truefor the assessment of proximal ureters, lymph nodes and pan-creas. However, in patients with low BMI, when a smalleramount of intra-abdominal fat is present, the delineation ofcontours can be difficult [34].
Low kappa values were seen for inter-observer agreementbetween all five readers. It is not unusual that there is a vari-ation in perception of image quality among radiologists asviewing strategies differ depending on the approach [35].The intra-observer agreement in the present study was lessthan 100%, indicating variation in perception for the samereader at different points in time [36].
Future research is indicated as there is some scepticismamong radiologists in using higher strengths of IR. This ismostly related to the change in image texture, due to substan-tial noise reduction, possibly affecting diagnostic confidence.When comparing delineation of structures in different planes,Mieville et al. [30] reported an improvement in detection ofsmall structures in the coronal plane compared to the axialplane. It would be of interest to study if higher strengths ofthe algorithm could be made more clinically acceptable with acombination of IR and other post-processing methods. Thismight increase diagnostic confidence in IR images of higherstrength and allow for further dose reductions.
The major limitation of our study was exclusion of over-weight patients due to size limitations of the small detector,hence the estimated dose reduction is limited to the patientswith a BMI of up to 27.3 kg/m2. Image quality might beinferior as noise increases in overweight patients with a BMI> 28, possibly leading to less or no dose reduction [24, 37].Since there was a variation in patient body habitus, not allscans fitted the 35.5-cm diameter. Some of the patient anato-my, mostly in the pelvic region, slightly exceeded this limit,which may have affected the image quality. However, therewere no anatomical image criteria present in this region, ex-cept for overall image noise and image quality. It is thereforeunlikely that this would have affected the results. There aremany image acquisition parameters that affect image quality.We have studied only change in tube load (mAs) and imagereconstruction. Hence the study protocol differs from the
clinical protocol as a fixed kV was used for both x-ray tubeswithout automatic adjustment of tube potential (Care kV).Visual grading is an easy and inexpensive method toassess image quality. However, it assumes that whenev-er normal anatomy is sharply reproduced, the same willapply to pathology. The extent to which this assumptionis correct is generally not known. As reconstructed im-ages with MBIR strengths 3 and 5 and FBP all havedifferent appearances, it is difficult to perform a trueblinded evaluation of subjective criteria [38]. This en-hances the need for further research and analysis ofobjective image quality parameters to support the sub-jective findings of this study.
Conclusion
The model-based iterative reconstruction algorithmADMIRE showed improved image quality compared toFBP. A positive correlation between ADMIRE strengthand increasing potential dose reduction was found for themajority, but not all, of the image criteria.
Acknowledgements We are grateful to Siemens for providing uswith a research license for configuration of the Somatom Force toobtain three dose levels per patient. We acknowledge CMIV forproviding the research facilities. Håkan Gustafsson is acknowl-edged for supporting our project and our participating radiolo-gists, Anki Pozson, Johan Asplund, Jenny Öman, Senija Halilicand Peter Johansson, for grading the images. The study was pre-sented both as an oral and an E-poster at the European Congressof Radiology 2017 in Vienna.
Compliance with ethical standards
Guarantor The scientific guarantor of this publication is Prof. MichaelSandborg.
Conflict of interest The authors of this manuscript declare no relation-ships with any companies whose products or services may be related tothe subject matter of the article.
Funding This work was supported by ALF- and LFoU-grants fromRegion Östergötland and the Medical Faculty at Linköping University.
Statistics and biometry One of the authors has adequate statisticalexpertise.
Informed consent Written informed consent was obtained from allsubjects (patients) in this study.
Ethical approval Regional Ethical Review Board approval wasobtained.
Methodology• prospective• cross-sectional study• performed at one institution
Eur Radiol (2018) 28:2464–2473 2471

Open Access This article is distributed under the terms of the CreativeCommons At t r ibut ion 4 .0 In te rna t ional License (h t tp : / /creativecommons.org/licenses/by/4.0/), which permits unrestricted use,distribution, and reproduction in any medium, provided you give appro-priate credit to the original author(s) and the source, provide a link to theCreative Commons license, and indicate if changes were made.
References
1. Mahesh M (2009) MDCT physics the basics technology, imagequality and radiation dose. Lippincott Williams & Wilkins,Philadelphia
2. Moores M (2017) A review of the fundamental principles of radi-ation protection when applied to the patient in diagnostic radiology.Radiat Prot Dosim 175:1–9
3. Sun Z, Ng KA, Sarji SA (2010) Is utilisation of computed tomog-raphy justified in clinical practice? Part IV: applications of paediat-ric computed tomography. Singapore Med J 51:457–463
4. Report UNSCEAR (2008) Sources and effects of ionizing radia-tion. United Nations Scientific Committee on the effects of ionizingradiation. Volume 1: Sources. Report to the general assemblyScientific annexes A & B
5. Le Coultre R, Bize J, Champendal M et al (2016) Exposure of theSwiss population by radiodiagnostics: 2013 review. Radiat ProtDosim 169:221–224
6. European Commission (2014) Radiation protection No. 180:Medical radiation exposure of the European Population Part 1/2.Luxembourg, 2014 Available via https://ec.europa.eu/energy/sites/ener/files/documents/RP180.pdf. Accessed 30th July 2017
7. Power SP, Maloney F, Twomey M, James K, O’Connor OJ, MaherMM (2016) Computed tomography and patient risks: facts, percep-tions and uncertainties. World J Radiol 8:902–915
8. Mayo-Smith WW, Hara AK, Mahesh M, Sahani DV, Pavlicek W(2014) How I do it: managing radiation dose in CT. Radiology 273:657–672
9. Smith-BindemanR, Lipson J,Markus R et al (2009) Radiation doseassociated with commonComputed Tomography examinations andthe associated lifetime attributable risk for cancer. Arch Intern Med169:2078–2086
10. Kalra MK, Sodickson AD, Mayo-Smith WW (2015) CT radiation:key concepts for gentle and wise use. Radiographics 35:1706–1721
11. Liu L (2014) Model based Iterative Reconstruction: a promisingalgorithm for today's Computed Tomography Imaging. J MedRadiat Sci 45:131–136
12. Beister M, Kolditz D, Kalender WA (2012) Iterative reconstructionmethods in X-ray CT. Phys Medica 28:94–108
13. Solomon J, Mileto A, Ramirez-Giraldo JC, Samei E (2015)Diagnostic Performance of an Advanced Modeled IterativeReconstruction Algorithm for low-contrast detectability with a thirdgeneration Multidetector dual source CT Scanner. Radiology 275:735–745
14. Nuyts J, De Man B, Fessler JA, Zbijewski W, Beekman FJ (2013)Modelling the physics in iterative reconstruction for transmissioncomputed tomography. Phys Med Biol 58:R63–R96
15. Ott JG, Ba A, Racine D et al (2016) Patient exposure optimisationthrough task-based assessment of a new model-based iterative re-construction technique. Radiat Prot Dosim 169:68–72
16. Patino M, Fuentes JM, Singh S, Hahn PF, Sahani DV (2015)Iterative reconstruction techniques in abdominopelvic CT: techni-cal concepts and clinical implementation. AJR Am J Roentgenol205:W19–W31
17. Park SH, Goo JM, Jo C-H (2004) Receiver operating char-acteristics (ROC) curve: a practical review for radiologists.Korean J Radiol 5:11–18
18. Smedby Ö, Fredrikson M (2010) Visual grading regression –analysing data from visual grading experiments with regressionmodels. Br J Radiol 83:767–775
19. Report EUR 16262 EN (1996) European guidelines on qualitycriteria for computed tomography. Office for Official Publicationsof the European Communities. Available via http://www.drs.dk/guidelines/ct/quality/htmlindex.htm. Accessed 15th Oct 2013
20. Borgen L, KalraMK, Laerum F et al (2012) Application of adaptivenon-linear 2 D and 3 D post processing filters for reduced doseabdominal CT. Acta Radiol 53:335–34219
21. Smedby Ö, Fredrikson M, De Geer J, Borgen L, Sandborg M(2013) Quantifying the potential for dose reduction with visualgrading regression. Br J Radiol 86:1–6
22. Abraira V, Pérez de Vargas A (1999) Generalization of the Kappacoefficient for ordinal categorical data, multiple observers and in-complete designs. Qüestiió 23:561–571
23. Metz CE (1986) ROC methodology in radiologic imaging. InvestRadiol 21:720–733
24. Kataria B, Smedby Ö (2013) Patient dose and image quality in alow-dose abdominal CT: a comparison between iterative recon-struction and filtered back projection. Acta Radiol 54:540–548
25. Saffari SE, Löve Á, Fredrikson M, Smedby Ö (2015) Regressionmodels for analyzing radiological visual grading studies – an em-pirical comparison. BMC Med Imaging 15:1–10
26. Greffier J, Fernandez A, Macri F, Freitag C, Metge L, Beregi JP(2013) Which dose for what image? Iterative reconstruction for CTscan. Diagn Interv Imaging 94:1117–1121
27. Gordic S, Desbiolles L, Stolzmann P et al (2014) Advancedmodelled iterative reconstruction for abdominal CT: qualitativeand quantitative evaluation. Clin Radiol 69:497–504
28. Wichmann JL, Hardie AD, Schoepf JU et al (2016) Single- anddual-energy CT of the abdomen: comparison of radiation doseand image quality of 2nd and 3rd generation dual-source CT. EurRadiol 27:642–650
29. Larsson J, Båth M, Ledenius K, Caisander H, Thilander-Klang A(2016) Assessment of clinical image quality in paediatric abdomi-nal CTexaminations: dependency on the level of adaptive statisticaliterative reconstruction (ASiR) and the type of convolution kernel.Radiat Prot Dosimetry 169:123–129
30. Mieville FA, Berteloot L, Grandjean A et al (2013) Model-basediterative reconstruction in Pediatric chest CT: assessment of imagequality in a prospective study of children with cystic fibrosis.Pediatr Radiol 43:558–567
31. Padole A, Singh S, Lira D et al (2015) Assessment of filtered backprojection, adaptive statistical, and model-based iterative recon-struction for reduced dose abdominal computed tomography. JComput Assist Tomogr 39:462–467
32. Euler A, Stieltjes B, Szucs-Farkas Z et al. (2017) Impact of model-based iterative reconstruction on low-contrast lesion detection andimage quality in abdominal CT: a 12-reader-based comparativephantom study with filtered back projection at different tube volt-ages. Eur Radiol. https://doi.org/10.1007/s00330-017-4825-9
33. Solomon J, Marin D, Roy Choudhury K, Patel B, Samei E (2017)Effect of radiation dose reduction and reconstruction algorithm onImage noise, contrast, resolution, and detectability of subtlehypoattenuating liver lesions at multidetector CT: filtered back pro-jection versus a commercial model-based iterative reconstructionalgorithm. Radiology. https://doi.org/10.1148/radiol.2017161736
34. Sagara Y, Hara AK, PavlicekW, Silva AC, Paden RG,WuQ (2010)Abdominal CT: comparison of low-dose CTwith adaptive statisticiterative reconstruction and routine dose CTwith filtered back pro-jection in 53 patients. AJR Am J Roentgenol 195:713–719
2472 Eur Radiol (2018) 28:2464–2473

35. Drew T, VoMHL, Olwal A, Jacobson F, Seltzer SE,Wolfe J (2013)Scanners and drillers: characterizing expert visual search throughvolumetric images. J Vis 13:1–13
36. Birkelo CC, Chamberlain WE, Phelps PS, Schools PE, Zacks D,Yerushalmy J (1947) Tuberculosis case finding. JAMA 133:359–366
37. Chang W, Lee JM, Lee K et al (2013) Assessment of a model-based, iterative reconstruction algorithm (MBIR) regarding image
quality and dose reduction in liver computed tomography. InvestRadiol 48:598–606
38. Hérin E, Gardavaud F, Chiaradia M et al (2015) Use of model-based iterative reconstruction (MBIR) in reduced dose CT for rou-tine follow-up of patients with malignant lymphoma: dose savings,image quality & phantom study. Eur Radiol 25:2362–2370
Eur Radiol (2018) 28:2464–2473 2473