assessment of mini-tablets coating uniformity as a
TRANSCRIPT

pharmaceutics
Article
Assessment of Mini-Tablets Coating Uniformity as a Functionof Fluid Bed Coater Inlet Conditions
Magdalena Turk 1, Rok Šibanc 2,3, Rok Dreu 2, Maja Frankiewicz 1 and Małgorzata Sznitowska 1,*
�����������������
Citation: Turk, M.; Šibanc, R.; Dreu,
R.; Frankiewicz, M.; Sznitowska, M.
Assessment of Mini-Tablets Coating
Uniformity as a Function of Fluid Bed
Coater Inlet Conditions.
Pharmaceutics 2021, 13, 746. https://
doi.org/10.3390/pharmaceutics
13050746
Academic Editor: Peter Timmins
Received: 2 April 2021
Accepted: 13 May 2021
Published: 18 May 2021
Publisher’s Note: MDPI stays neutral
with regard to jurisdictional claims in
published maps and institutional affil-
iations.
Copyright: © 2021 by the authors.
Licensee MDPI, Basel, Switzerland.
This article is an open access article
distributed under the terms and
conditions of the Creative Commons
Attribution (CC BY) license (https://
creativecommons.org/licenses/by/
4.0/).
1 Department of Pharmaceutical Technology, Medical University of Gdansk, Hallera 107, 80-416 Gdansk, Poland;[email protected] (M.T.); [email protected] (M.F.)
2 Department of Pharmaceutical Technology, University of Ljubljana, Aškerceva cesta 7, 1000 Ljubljana, Slovenia;[email protected] (R.Š.); [email protected] (R.D.)
3 Institute of Pharmaceutics and Biopharmaceutics, Heinrich-Heine-University, Universitätsstr. 1,40225 Düsseldorf, Germany
* Correspondence: [email protected]; Tel.: +48-58-349-1085
Abstract: This study concerned the quality of mini-tablets’ coating uniformity obtained by eitherthe bottom spray chamber with a classical Wurster distributor (CW) or a swirl distributor (SW).Mini-tablets with a diameter of 2.0, 2.5, and 3.0 mm were coated with hypromellose using twodifferent inlet air distributors as well as inlet airflow rates (130 and 156 m3/h). Tartrazine was usedas a colorant in the coating layer and the coating uniformity was assessed by spectrophotometricanalysis of solutions obtained after disintegration of the mini-tablets (n = 100). Higher uniformityof coating material distribution among the mini-tablets was observed in the case of SW distributor,even for the biggest mini-tablets (d = 3.0 mm), with an RSD no larger than 5.0%. Additionally,coating thickness was evaluated by colorimetric analysis (n = 1000), using a scanner method, andexpressed as a hue value. A high correlation (R = 0.993) between inter-tablet variability of hue andUV-Vis results was obtained. Mini-tablets were successfully coated in a fluid bed system using botha classical Wurster distributor as well as a swirl generator. However, regardless of the mini-tablets’diameter, better film uniformity was achieved in the case of a distributor with a swirl generator.
Keywords: mini-tablets; coating; thickness; color analysis; fluid bed system; film uniformity
1. Introduction
Fluid bed film coating is a commonly used method for small particle coating (pellets,granules, crystals). The choice of different types of polymers enables not only activesubstance protection against the environment or taste masking [1], but also modification ofthe release rate, such as in enteric [2] or sustained release [3] products. Fluid bed coatingcan be classified as a single-pot process, where the cores are coated and dried in the sameunit, eliminating the product transfer and minimizing the risk of cross-contamination.
During the fluid bed coating process, the air/gas enters through the distributor intothe coating chamber and creates a particle suspension with distinctive characteristics,which is wetted by a coating mixture and simultaneously dried in the air/gas stream. Sucha system maximizes the exposure of the core’s surface to the coating mixture and allowsthe coated product to dry quickly. The main challenge related to using this technology isthe selection of the proper process conditions that lead to a robust product. To facilitatethe selection of proper process conditions, the statistical tools known as experimentaldesign may be used. These highly organized experimental plans allow for identifying themost significant process parameters that have an impact on the quality of the product andallow the optimization of these parameters [4]. Although familiar processes may be betterunderstood and optimized by statistical tools, a very important process for improving fluidbed coating is developing new technological solutions based on construction modification,which could eliminate observed design defects.
Pharmaceutics 2021, 13, 746. https://doi.org/10.3390/pharmaceutics13050746 https://www.mdpi.com/journal/pharmaceutics

Pharmaceutics 2021, 13, 746 2 of 11
As a result of improving the construction of fluid bed systems, several coating methodswere developed. These methods can be classified by the direction of coating dispersionspraying (top, bottom, tangential) or the design of the air distributor (screen, Wurster,rotor) [5]. The air distributor located at the bottom part of the chamber is intended tosupport stable fluidization without creating “dead zones”, where permanent or transientnon-fluidized regions may occur. The well-designed distributor should also functionwithout the occurrence of gas-particle flow plugging or failures, with minimum coreattrition, and avoiding losses in the mass of the bed during the process initiation andtermination [6].
The classical bottom spray Wurster chamber has been well-known since the 1960s [7],and so a thorough investigation of its impact on particle coating quality and uniformitywas performed. Uniform particle film formation in the Wurster chamber allows for thewidest application range, including not only a taste-masking coating but also modifiedrelease, which is not possible in the case of top spray [8]. However, the conventionalWurster chamber is not perfect in terms of particle size and preferential coating, and somemodifications can be applied. A new, patented swirl distributor (SW, swirl Wurster) can becombined with the design of a classical Wurster chamber [9]. It was demonstrated that amodified chamber with a SW may result in improved per-particle coating uniformity and ahigher coating yield compared with a classical Wurster (CW). The main difference betweenthe two systems is the air distributor, which in CW is perforated and flat, while in SW itis curved with a thicker circular center segment in the form of inclined gaps (Figure 1).As a result, the SW distributor reduces dead zones performed often near chamber wallsand creates a distinctive particle flow pattern within a draft tube [10,11]. To compare theeffect of air distributors, different size fractions of pellets in the range from 300 to 1000 µmwere coated in SW and CW. The results indicate that using SW, it is possible to improvethe coating process yield with a more uniform coating layer, regardless of the pellets’ sizefraction [12].
Pharmaceutics 2021, 13, x FOR PEER REVIEW 2 of 11
fluid bed coating is developing new technological solutions based on construction modi-fication, which could eliminate observed design defects.
As a result of improving the construction of fluid bed systems, several coating meth-ods were developed. These methods can be classified by the direction of coating disper-sion spraying (top, bottom, tangential) or the design of the air distributor (screen, Wurster, rotor) [5]. The air distributor located at the bottom part of the chamber is intended to sup-port stable fluidization without creating “dead zones”, where permanent or transient non-fluidized regions may occur. The well-designed distributor should also function without the occurrence of gas-particle flow plugging or failures, with minimum core attrition, and avoiding losses in the mass of the bed during the process initiation and termination [6].
The classical bottom spray Wurster chamber has been well-known since the 1960s [7], and so a thorough investigation of its impact on particle coating quality and uni-formity was performed. Uniform particle film formation in the Wurster chamber allows for the widest application range, including not only a taste-masking coating but also mod-ified release, which is not possible in the case of top spray [8]. However, the conventional Wurster chamber is not perfect in terms of particle size and preferential coating, and some modifications can be applied. A new, patented swirl distributor (SW, swirl Wurster) can be combined with the design of a classical Wurster chamber [9]. It was demonstrated that a modified chamber with a SW may result in improved per-particle coating uniformity and a higher coating yield compared with a classical Wurster (CW). The main difference between the two systems is the air distributor, which in CW is perforated and flat, while in SW it is curved with a thicker circular center segment in the form of inclined gaps (Fig-ure 1). As a result, the SW distributor reduces dead zones performed often near chamber walls and creates a distinctive particle flow pattern within a draft tube [10,11]. To compare the effect of air distributors, different size fractions of pellets in the range from 300 to 1000 µm were coated in SW and CW. The results indicate that using SW, it is possible to im-prove the coating process yield with a more uniform coating layer, regardless of the pel-lets’ size fraction [12].
(a) (b)
Figure 1. Scheme of chambers with SW (a) and CW (b) distributor: 1—curved (a) and flat (b) air distributors, 2—swirl generator, 3—air inlet, 4—draft tube, 5—particles’ movement.
Mini-tablets, thanks to their small size (up to 3–4 mm), offer a wide range of applica-tions, especially in pediatric and geriatric populations [13–16]. They may be coated either in drum coaters, as with traditional tablets [17], or in a fluid bed system [18,19].
Film thickness and morphology are key factors controlling release profiles, assuring API stability, and taste masking. By knowing the surface area of the total particles, the amount of processed coating mixture and dry film density, the film thickness can be esti-mated. Unfortunately, this is only a theoretical value, because the loss of coating material during the process (attrition, wall adherence, spray drying) may fundamentally influence the real film thickness. Thus, precise measurements based on the preliminary coating pro-cess are required to include coating yield in the calculation of the required amount of coating dispersion [20]. Assessment of film thickness and its uniformity can be performed
Figure 1. Scheme of chambers with SW (a) and CW (b) distributor: 1—curved (a) and flat (b) airdistributors, 2—swirl generator, 3—air inlet, 4—draft tube, 5—particles’ movement.
Mini-tablets, thanks to their small size (up to 3–4 mm), offer a wide range of applica-tions, especially in pediatric and geriatric populations [13–16]. They may be coated eitherin drum coaters, as with traditional tablets [17], or in a fluid bed system [18,19].
Film thickness and morphology are key factors controlling release profiles, assuringAPI stability, and taste masking. By knowing the surface area of the total particles, theamount of processed coating mixture and dry film density, the film thickness can beestimated. Unfortunately, this is only a theoretical value, because the loss of coatingmaterial during the process (attrition, wall adherence, spray drying) may fundamentallyinfluence the real film thickness. Thus, precise measurements based on the preliminarycoating process are required to include coating yield in the calculation of the requiredamount of coating dispersion [20]. Assessment of film thickness and its uniformity can beperformed by many different techniques where sample preparation is required: optical,fluorescence, and SEM microscopy [21,22]. Non-invasive methods including Raman [23,24]

Pharmaceutics 2021, 13, 746 3 of 11
or NIR [25,26] spectroscopy, terahertz pulsed imaging [27,28], dynamic image analysis [29],and optical coherence tomography [30,31] have undoubted advantages.
Achieving uniform polymer deposition across the surface of spherical pellets seemsto be easier than on particles with sharp edges, such as mini-tablets. However, comparedwith pellets, the coating of mini-tablets has more advantages than disadvantages [32]. Asthey are produced by compression, mini-tablets have completely uniform shapes and verynarrow size distribution, a smoother surface, and high mechanical resistance, which leads toa robust coating process and may result in more uniform film thickness [33]. Consequently,mini-tablets need less coating material than pellets to achieve the same film thickness andto ensure similar dissolution profiles [32]. The reduction in the amount coating materialsused during the process results in a shorter process time and hence generates savings.Although several publications have already reported on this process [34–36], there is stilllittle knowledge about fluid bed coating of mini-tablets. Mini-tablets are a novel andpromising formulation, enabling the introduction of modified release medicinal productsinto pediatric therapy [37]. Moreover, because of their small size and easier production [38],they may represent a relevant replacement for pellets commonly used as a multiparticulateform of the drug. Therefore, research aiming to increase knowledge about the coatingprocess of mini-tablets is an important topic in pharmaceutical technology.
In the industry, the coating quality is frequently only assessed visually, which includesobservation of the color uniformity. However, color assessment should not rely on visualevaluation, because the color is a more complex structure that may be described by threemain attributes: hue, value, and chroma. Hue is expressed as a distinctive quality of color,such as red, yellow, etc. Value is described as the relation of one object to another by using areference to light and shade. Chroma is the degree of color intensity [39]. The color qualityof coated pellets was tested using a computer scanner where the main interest duringmeasurement was focused on hue. Additionally, based on scanner measurement, it waspossible to assess film thickness on pellets by estimation of the particle size distributionshift [40].
The aim of the study was to perform a comparison of mini-tablets’ coating attributesachieved after coating of the cores in two fluid bed process chambers equipped with differ-ent inlet air distributors: CW and SW. Three different sizes of mini-tablets were investigated.Coating quality was evaluated mainly based on hue to determine the usefulness of thescanner method in the analysis of mini-tablets.
2. Materials and Methods2.1. Materials
Cores: microcrystalline cellulose (Vivapur 102, JRS Pharma, Rosenberg, Germany),sodium stearyl fumarate (PRUV, JRS Pharma, Rosenberg, Germany), spray-dried lactose(Flowlac 100, Meggle Pharmaceutical, Wasserburg, Germany), colloidal silicon dioxide(Aerosil 200, Evonik Industries AG, Darmstadt, Germany).
Coating: hypromellose (HPMC, Pharmacoat 606, Shin-Etsu Chemical, Tokyo, Japan),polyethylene glycol (PEG 6000, Sigma-Aldrich, Steinheim, Germany), tartrazine (Sigma-Aldrich, Steinheim, Germany).
2.2. Methods2.2.1. Placebo Cores Preparation
Biconvex mini-tablets (MT) with a diameter of 2.0 (MT2.0), 2.5 (MT2.5) and 3.0 mm(MT3.0) were prepared from a tablet mass consisting of Flowlac 100 (74.07%), Vivapur 102(24.68%), Aerosil 200 (0.25%) and PRUV (1%).
Placebo MT were compressed using a rotary tablet press (Erweka RTP-D8, Heusen-stamm, Germany) equipped with single or multiple (13) punches. The force applied formultiple punches to produce MT2.0 was 12 kN. For tableting with single punches, toolingcompression forces of 2 (MT2.5) and 2.5 kN (MT3.0) were needed. Produced MT weretested according to the pharmacopeia procedures (European Pharmacopoeia, Ph.Eur. 10),

Pharmaceutics 2021, 13, 746 4 of 11
including mass uniformity, thickness and friability. Disintegration time (n = 6) was testedwith a standard apparatus (Pharmatest, Hainburg, Germany) equipped with a 1.0 mmsieve size.
The crushing force of uncoated and coated MT (n = 100) was measured by means of anon-pharmacopeial method, using a Texture Analyzer TA.XT.plus (Stable Micro Systems,Surrey, UK) with a probe (ø 6 mm) being constantly lowered (0.5 mm/s) until 30% of aMT’s diameter level was achieved.
2.2.2. Coating Procedure
A 10% (w/w) aqueous coating dispersion consisting of HPMC (8%), PEG 6000 (1%)and tartrazine (1%) as a colorant was prepared. The required amount of water was heatedup to 60 ◦C, and HPMC and PEG were partially added to the agitated water (300 rpm).Colorant was added to the solution of the polymer. The coating mixture was cooled downto room temperature with constant stirring for at least 30 min.
The coatings were performed in a bottom spray fluid bed system GPCG 1 (Glatt,Dresden, Germany) with the process chamber equipped with one of two distinct airdistributors: a classical air distributor—CW (plate C, Glatt, Dresden, Germany)—or a swirlgenerator with a curved plate—SW (Brinox process systems, Sora, Slovenia). In each set,the Wurster partition was placed at the height of 25 mm above the distributor plate. Thecoating mixture was sprayed by a binary nozzle with an opening diameter of 1.0 mm.
Then, 1000 g of MT were preheated (10 min) at an inlet air temperature of 55 ◦C usingan inlet airflow rate of 80 m3/h. After preheating, the cores were coated using the amountof the coating mixture calculated as sufficient to obtain a theoretical 20 µm film thickness(for calculation, the total surface area of mini-tablets and density of the coating film wereincluded). Constant process parameters including inlet air temperature (55 ◦C), sprayingrate (5 g/min) and pressure (2 bar) were maintained at the two different inlet airflow rates(130 or 156 m3/h). Six coatings were performed using CW. Additionally, three coatingswith SW using an inlet airflow rate of 156 m3/h were tested for each MT size. After thespraying stage, MT were dried for 10 min in GPCG 1 system without changing airflow rateor temperature.
2.2.3. Analysis of Coating Uniformity
Analysis of the uniformity of the amount of coating material on MT was performedbased on UV-Vis measurements of the tartrazine assay in individual units. One hundred MTfrom each batch were analyzed using the UV-Vis method. Each MT was placed in a singlevial and 4.5 mL of dihydrogen phosphate buffer (6.5 pH) was added. After disintegration,the vials were centrifuged (15 min, 3500 rpm) to separate undissolved particles. Sampleswere analyzed (UV spectrophotometer HP8453, Hewlett-Packard, Santa Clara, CA, USA)at a wavelength specific for tartrazine, 425 nm [41]. Based on tartrazine concentration,coating mixture composition, dry coating density (1.27 g/cm3) and the surface of a singleMT, the average film thickness and relative standard deviation (RSD) for the tested unitswere calculated [42].
2.2.4. Color Analysis of Mini-Tablets
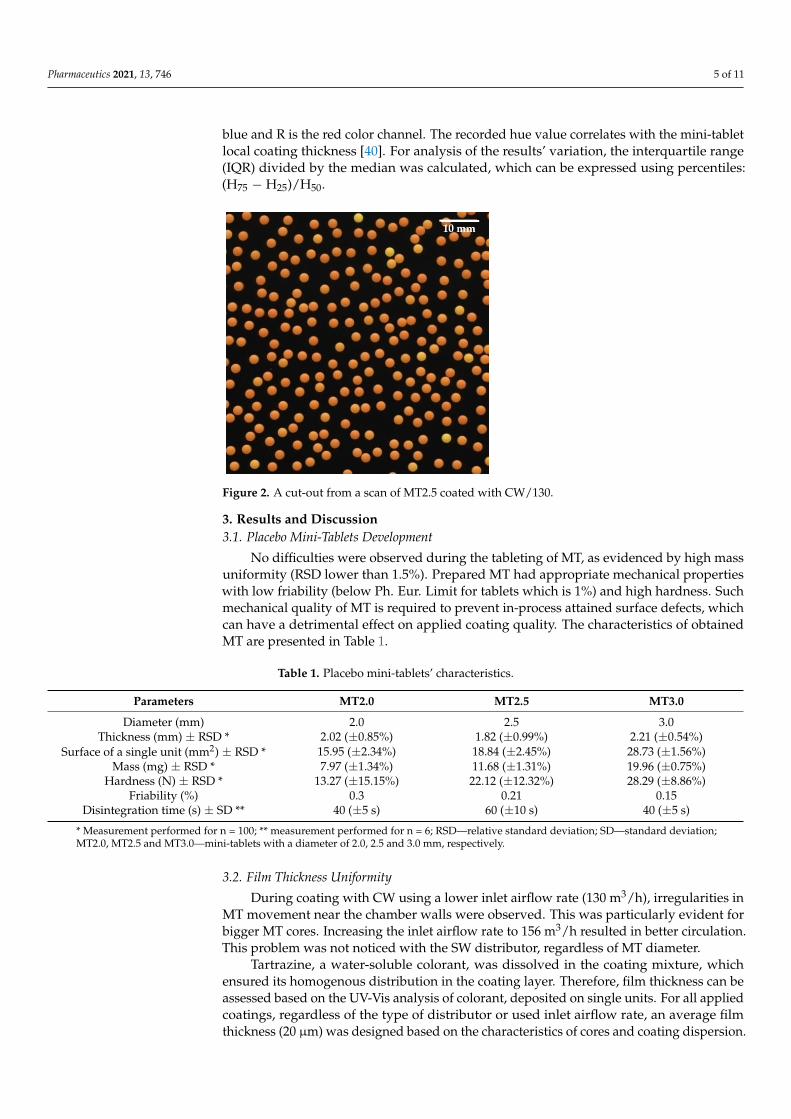
At least 1000 MT were imaged using an Epson Perfection V700Photo scanner (Epson,Nagano, Japan). Scanning was performed with 48-bit color depth and a resolution of600 dpi. All color and image corrections were disabled in the scanner software. MT wereoriented horizontally on the central part of the scanner surface (72 × 296.8 mm2) with thescanner lid open, to obtain an image of MT with a black background (Figure 2). The coloranalysis was performed using an in-house OpenCV C++ program, which performed imagesegmentation (detection of individual MT) and color analysis. The color analysis was donein the Hue, Saturation and Value (HSV) color space. The average hue value of the central3 × 3 pixels (127 × 127 µm2) of each mini-tablet was recorded and used in further analysis.The hue for red-yellow colors is defined as 60 * (G − B)/(R − B), where G is green, B is
Pharmaceutics 2021, 13, 746 5 of 11
blue and R is the red color channel. The recorded hue value correlates with the mini-tabletlocal coating thickness [40]. For analysis of the results’ variation, the interquartile range(IQR) divided by the median was calculated, which can be expressed using percentiles:(H75 − H25)/H50.
Pharmaceutics 2021, 13, x FOR PEER REVIEW 5 of 11
scanner lid open, to obtain an image of MT with a black background (Figure 2). The color analysis was performed using an in-house OpenCV C++ program, which performed im-age segmentation (detection of individual MT) and color analysis. The color analysis was done in the Hue, Saturation and Value (HSV) color space. The average hue value of the central 3 × 3 pixels (127 × 127 µm2) of each mini-tablet was recorded and used in further analysis. The hue for red-yellow colors is defined as 60 * (G − B)/(R − B), where G is green, B is blue and R is the red color channel. The recorded hue value correlates with the mini-tablet local coating thickness [40]. For analysis of the results’ variation, the interquartile range (IQR) divided by the median was calculated, which can be expressed using percen-tiles: (H75 − H25)/H50.
Figure 2. A cut-out from a scan of MT2.5 coated with CW/130.
3. Results and Discussion 3.1. Placebo Mini-Tablets Development
No difficulties were observed during the tableting of MT, as evidenced by high mass uniformity (RSD lower than 1.5%). Prepared MT had appropriate mechanical properties with low friability (below Ph. Eur. Limit for tablets which is 1%) and high hardness. Such mechanical quality of MT is required to prevent in-process attained surface defects, which can have a detrimental effect on applied coating quality. The characteristics of obtained MT are presented in Table 1.
Table 1. Placebo mini-tablets’ characteristics.
Parameters MT2.0 MT2.5 MT3.0 Diameter (mm)
Thickness (mm) ± RSD * Surface of a single unit (mm2) ± RSD *
2.0 2.5 3.0 2.02 (±0.85%) 1.82 (±0.99%) 2.21 (±0.54%)
15.95 (±2.34%) 18.84 (±2.45%) 28.73 (±1.56%) Mass (mg) ± RSD *
Hardness (N) ± RSD * 7.97 (±1.34%) 11.68 (±1.31%) 19.96 (±0.75%)
13.27 (±15.15%) 22.12 (±12.32%) 28.29 (±8.86%) Friability (%)
Disintegration time (s) ± SD ** 0.3 0.21 0.15
40 (±5 s) 60 (±10 s) 40 (±5 s) * Measurement performed for n = 100; ** measurement performed for n = 6; RSD—relative standard deviation; SD—stand-ard deviation; MT2.0, MT2.5 and MT3.0—mini-tablets with a diameter of 2.0, 2.5 and 3.0 mm, respectively.
3.2. Film Thickness Uniformity During coating with CW using a lower inlet airflow rate (130 m3/h), irregularities in
MT movement near the chamber walls were observed. This was particularly evident for
Figure 2. A cut-out from a scan of MT2.5 coated with CW/130.
3. Results and Discussion3.1. Placebo Mini-Tablets Development
No difficulties were observed during the tableting of MT, as evidenced by high massuniformity (RSD lower than 1.5%). Prepared MT had appropriate mechanical propertieswith low friability (below Ph. Eur. Limit for tablets which is 1%) and high hardness. Suchmechanical quality of MT is required to prevent in-process attained surface defects, whichcan have a detrimental effect on applied coating quality. The characteristics of obtainedMT are presented in Table 1.
Table 1. Placebo mini-tablets’ characteristics.
Parameters MT2.0 MT2.5 MT3.0
Diameter (mm) 2.0 2.5 3.0Thickness (mm) ± RSD * 2.02 (±0.85%) 1.82 (±0.99%) 2.21 (±0.54%)
Surface of a single unit (mm2) ± RSD * 15.95 (±2.34%) 18.84 (±2.45%) 28.73 (±1.56%)Mass (mg) ± RSD * 7.97 (±1.34%) 11.68 (±1.31%) 19.96 (±0.75%)
Hardness (N) ± RSD * 13.27 (±15.15%) 22.12 (±12.32%) 28.29 (±8.86%)Friability (%) 0.3 0.21 0.15
Disintegration time (s) ± SD ** 40 (±5 s) 60 (±10 s) 40 (±5 s)
* Measurement performed for n = 100; ** measurement performed for n = 6; RSD—relative standard deviation; SD—standard deviation;MT2.0, MT2.5 and MT3.0—mini-tablets with a diameter of 2.0, 2.5 and 3.0 mm, respectively.
3.2. Film Thickness Uniformity
During coating with CW using a lower inlet airflow rate (130 m3/h), irregularities inMT movement near the chamber walls were observed. This was particularly evident forbigger MT cores. Increasing the inlet airflow rate to 156 m3/h resulted in better circulation.This problem was not noticed with the SW distributor, regardless of MT diameter.
Tartrazine, a water-soluble colorant, was dissolved in the coating mixture, whichensured its homogenous distribution in the coating layer. Therefore, film thickness can beassessed based on the UV-Vis analysis of colorant, deposited on single units. For all appliedcoatings, regardless of the type of distributor or used inlet airflow rate, an average filmthickness (20 µm) was designed based on the characteristics of cores and coating dispersion.

Pharmaceutics 2021, 13, 746 6 of 11
The biggest deviations of UV-Vis-calculated average coating thicknesses (Table 2) wereobserved in the case of MT2.5, where the average coating thickness of batches ranged from17.9 to 21.9 µm.
Table 2. Average film thickness (µm) based on tartrazine UV-Vis analysis (n = 100) after MT coating with CW andSW distributors.
Cores MT2.0 MT2.5 MT3.0
Distributor CW CW SW CW CW SW CW CW SW
Inlet airflow rate(m3/h) 130 156 156 130 156 156 130 156 156
Film thickness(µm) 18.7 19.9 18.4 18.9 21.9 17.9 18.8 18.2 18.3
Achievement of around 20 µm film thickness (on caps, edges and around bands) ineach batch was also confirmed by stereoscopic microscopy (Opta-Tech, Warsaw, Poland).An example microscopic photo of coated MT cross-section is presented in Figure 3.
Pharmaceutics 2021, 13, x FOR PEER REVIEW 6 of 11
bigger MT cores. Increasing the inlet airflow rate to 156 m3/h resulted in better circulation. This problem was not noticed with the SW distributor, regardless of MT diameter.
Tartrazine, a water-soluble colorant, was dissolved in the coating mixture, which en-sured its homogenous distribution in the coating layer. Therefore, film thickness can be assessed based on the UV-Vis analysis of colorant, deposited on single units. For all ap-plied coatings, regardless of the type of distributor or used inlet airflow rate, an average film thickness (20 µm) was designed based on the characteristics of cores and coating dis-persion. The biggest deviations of UV-Vis-calculated average coating thicknesses (Table 2) were observed in the case of MT2.5, where the average coating thickness of batches ranged from 17.9 to 21.9 µm.
Table 2. Average film thickness (µm) based on tartrazine UV-Vis analysis (n = 100) after MT coat-ing with CW and SW distributors.
Cores MT2.0 MT2.5 MT3.0 Distributor
Inlet airflow rate (m3/h) CW 130
CW 156
SW 156
CW 130
CW 156
SW 156
CW 130
CW 156
SW 156
Film thickness (µm) 18.7 19.9 18.4 18.9 21.9 17.9 18.8 18.2 18.3
Achievement of around 20 µm film thickness (on caps, edges and around bands) in each batch was also confirmed by stereoscopic microscopy (Opta-Tech, Warsaw, Poland). An example microscopic photo of coated MT cross-section is presented in Figure 3.
Figure 3. A cross-section of MT2.5 coated in the CW process chamber at 156 m3/h airflow rate.
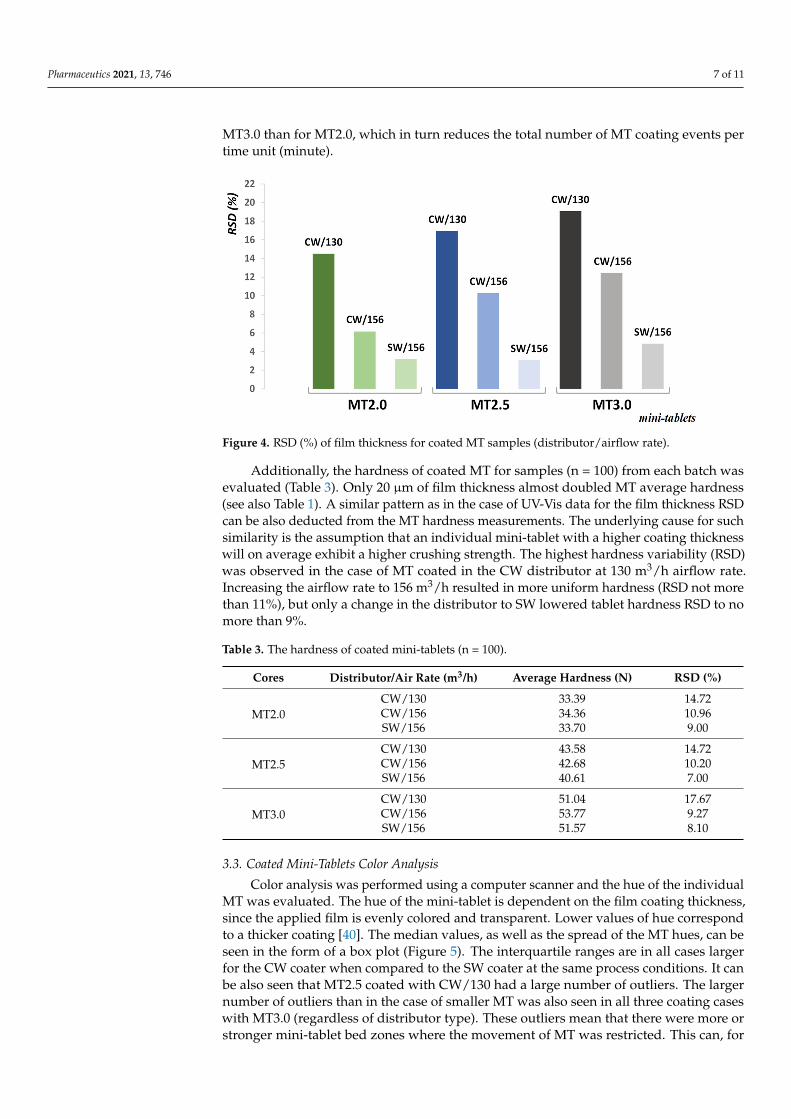
However, more interesting are the RSD values of MT film thickness (Figure 4), as a good film uniformity indicator. Usage of a CW distributor with 130 m3/h airflow rate re-sulted in the highest RSD, increasing with the MT diameter (more than 19% for MT3.0). Higher film uniformity was observed for 156 m3/h, but still, the RSD of the largest cores exceeded 12%. The best results were obtained for SW, where RSD for MT2.0 and MT2.5 is close to 3%, while for MT3.0 it is less than 5%. Longer coating time in general resulted in a lower coating variability. The RSD of coating is inversely proportional to the square root of coating time [43]. Since all MT were coated to the same coating thickness, the coating time for smaller MT was longer, which can partially explain the better coating results for MT2.0. An extrapolation for MT2.5 and MT3.0 to the coating time of MT2.0 was per-formed. It was observed that the coating results still follow the same trend, which is that coating variability increases with MT size. The influence of MT size on the coating thick-ness RSD value also can be commented on from the perspective of the fixed gap size used
Figure 3. A cross-section of MT2.5 coated in the CW process chamber at 156 m3/h airflow rate.
However, more interesting are the RSD values of MT film thickness (Figure 4), as agood film uniformity indicator. Usage of a CW distributor with 130 m3/h airflow rateresulted in the highest RSD, increasing with the MT diameter (more than 19% for MT3.0).Higher film uniformity was observed for 156 m3/h, but still, the RSD of the largest coresexceeded 12%. The best results were obtained for SW, where RSD for MT2.0 and MT2.5 isclose to 3%, while for MT3.0 it is less than 5%. Longer coating time in general resulted in alower coating variability. The RSD of coating is inversely proportional to the square rootof coating time [43]. Since all MT were coated to the same coating thickness, the coatingtime for smaller MT was longer, which can partially explain the better coating results forMT2.0. An extrapolation for MT2.5 and MT3.0 to the coating time of MT2.0 was performed.It was observed that the coating results still follow the same trend, which is that coatingvariability increases with MT size. The influence of MT size on the coating thickness RSDvalue also can be commented on from the perspective of the fixed gap size used in thecoating experiments. The ratio between gap size and MT diameter ranged from 12.5 forMT2.0 to 8.3 for MT3.0, and this is without considering the worst-case scenario on the MTmaximum Feret diameter. Gap size poses a greater obstacle to horizontal mass flow for
Pharmaceutics 2021, 13, 746 7 of 11
MT3.0 than for MT2.0, which in turn reduces the total number of MT coating events pertime unit (minute).
Pharmaceutics 2021, 13, x FOR PEER REVIEW 7 of 11
in the coating experiments. The ratio between gap size and MT diameter ranged from 12.5 for MT2.0 to 8.3 for MT3.0, and this is without considering the worst-case scenario on the MT maximum Feret diameter. Gap size poses a greater obstacle to horizontal mass flow for MT3.0 than for MT2.0, which in turn reduces the total number of MT coating events per time unit (minute).
Figure 4. RSD (%) of film thickness for coated MT samples (distributor/airflow rate).
Additionally, the hardness of coated MT for samples (n = 100) from each batch was evaluated (Table 3). Only 20 µm of film thickness almost doubled MT average hardness (see also Table 1). A similar pattern as in the case of UV-Vis data for the film thickness RSD can be also deducted from the MT hardness measurements. The underlying cause for such similarity is the assumption that an individual mini-tablet with a higher coating thickness will on average exhibit a higher crushing strength. The highest hardness varia-bility (RSD) was observed in the case of MT coated in the CW distributor at 130 m3/h airflow rate. Increasing the airflow rate to 156 m3/h resulted in more uniform hardness (RSD not more than 11%), but only a change in the distributor to SW lowered tablet hard-ness RSD to no more than 9%.
Table 3. The hardness of coated mini-tablets (n = 100).
Cores Distributor/Air Rate (m3/h) Average Hardness (N) RSD (%)
MT2.0 CW/130 33.39 14.72 CW/156 34.36 10.96 SW/156 33.70 9.00
MT2.5 CW/130 43.58 14.72 CW/156 42.68 10.20 SW/156 40.61 7.00
MT3.0 CW/130 51.04 17.67 CW/156 53.77 9.27 SW/156 51.57 8.10
3.3. Coated Mini-Tablets Color Analysis Color analysis was performed using a computer scanner and the hue of the individ-
ual MT was evaluated. The hue of the mini-tablet is dependent on the film coating thick-ness, since the applied film is evenly colored and transparent. Lower values of hue corre-spond to a thicker coating [40]. The median values, as well as the spread of the MT hues, can be seen in the form of a box plot (Figure 5). The interquartile ranges are in all cases larger for the CW coater when compared to the SW coater at the same process conditions. It can be also seen that MT2.5 coated with CW/130 had a large number of outliers. The
Figure 4. RSD (%) of film thickness for coated MT samples (distributor/airflow rate).
Additionally, the hardness of coated MT for samples (n = 100) from each batch wasevaluated (Table 3). Only 20 µm of film thickness almost doubled MT average hardness(see also Table 1). A similar pattern as in the case of UV-Vis data for the film thickness RSDcan be also deducted from the MT hardness measurements. The underlying cause for suchsimilarity is the assumption that an individual mini-tablet with a higher coating thicknesswill on average exhibit a higher crushing strength. The highest hardness variability (RSD)was observed in the case of MT coated in the CW distributor at 130 m3/h airflow rate.Increasing the airflow rate to 156 m3/h resulted in more uniform hardness (RSD not morethan 11%), but only a change in the distributor to SW lowered tablet hardness RSD to nomore than 9%.
Table 3. The hardness of coated mini-tablets (n = 100).
Cores Distributor/Air Rate (m3/h) Average Hardness (N) RSD (%)
MT2.0CW/130 33.39 14.72CW/156 34.36 10.96SW/156 33.70 9.00
MT2.5CW/130 43.58 14.72CW/156 42.68 10.20SW/156 40.61 7.00
MT3.0CW/130 51.04 17.67CW/156 53.77 9.27SW/156 51.57 8.10
3.3. Coated Mini-Tablets Color Analysis
Color analysis was performed using a computer scanner and the hue of the individualMT was evaluated. The hue of the mini-tablet is dependent on the film coating thickness,since the applied film is evenly colored and transparent. Lower values of hue correspondto a thicker coating [40]. The median values, as well as the spread of the MT hues, can beseen in the form of a box plot (Figure 5). The interquartile ranges are in all cases largerfor the CW coater when compared to the SW coater at the same process conditions. It canbe also seen that MT2.5 coated with CW/130 had a large number of outliers. The largernumber of outliers than in the case of smaller MT was also seen in all three coating caseswith MT3.0 (regardless of distributor type). These outliers mean that there were more orstronger mini-tablet bed zones where the movement of MT was restricted. This can, for

Pharmaceutics 2021, 13, 746 8 of 11
larger MT, be explained by two mechanisms. The gap was in all cases 25 mm and thelargest MT had the smallest gap to size ratio, as already reported, which is important inthe flow of the material to the central part of the coater, where the upward transport andcoating process occurs. Secondly, the minimum fluidization velocity is also higher forlarger sized MT and this is important for the mixing behavior in the annulus bed region ofthe coater. As the same airflow rates were used for all coating process instances, mixingwas least pronounced in the case of MT3.0. The better results for the SW distributor couldbe attributed to the curved nature of the perforated plate in the annulus region, whichpromoted an even flow of MT towards the gap region.
Pharmaceutics 2021, 13, x FOR PEER REVIEW 8 of 11
larger number of outliers than in the case of smaller MT was also seen in all three coating cases with MT3.0 (regardless of distributor type). These outliers mean that there were more or stronger mini-tablet bed zones where the movement of MT was restricted. This can, for larger MT, be explained by two mechanisms. The gap was in all cases 25 mm and the largest MT had the smallest gap to size ratio, as already reported, which is important in the flow of the material to the central part of the coater, where the upward transport and coating process occurs. Secondly, the minimum fluidization velocity is also higher for larger sized MT and this is important for the mixing behavior in the annulus bed region of the coater. As the same airflow rates were used for all coating process instances, mixing was least pronounced in the case of MT3.0. The better results for the SW distributor could be attributed to the curved nature of the perforated plate in the annulus region, which promoted an even flow of MT towards the gap region.
The coating variability results obtained using UV-VIS and color analysis are summa-rized in Table 4. Due to a large number of outliers observed in certain analyzed cases (Figure 5), in addition to the center hue RSD, another parameter was employed to measure the coating variability. An interquartile range (IQR), normalized by the median of hue, showed a good correlation (R = 0.993) with the RSD results obtained using UV-VIS (Figure 6). However, it is important to note that the imaging color analysis has several advantages compared to the UV-VIS. The method is non-destructive, fast, and can be easily used dur-ing the analysis of a large number of samples, yielding higher statistical confidence. Based on chi-square statistics, the confidence interval is 8.780–11.617 when the standard devia-tion equals 10 and the number of samples is 100, and when 1000 units are measured, the confidence interval is 9.580–10.459.
Figure 5. Box plot of coating hue value at the center of the mini-tablet cap face.
Table 4. Coating variability and color variability results.
Cores Distributor/Airflow Rate (m3/h)
Coating Thickness RSD UV-VIS (%)
Center Hue RSD (%)
IQR/Median Hue Center (%)
MT2.0 CW/130 14.51 6.64 7.51 CW/156 6.15 3.68 4.81 SW/156 3.19 2.18 2.97
MT2.5 CW/130 16.95 10.66 8.79 CW/156 10.28 5.07 6.22 SW/156 3.08 2.52 3.60
MT3.0 CW/130 19.08 8.02 9.36 CW/156 12.45 6.21 7.40 SW/156 4.84 3.21 3.89
Figure 5. Box plot of coating hue value at the center of the mini-tablet cap face.
The coating variability results obtained using UV-VIS and color analysis are summa-rized in Table 4. Due to a large number of outliers observed in certain analyzed cases(Figure 5), in addition to the center hue RSD, another parameter was employed to mea-sure the coating variability. An interquartile range (IQR), normalized by the median ofhue, showed a good correlation (R = 0.993) with the RSD results obtained using UV-VIS(Figure 6). However, it is important to note that the imaging color analysis has severaladvantages compared to the UV-VIS. The method is non-destructive, fast, and can beeasily used during the analysis of a large number of samples, yielding higher statisticalconfidence. Based on chi-square statistics, the confidence interval is 8.780–11.617 when thestandard deviation equals 10 and the number of samples is 100, and when 1000 units aremeasured, the confidence interval is 9.580–10.459.
Table 4. Coating variability and color variability results.
Cores Distributor/AirflowRate (m3/h)
Coating Thickness RSDUV-VIS (%) Center Hue RSD (%) IQR/Median Hue
Center (%)
MT2.0CW/130 14.51 6.64 7.51CW/156 6.15 3.68 4.81SW/156 3.19 2.18 2.97
MT2.5CW/130 16.95 10.66 8.79CW/156 10.28 5.07 6.22SW/156 3.08 2.52 3.60
MT3.0CW/130 19.08 8.02 9.36CW/156 12.45 6.21 7.40SW/156 4.84 3.21 3.89

Pharmaceutics 2021, 13, 746 9 of 11Pharmaceutics 2021, 13, x FOR PEER REVIEW 9 of 11
Figure 6. Correlation of mini-tablet center hue and coating thickness variability.
Fluid bed coating of pellets using both a swirl and standard Wurster distributor were already compared by Heng et al. [44]. Pellet flows in the fluid bed coater equipped with a swirl distributor were characterized by higher Reynolds numbers (indicating higher tur-bulence) than standard Wurster coating. The turbulent flow of pellets in the coating cham-ber equipped with the swirl distributor resulted in a more uniform coating with less ag-glomeration and fewer defects. Thus, the benefits from using the swirl distributors are noticeable, and there have been first attempts to construct new swirl distributors using 3D printing [45].
4. Conclusions Mini-tablets can be coated in a fluid bed system using both classical Wurster distrib-
utors as well as swirl generators. However, based on the results of UV-Vis analysis of the coating tracer, better film uniformity (regardless of the mini-tablets diameter) was achieved in the case of the distributor with a swirl generator. While using the same process conditions and the same process chamber, higher coating variability was always observed for bigger mini-tablets (3.0 mm diameter) than for the smaller ones (diameter of 2.5 or 2.0 mm). Increased air fluidization velocity always improved the coating uniformity of mini-tablets. It is assumed that the mixing in the annulus region, as well as the gap size, are the limiting factors that determine mini-tablet coating thickness variability. Hardness testing showed an increase in hardness for coated mini-tablets as well as good correlation with the coating thickness variability pattern. It was also demonstrated that imaging with color analysis can provide quick and reliable results concerning mini-tablet coating thickness variability. A high correlation between the inter-mini-tablet variability of hue and UV-Vis results was obtained, which indicated the usefulness of non-destructive, fast and easy color analysis, performed with a scanner, to evaluate film thickness on a large number of mini-tablets.
Author Contributions: Conceptualization, M.T., M.S. and R.D.; methodology, M.T., R.Š. and R.D.; formal analysis, M.T., R.Š. and R.D.; investigation M.T., M.F. and R.Š.; data curation, M.T., M.F. and R.D..; writing—original draft preparation, M.T.; writing—review and editing, M.S., M.F. and R.D.; visualization, R.D. and M.T.; supervision, M.S. and R.D. All authors have read and agreed to the published version of the manuscript.
Funding: This research received no external funding.
Institutional Review Board Statement: Not applicable.
Informed Consent Statement: Not applicable.
Figure 6. Correlation of mini-tablet center hue and coating thickness variability.
Fluid bed coating of pellets using both a swirl and standard Wurster distributor werealready compared by Heng et al. [44]. Pellet flows in the fluid bed coater equipped witha swirl distributor were characterized by higher Reynolds numbers (indicating higherturbulence) than standard Wurster coating. The turbulent flow of pellets in the coatingchamber equipped with the swirl distributor resulted in a more uniform coating with lessagglomeration and fewer defects. Thus, the benefits from using the swirl distributors arenoticeable, and there have been first attempts to construct new swirl distributors using 3Dprinting [45].
4. Conclusions
Mini-tablets can be coated in a fluid bed system using both classical Wurster distribu-tors as well as swirl generators. However, based on the results of UV-Vis analysis of thecoating tracer, better film uniformity (regardless of the mini-tablets diameter) was achievedin the case of the distributor with a swirl generator. While using the same process condi-tions and the same process chamber, higher coating variability was always observed forbigger mini-tablets (3.0 mm diameter) than for the smaller ones (diameter of 2.5 or 2.0 mm).Increased air fluidization velocity always improved the coating uniformity of mini-tablets.It is assumed that the mixing in the annulus region, as well as the gap size, are the limitingfactors that determine mini-tablet coating thickness variability. Hardness testing showedan increase in hardness for coated mini-tablets as well as good correlation with the coatingthickness variability pattern. It was also demonstrated that imaging with color analysiscan provide quick and reliable results concerning mini-tablet coating thickness variability.A high correlation between the inter-mini-tablet variability of hue and UV-Vis results wasobtained, which indicated the usefulness of non-destructive, fast and easy color analysis,performed with a scanner, to evaluate film thickness on a large number of mini-tablets.
Author Contributions: Conceptualization, M.T., M.S. and R.D.; methodology, M.T., R.Š. and R.D.;formal analysis, M.T., R.Š. and R.D.; investigation M.T., M.F. and R.Š.; data curation, M.T., M.F. andR.D.; writing—original draft preparation, M.T.; writing—review and editing, M.S., M.F. and R.D.;visualization, R.D. and M.T.; supervision, M.S. and R.D. All authors have read and agreed to thepublished version of the manuscript.
Funding: This research received no external funding.
Institutional Review Board Statement: Not applicable.
Informed Consent Statement: Not applicable.

Pharmaceutics 2021, 13, 746 10 of 11
Data Availability Statement: All data obtained during the study are available from the correspond-ing author on reasonable request.
Conflicts of Interest: The authors declare no conflict of interest.
References1. Joshi, S.; Petereit, H.-U. Film coatings for taste masking and moisture protection. Int. J. Pharm. 2013, 457, 395–406. [CrossRef]2. Albanez, R.; Nitz, M.; Taranto, O.P. Enteric coating process of diclofenac sodium pellets in a fluid bed coater with a wurster insert:
Influence of process variables on coating performance and release profile. Adv. Powder Technol. 2013, 24, 659–666. [CrossRef]3. Wang, Y.; Yang, J.; Qian, Y.; Yang, M.; Qiu, Y.; Huang, W.; Shan, L.; Gao, C. Novel ethylcellulose-coated pellets for controlled
release of metoprolol succinate without lag phase: Characterization, optimization and in vivo evaluation. Drug Dev. Ind. Pharm.2015, 41, 1120–1129. [CrossRef] [PubMed]
4. Sonar, G.; Rawat, S. Optimization of pantoprazole enteric pellets coating process by QbD: Effect of coating process variables onthe intermediate quality of the product and scale up. Int. J. Pharm. Pharm. Sci. 2015, 7, 80–87.
5. Behzadi, S.S.; Toegel, S.; Viernstein, H. Innovations in coating technology. Recent Pat. Drug Deliv. Formul. 2008, 2, 209–230.[CrossRef] [PubMed]
6. Yang, W.C. Handbook of Fluidization and Fluid-Particle Systems; Marcel Dekker: New York, NY, USA, 2003; ISBN 082470259X.7. Wurster, D.E.; Lindlof, J.A. Particle Coating Apparatus. U.S. Patent 3,241,520, 22 March 1966.8. Felton, L.A.; McGinity, J.W. Aqueous Polymeric Coatings for Pharmaceutical Dosage Forms; CRC Press: Boca Raton, FL, USA, 2008;
ISBN 9780849387883.9. Savic, S.; Gregorka, M.; Dreu, R.; Srcic, S.; Sibanc, R.; Lustrik, M.; Zun, I. A Process Device for Coating Particles. WIPO Patent
Application WO/2010/065000, 10 June 2010.10. Dreu, R.; Lustrik, M.; Perpar, M.; Zun, I.; Srcic, S. Fluid-bed coater modifications and study of their influence on the coating
process of pellets. Drug Dev. Ind. Pharm. 2012, 38, 501–511. [CrossRef]11. Luštrik, M.; Šibanc, R.; Srcic, S.; Perpar, M.; Žun, I.; Dreu, R. Characteristics of pellet fl ow in a Wurster coater draft tube utilizing
piezoelectric probe. Powder Technol. 2013, 235, 640–651. [CrossRef]12. Luštrik, M.; Dreu, R.; Šibanc, R.; Srcic, S. Comparative study of the uniformity of coating thickness of pellets coated with
a conventional Wurster chamber and a swirl generator-equipped Wurster chamber. Pharm. Dev. Technol. 2012, 17, 268–276.[CrossRef]
13. Klingmann, V.; Spomer, N.; Lerch, C.; Stoltenberg, I.; Frömke, C.; Bosse, H.M.; Breitkreutz, J.; Meissner, T. Favorable Acceptanceof Mini-Tablets Compared with Syrup: A Randomized Controlled Trial in Infants and Preschool Children. J. Pediatr. 2013, 163,1728–1732. [CrossRef]
14. Kluk, A.; Sznitowska, M.; Brandt, A.; Sznurkowska, K.; Plata-Nazar, K.; Mysliwiec, M.; Kaminska, B.; Kotlowska, H. Canpreschool-aged children swallow several minitablets at a time? Results from a clinical pilot study. Int. J. Pharm. 2015, 485, 1–6.[CrossRef]
15. Mitra, B.; Chang, J.; Wu, S.; Wolfe, C.N.; Ternik, R.L.; Gunter, T.Z.; Victor, M.C. Feasibility of mini-tablets as a flexible drugdelivery tool. Int. J. Pharm. 2017, 525, 149–159. [CrossRef] [PubMed]
16. Liu, F.; Ghaffur, A.; Bains, J.; Hamdy, S. Acceptability of oral solid medicines in older adults with and without dysphagia: Anested pilot validation questionnaire based observational study. Int. J. Pharm. 2016, 512, 374–381. [CrossRef]
17. Ishida, M.; Abe, K.; Hashizume, M.; Kawamura, M. A novel approach to sustained pseudoephedrine release: Differentiallycoated mini-tablets in HPMC capsules. Int. J. Pharm. 2008, 359, 46–52. [CrossRef] [PubMed]
18. Szczepanska, M.; Sznitowska, M. Comparison of the coating process and in vitro dissolution of 3 mm gastro-resistant minitabletsand 5 mm gastro-resistant tablets with pantoprazole. Pharmazie 2019. [CrossRef]
19. Czajkowska, M.; Kotlowska, H.; Madanecka, A.; Maja, S.; Doniza, D.; Sosnowicz, A.; Sznitowska, M. Prolonged-release minitabletswith carbamazepine—Preliminary observations in vitro. J. Pharm. Pharmacol. 2017, 69, 471–479. [CrossRef]
20. Knop, K.; Kleinebudde, P. PAT-tools for process control in pharmaceutical film coating applications. Int. J. Pharm. 2013, 457,527–536. [CrossRef] [PubMed]
21. Andersson, M.; Holmquist, B.; Lindquist, J.; Nilsson, O.; Wahlund, K.G. Analysis of film coating thickness and surface area ofpharmaceutical pellets using fluorescence microscopy and image analysis. J. Pharm. Biomed. Anal. 2000, 22, 325–339. [CrossRef]
22. Szczepanska, M.; Scanu, N.; Sznitowska, M. The effect of size of enteric-coated minitablets and type of the dispersing gel on thein vitro release of diclofenac. Acta Pol. Pharm. Drug Res. 2020, 77, 619–628. [CrossRef]
23. Nikowitz, K.; Folttmann, F.; Wirges, M.; Knop, K.; Pintye-Hódi, K.; Regdon, G.; Kleinebudde, P. Development of a Raman methodto follow the evolution of coating thickness of pellets. Drug Dev. Ind. Pharm. 2014, 40, 1005–1010. [CrossRef]
24. El Hagrasy, A.S.; Chang, S.-Y.; Desai, D.; Kiang, S. Raman spectroscopy for the determination of coating uniformity of tablets:Assessment of product quality and coating pan mixing efficiency during scale-up. J. Pharm. Innov. 2006, 1, 37–42. [CrossRef]
25. Lee, M.J.; Seo, D.Y.; Lee, H.E.; Wang, I.C.; Kim, W.S.; Jeong, M.Y.; Choi, G.J. In line NIR quantification of film thickness onpharmaceutical pellets during a fluid bed coating process. Int. J. Pharm. 2011, 403, 66–72. [CrossRef] [PubMed]
26. Römer, M.; Heinämäki, J.; Strachan, C.; Sandler, N.; Yliruusi, J. Prediction of Tablet Film-coating Thickness Using a Rotating PlateCoating System and NIR Spectroscopy. AAPS PharmSciTech 2008, 9, 1047–1053. [CrossRef] [PubMed]
Pharmaceutics 2021, 13, 746 11 of 11
27. Haaser, M.; Gordon, K.C.; Strachan, C.J.; Rades, T. Terahertz pulsed imaging as an advanced characterisation tool for filmcoatings—A review. Int. J. Pharm. 2013, 457, 510–520. [CrossRef] [PubMed]
28. Brock, D.; Zeitler, J.A.; Funke, A.; Knop, K.; Kleinebudde, P. A comparison of quality control methods for active coating processes.Int. J. Pharm. 2012, 439, 289–295. [CrossRef]
29. Czajkowska, M.; Sznitowska, M.; Kleinebudde, P. Determination of coating thickness of minitablets and pellets by dynamicimage analysis. Int. J. Pharm. 2015, 495. [CrossRef]
30. Li, C.; Zeitler, J.A.; Dong, Y.; Shen, Y.-C. Non-Destructive Evaluation of Polymer Coating Structures on Pharmaceutical PelletsUsing Full-Field Optical Coherence Tomography. J. Pharm. Sci. 2014, 103, 161–166. [CrossRef]
31. Markl, D.; Hannesschläger, G.; Sacher, S.; Leitner, M.; Buchsbaum, A.; Pescod, R.; Baele, T.; Khinast, J.G. In-Line Monitoring of aPharmaceutical Pan Coating Process by Optical Coherence Tomography. J. Pharm. Sci. 2015, 104, 2531–2540. [CrossRef]
32. Gaber, D.M.; Nafee, N.; Abdallah, O.Y. Mini-tablets versus pellets as promising multiparticulate modified release delivery systemsfor highly soluble drugs. Int. J. Pharm. 2015, 488, 86–94. [CrossRef]
33. Aleksovski, A.; Dreu, R.; Gašperlin, M.; Planinšek, O. Mini-tablets: A contemporary system for oral drug delivery in targetedpatient groups. Expert Opin. Drug Deliv. 2015, 12, 65–84. [CrossRef]
34. Podrekar, G.; Kitak, D.; Mehle, A.; Lavric, Z.; Likar, B.; Tomaževic, D.; Dreu, R. In-Line Film Coating Thickness Estimation ofMinitablets in a Fluid-Bed Coating Equipment. AAPS PharmSciTech 2018, 19, 3440–3453. [CrossRef]
35. Bodea, M.; Napoca, C. Film coating preparation of metoprolol tartrate mini-tablets and in vitro drug release studies. Clujul Med.2010, 83, 457–464.
36. Szczepanska, M.; Paduszynski, P.; Kotlowska, H.; Sznitowska, M. Optimization of the coating process of minitablets in twodifferent lab-scale fluid bed systems. Drug Dev. Ind. Pharm. 2020, 46, 31–41. [CrossRef] [PubMed]
37. Strickley, R.G. Pediatric Oral Formulations: An Updated Review of Commercially Available Pediatric Oral Formulations Since2007. J. Pharm. Sci. 2019, 108, 1335–1365. [CrossRef] [PubMed]
38. Lura, A.; Tardy, G.; Kleinebudde, P.; Breitkreutz, J. Tableting of mini-tablets in comparison with conventionally sized tablets: Acomparison of tableting properties and tablet dimensions. Int. J. Pharm. X 2020, 2, 100061. [CrossRef]
39. Oleari, C. Standard Colorimetry: Definitions, Algorithms and Software; Wiley & Sons: Chichester, UK, 2016; ISBN 9781118894453.40. Šibanc, R.; Luštrik, M.; Dreu, R. Analysis of pellet coating uniformity using a computer scanner. Int. J. Pharm. 2017, 533, 377–382.
[CrossRef]41. Sabnis, R.W. Handbook of Biological Dyes and Stains; John Wiley & Sons, Inc.: Hoboken, NJ, USA, 2010; ISBN 9780470586242.42. Oman Kadunc, N.; Šibanc, R.; Dreu, R.; Likar, B.; Tomaževic, D. In-line monitoring of pellet coating thickness growth by means of
visual imaging. Int. J. Pharm. 2014, 470, 8–14. [CrossRef] [PubMed]43. Cheng, X.X.; Turton, R. The Prediction of Variability Occurring in Fluidized Bed Coating Equipment. I. The Measurement of
Particle Circulation Rates in a Bottom-Spray Fluidized Bed Coater. Pharm. Dev. Technol. 2000, 5, 311–322. [CrossRef]44. Heng, P.W.S.; Chan, L.W.; Tang, E.S.K. Use of swirling airflow to enhance coating performance of bottom spray fluid bed coaters.
Int. J. Pharm. 2006, 327, 26–35. [CrossRef]45. Odeleye, A.O.O.; Chui, C.-Y.; Nguyen, L.; Castrejón-Pita, A.A.; Ye, H.; Cui, Z. On the use of 3D-printed flow distributors to
control particle movement in a fluidized bed. Chem. Eng. Res. Des. 2018, 140, 194–204. [CrossRef]