assessment of nitrogen and acid deposition impacts to
TRANSCRIPT

New York State Energy Research and Development Authority
Assessment of Nitrogen and Acid Deposition Impacts to Terrestrial and Aquatic Ecosystems of the Tug Hill, 2005-2007
Report 11-06 December 2010

The New York State Energy Research and Development Authority (NYSERDA) is a public benefit corporation created in 1975 by the New York State Legislature.
NYSERDA derives its revenues from an annual assessment levied against sales by New York’s electric and gas utilities, from public benefit charges paid by New York rate payers, from voluntary annual contributions by the New York Power Authority and the Long Island Power Authority, and from limitedcorporate funds.
NYSERDA works with businesses, schools, and municipalities to identify existing technologies and equipment to reduce their energy costs. Its responsibilities include:
• Conducting a multifaceted energy and environmental research and development program to meet New York State’s diverse economic needs.
• The New York Energy $martSM program provides energy efficiency services, including those directed at the low-income sector, research and development, and environmental protection activities.
• Making energy more affordable for residential and low-income households.
• Helping industries, schools, hospitals, municipalities, not-for-profits, and the residential sector, implement energy-efficiency measures. NYSERDA research projects help the State’s businesses and municipalities with their energy and environmental problems.
• Providing objective, credible, and useful energy analysis and planning to guide decisions made by major energy stakeholders in the private and public sectors.
• Since 1990, NYSERDA has developed and brought into use successful innovative, energy-efficient, and environmentally beneficial products, processes, and services.
• Managing the Western New York Nuclear Service Center at West Valley, including: overseeing the State’s interests and share of costs at the West Valley Demonstration Project, a federal/State radioactive waste clean-up effort, and managing wastes and maintaining facilities at the shut-down State-Licensed Disposal Area.
• Coordinating the State’s activities on energy emergencies and nuclear regulatory matters, and monitoring low-level radioactive waste generation and management in the State.
• Financing energy-related projects, reducing costs for ratepayers.
For more information, contact the Communications unit, NYSERDA, 17 Columbia Circle, Albany, New York 12203-6399; toll-free 1-866-NYSERDA, locally (518) 862-1090, ext. 3250; or on the web at www.nyserda.org
State of New York eNergY reSearch aNd developmeNt authoritY
Andrew M. Cuomo, Governor Vincent A. DeIorio, Esq., Chairman Francis J. Murray, Jr., President and Chief Executive Officer

aSSeSSmeNt of NitrogeN aNd acid depoSitioN impactS to terreStrial aNd aquatic ecoSYStemS of the tug hill, 2005-2007
Final Report
Prepared for the
New York State eNergY reSearch aNd
developmeNt authoritY
Albany, NYwww.nyserda.org
Greg LampmanProject Manager
Prepared by:
State uNiverSitY of New York college of eNviroNmeNtal ScieNce aNd foreStrY
Syracuse, NY
Gregory G. McGee Myron J. Mitchell
Principal Investigators
NYSERDA NYSERDA 8646 December 2010Report 11-06

1
ACKNOWLEDGMENTS
This research was supported by the New York State Energy Research and Development Authority. We thank Brent Priz, Laura Hartley, Brian Borchert and David Lyons for assistance in field data collection. Patrick Crast and Michelle Peach of the The Nature Conservancy Tug Hill Field Office provided helpful logistical assistance in study site selection, site access, and field data collection. David Lyons, Pat McHale and Charles Schirmer directed laboratory analyses.

2
ABSTRACT
The purpose of this study was to assemble a two-year baseline dataset to assess the extent to which aquatic and terrestrial ecosystems of New York’s Tug Hill region may be affected by excess nitrogen (N) and acidic deposition. First-order stream chemistry, forest soil chemistry, and canopy tree tissue chemistry were analyzed to compare various indices of ecosystem acidification and nitrogen accumulation. The ~290,000–ha Tug Hill region, located between Lake Ontario and the Adirondack Mountains, is subject to high levels of N and acidic deposition equaling or exceeding other more extensively studied areas of New York, such as the Adirondacks and Catskills. Despite the potential for adverse effects, there has never been a regional assessment of atmospheric acid and N deposition impacts to the Tug Hill’s forests and streams. This project’s analysis of current conditions in the region helps to fill this information gap, and substantially expands our knowledge of the effects of atmospheric deposition on aquatic ecosystems and forests in the northeastern United States. Fifty-seven study sites were established between summer, 2005 and spring, 2007 on public and private forest lands in the Tug Hill study area. Synoptic water samples were taken during spring snowmelt (March, 2006 and 2007) and summer baseflow (August 2005 and 2006) periods. Two 500-m2 permanent plots were established in the uplands directly adjacent to the stream water sampling sites. The plots were used to quantify forest vegetation composition, and to sample forest floor and upper mineral soils and live canopy foliage. The following indices of acidification and nitrogen accumulation were determined and compared with values from observational and experimental studies conducted elsewhere in the Northeast:
Indicators of Acidification: foliar Mg concentration, foliar Ca:Al ratio, surface water pH, surface water acid neutralizing capacity (ANC), surface water total aluminum concentration, and upper mineral soil base saturation. Indicators of Nitrogen Accumulation: forest floor C:N ratio, forest floor N content and extractable NO3
- content, foliar N concentration, foliar Ca:Al, Mg:N and lignin:N ratios, and seasonal patterns of surface water NO3
-
Indicators of Acidification - Through a series of chemical indices we conclude that, although the Tug Hill region appears to have substantially more buffering capacity than other forested regions of New York (i.e., Adirondacks and Catskills), it is displaying signs of potential negative impacts from acidic deposition. Surface water pH during summer baseflow conditions remained circumneutral during both throughout our sample period. During spring snowmelts of 2006 and 2007 episodic surface water pH averaged 4.2-5.5. In 2006 and 2007, 21% and 12% of samples had pH <6.0 (freshwaters having pH less than approximately 6.0 – 5.5 begin to surpass tolerance thresholds of many aquatic invertebrates). Surface water ANC averaged >700 μeq CaCO
concentration.
3 L-1 during summer baseflow and >200 μeq CaCO3/L during spring snowmelt. These values are substantially higher than those recently reported from Adirondack streams, and suggest that Tug Hill streams currently remain relatively well buffered from atmospheric acidic deposition. Total Al concentrations averaged (± 1 SE) 1.1 ± 0.3 and 0.5 ± 0.2 μmol L-1 during baseflow conditions

3
and 1.4 ± 0.3 and 1.6 ± 0.2 μmol L-1 during spring snowmelt periods. Total aluminum concentrations were positively correlated with DOC concentrations during both the spring and summer sample periods and this was likely due to wetland-derived organo-aluminum complexes since DOC and Al concentrations both exhibited strong positive correlations with the proportion of watershed area comprised of wetlands. Analyses of foliar tissue chemistry also revealed evidence of potential negative impacts of acidification to this region’s forests. In 2005 and 2006, 10% and 11% of sugar maple samples had Mg concentrations <0.7 mg/g dry wt, the concentration below, which previous studies have suggested sugar maple becomes susceptible to decline imposed by added stress agents such as drought and defoliation, and brought on by acid-induced leaching of Mg from soils. The foliar Ca:Al ratios of all species on the Tug Hill (Ca:AlTug) were lower than those observed (Ca:AlObs) from other areas of the Northeast. Furthermore, the Ca:AlTug for red spruce, American beech, red maple and sugar maple were also below the ratios for these respective species that correspond with experimentally-induced, elevated nitrification and soil acidification (Ca:AlExp). For instance, the respective 2005 and 2006 averages of Ca:AlTug and Ca:AlExp for dominant species in this study were: red spruce, Ca:AlTug = 30-38, Ca:AlExp = 31-82; American beech, Ca:AlTug = 53-184, Ca:AlExp = 199-254; red maple Ca:AlTug = 74-208, Ca:AlExp = 442; and sugar maple Ca:AlTug = 76-255, Ca:AlExp
Indicators of Nitrogen Saturation – A number of soil, surface water and tissue chemistry indices suggest that the Tug Hill region is accumulating N and may be entering early stages of N saturation. The average (±1 SE) C:N ratio of Tug Hill forest floor horizons was 18.0 ± 0.2. All (100%) of the forest floor samples, averaged for each of the 57 sites, had C:N ratios below 22, the level at which elevated nitrification rates have been demonstrated to occur. The observed Tug Hill C:N ratios were lower than those recently reported in the Adirondacks. Average extractable NO
= 248. As with foliar Mg concentrations, low Ca:Al ratios indicate possible leaching of Ca from soils, which in turn initiates nutrient imbalances in plants. Percent base saturation of the Tug Hill upper mineral horizon averaged (±1 SE) 11.4 ± 0.0 percent (range: 2.6-38.3 percent) indicating greater buffering across the Tug Hill than western Adirondack soils. Still, 52% of the soil samples exhibited base saturations less than 10%, indicating potential for future acidification.
3- contents of the Tug Hill forest floor (0.37 µmol N g-1 soil) and mineral soil (0.17 µmol N
g-1 soil) horizons were both ~6-fold greater than averages recently reported from Adirondack forests. Similarly, the forest floor horizons on the Tug Hill averaged (±1 SE) 2.30 ± 0.04 percent N, which is 15-25% higher than mean values reported in recent studies of Adirondack soils. Foliar N averaged 1.2-1.9% for coniferous species and 2.2-3.2% for deciduous species over the two years of the study. For all tree species sampled in this study and for which comparisons are available in the literature, foliar N concentrations from the Tug Hill region were consistently greater than those reported in other areas of the Northeast, and greater than foliage sampled from plots receiving high experimental N fertilization treatments. Over the two years of the study, average foliar Mg:N ratios ranged from 0.04-0.08 for conifers and 0.04-0.11 for hardwoods; and average Ca:Al ratios ranged from 19-40 for conifers and 53-381 for hardwoods. In nearly all instances, the Tug Hill foliar Mg:N and Ca:Al ratios were similar to or less than those from foliage sampled from plots receiving experimental N fertilization in other northeastern forests. For the Tug Hill region where precipitation nitrate concentrations average ~20 μeq L-1, 16% of the sampled streams exhibited elevated NO3
- concentrations (>20 µeq L-1) during summer baseflow (approaching Stage 2 N-saturation conditions) and 28% exhibited moderate increases

4
(10-20 µeq L-1) during the summer growing season (Stage 1). Since most streams in our sample were influenced by wetlands and hence would be subject to denitrification, and NO3
- exhibited a weak but negative correlation with wetland area, it is possible that more NO3
- is being leached from upland forests than was being detected in the surface water.

5
TABLE OF CONTENTS List of Tables ………………………………………………….………………………….. 6 List of Figures …………………………………………………………………..………… 8 1. INTRODUCTION
1.1 Background .…………………………………………………………………....... 9 1.2 Project Objectives………………………………………………………………... 12
2. METHODS 2.1 Study Region …………………………………………………………................. 12 2.2 Study Site Selection……………………………………………………………... 13 2.3 Field and Laboratory Methods…………………………………………………... 18 2.3.1 Field Sampling Procedures ………………………………………………… 18 2.3.2 Laboratory Procedures……………………………………………………… 20 2.3.3 Analytical Indicators of Acidification and Nitrogen Enrichment………….. 21 2.3.4 Watershed Characteristics…………………………………………………. 23 2.3.5 Forest Community Analysis……………………………………………….. 23 3. RESULTS and DISCUSSION 3.1 Watershed Hydrology Characteristics ………………………………………….. 24 3.2 Forest Vegetation Description ………………………………………………….. 25 3.2.1 Forest Structure…………………………………………………………… 25 3.2.2 Forest Composition……………………………………………………….. 26 3.3 Soil Chemistry…………………………………………………………………… 33 3.4 Foliar Tissue Chemistry…………………………………………………………. 38 3.5 Surface Water Chemistry……………………………………………………….. 43 4. SYNTHESIS and CONCLUSIONS………………………………………………… 54 5. LITERATURE CITED…………………………………………………………….. 56 APPENDIX I – Quality Control…………………………………………………………. 62 APPENDIX II – List of Associated Research Products ………………………………… 70

6
LIST OF TABLES Table 1. Summary of long-term average (1980-2008; except Biscuit Brook record, which began
1983) atmospheric wet deposition of N, SO4- and acid to select regions of northeastern
United States. Source: National Atmospheric Deposition Program – National Trends Network (2010)…………………………………………………………………… 11
Table 2. Summary of study site locations, watershed hydrologic characteristics, ownership
categories and stream sampling history……………………..……………………. 16
Table 3. Live canopy tree (>10.0 cm dbh) basal areas in different forest ownership categories.
…………………………………………………………………………………….. 26 Table 4. Live canopy tree (>10 cm dbh) diameter distributions in four forest ownership
categories on the Tug Hill………………………………………………………… 26 Table 5. Average basal areas of tree (>10.0 cm dbh) species at 57 Tug Hill forest sites….. 27 Table 6. Results of indicator species analysis of dominant live canopy tree (>10.0 cm dbh) basal
areas for four different forest ownership classes. ……………………………..…. 28 Table 7. Average study site elevations (m) by ownership category. ……………………… 29 Table 8. Summary of correlations between organic and mineral soil chemistry parameters and
elevation on the Tug Hill. ………………………………………………………. 32 Table 9. Summary of correlations between organic and mineral soil chemistry parameters and
basal areas of dominant tree species on the Tug Hill…………………………….. 32 Table 10. Summary of soil chemistry variables for organic and upper mineral soil horizons
across the Tug Hill study sites…………………………………………………… 34 Table 11. Summary of soil chemistry variables for organic and mineral soil horizons at upper
and lower topographic slope positions across the Tug Hill study sites………… 35

7
Table 12. Live, mid-summer (2005 and 2006) foliar chemistry (mean ± 1 SE) of dominant tree species in Tug Hill upland forests. ……………………………………………….. 40
Table 13. Foliar chemistry of dominant tree species in Tug Hill upland forests and comparisons
with reported literature. …………………………………………………………… 41 Table 14. Summary of synoptic surface water chemistry surveys of first-order streams on the
Tug Hill during summer baseflow and spring snowmelt periods………………….. 44 Table 15. Summary of correlations between surface water analytes, elevation and proportion of
contributing watersheds as wetlands for synoptic surveys of first-order streams on the Tug Hill during summer baseflow and spring snowmelt periods. ………………… 50
Table 16. Categorization of Tug Hill first-order streams (percent of 50 streams having repeated
samples during spring snowmelt and summer baseflow periods) based upon seasonal NO3
- concentrations………………………………………………………………… 51

8
LIST OF FIGURES Figure 1. Locations of 57 stream and forest sampling sites in the mid and upper elevations
of the Tug Hill………………………………………………………………….. 14 Figure 2. Average weekly stream discharge for Sandy Creek at the USGS Gauge 04250750
near Adams, New York………………………………………………………… 19 Figure 3. The relationship between sample site elevation and wetland area as a proportion
of total watershed area upstream of sampling sites in the Tug Hill……………. 25 Figure 4. NMS ordination of forest canopy composition (basal area of trees>10 cm dbh for
species occurring on >5% of plots) of 114 subplots at 57 sites on the Tug Hill.. 30 Figure 5. Comparison of forest floor C:N from this study, eleven Adirondack sites spanning
a range of soil calcium content, and 86 hardwood/mixed hardwood stands on ten different soils types in the Adirondacks……………………………………….. 36
Figure 6. Comparison of extractable NO -
3 content in forest floor and upper mineral soil horizons from this study and eleven Adirondack sites spanning a range of soil calcium content………………………………………………………………… 37
Figure 7. Surface water pH during synoptic surveys of Tug Hill first-order streams,
2005 -2007………………………………………………………………………. 45 Figure 8. Acid neutralizing capacity (µeq/L as CaCO3) of Tug Hill first-order streams during
synoptic samples, 2005- 2007……………………………………………………46 Figure 9. Total inorganic aluminum concentrations in surface waters of the Tug Hill during
baseflow and spring snowmelt periods, 2005-2007…………………………… 47 Figure 10. Relationships between total aluminum concentrations and (A) dissolved organic
carbon; and (B) pH in Tug Hill streams during summer baseflow and spring snowmelt periods…………………………………………………………… 48
Figure 11.Average nitrogen solute concentrations in synoptic samples of Tug Hill first-order
streams, 2005-2007……………………………………………………………. 51 Figure 12. Nitrate concentrations in Tug Hill first-order streams during synoptic sampling,
2005-2007……………………………………………………………………… 52

9
1 INTRODUCTION 1.1. Background New York’s Tug Hill is a gently sloping plateau, located between the Ontario Lake Plain and the Adirondack Mountains, that possesses natural resources of substantial ecological significance and economic importance. Due to the Tug Hill’s proximity to the eastern end of Lake Ontario, the region receives an annual average of ~105-125 cm of precipitation, including ~500 cm of lake-effect snowfall (Eschner et al. 1984). The region possesses ~47,000 ha of wetlands and ~6,400 km of streams of exceptional water quality (NYS Tug Hill Commission 2010a). These streams, in turn support a regional world-class trout and salmon fishery. For instance, the Salmon River, which is one of the larger streams draining the west slopes of the Tug Hill, supported a $10-million fishing industry in 1989 (Connelly et al.1990). The Tug Hill’s surface and groundwater resources also serve as important municipal and industrial water supplies for numerous communities, including Rome and Pulaski (McGee 2008; NYS Tug Hill Commission 2010a). The region possesses an interior core of approximately 600 km2 of unfragmented forests, and is the third largest, intact, forested landscape in New York, behind only the Adirondacks and Catskills (McGee 2008a). In addition to providing critical wildlife habitat, the Tug Hill’s forest resources support an $80 million wood products and paper manufacturing industry (NY State Tug Hill Commission 2010b). The region’s ecological importance is further highlighted by the acquisition of 18,200 ha by The Nature Conservancy in 2002, the retention of 12,200 ha in conservation easements by NYSDEC, and the selection of the Salmon River watershed, one of the major Tug Hill drainages, as one of two critical watersheds in New York to receive consideration for planning under US Fish & Wildlife Service State Wildlife Grant program (McGee 2008a). Still, due to its proximity to mid-western sources of industrial air pollution, and the volume of precipitation that it receives, the Tug Hill may be at risk of excessive acidic and nitrogen deposition. Atmospheric Deposition to the Tug Hill Fossil-fuel combustion sources are major emitters of sulfur dioxide (SO2) and nitrogen oxides (NOx
A substantial body of literature indicates that certain areas of New York (namely, Adirondacks, Catskills, Allegheny Plateau) are susceptible to adverse effects of atmospheric acidic and N deposition. Recent evidence suggests that some terrestrial systems in New York are becoming biologically “saturated” with N (Lovett et al. 2000; Driscoll et al. 2003b). In a survey of 39 Catskill streams, Lovett et al. (2000) found several with high year-round NO
). These pollutants undergo complex reactions in the atmosphere to form nitric and sulfuric acids, which, through atmospheric deposition in forests and bodies of water, affect ecosystems in complex ways and contribute to the acidification of soils, lakes and streams. Over the past 20 years, federal policies such as the Clean Air Act Amendments of 1990 (CAAAs) have resulted in decreased atmospheric emissions and deposition of sulfur in New York. In the same period, atmospheric emissions of nitrogen (N), which were not capped by the CAAAs, have not changed as markedly.
3- concentrations,
indicating advanced stages of N saturation. Furthermore, a comparison of northern hardwood forests across an N-deposition gradient in the Adirondacks found that western sites exhibited

10
lower ecosystem N retention and had higher soil solution NO3- concentrations below the rooting
zone (50 cm) than sites in the central Adirondacks (where N deposition is lower) (Mitchell et al. 2001a, 2003). These western Adirondack sites are relatively close to the Tug Hill and are subject to higher precipitation and pollutant inputs (Ito et al. 2002; Mitchell et al. 2001a) than other areas of the Adirondacks. Nevertheless, results from the Catskills (Lovett et al. 2000) and Adirondacks (Driscoll et al. 2003ac) have shown wide variation in N saturation status of watersheds. This variation cannot be accounted for by differences in deposition. Rather, the variation seems to be associated with forest composition (Lovett and Rueth 1999; Lovett et al. 2004; McGee et al. 2007a), historic forest disturbances (McGee et al. 2007a) and soil characteristics (Lovett et al. 2002; Page and Mitchell 2008). Similarly, high inputs of acid precursors have resulted in acidification of a large proportion of waters in the southwestern portion of the Adirondacks (Driscoll et al. 1998, Lawrence et al. 2008). Many watersheds in the Catskills continue to exhibit low soil exchangeable Ca2+ concentrations and low surface water acid neutralizing capacities (Burns et al. 1998), thereby rendering forests susceptible to additional adverse effects of acid deposition. Recent studies of sugar maple foliar tissue chemistry indicate that declining sugar maple stands in the Allegheny Plateau occur on sites with low soil Ca and Mg content (Bailey et al. 2004). Missing from this body of research is any consideration of atmospheric deposition effects to the Tug Hill. Due to its proximity to pollution sources and to high levels of precipitation, this region of New York is expected to be highly susceptible to atmospheric deposition, and perhaps more so than other areas where these phenomena have been studied in New York. The Tug Hill is subject to especially high levels of deposition of atmospheric pollutants (Table 1). In comparison with other regions of New York (e.g., the Adirondacks, Catskills, Allegheny Plateau), and of the Northeast (e.g., White Mountains and Allegheny Plateau of Pennsylvania) the Tug Hill has the highest long-term (1980-2008) average annual deposition rates for inorganic N (ammonium, NH4
+; nitrate NO3-) and acid (H+), and among the highest deposition of sulfate
(SO42-). For example, Tug Hill is subject to inputs of N and H+ that are 1.9- and 1.5-fold greater
than in the central Adirondacks. Because the Tug Hill forests are similar to those of the Adirondacks and northern New England, and much of the region has strongly acidic soils, it is likely that the Tug Hill is affected by N saturation and acidification. Despite these considerations, there has been no regional assessment of the effects of atmospheric deposition to the Tug Hill’s forests and streams, as is the case for other regions of the Northeast (e.g., Stoddard et al. 1999; Lovett et al. 2000; Lawrence et al. 2008).

11
Table 1. Summary of long-term average (1980-2008; except Biscuit Brook record that began 1983) atmospheric wet deposition of N, SO4
-
and acid to select regions of northeastern United States. Source: National Atmospheric Deposition Program – National Trends Network (2010).
Adirondack Mountains
White
Mountains
Catskill
Mountains
Allegheny
Plateau
Allegheny
Plateau
Tug Hill
NADP
Huntington Forest
Sample Station
Hubbard Brook
(NY20)
Biscuit Brook
(NH02)
Kane
(NY68)
Chautauqua
(PA29)
Bennett Bridge
(NY10) Elevation (m)
(NY52) 558 250 634 618 488 245
Inorganic N (kg ha-1 yr-1 4.8 ) 4.9 6.0 7.1 7.2 9.4 SO4
- (kg ha-1 yr-1 17 ) 18 23 32 27 30 H+ (kg ha-1 yr-1 0.4 ) 0.4 0.5 0.7 0.5 0.6 Total precipitation (cm) 109 122 139 124 106 130
Forest N-cycling processes and assimilation capacities are known or suspected to vary due to composition and age. Within a variety of fully-stocked stands types, nutrient sequestration processes may differ based upon stand-level differences in tree growth and mortality rates. It has been hypothesized, and to some degree, demonstrated, that old-growth forests, which by definition are in a steady-state phase of live biomass accumulation, will be less efficient in retention of limiting nutrients, and therefore subject to higher mineral nutrient leaching rates (Vitousek and Reiners 1975; Bormann and Likens 1979; Hedin et al. 1995) due to (1) chronic, stand-level nutrient losses associated with abundant live, but aging and senescent trees, which collectively lead to low stand-level nutrient retention (Gower et al. 1996; McGee et al. 2007b); or (2) or nutrient loss from abundant gap microsites associated with recently dead trees (e.g. Peet 1992). Nevertheless, other factors such as species composition, site conditions, and the abundance of recalcitrant carbon sources in coarse woody debris (Fisk et al. 2002) and leaf litter with high lignin content (e.g., McGee et al. 2007a) may influence nitrification rates and thereby affect nitrate leaching rates from forest systems (e.g., Lovett and Mitchell 2004). Within the Adirondack and Catskill Mountains sugar maple (Acer saccharum)-dominated forests, which also typically include a component of American linden (Tilia americana) and white ash (Fraxinus americana), have been shown to be associated with higher soil calcium availability (Heimburger 1934; Lovett and Mitchell 2004; Page and Mitchell 2008) and higher soil solution nitrate concentrations (McGee et al. 2007a). It is not known, however, whether these base-rich site indicator species simply occur on having soil microbial processes that facilitate nitrification, or if the dominant tree species, themselves, influence nitrification rates (e.g., through production of high quality leaf litter; Page and Mitchell 2008). Furthermore, it is not known how management activities that influence forest composition and structure may affect these relationships.

12
1.2 Project Objectives Given the importance of the Tug Hill for plant and wildlife habitat, forest products, fisheries, and drinking water, it is critical to understand the extent to which the region’s ecosystems may be impacted by excess N and acidic deposition. Yet, this region has not been subject to the monitoring efforts necessary to determine its susceptibility to impacts of acidic and nitrogen deposition. The goal of this project was to assess the degree to which the region exhibits signs of acidification and excess N deposition for the purpose of guiding the development of sound policies for the management and protection of the region’s forest and stream resources. Specifically our research objectives were to assemble and summarize a two-year baseline dataset of first-order stream, soil and foliar tissue chemistry for the Tug Hill region. We investigated potential linkages between surface water conditions, soil chemistry and vegetation tissue chemistry to determine their interactions with forest condition (composition, structure, developmental stage). These site-level evaluations will, in turn, help facilitate a regional determination of potential acid and N deposition impacts to the Tug Hill, and an assessment of variation among sites in acidification and N status that may be attributed to site conditions, forest species composition and stand development stage. 2
2.1 Study Region
METHODS
The Tug Hill is an undissected sloping plateau situated between Lake Ontario on the west and the Adirondack Mountains to the east. Elevations of the region range from approximately 75 m near Lake Ontario and increase gradually to 640 m near the plateau’s eastern escarpment at the Black River Valley. The region is demarcated to the south by the Oneida Lake Basin and Mohawk Valley. The central portion of the Tug Hill is comprised of gently rolling hills with local relief averaging less than 30 m (Newell 1939). The entire region is ~5,400 km2 in size and supports a population of approximately 100,000 in 41 towns and 21 villages (NYS Tug Hill Commission 2010a). Regional bedrock consists of lower Silurian and upper Ordovician sandstone, siltstone, and shale (Leaf and Wittwer 1974; Jordan 1977). The entire region was overtopped by the Laurentide ice sheet and today is overlain by glacial till and sorted outwash resulting in soils of varying chemistry and drainage capabilities (Leaf and Wittwer 1974; Cressey 1966). In general, upland soils at mid to upper elevations on the Tug Hill (where the present study was focused) are spodosols derived from sandstone till that are highly acidic, poorly drained, stony, of medium- to coarse-texture, and frequently possessing acid fragipans (USDA SCS 1960; Leaf and Wittwer 1974; USDA NRCS 2008). The prevailing direction of glacial scour and deposition resulted in long, linear northwest-to-southeast trending drainages across much of the highest elevations of the plateau (Newell 1939; USDA NRCS 2008). Lowland soils occurring in the shallow valleys at upper elevations of the region are primarily peat-muck soils (USDA SCS 1960).

13
Due to the poorly drained, acidic soils, the region’s interior was never converted to agricultural use. The interior remains a highly used, but unfragmented complex of upland forest and wetlands. Approximately one quarter of the plateau’s area is comprised of wetlands (New York State Tug Hill Commission 2002). Substantial areas of New York State Forests and Wildlife Management Areas ring the plateau at mid-elevations, and reflect those areas where subsistence agriculture was attempted during the 19th century and abandoned by the mid 20th century (McGee 2008a). Many stands within these State Forests were reforested through planting of eastern white pine (Pinus strobus), red pine (Pinus resinosa), Scots pine (Pinus sylvestris), Norway spruce (Picea abies) and white spruce (Picea glauca). Forests of the upper, interior Tug Hill plateau (above ~400 m) are classified as the Tug Hill Plateau Subsection of the Northern Appalachian – Boreal Forest Ecoregion (USDA Forest Service 2004, 2005). Woodlands on better drained soils are dominated by sugar maple, yellow birch (Betula alleghaniensis) and American beech (Fagus grandifolia), with a conifer component consisting of red spruce (Picea rubens) and eastern hemlock (Tsuga canadensis). On more poorly drained sites, boreal red spruce-balsam fir (Abies balsamea) types exist. Between ~200-400 m elevation forests transition to the Eastern Lake Ontario Lake Plain Subsection of the Great Lakes Ecoregion, (which is mapped locally from 75 m elevation at the Ontario shore to approximately 200 m). The Lake Plain forests are dominated by American beech-sugar maple mesic forests, with a mixture of oaks (Quercus spp.) hickories (Carya spp.) and aspen (Populus spp.) (USDA Forest Service 2004, 2005). Natural disturbances that shape the structure and influence the composition of the region’s forests include periodic severe wind events (frontal and cyclonic) and winter ice storms. The prevailing disturbance regime have resulted in naturally uneven-aged forests dominated by sugar maple, yellow birch, American beech, red spruce and eastern hemlock. By the mid-1950s successional northern hardwoods including red maple (Acer rubrum), white ash and black cherry (Prunus serotina) characterized the region due to regrowth on abandoned farmlands and extensive, repeated, selective harvesting (Stout 1958). Today, late-successional forests are uncommon in the region and are limited to four small, isolated, “satellite” State Forest Preserves that were established along with the Adirondack and Catskill Forest Preserves beginning in the 1890s. In addition to natural and human disturbances, several native and non-native insect pests and pathogens (eastern tent caterpillar, Malacosoma americanum; forest tent caterpillar, M. disstria; and the beech bark disease complex caused by the fungi Nectria spp., in conjunction with the beech scale Cryptococcus fagisuga) have had historic influences on the composition and structure of the Tug Hill forests (McGee 2008a). 2.2 Study Site Selection Between the spring of 2005 and summer of 2006, 57 sample sites were established across the middle and upper elevations of the Tug Hill (Figure 1, Table 2). Study sites were selected through an initial stratified (across all USGS 7.5’ Quadrangles spanning the region) random sample of first-order streams (as mapped on USGS 7.5’ Quadrangles). Landowners were identified (through tax parcel maps) and contacted for permission to access streams and adjacent forest stands. Study sites were established on New York State Forests, New York State Wildlife

14
Lewis County
Oneida County
Jefferson County
Oswego County
Figure 1. Locations of 57 stream and forest sampling sites in the mid and upper elevations of the Tug Hill, New York.

15
Management Units, New York State Forest Preserves, industrial forests (owned by commercial forest products companies, or timber investment and management organizations), and properties of small, non-industrial woodland owners. Eight sites were established on industrial woodlands that were purchased by The Nature Conservancy in 2002. An initial effort was made to select only those first-order streams that had no mapped wetlands associated with them in order to control for wetland influences on surface water nitrogen concentrations through denitrification (e.g., Hanson et al. 1994), nitrogen fixation (Hurd and Raynal 2004, and nitrogen assimilation (e.g., Bischoff et al. 2001) processes. Still in practice, it was impossible to locate first-order stream reaches within the interior portion of the Tug Hill that are not influenced by wetlands. Therefore, we present data here on stream water quality, but cannot use these data to infer conditions of upstream forests due to the potential intervening influences of wetlands. The final set of sample sites represents a stratified random sample of first order streams that were within a 15 minute walk of a passable road, and for which access was granted by the landowner. Four additional sites were established within each of the New York State Satellite Forest Preserves in order to obtain information on the limited late-successional forests. The final 57 samples sites were not equitably distributed across the region due to the lack of permission to access large areas of private woodlands. Sample sites were added sequentially as access was granted from landowners. Study site elevations ranged from approximately 275 – 600 m. The total number of study sites was: n=32 in August, 2005; n=44 in March, 2006; and n=57 in August, 2006.
Oswego
Jefferson

16
Table 2. Summary of study site locations, watershed hydrologic characteristics, land ownership categories (SFW=New York State Forest or State Wildlife Management Unit; FP=New York State Forest Preserve; NI=small non-industrial woodland owner; IND=industrial woodland owner; IND-TNC=industrial history with recent transfer to The Nature Conservancy) and stream sampling history.
Stream Sample Inclusion Site ID
Coordinates
Elev. (m)
Stream length
(m)
Watershed area (ha)
Wetland area (ha)
Ownership
1
Sp. 05
Su. 05
Sp. 06
Su. 06
Sp. 07
ST008 N43 26.076 W75 37.818 448 400 9 0 SFW 1 * * * * ST011 N43 25.285 W75 38.776 345 600 91 8 SFW 1 * * * * ST016 N43 26.372 W75 39.423 368 1600 100 0 SFW 1 * * * * ST025 N43 26.563 W75 42.761 364 300 27 6 SFW 1 * * ST028 N43 28.829 W75 41.319 383 1300 173 10 NI 1 * * ST032 N43 28.544 W75 45.879 330 700 31 0 SFW 1 * * * * * ST037 N43 29.241 W75 46.406 335 1700 70 0 SFW 1 * * * * * ST064 N43 36.569 W75 45.499 516 400 20 1 NI * * ST065 N43 35.159 W75 45.518 480 400 15 1 NI * * * * * ST067 N43 33.636 W75 44.677 422 300 15 1 FP * * * * * ST070 N43 32.648 W75 44.946 375 300 8 0 NI * * * * * ST086 N43 30.951 W75 44.038 365 700 22 1 NI * * * * * ST089 N43 30.927 W75 40.778 444 900 80 6 NI * * * * * ST108 N43 32.827 W75 32.082 502 1200 75 10 NI 1 * * * * ST131 N43 33.340 W75 43.267 507 100 6 0 NI * * * * * ST136 N43 35.907 W75 44.594 520 200 5 1 IND * * ST152 N43 36.770 W75 32.106 560 1500 225 22 SFW 1 * * * * * ST163 N43 39.320 W75 37.660 572 700 31 15 IND-TNC * * * ST165 N43 37.322 W75 38.127 550 400 19 4 IND * * * ST200 N43 43.296 W75 44.326 522 500 25 4 SFW * * * * ST201 N43 43.533 W75 42.672 549 800 25 7 NI * * * * ST203 N43 42.760 W75 43.085 540 100 1 0 SFW * * * * ST204 N43 42.544 W75 43.587 548 900 66 9 SFW * * * * ST219 N43 42.340 W75 34.604 580 1600 129 24 SFW 1 * * * ST225 N43 43.209 W75 33.216 551 1600 140 6 SFW 1 * * * * * ST233 N43 41.293 W75 51.996 443 900 55 10 SFW * * ST301 N43 41.915 W75 32.885 604 800 26 0 SFW 1 * * * ST500 N43 32.623 W75 51.481 276 1000 31 1 SFW * * * *

17
ST501 N43 34.985 W75 51.041 332 700 67 7 SFW * * * * ST502 N43 44.432 W75 50.459 448 400 16 3 SFW * * * ST503 N43 30.447 W75 39.694 434 500 19 0 SFW * * ST510 N43 39.608 W75 39.174 595 1400 74 33 IND-TNC * * * ST511 N43 39.028 W75 39.405 586 800 43 16 IND-TNC * * * ST601 N43 38.438 W75 34.846 589 400 48 114 IND * ST602 N43 38.669 W75 36.454 570 400 35 110 IND-TNC * * ST605 N43 38.920 W75 32.707 583 500 31 1 3 IND * ST606 N43 37.173 W75 36.890 575 600 32 1 0 IND * * ST607 N43 35.780 W75 37.451 544 200 11 2 IND * * * ST608 N43 34.083 W75 36.563 534 200 3 1 0 IND * * ST609 N43 33.543 W75 36.969 539 2000 89 1 6 IND * * * ST610 N43 33.347 W75 37.923 544 1300 94 18 IND * * ST612 N43 34.142 W75 39.852 537 2000 207 51 IND * * ST701 N43 32.930 W75 40.603 503 700 41 5 IND * * * ST703 N43 33.212 W75 41.183 490 400 14 3 IND * * * ST704 N43 31.601 W75 36.175 502 700 33 1 0 IND * * * ST706 N43 28.886 W75 35.639 441 1000 36 1 0 IND * * ST716 N43 40.460 W75 41.210 567 200 3 0 IND-TNC * * * ST717 N43 40.383 W75 41.510 564 1600 74 21 IND-TNC * * ST720 N43 39.813 W75 38.265 566 200 3 1 IND-TNC * * ST722 N43 40.258 W75 38.535 576 1000 20 10 IND-TNC * * ST900 N43 34.318 W75 43.713 483 500 25 1 FP * * * ST901 N43 29.434 W75 39.009 399 2200 236 8 FP * * * ST903 N43 39.401 W75 27.776 583 300 7 1 0 SFW * * ST904 N43 26.728 W75 36.363 439 300 5 1 0 SFW * * * ST995 N43 43.577 W75 40.196 570 100 8 1 SFW * * ST997 N43 42.316 W75 40.349 570 500 62 21 SFW * * ST999 N43 28.995 W75 42.341 395 900 36 1 0 FP * * 1 Total estimated wetland area reflects the combined areas of mapped NYSDEC and USFWS-NWI wetlands unless indicated by a superscript, in which cases the study site was located in an areas where NWI wetland data do not exist or are not digitally available.

18
2.3 Field and Laboratory Methods 2.3.1. Field Sampling Procedures Surface Water - Synoptic water samples were collected at high-flow periods during spring
snowmelt events (April 1-8, 2005; March 2-30, 2006; March 26-27, 2007) and during low summer baseflow (August 12-16, 2005; August 10-25, 2006) periods (Figure 2). Water samples were stored at 4°C and with as little head space as possible to minimize gas exchange prior to laboratory analyses. Only 14 samples were obtained during the first snowmelt period, (2005) and these were collected from lower elevations. Water chemistry data will not be presented from the spring 2005 due to the low sample size and dissimilar spatial distribution of sample locations compared to subsequent campaigns.
Annual total precipitation values reported at the Bennet Bridge NADP monitoring station for 2005 and 2006 were 141 and 150 cm, respectively (National Atmospheric Deposition Program – National Trends Network, 2010). During the period 1983-2008 the average annual precipitation at this station was 132 cm with an interquartile range of 122-146 cm. Winter precipitation for 2006 and 2007 (corresponding to our snowmelt sampling periods) was 36 and 48 cm, respectively. Winter precipitation from 1983-2008 averaged 34 cm, with an interquartile range of 26-38 cm. The winter of 2007 produced the greatest level of precipitation during the 1983-2008 period. Summer precipitation for 2005 and 2006 (corresponding to our baseflow sampling periods) was 35 and 38 cm, respectively. Summer precipitation from 1983-2008 averaged 30 cm, with an interquartile range of 23-36 cm. The springtime precipitation for 2005 (19 cm) and 2006 (18 cm) were both relatively low, compared to the 1983-2008 average (29 cm) and were both lower than the value for the 25th percentile (23 cm).
Past studies have linked patterns in surface water nitrogen concentrations with forest
conditions within sub-catchments to infer the influence of upland forest structure and composition, and soil conditions on surface water quality. We are unable to draw such inferences in this study due to the drainage patterns of the region. The sub-watersheds at the upper elevations of the Tug Hill are long and linear, due to glacial scarification. Therefore, any random sample point along these streams will integrate the influence of numerous, varied forest stands and wetlands upstream of the sample. Although we sampled and described forest conditions directly adjacent to the random sample locations, these conditions do not necessarily describe conditions further upstream (sometimes as far as 2000 m, see Table 2).
Forest Vegetation - Two 500-m2 permanent, circular plots were established in the uplands
directly adjacent to the stream water sampling sites and marked with pin flags during the duration of the field sampling period. One plot was established at the top of the local slope, and the other at the base of the local slope, but outside of any riparian zones. All live trees (≥ 10.0 cm diameter at breast height, “dbh”) were identified and measured on the permanent plots to characterize local forest vegetation.

19
Forest Soils - During the summers of 2005 and 2006, three randomly located subsamples of
forest floor (Oe and Oi layers) and upper mineral soil (upper 10 cm) were collected from each permanent plot. The subsamples were composited, placed in polyethylene bags and stored at 4°C prior to laboratory analysis for nitrogen fractions. The samples were then air-dried for storage prior to further laboratory analyses.
Forest Canopy Foliage - Samples of live canopy foliage were extracted with a shotgun from
upper canopy positions from one individual of the two most dominant species on each permanent plot. Petioles were removed and samples were then air dried in paper bags for storage prior to laboratory analysis.
Date
Figure 2. Average weekly stream discharge for Sandy Creek at the USGS Gauge 04250750 near Adams, New York. Stream sampling periods for this study are indicated by the arrows.
ec)
s/3m(
e gar
chsiD
60
50
40
30
20
10
0
01/2003 01/2004 01/2005 01/2006 01/2007 01/2008 01/2009

20
2.3.2. Laboratory Procedures Surface Water Chemistry - Surface water pH was determined potentiometrically. Acid
neutralizing capacity (ANC, µeq L-1 CaCO3) was determined by titration with 0.002N H2SO4 on unfiltered water samples to two endpoints, pH 4.7 and then 4.4 (American Public Health Association 1976). Anion (NO3
-, Cl-, SO42-) concentrations (µeq L-1) were determined on
filtered (0.45 µm) samples using a Dionex 2000 ion chromatograph. Total dissolved nitrogen (TDN; µmol L-1, after persulfate oxidation in a ultra-violet digestor) and ammonium (NH4
+, µeq L-1) concentrations were determined on unfiltered samples using a Bran Luebbe AA3 auto analyzer. Dissolved organic nitrogen (DON, µmol L-1) was calculated as TDN – (NO3
- + NH4
+). Cation (Ca2+, Mg2+, K+, Na+, Total Al) concentrations (µeq L-1; µmol L-1 for Al) were determined using a Perkin Elmer 3300 DV inductively coupled plasma-atomic emission spectrometer (ICP-AES). Dissolved organic carbon (DOC, µmol C L-1) was determined on filtered (0.45 µm), acidified samples using a Tekmar Phoenix 8000 Carbon Analyzer.
Forest Soil Chemistry -Soil samples were prepared for all analyses by removing fine roots and
grinding/sieving the samples to pass a 2 mm mesh. Cation exchange capacity (CAC, meq per 100 g dry soil) was determined for the 2006 mineral soil samples by titration of 1 molar NH4Cl soil extract solution with 0.1 molar HCl following the procedures of Chapman (1965). Base saturation was defined as the percent of CEC accounted for by Ca2+, Mg2+, K+ and Na+ as determined by ICP-AES analysis of base cation concentrations in the NH4Cl soil extract solution. Total N and C concentrations in forest floor and mineral soil samples were determined using a Perkin-Elmer 2400® CHN Analyzer. Soil nitrogen fractions were determined following extraction with 2 N KCl. Total N and NH4
+ were determined using procedures described for surface waters, above. Soil extract nitrate concentrations were determined on unfiltered samples using a Bran Luebbe AA3 auto analyzer. Total dissolved organic nitrogen was calculated as TDN- (NO3
- + NH4+).
Forest Canopy Foliage Chemistry - Leaf tissue was prepared for analysis by detaching petioles
and grinding foliage to pass a 2 mm mesh. Foliar mineral nutrient (Ca, Mg, K) and Al content were determined using ICP-AES following microwave digestion of tissue samples in 1:4 HCl:HNO3 solution. Lignin was determined for the ground tissue samples using a Daisy II Incubator system (DairyOne Labs, Ithaca, NY). Foliar C and N content were determined using a Perkin-Elmer 2400® CHN Analyzer following further pulverization of the foliar samples with a Wig-L-Bug® amalgamator.

21
2.3.3. Analytical Indicators of Acidification and Nitrogen Enrichment Indicators of Acidification Soil Chemistry – Base saturation represents the percentage of base cations (Ca2+, K+, Mg2+, Na+)
that are present in soil, relative to the total quantity of exchangeable cations (including H+ and Aln+), and describes the availability of exchangeable base cations for biological processes and further buffering against acidification. The following base saturation levels have been correlated with certain expected biological outcomes (Cosby et al. 2006).
BS >20%: low levels for concern; no expected negative biological effects. BS 10-20%: base cation availability is reduced with possible negative impacts to tree
growth rates. BS 5-10%: base cation availability is greatly reduced and risk of tree mortality increased. BS <5%: severe risk of forest tree mortality due to acidification-induces stresses.
Past research has shown that as BS decreases, soil solution Al concentrations increase, and dissolved Al can be pronounced when BS falls below 15% (Reuss 1983; Cronan and Schofield 1990). Surface Water Chemistry –Repeated seasonal sampling periods enabled us to observe variation
in surface water conditions at the times when they were most influenced by vegetation and soil processes (baseflow) and at times when they were most likely to display episodes of acidification (spring snow melt). We analyzed surface water acid neutralizing capacity (ANC) and pH during the sampling events. Chronically acidic surface waters have ANC <0 µeq L-1 during baseflow periods; those with ANC ranging from 0-50 µeq L-1 under baseflow conditions are susceptible to episodic acidification (Mitchell 2003); and those having ANC >50 µeq L-1 remain well-buffered and relatively insensitive to acidic deposition (Larsen et al. 1994; Stevens 1994). Surface waters with pH <6.0 or having inorganic, monomeric aluminum (AlM) concentrations > 2 µmol L-1
Tissue Chemistry - Calcium and magnesium deficiencies have been linked to growth declines of sugar maple, and to an impaired capacity of this species to recover from multiple stresses such as drought and insect defoliation (Horsley et al. 2000; Houston et al. 1999). Horsely et al. (2000) reported sugar maple declines on sites with foliar Mg concentrations < 700 µg Mg g
place aquatic biota at risk (MacAvoy and Bulger 1995; Driscoll et al. 2001). Our method of aluminum analysis quantified total aluminum (including organically bound Al) rather than monomeric Al. Hence, our Al concentration values include the combination of inorganic and organic Al of which only the former would be toxic to the biota especially at pH values <5.5.
-1 tissue. Calcium deficiencies in red spruce foliage have resulted in greater susceptibility of this species to winter freezing damage (DeHayes et al. 1999), which has been linked to elevated mortality and/or growth declines of red spruce across its range in the Northeast (Craig and Friedland 1991; Shortle et al. 1997). Aluminum is known to reduce root growth rates and lead to root dysfunction, thereby contributing to declines in plant productivity and health (Shortle and Smith 1988; Cronan and Grigal 1995). Previous studies have demonstrated lower foliar tissue Ca:Al mass ratios for several hardwood and conifer species when soils were acidified

22
through N additions compared to unfertilized controls due to leaching of Ca and mobilization of Al in acidified soils (Aber et al. 1995; White et al.1999). Experimentally derived Ca:Al mass ratios vary among species, but in general, hardwood species have exhibited Ca:Al ratios in control soils ranging from 307-500, while these ratios range from 199-442 in experimentally acidified sites. Similarly, foliar Ca:Al ratios for red spruce range from 30-103 on control sites and 31-82 on acidified sites (see Table 13 for species-specific ratios). We used these empirical Ca:Al ratios as standards that would indicate potential for soil acidification in the Tug Hill study area.
Indicators of Nitrogen Enrichment Biochemical parameters useful for monitoring forest N status include: foliar N:nutrient mass ratios (N:P, N:Ca); soil C:N mass ratio; and seasonal patterns of stream water NO3
- concentrations (Stoddard 1994; Aber et al. 2003). Actual threshold levels that signal the onset of nitrogen-saturated conditions are not well established. Nevertheless, the results of several studies comparing soil and plant tissue responses to various N addition treatments provide some guidance for expected values under high N input levels. Soil Chemistry - Forest floor C:N mass ratios impose strong influences on N leaching rates
(Fenn et al. 1998). Forest floor C:N ratios (<22-25) have been correlated with increased nitrification and NO3
- leaching rates (Johnson and Linberg 1992; Fenn et al. 1998; Gundersen et al. 1998; Ollinger 2002; Aber et al. 2003). Therefore, we have quantified site C:N ratios as a potential indicator of sites susceptible to increased nitrification and NO3
- leaching rates. Surface Water Chemistry - Surface water NO3
- concentrations are one of the most sensitive indicators of the effects on atmospheric N deposition to forest ecosystems in the northeastern U.S. (Aber et al. 2003). Nitrogen loss from unsaturated forests exhibit annual cycles, with high NO3
- export during spring snowmelt in this region that reflects microbially derived NO3-
generated in the soil during the winter period when uptake by nitrogen is diminished. Nitrogen uptake by vegetation and immobilization by soil microbes during the growing season result in very low NO3
- concentrations in drainage waters during this period. Still, forests experiencing extreme N enrichment will exhibit chronically high NO3
- export throughout the year, including the growing season (Stoddard 1994; Fenn and Poth 1997). Our initial intent was to determine surface water NO3
- concentrations during spring melt and summer baseflow conditions to assess the degree to which biotic control is reestablished during the growing season in order to determine N saturation status of each watershed that was to be monitored. This approach requires obtaining surface water samples that are not influenced by denitrification process common in wetland systems (e.g., Hanson et al 1994), and assimilation and retention of N in herbaceous and woody biomass and wetland sediments (Bischoff et al. 2001). Given the extent of wetland area within the high-elevation interior of the plateau, we are not able to infer direct relationships between upland forest N-leaching rates and surface water NO3
- concentrations.

23
Tissue Chemistry - Foliar N content increases, and nutrient:N and lignin:N ratios decrease in N-
saturated forests (e.g., Ollinger et al. 2002; Aber et al 2003). As N-saturation leads to soil acidification and cation leaching, additional nutrient imbalances that cause reduced tree productivity and increased mortality can be detected through Ca:Al and Mg:N ratios (Fenn et al. 1998). We applied the same Ca:Al ratio standards to infer potential for excess N loading as we to indicate potential for acidification (above). Furthermore, we compared our observed Mg:N and lignin:N ratios against published observations across known N-deposition gradients and from N fertilization experiments (see Table 13 for species-specific ratios and references) to infer potential for excess N loading in at our study sties.
2.3.4. Watershed Characteristics Watershed hydrologic characteristics (watershed area, wetland area) were determined by creating GIS overlays of topography (7.5-minute Digital Elevation Models distributed through Cornell University Geospatial Information Repository (CUGIR) at http://cugir.mannlib.cornell.edu), surface waters (The National Hydrography Dataset, USGS Gap Analysis Program), and mapped wetlands including New York State Regulatory Wetlands (CUGIR) and US Fish and Wildlife Service National Wetland Inventory Wetlands (USFWS Division of Habitat and Resource Conservation). It should be noted that the eastern portion of the study area (east of approximately Fishing Brook) has not been mapped for the USFWS-NWI program, and digital mapping has not been completed for the southern portion of the study area (south of approximately the Salmon River Reservoir) (USFWS, 2010). Therefore, for those study sites located in the eastern and southern portions of the study area, only NYSDEC wetlands have been included for estimating wetland area within associated watersheds. 2.3.5. Forest Community Analysis A Non-metric Multidimensional Scaling (NMS) ordination was performed using PC-ORD (McCune and Mefford 1999) to elucidate potentially meaningful correlations between forest canopy community composition and soil chemistry predictor variables in our dataset. The primary matrix consisted of basal areas (m2/ha) of dominant trees (>10 dbh of species occurring on >5% of all permanent plots) on each of the permanent plots. The secondary matrix consisted of 22 environmental predictor variables including elevation, slope position, and various soil chemistry parameters. The analysis used Sorenson’s distance and was run on slow and thorough autopilot mode. Stress, instability and Monte Carlo p-values were extracted to evaluate the final ordination. Stress assesses the degree to which the ranked distances in ordination space depart from a monotonic relationship with the observed sample space. Low stress values are desirable. A widely-used rule of thumb is: stress <5 = excellent capacity for interpretation; 5-10 = good capacity; 10-20 = acceptable; >20 = high chance of incorrect interpretation; >35 = the ordination solution is no different than random. Instability is the standard deviation of stress over successive iterations of the analysis, and ideally, should be low for successful ordination solutions. The Monte Carlo p-value represents the probability that the lowest stress solution in the final ordination is lower than can be expected by chance (McCune et al. 2002).
24
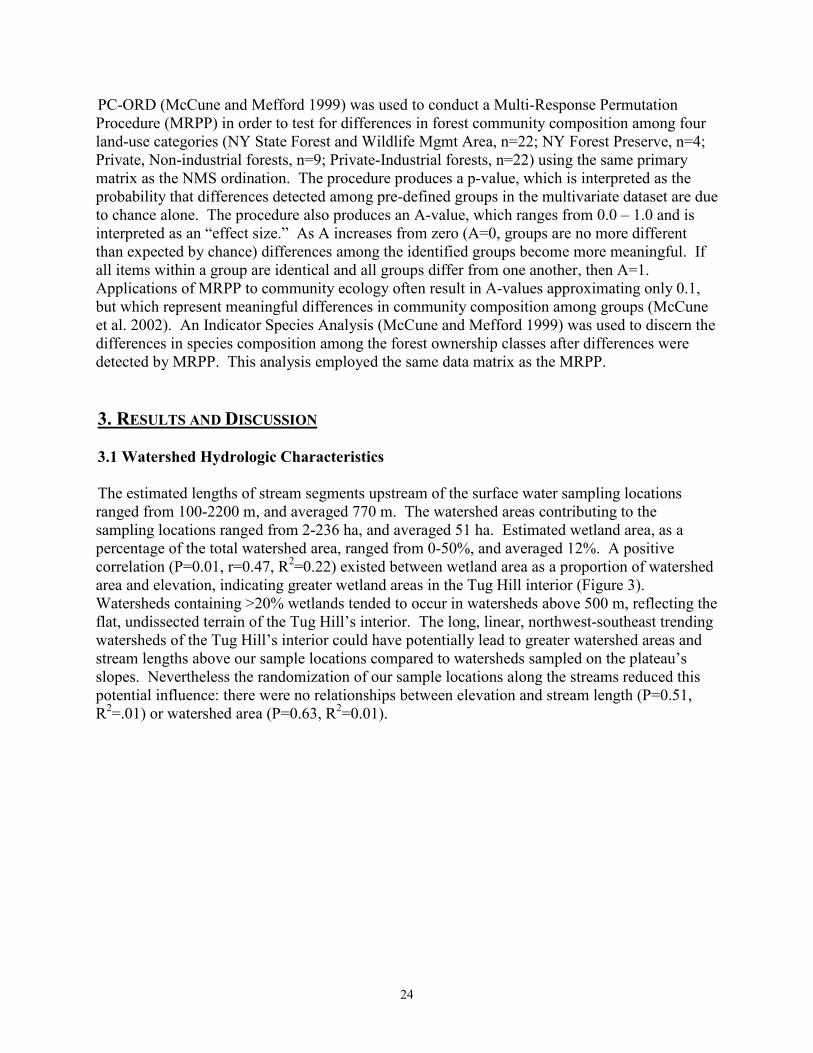
PC-ORD (McCune and Mefford 1999) was used to conduct a Multi-Response Permutation Procedure (MRPP) in order to test for differences in forest community composition among four land-use categories (NY State Forest and Wildlife Mgmt Area, n=22; NY Forest Preserve, n=4; Private, Non-industrial forests, n=9; Private-Industrial forests, n=22) using the same primary matrix as the NMS ordination. The procedure produces a p-value, which is interpreted as the probability that differences detected among pre-defined groups in the multivariate dataset are due to chance alone. The procedure also produces an A-value, which ranges from 0.0 – 1.0 and is interpreted as an “effect size.” As A increases from zero (A=0, groups are no more different than expected by chance) differences among the identified groups become more meaningful. If all items within a group are identical and all groups differ from one another, then A=1. Applications of MRPP to community ecology often result in A-values approximating only 0.1, but which represent meaningful differences in community composition among groups (McCune et al. 2002). An Indicator Species Analysis (McCune and Mefford 1999) was used to discern the differences in species composition among the forest ownership classes after differences were detected by MRPP. This analysis employed the same data matrix as the MRPP. 3. RESULTS AND DISCUSSION 3.1 Watershed Hydrologic Characteristics The estimated lengths of stream segments upstream of the surface water sampling locations ranged from 100-2200 m, and averaged 770 m. The watershed areas contributing to the sampling locations ranged from 2-236 ha, and averaged 51 ha. Estimated wetland area, as a percentage of the total watershed area, ranged from 0-50%, and averaged 12%. A positive correlation (P=0.01, r=0.47, R2=0.22) existed between wetland area as a proportion of watershed area and elevation, indicating greater wetland areas in the Tug Hill interior (Figure 3). Watersheds containing >20% wetlands tended to occur in watersheds above 500 m, reflecting the flat, undissected terrain of the Tug Hill’s interior. The long, linear, northwest-southeast trending watersheds of the Tug Hill’s interior could have potentially lead to greater watershed areas and stream lengths above our sample locations compared to watersheds sampled on the plateau’s slopes. Nevertheless the randomization of our sample locations along the streams reduced this potential influence: there were no relationships between elevation and stream length (P=0.51, R2=.01) or watershed area (P=0.63, R2=0.01).

25
0.6
0.5
dn 0.4
alte wnoit 0.3
rooporp 0.2
0.1
0.0250 350 450 550 650
elevation (m)
Figure 3. The relationship between sample site elevation and wetland area as a proportion of total watershed area upstream of sampling sites in the Tug Hill. 3.2 Forest Vegetation Description 3.2.1. Forest Structure Live canopy tree (stems ≥ 10 cm dbh) basal areas averaged 26.3 m2 ha-1 and ranged from 10.0 to 44.0 m2 ha-1 across the 57 study sites. Average live basal among the four land-use categories ranged from 21.0 – 30.7 m2 ha-1 with the NY State Forests & Wildlife Management Areas averaging approximately 50% greater live basal areas than the Private Industrial woodlands (Table 3). For reference, northern hardwood forest stands are typically managed under selection system guidelines to range between 15-20 m2 ha-1 under 10-30 year rotations to maximize overall volume growth, and between 15-25 m2 ha-1 under 10-30 year rotations to maximize sawtimber volume growth. Stands carrying ~20-25 m2 ha-1 of live basal area are typically considered fully stocked, and above this threshold annual volume growth diminishes due to inter-stem competition. Below this threshold volume, stand-level productivity diminishes since all available growing space is not occupied (Hansen and Nyland 1986; Nyland 1996). Furthermore, notably higher nitrification and nitrate leaching rates have been reported from forest canopy gaps >250-700 m2 (e.g., Bauhus and Bartsch 1996), so increasing gap area results in decreasing nitrogen retention by a forest stand. Basal areas of old-growth, northern hardwood and hardwood-conifer forests average ~35 m2 ha-1 (range: 17-64 m2 ha-1) (McGee et al. 1999; Keeton et al. 2011). The observed basal areas in the publicly and privately managed forests, as well as the unmanaged Satellite Forest Preserves fall within the expected ranges for northern hardwood forest types.

26
We did not acquire the field data to compare and contrast forest structure between the managed forests and the Satellite Forest Preserves, in order to confirm our treatment of the Forest Preserve stands as late-successional/old-growth forests. Still, based on inspection of live canopy tree diameter distributions (Table 4), the four NY State Satellite Forest Preserves approached diameter distributions typical of northern hardwood late-successional/old-growth forests, which carry an average of ~50 live trees/ha greater than 50 cm dbh in the Adirondack Preserve, and range from 16-73 trees/ha >50 dm dbh across the Northeast (McGee et al. 1999). Table 3. Live canopy tree (>10.0 cm dbh) basal areas in different forest ownership categories. Differences in average basal areas are statistically significant (a=0.05, Tukey’s HSD) between ownership categories with different superscripts.
Live basal area (m2
Percent of overstocked and
/ha)
understocked stands No.
Ownership Average
Stands
±1 SE < 15
range
m2>25
m/ha 2
NY State Forests & Wildlife Mgmt Areas /ha
22 30.7 ± 1.2 15-44 A 0 95 NY State Satellite Forest Preserves 4 30.0 ± 2.4 24-35 AB 0 75 Private Non-industrial 9 26.7 ± 2.9 15-39 AB 0 44 Private Industrial 22 21.0 ± 1.3 10-35 B 14 32 Table 4. Live canopy tree (>10 cm dbh) diameter distributions in four forest ownership categories on the Tug Hill.
--No. trees/ha within diameter interval (cm)-- 10.0- 20.0-
19.9 30.0-
29.9 40.0-
39.9 49.9 NY State Forests & Wildlife Mgmt Areas
>49.9 230 178 82 38 13
NY State Satellite Forest Preserves 200 118 70 43 30 Private Non-industrial 272 186 79 21 6 Private Industrial 291 176 54 15 3 3.2.2 Forest Composition Dominant species (those occurring on >5% of study sites) at our study sites included red maple (averaging 30% of total basal area across the region), sugar maple (22%), black cherry (15%), yellow birch (11%), American beech (8%), white ash (4%), eastern hemlock (3%), balsam fir (3%) and red spruce (2%). Several other species comprised the remaining 2% of total basal area. (Table 5). Community composition of canopy-dominant trees did not differ between upper and lower topographic slope positions (Blocked MRPP A=0.005, p=0.14), reflecting the lack of local topographic relief across the region and plot placement at lower slopes. It should be noted that the vegetation plots at the lower slope positions were placed at the base of the local slope but outside the influence of forested riparian zones that were present along the filled valley bottoms associated with many of the streams.

27
Forest community composition differed based upon ownership category (MRPP A=0.04, p<0.001). A series of pair-wise MRPP analyses discerned the Private Industrial Woodlands from all other stand types (IND v. SFW, A=0.03, P<0.001; IND v. FP, A=0.03, P=0.01; IND v. NI, A=0.03, P<0.01). Additionally, the Forest Preserves differed compositionally from the Private Non-Industrial woodlands (A=0.04, P=0.04). Although the analyses detected significant compositional differences, the effect sizes (A-values) were consistently low among all comparisons, owing to the overall similarity in the upland northern hardwood forest types among all study sites. Even still, the Indicator Species Analysis revealed that the State Forest Preserves were characterized by greater basal areas of sugar maple, American beech and eastern hemlock, while the Private Non-Industrial woodlands were characterized by greater basal areas of black cherry (Table 6). Although other species attained their greatest indicator values in some of the other stand types, these were not significant. Table 5. Average basal areas of tree (>10.0 cm dbh) species at 57 Tug Hill forest sites. Average basal area Species (m2
Acer rubrum (red maple) /ha)
7.3 Acer saccharum (sugar maple) 5.8 Prunus serotina (black cherry) 4.2 Betula alleghaniensis (yellow birch) 2.5 Fagus grandifolia (American beech) 2.3 Tsuga canadensis (eastern hemlock) 1.2 Fraxinus americana (white ash) 1.0 Abies balsamea (balsam fir) 0.8 Picea rubens (red spruce) 0.7 Others* 0.5 Other species include: Acer pensylvanicum (striped maple), Amelanchier aborea (serviceberry), Betula papyrifera (white birch), Carpinus caroliniana (American hornbeam), Juglans cinerea (butternut), Ostrya virginiana (eastern hophornbeam), Picea abies (Norway spruce), Picea glauca (white spruce), Pinus resinosa (red pine), Pinus strobus (eastern white pine), Populus grandidentata (bigtooth aspen), Populus tremuloides (quaking aspen), Pyrus malus (apple), Sorbus americana (American mountain-ash), Tilia americana (basswood), Ulmus americana (American elm).

28
Table 6. Results of indicator species analysis of dominant live canopy tree (>10.0 cm dbh) basal areas for four different forest ownership classes. The Monte Carlo test of significance of observed maximum indicator values for species is based upon 1000 permutations with a random number seed.
Max
Tree Species
Group
Observed Indicator
1
Average ±1 SD Indicator Value from
Value (IV)
P randomized groups
Abies balsamea SFW 6.0 10.1 ± 5.1 0.86 Acer rubrum IND 25.8 27.3 ± 3.9 0.60 Acer saccharum FP 40.4 25.7 ± 4.9 0.02 Betula alleghaniensis IND 26.4 25.7 ± 4.3 0.35 Fagus grandifolia FP 41.3 25.3 ± 5.5 0.02 Fraxinus americana SFW 19.6 11.5 ± 4.6 0.06 Picea rubens IND 10.9 15.5 ± 5.7 0.81 Prunus pensylvanicum NI 6.1 7.5 ± 4.4 0.55 Prunus serotina NI 41.6 22.8 ± 5.2 <0.01 Tsuga canadensis FP 23.8 11.8 ± 5.3 0.04 1 The ownership class in which a species attained its highest IV. SFW=New York State Forest or State Wildlife Management Area; FP=New York State Forest Preserve; NI=small non-industrial woodland; IND=industrial woodland. 2
Nitrogen cycling processes (mineralization, nitrification, assimilation) within forests, and retention by forests are influenced, in part, by tree species composition (Mitchell, 2011). For instance sugar maple frequently dominates more base-rich sites that often display high nitrification rates, soil nitrate concentrations, and nitrate leaching rates (e.g., Lovett and Mitchell 2004; McGee et al. 2007a; Page and Mitchell 2008). Still, it remains unclear whether high nitrification rates on stands dominated by sugar maple are due to factors associated with sugar maple litter quality or rather to the base-rich soil conditions on which sugar maple tends to occur, and which may support higher nitrification rates. As a secondary objective, we are interested in knowing if relationships between sugar maple dominance, nitrate availability, and site conditions that have been noted elsewhere exist within the Tug Hill region.
P=the proportion of randomized trials with indicator values equal to or exceeding the observed indicator value.
These structural and compositional differences among the Tug Hill forest types are illustrated and summarized in the NMS ordination diagram (Figure 4). This ordination separated the public and private woodlands based on basal area, with greater basal areas tending to occur in the public woodlands (upper left half of the ordination display, Figure 4), which is consistent with the basal area differences summarized in Table 3. The Private Industrial woodlands tended to cluster to the right and lower sides of the diagram, while the publicly-managed woodlands were ordered widely across the display. Although elevation exhibited no correlation with the NMS ordination space, the ownership categories are, to some extent, separated across an elevation gradient (Table 7). On average the Private Industrial woodlands included in this study occurred at the highest elevations (averaging 548 m), approximately 85-123 m higher than the average

29
elevations of the other three ownership categories. Although this range of elevation change probably has no meaningful orographic influences on growing season, precipitation or soil conditions, it does reflect the location of the industrial woodlands within the higher, undissected, poorly drained interior of the plateau. The forest community composition differences among the interior industrial forests, and the Private Non-industrial and public forests that ring the interior could, therefore, be due to differences in site conditions rather than selective removal of certain tree species based upon owner landowner objectives. Table 7. Average study site elevations (m) by ownership category. Differences in average elevation are statistically significant (a=0.05, Tukey’s HSD) between ownership categories with different superscripts.
Mean
Ownership Category
(1 SE)
N Range Private Industrial 548 (8) 441-595 A 22 NY State Forests & Wildlife Mgmt Areas 463 (22) 276-604 B 22 Private Non-industrial 458 (23) 365-549 B 9 NY State Satellite Forest Preserves 425 (20) 395-483 B 4

30
1.5
1
0.5
S 3
M 0
N
-0.5
-1
-1.5-1.5 -1 -0.5 0 0.5 1
NMS 1
NY State Forest & Wildlife Mgt. NY Forest Preserve Private - Industrial Private - Non-industrial
picrubabibal
tsucan acerub
fraame betall pruserfaggraacesac
prupen
basal area org C:N
org %C
min NO 3org NO 3
ub
er a
c57
0. ub
;rc
pi39
0
.;
aces
ac33
0.-=
NM
S2
r
r NMS1 = -0.83 acesac; -0.39 fraame; 0.33 pruser; 0.78 acerub
Figure 4. NMS ordination of forest canopy composition (basal area of trees>10 cm dbh for species occurring on >5% of plots) of 114 subplots at 57 sites on the Tug Hill. Each vegetation plot is represented by an icon. Icons are identified by land ownership category. This ordination represents a three-dimensional solution from 247 iterations with final stress= 13.1 and instability=0.00001. The first three ordination axes accounted for 35%, 33% and 19%, respectively, of the variation in community composition. Centroids of dominant tree species distributions in ordination space are presented as six-letter abbreviations of genus-species. Vectors indicate the direction and magnitude of correlations (all r-values are < 0.20) between environmental predictor variables and the ordination space. Pierson correlation coefficients are presented along each of the NMS axes to summarize the relationships between tree species basal areas on each plot and the ordering of the plots along the first and third axes.

31
Sugar maple and white ash exhibited increasing basal areas toward the left side of the ordination diagram, while red maple, black cherry and red spruce exhibited increasing basal areas toward the right side and upper right corner of the display. Correlation analyses between the ordination coordinates and environmental predictor variables suggest positive but weak (r2<0.10 for all) relationships between white ash and sugar maple basal areas and extractable soil NO -
3 concentrations and/or negative relationships with organic soil C:N ratios. Likewise, the analysis suggests positive relationships between red maple, red spruce and black cherry basal areas and organic soil C:N ratios and/or negative relationships between these species and extractable soil NO -
3 concentrations (Figure 4). Results of this NMS ordination do not suggest that forest community composition was related to soil pH, cation exchange capacity, soil base saturation, or elevation. Although elevation did not emerge as an important predictor variable in the NMS ordination, we chose to investigate the relationship between elevation and basal area of dominant tree species due to the demonstrated differences in composition among the ownership types, and the knowledge that the different forest ownerships partition along an elevation gradient on the Tug Hill Plateau. Only sugar maple and eastern hemlock basal area displayed relationships with elevation. Sugar maple was negatively and weakly related to elevation (r=-0.28, R2=0.08, P=0.003) while eastern hemlock had a somewhat stronger negative relationship (r=-0.39, R2=0.15, P<0.0001). The presence of no other dominant tree species was related to elevation across the study area (respective R2 values: balsam fir, 0.03; red maple, 0.01; yellow birch, 0.001, American beech, 0.01; white ash, 0.01; red spruce, 0.001; black cherry, <.001). As a result of the suggested relationships between forest community composition, elevation, and extractable soil nitrate and soil C:N, we conducted a series of correlation/regression analyses to further elucidate existing correlations (Tables 8 and 9).
- There were no apparent correlations between extractable NO -3 , NH +
4 , organic C:N, %BS and elevation. Soil Organic N and Total N content were greater at lower elevation sites. Mineral soil pH was positively correlated with elevation across the study sites.
- Sugar maple basal area was positively correlated with extractable NO -3 in mineral soils, and
weakly correlated (P=0.08) with extractable NO -3 in organic soils. Although sugar maple
basal area exhibited a negative correlation with elevation, extractable soil NO -3 was
independent of elevation, suggesting that “sugar maple sites” occur with equal probability in the Tug Hill interior and surrounding lower elevations, but these sites were not dominated by sugar maple at high elevations. There may remain other unmeasured site factors that limit the distribution of sugar maple in the region, or cultural factors such as selective harvesting may have reduced sugar maple at upper elevations.
- White ash was strongly and negatively correlated with organic soil C:N ratio, suggesting that it, too, occurs on relatively high-N sites, but it showed no correlation with other N fractions.
- Red maple and red spruce were both strongly and positively correlated with organic soil C:N, suggesting that they become dominant on lower-N sites. Furthermore, red maple exhibited a negative correlation with mineral soil NO -
3 content. - As with sugar maple, American beech basal areas exhibited a positive correlation with
mineral NO -3 content along with a weak correlation with organic NO -
3 content. This is somewhat contrary to previous studies that suggest American beech dominates on sites having low nitrification rates (e.g., McGee et al. 2007a).

Table 8. Summary of correlations between organic and mineral soil chemistry
parameters and elevation on the Tug Hill. Values for each analyte were averaged across topographic positions at each site prior to analysis. Results of correlation and linear regression analyses are summarized with r, R2 and P-values.
----------Organic Soils---------- -------Upper Mineral Soils-------
R2 R2Analyte r P Analyte r P pH -.21 .05 .11 pH .15 .17 .02
+ +NH4 -.05 .003 .71 NH4 .007 .04 .28 - -NO3 -.02 <.00 .89 NO3 .08 .04 .31
1 Organic N -.35 .12 <.01 Organic N -.09 .25 <.01
Total N -.28 .08 <.001 Total N -.07 .21 <.01 C:N .13 .02 .33 CEC .13 .03 .38
%BS -.04 .06 .17
32
Table 9. Summary of correlations between organic and mineral soil chemistry parameters and basal areas of dominant tree species on the Tug Hill. The analytes investigated here are those that were suggested by the NMS ordination to be important predictors of forest community composition, or are otherwise known to be predictors of community composition (%BS). Values for each analyte and basal areas of tree species were averaged across topographic positions at each site prior to analysis. Results of correlation and linear regression analyses are summarized with r, R2 and P-values.
Species
Organic C:N
Organic
-NO3 Mineral
-NO3 Mineral
%BS
r -.13 .24 .31 .12 sugar maple R2 .02 .06 .09 .02
P .34 .08 .02 .36
r -.48 .02 -.007 -.14 white ash R2 .23 <.001 .0001 .02
P <.001 .89 .95 .31
r .47 -.24 -.28 -.02 red maple R2 .23 .06 .08 <.001
P <.001 .08 .03 .87
r .33 -.20 -.19 .03 red spruce R2 .11 .04 .04 <.001
P .01 .15 .16 .82
r .05 .25 .32 -.02 American beech R2 .003 .06 .11 <.001
P .68 .06 .02 .89

33
3.3 Soil Chemistry Soil pH and Buffering - The soil pH of the organic and upper mineral soils averaged (± 1 SE) 3.8 ± 0.03 and 3.8 ± 0.05, respectively, across the 57 study sites (Table 10). The pH of both organic and mineral horizons were slightly, but significantly higher at lower slope positions than at paired upper slope positions (Table 11). Mineral soil pH exhibited a positive correlation with elevation across the study area (Table 8). Upper mineral horizon cation exchange capacities averaged 30.4 ± 1.9 meq/100 g soil (range: 12-88), but did not differ between upper and lower slope positions. Upper mineral soil base saturation averaged 11.4 ± 0.9 percent (range: 3-38%) across 56 study sites (average of the averages of upper and lower slope positions at each of 56 sites). Base saturation was approximately 2-fold higher at lower slope positions (16.1%) than at upper slope positions (8.5%) (Table 11). Of the 96 individual soil samples collected over the two year study at the 57sites, 14% exhibited base saturation >20%, 34% exhibited BS 10-20%, 26% exhibited BS 5-10% and 26% of samples exhibited BS <5%. A recent study in conifer and hardwood forests of the Adirondacks (Sullivan et al. 2006a) reported mineral soil BS to range from 3-30% with 90% of soils having BS <12% across that region, indicating substantial risk of continued environmental degradation from acidic deposition. The forest soils we sampled across the Tug Hill are better buffered than the Adirondack soils, but still, 52% of the Tug Hill soil samples had BS <10%, indicating reduced base cation availability and potential risk for future acidification (Cosby et al. 2006). Soil Nitrogen Forest floor C:N mass ratios averaged (± 1 SE) 18.0 ± 0.2 across the 57 study sites (Table 10), but did not differ between upper and lower slope positions (P=0.65). When soils were averaged across topographic positions at each site, all 57 sites exhibited C:N ratios below 22, the ratio below which observational and experimental studies have demonstrated the onset of elevated nitrification rates (e.g., Fenn et al. 1998; Aber et al. 2003). This average Tug Hill C:N ratio (18) is lower than those recently reported from Adirondack forests (Figure 5). Page and Mitchell (2008) reported C:N ratios of 22.2 ± 0.8 (range:19.8-29.3) at 11 sites spanning a soil calcium gradient, and Sullivan et al. (2006b) reported C:N ratios of 23.9 ± 0.8 at 87 sites representing hardwood and mixed hardwood forest types on varying soils types. Total nitrogen averaged 2.3 ± 0.04 percent and 0.7 ± 0.06 percent in the forest floor and mineral soils, respectively. This average for Tug Hill forest floors is approximately 15-25% higher than values reported by Page and Mitchell (2008, 1.99 ± 0.08) and Sullivan et al. (2006b, 1.88 ± 0.07). Extractable NO3
- content of the organic and mineral soil horizons averaged 0.37 ± 0.06 and 0.16 ± 0.02 µmol/g, respectively. These observed extractable NO3
- contents of the forest floors and upper mineral horizons of Tug Hill soils are both ~6-fold higher than those reported by Page and Mitchell (2008) at 11 Adirondack sites (Figure 6). Higher soil N concentrations and lower C:N values are often correlated with extractable NO3
- and eventual NO3- leaching. In this study NO3
- concentration was independent of organic C:N ratios (r=-.08, R2=.006, P=.41) across these sites.

34
Table 10. Summary of soil chemistry variables for organic and upper mineral soil horizons across the Tug Hill study sites.
-------------------------Organic Horizon-------------------------
Analyte
Mean (SE)
N Range
pH 3.8 (0.03) 3.6-4.3 57 Extractable NH4
+ 6.65 (0.39) (µmol/g) 1.6-14.2 57 Extractable NO3
- 0.37 (0.06) (µmol/g) 0-1.75 57 Organic N (µmol/g) 13.6 (0.4) 7.4-20.3 57 Total N (µmol/g) 20.6 (0.6) 10.1-32.2 57 Total N (%) 2.3 (0.04) 0.7-3.0 57 C:N 18.0 (0.2) 13.4-21.8 57
-------------------------Upper Mineral Soil------------------------- Analyte
Mean (SE)
N Range
pH 3.8 (0.05) 3.1-4.7 57 Extractable NH4
+ 0.46 (0.05) (µmol/g) 0.05-2.1 57 Extractable NO3
- 0.16 (0.02) (µmol/g) 0.0-0.75 57 Organic N (µmol/g) 3.6 (0.2) 1.4-8.6 57 Total N (µmol/g) 4.2 (0.2) 1.9-10.7 57 Total N (%) 0.70 (0.06) 0.2-2.2 57 Cation Exchange Capacity (meq/100g) 30.4 (1.9) 11.8-87.8 56 Base Saturation (%) 11.4 (0.9) 2.6-38.3 56

35
Table 11. Summary of soil chemistry variables for organic and mineral soil horizons at upper and lower topographic slope positions across the Tug Hill study sites. P-values are reported for tests of respective analyte means between upper and lower slope positions (observations were blocked by site).
-------------------------Organic Horizon-------------------------
Analyte
Topo. position
Mean (1 SE)
N Range
P
pH Upper 3.8 (0.03) 3.4 - 4.4 57 <.001 Lower 3.9 (0.04) 3.4 - 4.7 56
Extractable NH4+ (µmol g-1 Upper ) 6.8 (0.5) 1.1 - 23.5 57 .13 Lower 6.5 (0.5) 0.9 - 21.5 56
Extractable NO3-
(µmol g-1Upper
) 0.4 (0.1) 0.0 - 2.8 57 .33 Lower 0.3 (0.1) 0.0 - 2.7 56
Organic N (µmol g-1 Upper ) 13.5 (0.4) 8.0 - 20.4 57 .58 Lower 13.8 (0.6) 5.3 - 24.6 56
Total N (µmol g-1 Upper ) 20.7 (0.7) 9.3 - 40.5 57 .94 Lower 20.6 (0.8) 6.2 - 32.7 56
C:N Upper 18.1 (0.2) 13.4 - 21.2 57 .65 Lower 17.9 (0.2) 14.5 - 25.2 56
-------------------------Upper Mineral Soil------------------------- Analyte
Topo. position
Mean (1
SE)
N Range
P
pH Upper 3.8 (0.05) 3.1 - 4.5 55 .05 Lower 3.9 (0.1) 3.0 - 5.3 53
Extractable NH4+ (µmol g-1 Upper ) 0.4 (0.1) 0.0 - 2.3 57 .02 Lower 0.6 (0.1) 0.1 - 3.1 55
Extractable NO3-
(µmol g-1Upper
) 0.15 (0.03) 0.0 - 1.3 57 .39 Lower 0.18 (0.03) 0.0 - 1.3 55
Organic N (µmol g-1 Upper ) 3.4 (0.2) 1.5 - 9.0 57 .25 Lower 3.8 (0.3) 1.1 - 11.2 55
Total N (µmol g-1 Upper ) 4.0 (0.3) 1.7 - 10.4 57 .12 Lower 4.5 (0.3) 1.6 - 12.5 55 Cation Exchange Capacity (mmol 100g-1
Upper )
25.1 (2.9) 7.0 -138.0 47 .84 Lower 26.0 (3.0) 7.0 -151.0 49
Base Saturation (%) Upper 8.5 (0.8) 2.0 - 23.0 47 <.001 Lower 16.1 (1.8) 3.0 – 62.0 49

36
Sullivan ORGCNP&MorgCNorgCN
30
25
20
15
C:N
Figure 5. Comparison of forest floor C:N from this study (n=57), eleven Adirondack sites spanning a range of soil calcium content (Page and Mitchell 2008), and 86 hardwood/mixed hardwood stands on ten different soils types in the Adirondacks (Sullivan et al. 2006). Data are median values, boxes representing the interquartile ranges of values, whiskers extending to the last observation within 1.5x the value of the interquartile range, and outlying observations above or below 1.5x the value of the interquartile range.
Tug Hill Adirondacks Adirondacks Page & Mitchell Sullivan et al.

orgNO3 P&M orgNO3 minNO3 P&MminNO3
1.8
1.6
1.4
1.2
1.0
0.8
0.6
0.4
0.2
0.0
)lios g/lom
(u- 3O
N elbatcratxe
Tug Hill Adirondack Tug Hill Adirondack ---------forest floor---------- ----------mineral soil---------
Figure 6. Comparison of extractable NO -3 content in forest floor and upper mineral soil horizons
from this study (n=57) and eleven Adirondack sites spanning a range of soil calcium content (Page and Mitchell 2008). Data are median values, boxes representing the interquartile ranges of values, whiskers extending to the last observation within 1.5x the value of the interquartile range, and outlying observations above or below 1.5x the value of the interquartile range.
)lois
/gol
mµ( - 3N
Oel
abtacrt
ex
37

38
3.4 Foliar Tissue Chemistry Table 12 summarizes the elemental composition of canopy-dominant tree foliage for nine species sampled during this survey. Tables 13 summarizes foliage chemistry for those nine tree species and compares nutrient concentration and ratio indices with other published studies from the Northeast including studies in which forests were experimentally dosed with sufficient nitrogen to induce nitrification and soil acidification. Foliar Mg Concentrations - Magnesium concentrations of sugar maple foliage have been used to detect stands at risk of decline due to leaching of base cations by acid precipitation. Horsely et al. (2000) reported sugar maple stands having foliar Mg concentrations <0.7 mg g-1 dry wt were susceptible to decline imposed by added stress agents such as drought and defoliation. Magnesium concentrations in sugar maple foliage collected during our surveys averaged (± 1 SE) 1.21 ± .09 and 1.20 ± .07 mg g-1 dry wt. in 2005 and 2006 (Table 12). These values are consistent with those of Horsely et al. (2000), who reported average (± 1 SE) foliar Mg concentrations of 1.25 ± .06 from 16 sugar maple stands on glaciated soils on the Allegheny Plateau. None of the glaciated stands reported on by Horsely et al. (2000) exhibited foliar Mg concentrations for sugar maple <0.7 mg g-1 dry wt. In our study, in 2005 and 2006, 10% and 11% of sugar maple samples exhibited Mg concentrations <0.7 mg g-1
Foliar N Concentration - The average N concentration of conifer (red spruce, balsam fir and eastern hemlock) foliage ranged from 1.2-1.9% over the two sampling periods. Average N concentrations of deciduous hardwood species ranged from 2.2-3.2%. For all tree species that
dry wt. Foliar Ca:Al Ratios – The 2005 and 2006 foliar Ca:Al ratios are reported in Table 13 for the dominant tree species on the Tug Hill. Over the duration of this study, average Ca:Al ratios ranged from 19-40 for conifers and 53-381 for hardwoods. Eastern hemlock consistently had the lowest Ca:Al ratios among conifers (19-32) and American beech the lowest among hardwoods (53-184). There was substantial annual variation in Ca:Al ratios between the 2005 and 2006 samples that was not observed in other foliar indicators. This variation was due to 2- to 3-fold greater foliar Al concentrations in 2006 versus 2005 (Table 12). Table 13 also includes the foliar Ca:Al ratios reported in the literature for red spruce, American beech, red maple and sugar maple. The values reported from the literature are taken from observational studies in northeastern forests as well as from experimental studies in which forest plots were dosed with sufficiently high levels of N to induce nitrification and soil acidification. The foliar Ca:Al ratios of all species sampled on the Tug Hill for which comparative data are available were below those reported in other observational studies of northeastern forests or on control plots in experimental dosing studies. Furthermore, the Tug Hill foliar tissue Ca:Al ratios were at or below the values induced in other northeastern forests through N-dosing experiments. The lower Ca:Al ratios in this study generally reflect higher foliar Al concentrations rather than Ca concentrations in the Tug Hill samples versus published values. For instance, in 2006, the Tug Hill foliar Ca concentrations for American beech, sugar maple, red maple and red spruce were within 5-33% of those published by White et al. (1999) for sites receiving high levels of N additions, however, Al concentrations for Tug Hill foliage ranged from 96-474% higher than those of White et al. (1999).

39
were sampled in our study and for which comparisons are available in the literature, foliar N concentrations from the Tug Hill region were consistently greater than those reported in other observational studies in the Northeast. Furthermore, the observed foliar N concentrations were greater than those reported from experimental plots receiving high levels of N fertilization in other northeastern forests (Table 13). Foliar Mg:N – Over the two years of the study, average foliar Mg:N ratios ranged from 0.04-0.08 for conifers and 0.04-0.11 for hardwoods. Black cherry and white ash consistently had the highest foliar Mg:N ratios. With the exception of sugar maple, the Tug Hill foliar Mg:N ratios were lower than those reported in other observational studies and control plots in the Northeast. Furthermore, Mg:N ratios from Tug Hill foliage were similar to or less than those from foliage sampled from plots receiving experimental N fertilization in other northeastern forests (Table 13). The lower Mg:N ratios on the Tug Hill (e.g., for 2006) reflect lower Mg concentrations in American beech (30% lower) and red maple (17% lower) foliage compared to values reported by White et al. (1999). Still, red spruce foliar Mg concentrations were only 6% lower than those reported by White et al. (1999) while N concentrations were 161% higher in Tug Hill red spruce. Foliar lignin:N – The average lignin:N ratios of conifer (red spruce, balsam fir and eastern hemlock) foliage ranged from 6.4-16.2 over the two sampling periods, with hemlock consistenly having the lowest (6.4-7.1) and red spruce the highest (11.9-16.2) values. Average lignin:N ratios of deciduous hardwood species ranged from 3.2-10.2, with black cherry having the lowest (3.2-3.9) and American beech the highest (8.8-10.2) values. For all tree species that were sampled in this study, and for which comparisons are available in the literature, foliar lignin:N ratios from the Tug Hill region were consistently lower than those reported in other observational studies in the Northeast (Table 13).

40
Table 12. Live, mid-summer (2005 and 2006) foliar chemistry (mean ± 1 SE) of dominant tree species in Tug Hill upland forests. Units are mg g dry wt-1
except for N, C and lignin (%).
red spruce
balsam fir
eastern hemlock
American beech
red maple
sugar maple
yellow birch
black cherry
white ash
2005 Sample size± Ca ± K ± P ± Mg± Na ± Al N (%)± C (%)± Lignin (%)± 2006 Sample size Ca K P ± Mg± Na± Al N (%) C (%) Lignin (%)
1
2.36± 4.38± 0.67± 0.57± 0.20± 0.06± 1.20± 53.1± 19.3±
4
3.31 ± 0.61 4.83 ± 0.45 0.73 ± 0.04 0.68 ± 0.08 0.66 ± 0.03 0.11 ± 0.01 1.88 ± 0.32 50.9 ± 0.8 20.2 ± 2.4
4
7.34 ± 1.89 3.32 ± 0.23 0.90 ± 0.06 0.84 ± 0.16 0.27 ± 0.01 0.21 ± 0.38 1.47 ± 0.10 54.4 ± 1.0 19.3 ± 0.6
8
7.03 ± 0.95 5.56 ± 0.75 1.22 ± 0.08 1.11 ± 0.04 0.91 ± 0.05 0.29 ± 0.02 1.76 ± 0.15 54.3 ± 1.5 19.9 ± 0.9
3
5.15 ± 0.63 5.49 ± 0.92 1.21 ± 0.19 1.10 ± 0.13 0.39 ± 0.17 0.22 ± 0.08 1.67 ± 0.01 52.1 ± 0.4 11.8 ± 0.5
3
4.99 ± 1.30 5.28 ± 0.52 1.24 ± 0.27 1.47 ± 0.21 0.70 ± 0.07 0.27 ± 0.05 1.86 ± 0.11 52.0 ± 0.1 11.8 ± 0.4
10
5.97 ± 0.70 5.91 ± 0.19 1.30 ± 0.07 1.52 ± 0.23 0.29 ± 0.02 0.03 ± 0.01 2.58 ± 0.08 50.4 ± 0.2 22.4 ± 0.8
28 4.88 ± 0.32 6.11 ± 0.40 1.20 ± 0.08 1.13 ± 0.07 0.68 ± 0.03 0.09 ± 0.01 2.58 ± 0.06 50.3 ± 0.3 25.8 ± 1.0
32
5.47 ± 0.24 6.55 ± 0.38 1.26 ± 0.05 1.18 ± 0.07 0.28 ± 0.02 0.03 ± 0.01 2.21 ± 0.04 51.2 ± 0.1 14.9 ± 0.5
69 6.03 ± 0.25 6.18 ± 0.21 1.19 ± 0.03 1.28 ± 0.05 0.69 ± 0.02 0.08 ± 0.01 2.43 ± 0.03 50.8 ± 0.2 13.2 ± 0.4
30
7.39 ± 0.70 6.07 ± 0.40 1.27 ± 0.08 1.21 ± 0.09 0.20 ± 0.05 0.03 ± 0.01 2.20 ± 0.05 50.3 ± 0.2 13.5 ± 0.5
47 6.47 ± 0.40 6.63 ± 0.35 1.33 ± 0.07 1.20 ± 0.07 0.69 ± 0.02 0.09 ± 0.01 2.36 ± 0.05 49.3 ± 0.2 10.5 ± 0.2
10
7.44 ± 1.11 8.12 ± 0.74 1.46 ± 0.11 2.21 ± 0.27 0.28 ± 0.04 0.03 ± 0.01 2.96 ± 0.07 50.3 ± 0.3 16.3 ± 1.0
33 7.39 ± 0.48 6.49 ± 0.43 1.27 ± 0.08 2.15 ± 0.15 0.67 ± 0.03 0.09 ± 0.01 2.88 ± 0.07 50.2 ± 0.2 20.1 ± 0.4
18
8.10 ± 1.00 9.37 ± 0.82 1.56 ± 0.08 3.12 ± 0.30 0.26 ± 0.03 0.04 ± 0.01 3.03 ± 0.09 51.0 ± 0.4 9.6 ± 0.5
18 6.78 ± 0.88 10.01 ± 0.61 1.17 ± 0.11 2.87 ± 0.23 0.71 ± 0.03 0.09 ± 0.01 3.17 ± 0.12 50.1 ± 0.4 12.3 ± 0.8
7
10.50 ± 1.68 8.95 ± 1.18 1.36 ± 0.11 2.93 ± 0.49 0.21 ± 0.04 0.04 ± 0.01 2.68 ± 0.09 48.4 ± 0.2 15.0 ± 0.9
10 11.05 ± 1.91 10.70 ± 1.05 1.69 ± 0.15 3.26 ± 0.50 0.69 ± 0.04 0.08 ± 0.01 2.90 ± 0.21
45.7 ± 2.4 20.2 ± 1.0

41
Table 13. Foliar chemistry of dominant tree species in Tug Hill upland forests and comparisons with reported literature. Values are means and ranges for 2005 and 2006 from this study; observed values from surveys of untreated sites in northeastern US, including control plots for experimental N-addition studies; and values from N-addition experiments (highest N treatments) in northeastern US. The number of samples used for determinations in this study are provided for both years (n=2005, 2006). red
spruce balsam
fir n=1, 4
eastern hemlock
n=4, 8
American beech
n=3, 3
red maple
n=10, 28
sugar maple
n=32, 62
yellow birch
n=30, 45
black cherry
n=10, 28
white ash
n=20, 18 N% 2005 2006 Obs/Ctls N treatments Ca:Al 2005 2006 Obs/Ctls N treatments Mg:N 2005 2006 Obs/Ctls N treatments Lignin:N 2005 2006 Obs/Ctls N treatments C:N 2005 2006 Obs/Ctls N treatments
n=7, 10
1.2 1.9 (1.2-2.4)
0.82; 0.83; 1.07 0.9-1.18; 1.2-1.512
1.12; 1.13; 1.17
38 30 (23-42)
1034; 783; 309 824; 313; 329
.05 .04 (.03-.06)
.074; .133;.087; .069
.044; .083;.067; .069
16.2 11.9 (7.7-18.3) 26.24; 21-288;
16.8-20.5
1.5 (1.3-1.7) 1.8 (1.2-2.6 )
40 (9-53) 26 (8-45)
.06 (.02-.08)
.07 (.04-.09)
13.3 (12.1-15.3) 11.8 ( 8.8-17.7)
38 (31-43) 32 (19-47)
12 ---
44 30 (20-45)
--- ---
1.7 (1.7-1.7) 1.9 (1.7-2.0) 1.011; 1.212
32 (13-60) 19 (12-29)
.07 (.05-.08)
.08 (.06-.10)
7.1 (6.6-7.5) 6.4 (6.0-6.9) 16.511; 13.1
2.6 (2.0-3.1) 2.6 (2.0-3.4)
2.0
12
31 (31-32) 28 (26-31)
6; 2.27; 2.111
2.412
2.26; 2.47
184 (104-267) 53 (30-108) 3071; 3279 1991; 2549
.06 (.03-.16)
.04 (.02-.09) .081; .087 .071; .047
8.8 (6.2-11.0) 10.2 (5.7-14.4)
13.411; 9.8
2.2 (1.8-2.7) 2.4 (1.6-3.7)
1.6
12
20 (16-24) 20 (14-23)
5; 1.711
2.05
208 (47-348) 74 (32-162)
5539 4429
.05 (.03-.10)
.05 (.02-.09) .079 .079
6.8 (3.8-9.5) 5.4 (2.3-10.0)
11.3
2.2 (1.7-2.9) 2.4 (1.7-3.3) 2.2
11
23 (19-28) 21 (14-31)
7; 1.711 1.2-2.08; 2.1-2.412
2.47
255 (55-1081) 76 (13-200)
5009 2489
.06 (.02-.11)
.05 (.01-.10) .047 .037
6.2 (2.9-9.4) 4.6 (1.5-7.2)
10-138; 8.1-8.7
3.0 (2.6-3.3) 2.9 (2.3-3.6) 2.0
12
23 (17-30) 21 (15-31)
6; 2.311
2.5-2.610 2.16
281 (95-660) 81 (25-150)
.07 (.03-.13)
.08 (.02-.14)
5.5 (4.2-7.0) 7.2 (3.5-10.8)
10.7
3.0 (2.3-3.7) 3.2 (2.5-4.6)
302 (20-759) 79 (23-206)
.11 (.05-.28)
.09 (.04-.16)
3.2 (2.1-4.5) 3.9 (2.0-5.8)
17 (14-21) 16 (11-20)
11
17 (15-20) 18 (14-22)
2.6 (2.0-3.1) 2.9 (1.4-3.8)
1.911
381 (111-703) 148 (59-276)
.11 (.05-.19)
.11 (.04-.29)
5.6 (4.7-7.0) 7.5 (4.7-16.4)
8.611
18 (16-21) 16 (13-19)

42
1Bear Brook, ME; High N treatment = ambient + 56 kg N/ha/yr for 4 years (Aber et al. 1995). 2Mt. Ascutney, VT; High N treatment = ambient + 31.4 kg N/ha/yr for three years (McNulty and Aber 1992). 3East-West transect of ambient conditions; Whiteface Mt., NH, western terminus of transect and “high” condition; Acadia, ME eastern terminus and “low” condition; (Aber et al. 1995). 4Mt. Ascutney, VT; High N treatment = ambient + 31.4 kg N/ha/yr for three years (Aber et al. 1995) 5Harvard Forest, MA; High N treatment = ambient + 150 kg N/ha/yr for six years (Magill et al., 1997) 6Bear Brook, ME; High N treatment = ambient + 56 kg N/ha/yr for 4 years (Magill et al. 1996). 7Bear Brook, ME; treatment = ambient + 25.2 kg N/ha/yr for 15 years (Elvir et al. 2005). 8Synthesis of multiple studies forming a transect of ambient conditions from WV to ME (Aber et al. 2003). 9Bear Brook, ME; treatment=ambient + 25.2 kg N/ha/yr for 4 years (White et al. 1999). 10Survey data in northern hardwoods, spruce-hardwoods, NH (Nadelhoffer et al. 1999). 11Harvard Forest, MA (Bolster et al. 1996). 12Survey data in northern hardwoods, NH; values are from uncut or selectively-cut, monospecific plots only (Ollinger et al. 2002).

43
3.5 Surface Water Chemistry pH - Tug Hill first-order stream springtime pH averaged (± 1 SE) 6.4 ± 0.1 in both 2006 and 2007, and ranged from 4.2 – 7.5 in 2006 and 5.5-7.7 in 2007 (Table 14, Figure 7). During spring snowmelts of 2006 and 2007, 21% and 12% of samples had pH <6.0, and 4% and 0% had pH <5.0. During summer baseflow conditions, stream water averaged 7.2 ± 0.1 and 7.2 ± 0.1 in 2005 and 2006, respectively. No water samples exhibited pH < 6.3 during baseflow periods. The average pH of nearby western Adirondack streams ranged from 6.1-6.6 during summer baseflow periods and 5.6-5.9 during spring snowmelt (Lawrence et al. 2006). Freshwaters having pH less than approximately 6.0 – 5.5 begin to surpass tolerance thresholds of many aquatic invertebrates (Driscoll et al. 2001, 2003; USEPA 2007). ANC - Consistent with the circumneutral pH of the Tug Hill surface waters the region’s first order streams exhibited high acid neutralizing capacity. During summer baseflow conditions in 2005 and 2006, ANC of streams averaged (± 1 SE) 735 ± 55 μeq CaCO3 L-1 (range: 140-1427) and 706 ± 47 μeq CaCO3 L-1 (range: 260-1994) (Figure 6). No streams in our survey exhibited summertime ANC levels less than 50 μeq CaCO3 L-1, the threshold below which surface waters are considered susceptible to acidification. During the spring snowmelt periods of 2006 and 2007, ANC averaged 265 ± 34 μeq CaCO3 L-1 (range: 0-1184) and 203 ± 22 μeq CaCO3 L-1 (range: 0-971). These results suggest a greater buffering capacity of these Tug Hill sites compared to nearby western Adirondack streams where average ANCG
values ranged from 168-273 during the summers of 2003/2004 and from 62-74 during the springs of 2004/2005 (Lawrence et al. 2006).
Aluminum -The concentration of total dissolved aluminum averaged 1.1 ± 1.5 and 0.5 ± 1.1 µmol L-1during baseflow conditions in 2005 and 2006, and 1.4 ± 2.1 and 1.6 ± 1.3 µmol L-1 during spring snowmelt periods of 2006 and 2007 (Table 14, Figure 9). Our observed average Total Al concentrations during spring snowmelt were ~50% lower than inorganic, only, Al fractions reported from western Adirondack streams in 2004/2005 (Lawrence et al. 2006). Summertime Total Al concentrations were strongly and positively correlated R2 = 0.35, P < 0.001) with the proportion of contributing watersheds occupied by wetlands during the summer sampling period (Table 15), but this relationship was weak during the springtime sampling periods (R2
= 0.06, P=0.09). Aluminum concentrations were positively correlated with DOC concentrations during both the spring and summer sample periods (Figure 10), and this was likely due to wetland-derived organo-aluminum complexes since DOC and Al concentrations both exhibited strong positive correlations with the proportion of watershed area comprised of wetlands.
Sulfate - Average SO42- concentrations in 2005/2006 ranged from 73-89 µeq L-1 during spring
snowmelt and 61-65 µeq L-1 during summer baseflow periods (Table 14). The springtime SO42-
concentrations we observed are ~80% higher and summertime values ~45% higher than those reported in the western Adirondacks by Lawrence et al. (2006). Sulfate concentrations were negatively correlated with the proportion of the contributing watersheds occupied by wetlands for both the spring and summer sample periods. This is consistent with other studies (e.g., Inamdar and Mitchell 2008) demonstrating that anoxic wetland environments reduce and retain SO4
2-, thereby generally serving as SO42- sinks under high moisture conditions.

44
Table 14. Summary of synoptic surface water chemistry surveys of first-order streams on the Tug Hill during summer baseflow and spring snowmelt periods. P-values summarize the significance of interannual differences in average analyte values for each sample season.
------------------------------------------ Summer----------------------------------------- 2005 2006 Average
Analyte*
(1SE)
N Range P- Average
value
(1SE)
N Range pH 7.2 (0.1) 6.4-7.8 32 0.56 7.2 (0.1) 6.3-8.2 56
ANC 735 (55) 140-1427 32 0.17 705 (47) 260-1994 56 Na 38 (3) + 14-79 32 <0.01 27 (2) 0-73 56
Mg 280 (32) 2+ 90-1113 32 0.77 271 (15) 97-638 56 K 7.4 (1.6) + 0-51 32 0.13 5.0 (0.7) 0-34 56
Ca 606 (65) 2+ 183-2200 32 0.69 580 (34) 140-1227 56 Total Al 1.1 (0.3) 0.0-5.9 32 0.04 0.5 (0.2) 0-5.9 56
Si 80 (5) 29-152 32 0.55 75 (5) 9-152 56 Cl 13 (2) - 3-81 32 0.43 11 (2) 3-68 56
SO4 65 (7) 2- 7-161 32 0.22 61 (5) 7-166 56 NH4 3.2 (1.1) + 0-32 32 0.62 1.8 (0.5) 0-17 56 NO3 10 (2) - 0-33 32 0.69 13 (1) 2-45 56 DON 15 (2) 0-51 32 0.93 15 (2) 0-53 56
Total N 28 (3) 9-83 32 0.69 30 (2) 6-70 56 DOC 476 (79) 64-1562 32 0.69 512 (51) 76-1780 56
------------------------------------------ Spring-------------------------------------------
2006 2007 Average
Analyte*
(1SE)
N Range P- Average
value
(1SE)
N Range pH 6.4 (0.1) 4.2-7.5 44 0.85 6.4 (0.1) 5.5-7.7 50
ANC 265 (34) 0-1183 42 0.04 202 (22) 0-971 50 Na 27 (1) + 13-67 44 <0.01 23 (1) 13-49 50
Mg 121 (13) 2+ 18-551 44 0.08 106 (6) 39-269 50 K 8.5 (1.3) + 2-45 44 0.02 7.3 (0.4) 3-18 50
Ca 283 (27) 2+ 31-873 44 0.03 232 (17) 99-876 50 Total Al 1.4 (0.3) 0-12 44 0.82 1.6 (0.2) 0-5.9 50
Si 63 (6) 25-270 44 0.03 55 (2) 27-119 50 Cl 15 (1) - 10-38 44 0.19 15 (1) 8-64 50
SO4 89 (3) 2- 45-143 44 <0.001 73 (2) 53-108 50 NH4 6.0 (1.9) + 0-59 44 <0.09 2.6 (0.5) 0-12 50 NO3 29 (3) - 1-80 44 <0.01 44 (4) 6-135 50 DON 18 (8) 0-340 44 0.19 4.6 (0.8) 0-32 50
Total N 52 (10) 6-380 42 0.23 49 (4) 14-124 49 DOC 247 (29) 63-1021 44 0.14 265 (19) 49-583 50
*Units are: µeq L-1 for ANC, Na+, Mg2+, K+, Ca2+, Cl-, SO42-, NH4
+, NO3-; and µmol L-1
for Al, Si, DON, Total N, DOC.

45
August 2005 March 2006 August 2006 March 2007
8
7
6
5
4
Hp
Figure 7. Summary of surface water pH during synoptic surveys of Tug Hill first-order streams, 2005-2007. Data are median values, boxes representing the interquartile ranges of values, whiskers extending to the last observation within 1.5x the value of the interquartile range, and outlying observations above or below 1.5x the value of the interquartile range.

46
August 2005 March 2006 August 2006 March 2007
2000
1500
1000
500
0
)L/qeu( C
NA
Figure 8. Summary of acid neutralizing capacity (µeq L-1 as CaCO3
)1- Lqeµ (
AN
C
) of Tug Hill first-order streams during synoptic samples, 2005-2007. Data are median values, boxes representing the interquartile ranges of values, whiskers extending to the last observation within 1.5x the value of the interquartile range, and outlying observations above or below 1.5x the value of the interquartile range.

47
August 2005 March 2006 August 2006 March 2007
12
10
8
6
4
2
0
)1-L lomu( l
A
Figure 9. Summary of total aluminum concentrations in surface waters of the Tug Hill during baseflow and spring snowmelt periods, 2005-2007. Data are median values, boxes representing the interquartile ranges of values, whiskers extending to the last observation within 1.5x the value of the interquartile range, and outlying observations above or below 1.5x the value of the interquartile range.
)1l L
-m
oµ
l (l A
taoT

48
14
12
) 10
l/Lm
ou 8
l (l A 6
tato
4
2
00 500 1000 1500
DOC (umol/L)
P<0.001, R2=0.54
P<0.001, R2=0.42
14
12
10
l/Lm
ou 8
l (l A
ta 6
to
4
2
04.0 5.0 6.0 7.0 8.0 9.0
pH
P<0.001, R2=0.39
P<0.001, R2=0.28
Figure 10. Relationships between total aluminum concentrations and (A) dissolved organic carbon; and (B) pH in Tug Hill streams during summer baseflow and spring snowmelt periods.
A
B
)1l L
-m
oµ
m (
uin
mull a
taoT )1
l L-
mo
µm
(u
inmul
l ataoT
DOC (µmol L-1)
Summer baseflow Spring snowmelt
Summer baseflow Spring snowmelt

49
Nitrogen - Total N concentrations in the Tug Hill first-order streams averaged (± 1 SE) 28.4 ± 3.0 and 29.7 ± 1.7 µmol L-1 during baseflow periods in 2005 and 2006, and 52.0 ± 10.1 and 49.9 ± 3.8 µmol L-1 during spring snowmelt periods of 2006 and 2007. Nitrogen solutes were dominated by dissolved organic nitrogen (DON) during summer baseflow periods (Figure 11) and positively correlated with the proportion of wetlands in the watershed during the summer (Table 15), indicating that the extensive wetland systems in the Tug Hill landscape exert substantial influence on surface water nitrogen processes during the growing season. Springtime DON concentrations were consistently lower than summer concentrations and showed no correlation with wetland area. Trends in DON concentrations with relation to season and wetland influences are consistent with those for DOC, which also exhibited higher concentrations and a positive correlation with wetland area during baseflow periods but not spring snowmelt. Nitrate dominated N solutes during the spring snowmelt periods. Nitrate concentrations averaged 10.3 ± 1.5 and 12.9 ± 1.3 µeq L-1 during the summer baseflow periods of 2005 and 2006, and 28.6 ± 3.1 and 44.4 ± 4.4 µeq L-1 during the spring snowmelt periods of 2006 and 2007 (Table 14, Figure 12). Substantial variation existed in seasonal NO3
- concentrations (Table 16) across the study area. Of the streams for which we successfully collected both spring and summer samples, only 6% displayed consistently low (< 10 µeq L-1) NO3
- during both seasons. Seventy-four percent of the streams exhibited NO3
- concentrations >20 µeq L-1 during the spring snowmelt period and 36% had NO3
- concentrations >40 µeq L-1. During summer baseflow conditions NO3
- concentrations remained low (<10 µeq/L) in 56% of the streams, were moderately high (11-20 µeq L-1) in 28% of streams, and were elevated (>20 µeq L-1) in 16% of the streams. Stoddard (1994) proposed a framework for assessing the degree of forest N saturation based upon NO3
- concentrations of surface water discharge during dormant and growing seasons. Consistently low NO3
- concentrations throughout the year indicate low N concentrations in precipitation during the dormant season when biological assimilation is low, and maintenance of biological control over N assimilation processes during the growing season by plants and heterotrophic soil microbes (Stage 0 conditions, sensu Stoddard). As NO3
- concentrations in precipitation increase, systems begin to display elevated surface water NO3
- concentrations during snowmelt events (equivalent to approximately the concentration of precipitation), but as long as N remains limited during the growing season, baseflow NO3
- should remain low (Stage 1 conditions). Once N accumulates within a forested system to the point that N is no longer limiting during the growing season, then nitrification rates increase along with concomitant NO3
-
concentrations under baseflow conditions (Stage 2 conditions). Chronically high, year-round NO3
-concentrations, above that of precipitation, indicate N-saturated conditions (Stage 3). During recent years and the period of our survey (2005-2007), average annual precipitation NO3
- concentrations ranged from 18-25 µeq L-1 at the nearest NADP-NTN monitoring station (NY52, National Atmospheric Deposition Program 2010). We have therefore set 20 µeq NO3
- L-1 as a critical value in categorizing surface water NO3
- concentrations in the present study.

50
Table 15. Summary of correlations between surface water analytes, elevation and proportion of contributing watersheds as wetlands for synoptic surveys of first-order streams on the Tug Hill during summer baseflow and spring snowmelt periods. Results of correlation and linear regression analyses are summarized with r, R2
-------------------------------------- Summer---------------------------------------
and P-values for each of two predictor variables (elevation, proportion wetland). Repeated measurements were averaged across years at each sample location.
Elevation Proportion Wetland
r Analyte*
R P 2
r
R
P 2
pH -.23 .05 .09 -.28 .08 .03 ANC -.11 .01 .42 -.18 .03 .18 Na -.56 + .31 <.001 -.48 .24 <.001
Mg -.18 2+ .03 .19 -.07 <.01 .61 K -.17 + .03 .21 -.11 .01 .41
Ca -.14 2+ .02 .32 -.22 .05 .10 Total Al .13 .02 .32 .59 .35 <.001
Si -.26 .07 .05 -.13 .02 .34 Cl -.32 - .10 .02 -.24 .06 .07
SO4 -.33 - .11 .01 -.35 .13 <.01 NH4 .24 + .06 .08 .33 .11 .01 NO3 -.12 - .02 .37 -.24 .06 .07 DON .36 .13 <.01 .46 .21 <.001
Total N .31 .09 .02 .35 .12 <.001 DOC .43 .18 .001 .49 .24 .0001
---------------------------------------- Spring--------------------------------------- Elevation Proportion Wetland
r Analyte*
R
P 2
r
R
P 2
pH -.14 .02 .34 -.26 .07 .06 ANC .19 .04 .18 -.19 .03 .19 Na -.05 + <.01 .70 -.34 .12 .01
Mg .14 2+ .02 .29 -.08 <.01 .58 K .36 + .13 <.01 .24 .06 .08
Ca .14 2+ .02 .32 -.26 .07 .06 Total Al .24 .06 .08 .23 .06 .09
Si .32 .10 .02 -.09 <.01 .54 Cl -.25 - .06 .07 -.24 .06 .08
SO4 -.52 - .27 <.001 -.56 .31 <.001 NH4 .29 + .09 .04 .04 .001 .78 NO3 -.09 - <.01 .53 -.17 .03 .23 DON .12 .01 .39 -.16 .03 .25
Total N .06 <.01 .65 -.20 .04 .16 DOC .43 .19 .001 .59 .35 <.001

51
- Su
mm
er b
asef
low
NO
3Table 16. Categorization of Tug Hill first-order streams (percent of 50
conc
entra
tions
(µeq
L-1
) streams having repeated samples during spring snowmelt and summer
-baseflow periods) based upon seasonal NO3 concentrations.
Spring snowmelt NO3-concentrations (µeq L-1)
Total percent of
0-10 11-20 20-40 >40 streams 0-10 6 12 26 12 56
11-20 4 2 6 16 28
20-40 2 0 6 8 16
>40 0 0 0 0 0
Total percent of 12 14 38 36 100 streams
NH +4
NO -3
DON
)
-1
N (µ
mol
L
Figure 11. Average nitrogen solute concentrations in synoptic samples of Tug Hill first-order streams, 2005-2007.
60
50
40
(io
n tar 30
nt c
once
20
N
10
0August 2005 March 2006 August 2006 March 2007
Figure 11. Average nitrogen solute concentrations in synoptic samples of Tug Hill first-order streams, 2005-2007
l/L)
mo
NH4+NO3-DON
`

52
August 2005 March 2006 August 2006 March 2007
140
120
100
80
60
40
20
0
3O
N
Figure 12. Summary of nitrate concentrations in Tug Hill first-order streams during synoptic sampling, 2005-2007. Data are median values, boxes representing the interquartile ranges of values, whiskers extending to the last observation within 1.5x the value of the interquartile range, and outlying observations above or below 1.5x the value of the interquartile range.
)1q
L-µe (- 3
NO

53
While none of the sampled streams exhibited acute N saturation (Stage 3, here defined as > 40 µeq L-1 during both snowmelt and baseflow conditions), 16% exhibited elevated NO3
- concentrations (>20 µeq L-1) during summer baseflow (perhaps approaching Stage 2 conditions) and 28% exhibited moderate increases (10-20 µeq L-1) during the summer growing season (Stage 1 conditions). These data need to be interpreted with an important caveat. We identified very few first-order streams as potential study sites that did not originate from headwater wetlands or were otherwise influenced by upstream wetlands, especially in the central core of the region. Therefore, substantial potential exists for biological N transformations (denitrification, assimilation and retention, nitrification) to occur within these surface waters. In our survey, summer total N, DON and NH4
+ were all positively correlated with proportion of the subwatershed area that was wetland (Table 15). Still, NO3
- exhibited a weak but negative correlation with wetland area, suggesting a possibility that higher levels of nitrate may be leaching from upland forests than were detected in the surface water. Annual Variation - No differences were detected in most surface water chemistry parameters under baseflow conditions between 2005 and 2006. Only Na+ and Aln+ exhibited lower concentrations in 2006 compared to 2005. Nevertheless, the springtime samples were substantially more variable between the 2006 and 2007 collection period. With the exception of NO3
-, all analytes that differed between 2006 and 2007 had lower concentrations in 2007 samples. Several base cations, Si, and SO4
2- all declined 13-18% between 2006 and 2007. But NO3
- concentrations exhibited a ~50% increase between 2006 and 2007. The timing of the 2006 and 2007 sampling regimes in relation to each year’s pattern of snowmelt probably accounts for these differences. The 2007 sample was well synchronized with a distinct snowmelt event (Figure 2), while the 2006 sample occurred toward the end of a longer, drawn-out snowmelt period. The low concentration of base cations and high concentration of NO3
- are consistent with a melt event receiving proportionally higher amounts of overland/near surface flow and less mineral soil contributions.

54
4. SYNTHESIS AND CONCLUSIONS The Tug Hill is subject to especially high levels of deposition of atmospheric pollutants compared to other regions of New York where the effects of acid and nitrogen deposition have been more thoroughly studied. Therefore, this ecologically and commercially important region possesses potential to display symptoms of acidification and nitrogen saturation. Over a two year period (from August 2005 to March 2007) we conducted seasonal synoptic surveys to acquire data on soil, surface water and plant tissue chemistry with which to elucidate the current condition of forest and surface waters relative to impacts of acid and nitrogen deposition. Indicators of Acidification - Through a series of chemical indices we conclude that, although the Tug Hill region appears to have substantially more buffering capacity than other forested regions of New York (i.e., Adirondacks and Catskills), the region is displaying signs of potential negative impacts due to acid deposition. Average surface water pH remained circumneutral during both summer baseflow periods of our study. During spring snowmelts of 2006 and 2007 episodic surface water pH averaged 4.2-5.5. In 2006 and 2007, 21% and 12% of samples had pH <6.0, and 4% and 0% had pH <5.0. Freshwaters having pH less than approximately 6.0 – 5.5 begin to surpass tolerance thresholds of many aquatic invertebrates. Surface water ANC averaged >700 μeq CaCO3 L-1 during summer baseflow and >200 μeq CaCO3 L-1 during spring snowmelt. These values are substantially higher than those reported from the Adirondacks, and suggest that Tug Hill streams currently remain relatively well buffered from atmospheric acid deposition compared to the Adirondacks. Analyses of foliar tissue chemistry also reveal signals of potential negative impacts of acidification to the region’s forests. In 2005 and 2006, 10% and 11% of sugar maple samples exhibited Mg concentrations <0.7 mg/g dry wt, the concentration below which previous studies have suggested sugar maple becomes susceptible to decline imposed by added stress agents such as drought and defoliation, and brought on by acid-induced leaching of Mg from soils. Furthermore, the Ca:Al ratios observed for red spruce, American beech, red maple and sugar maple in this study were all below thresholds for the respective species that signal experimentally-induced, elevated nitrification and soil acidification. As with foliar Mg concentrations, low Ca:Al ratios suggest leaching of Ca from soils, which in turn initiates nutrient imbalances in plants. The Tug Hill soils displayed higher buffering capacity than western Adirondack soils, but still, 52% of the soil samples exhibited base saturations less than 10%, suggesting potential for future acidification. Indicators of Nitrogen Saturation – A number of soil, surface water and tissue chemistry indices suggest that the Tug Hill region is accumulating N and may be entering early stages of saturation. All (100%) of the forest floor samples, averaged for each of the 57 sites, had C:N ratios below 22, the level at which elevated nitrification rates have been demonstrated to occur.

55
Average extractable NO3- content of the forest floor and mineral soil horizons were both ~6-fold
higher than average NO3- contents reported from Adirondack forests. Similarly, the average
total N in the forest floors is approximately 15-25% higher than average values reported in two Adirondack studies. For all tree species sampled in this study and for which comparisons are available in the literature, foliar N concentrations from the Tug Hill region were consistently greater than those reported in other areas of the Northeast, and greater than foliage sampled from plots receiving high experimental N fertilization treatments. Likewise, foliar Mg:N and Ca:Al ratios from Tug Hill foliage were similar to or less than those from foliage sampled from plots receiving experimental N fertilization in other northeastern forests. For the Tug Hill region where precipitation NO3
- concentrations average ~20 μeq L-1, 16% of the sampled streams exhibited elevated NO3
- concentrations (>20 µeq L-1) during summer baseflow (approaching Stage 2 N-saturation conditions) and 28% exhibited moderate increases (10-20 µeq L-1) during the summer growing season (Stage 1). Only 6% of streams exhibited consistently low (<10 µeq L-1) NO3
- concentrations. Since most streams in our sample were influenced by wetlands, and NO3
- exhibited a weak but negative correlation with wetland area, it is possible that more NO3-
is being leached from upland forests than was being detected in the surface water samples of our study. We observed patterns of sugar maple dominance on sites with higher soil NO3
- content that were similar to those described in the Adirondacks and Catskills. Still, where previous studies also reported correlations between sugar maple and soil calcium content and/or base saturation, we detected no relationship between sugar maple basal area and base saturation.

56
5. LITERATURE CITED Aber, J.D., C.L. Goodale, S.V. Ollinger, M. Smith, A.H. Magill, M.E. Martin, R.A. Hallett and
J.L. Stoddard. 2003. Is nitrogen deposition altering the nitrogen status of northeastern forests? BioScience 53:375-389.
Aber, J.D., A. Magill, S.G. McNulty, R.D. Boone, K.J. Nadelhoffer, M. Downs and R. Hallett.
1995. Forest biogeochemistry and primary production altered by nitrogen saturation. Water, Air and Soil Pollution 85:1665-1670.
American Public Health Association. 1976. Standard Methods for the Examination of Water and
Wastewater. 1193 pp. Bailey, S.W., S.B. Horsley, R.P. Long and R.A. Hallett. 2004. Influence of edaphic factors on
sugar maple nutrition and health on the Allegheny Plateau. Soil Science Society of America Journal 68:243-252.
Bauhus, J. and N. Bartsch. 1996. Fine-root growth in beech (Fagus sylvatica) forest gaps.
Canadian Journal of Forest Research 26:2153-2159. Bischoff, J.M., P. Bukaveckas, M.J. Mitchell and T. Hurd. 2001. N Storage and cycling in
vegetation of a forested wetland: implications for watershed processing. Water, Air and Soil Pollution 128:97-114.
Bolster, K.L., M.E. Martin and J.D. Aber. 1996. Determination of carbon fraction and nitrogen
concentration in tree foliage by near infrared reflectance: a comparison of statistical methods. Can. J. For. Res. 26:590-600.
Bormann, F.H. and G.E. Likens. 1979. Pattern and Process in a Forested Ecosystem. Springer-
Verlag, New York, NY. 253 p. Chapman, H.D. 1965. Cation exchange capacity. pp. 891-901. In: C.A. Black (ed.). Methods of
Soil Analysis. Amer. Soc. Agron. Madison, WI. Connelly, N.A., T.L. Brown and C.P. Dawson. 1990. Evaluating the impacts of proposed
changes in the snagging regulations of the Salmon River. New York State Department of Environmental Conservation, Bureau of Fisheries, Albany, NY.
Cosby, B.J., J.R. Webb, J.N. Galloway and F.A. Deviney. 2006. Acidic deposition impacts on
natural resources in Shenandoah National Park. Technical Report NPS/NER/NRTR-2006/066. National Park Service, Northeast Region, Philadelphia, PA, USA.
Conan, C.S. and C.L. Schofield. 1990. Relationships between aqueous aluminum and acidic
deposition in forested watersheds of North American and Northern Europe. Environmental Science and Technology 24:1100-1105.

57
Cressey, G.B. 1966. Land Forms. In: Thompson, J.D. (ed.) Geography of New York State.
Syracuse University Press, Syracuse, New York. Driscoll, C.T., G.B. Lawrence, A.J. Bulger, T.J. Butler, C.S. Cronan, C. Eagar, K.F. Lambert, G.E.
Likens, J.L. Stoddard, and K.C. Weathers. 2001. Acidic deposition in the northeastern United States: sources and inputs, ecosystem effects and management strategies. BioScience 51:180-198.
Driscoll, C.T., K.M. Driscoll, M.J. Mitchell and D.J. Raynal. 2003. Effects of acidic deposition on
forest and aquatic ecosystems in New York State. Environmental Pollution 123:327-336. Elvir, J.A., L. Rustad, G.B. Wiersma, I. Fernandez, A.S. White and G.J. White. 2005. Eleven-
year response of foliar chemistry to chronic nitrogen and sulfur additions at the Bear Brook Watershed in Maine. Canadian Journal of Forest Research 35:1402-1410.
Eschner, A., J. Osinski, D. Howe and S. Schupe. 1974. Water Resources. Pages 86-119 In:
Resources of the Tug Hill Region. Prepared for The Temporary Commission on Tug Hill. State University of New York College of Environmental Science and Forestry. Syracuse, New York.
Fenn, M.E., M.A. Poth, J.D. Aber, J.S. Baron, B.T. Bormann, D.W. Johnson, A.D. Lemly, S.G.
McNulty, D.F. Ryan and R. Stottlemyer. 1998. Nitrogen excess in North American ecosystems: predisposing factors, ecosystem responses and management strategies. Ecological Applications 8:706-733.
Fisk, M.C., D.R. Zak and T.R. Crow. 2002. Nitrogen storage and cycling in old- and second-
growth northern hardwood forests. Ecology 83:73-87. Hansen, G.D. and R.D. Nyland. 1986. Effects of diameter distributions on the growth of simulated
uneven-aged sugar maple stands. Canadian Journal of Forest Research 49:382-392. Hanson, G.C., P.M. Groffman and A.J. Gold. 1994. Denitrification in riparian wetlands receiving
high and low groundwater nitrate inputs. Journal of Environmental Quality 23:917-922. Hedin, L.O., J.J. Armesto and A.H. Johnson. 1995. Patterns of nutrient loss from unpolluted, old-
growth temperate forests: evaluation of biogeochemical theory. Ecology 76:493-509. Heimburger, C.C. 1934. Forest type studies in the Adirondack region. Cornell University
Agriculture Experiment Station Memoir 165, 122 pp. Horsely, S.B., R.P. Long, S.W. Bailey, R.A, Hallett and T. Hall. 2000. Factors associated with
decline disease of sugar maple on the Allegheny Plateau. Canadian Journal of Forest Research 30:1365-1378.

58
Hurd, T.M. and D.J. Raynal. 2004. Comparison of nitrogen solute concentrations within alder (Alnus incana ssp. rugosa) and non-alder dominated wetlands. Hydrological Processes 18: 2681-2697
Inamdar, S.P. and M.J. Mitchell. 2008. Sulfate exports from multiple catchments in a glaciated
forested watershed in western New York, USA. Environmental Monitoring and Assessment 139:227-245.
Jordan, R.J. 1977. Glacial geology and wetland occurrence on the Tug Hill Plateau: preliminary
report to the Temporary State Commission on the Tug Hill. Syracuse University Geology Department, Syracuse, NY.
Keeton, W.S., A.A. Whitman, G.G. McGee and C.L. Goodale. 2011. Late-successional biomass
development in northern hardwood-conifer forests of the northeastern United States. Forest Science (In Press).
Lawrence, G.G., B.P. Baldigo, K.M. Roy, H.A. Simonin, R.W. Bode, S.I. Passy and S.B.
Capone. 1998. Results from the 2003-2005 western Adirondack stream survey. New York State Energy Research and Development Authority Report 08-22.
Leaf, A.L. and R.F. Wittwer. 1974. Soils and Geology. Pages 8-35 In: Resources of the Tug Hill
Region. Prepared for The Temporary Commission on Tug Hill. State University of New York College of Environmental Science and Forestry. Syracuse, New York.
Lovett, G.M., K.C. Weathers and W.V. Sobczak. 2000. Nitrogen saturation and retention in
forested watersheds of the Catskill Mountains, New York. Ecological Applications 10:73-84. Lovett, G.M. and M. J. Mitchell. 2004. Sugar maple and nitrogen cycling in the forests of
eastern North America. Frontiers in Ecology and the Environment 2:81-88. Magill, A.H., J.D. Aber, J.J. Hendricks, R.D. Bowden, J.M. Melillo and P.A. Steudler. 1997.
Biogeochemical response of forest ecosystems to simulated chronic nitrogen deposition. Ecological Applications 7:402-415.
McCune, B. and M.J. Mefford. 1999. PC-ORD Version 4.0. MjM Software Design. Gleneden
Beach, OR, USA. McCune, B., J.B. Grace and D.L. Urban. 2002. Analysis of Ecological Communities. MjM
Software Design. Gleneden Beach, OR, USA. McGee, G.G. 2008a. Salmon River Watershed Natural Resource Assessment. Prepared for The
New York State Tug Hill Commission, Watertown, New York. McGee, G.G. 2008b. Salmon River Watershed Natural Resource Viability Analysis. Prepared for
the New York State Tug Hill Commission, Watertown, New York.

59
McGee, G.G., D.J. Leopold, and R.D. Nyland. 1999. Structural characteristics of old-growth, maturing, and partially-cut northern hardwood stands. Ecological Applications 9:1316-1329.
McGee, G.G., M. J. Mitchell, D.J. Leopold, D.J. Raynal and M. Mbila. 2007a. Relationships
among forest age, composition and elemental dynamics of Adirondack northern hardwood forests. Journal of the Torrey Botanical Society 134:253-268.
McGee, G.G., M.J. Mitchell, D.J. Leopold and D.J. Raynal. 2007b. Comparison of soil nutrient
fluxes from tree-fall gap zones of an old-growth northern hardwood forest. Journal of the Torrey Botanical Society 134:269-280.
McNulty, S.G. and J.D. Aber. 1992. Effects of chronic nitrogen additions on nitrogen cycling in
a high-elevation spruce-fir stand. Canadian Journal of Forest Research 23:1252-1263. Mitchell, M.J. 2011. Nitrate Dynamics of Forested Watersheds: Spatial and Temporal Patterns
in North America, Europe and Japan. Journal of Forest Research. (In Press) Nadelhoffer, K.J., M.R. Downs, B. Fry, A. Magill and J.D. Aber. 1999. Controls on N retention
and exports in a forested watershed. Environmental Monitoring and Assessment 55:187-210. National Atmospheric Deposition Program (NRSP-3). 2010. Illinois State Water Survey,
Champaign, IL. Available online at: [http://nadp.sws.uiuc.edu/ntn/]. Nyland, R.D. 1996. Silviculture: concepts and applications. McGraw-Hill, New York, NY,
USA. NYS Tug Hill Commission. 2002. Tug Hill Region of New York State. New York State Tug Hill
Commission, Watertown, New York. NYS Tug Hill Commission. 2010a. The Tug Hill Region. New York State Tug Hill
Commission, Watertown, New York. Available online at <http://www.tughill.org/region.html>. Retrieved March 31, 2010.
NYS Tug Hill Commission. 2010b. The Tug Hill Environment and Economy. New York State
Tug Hill Commission, Watertown, New York. Available online at <http://www.tughill.org/envir.html>. Retrieved March 31, 2010.
Ollinger, S.V., M.L. Smith, M.E. Martin, R.A. Hallett, C.L. Goodale and J.D. Aber. 2002.
Regional variation in foliar chemistry and N cycling among forests of diverse history and composition. Ecology 83:339-355.
Page, B.D. and M.J. Mitchell. 2008. Influences of a calcium gradient on soil inorganic nitrogen
in the Adirondack Mountains, New York. Ecological Applications 18:1604-1614.

60
Peet, R.K. 1992. Community structure and ecosystem properties. P. 102-151. In: D.C. Glenn-Lewin, R.K. Peet and T.T. Veblen (eds.) Plant Succession: Theory and Prediction. Chapman and Hall, London, UK.
Reuss, J.0. 1983. Implications of the calcium-aluminum exchange system for the effect of acid
precipitation in soils. Journal of Environmental Quality 12:591-595. Stoddard, J.C. 1994. Long tern changes in watershed retention of N: its causes and aquatic
consequences Pages 223-284 In: Baker, L.A. (ed.) Environmental Chemistry of Lakes and Reservoirs. Advances in Chemistry Series 237.
Stoddard, J.C., D.S. Jeffries, A. Lukewille, T.A. Clair, P.J. Dillon, C.T. Driscoll, M. Forsius, M.
Johannessen, J.S. Kahl, J.H. Kellogg, A. kemp, J. Mannio, D.T. Monteith, P.S. Murdoch, S. Patrick, A. Rebsdorf, B.L. Skjelkvale, M.P. Stainton, T. Traaen, H. van Dam, K.E. Webster, J. Wieting and A. Wilander. 1999. Regional trends in aquatic recovery from acidification in North America and Europe. Nature 401:575-578.
Stout, N.J. 1958. Atlas of Forestry in New York. State University of New York College of
Forestry at Syracuse. Bulletin 41. Syracuse, New York. Sullivan, T.J., C.T. Driscoll, B.J. Cosby, I.J. Fernandez, A.T. Herlihy, J. Zhai, R. Stemberger, K.U.
Snyder, J.W. Sutherland, S.A. Nierzwicki-Bauer, C.W. Boylen, T.C. McDonnell and N.A. Nowicki. 2006a. Assessment of the Extent to Which Intensively-Studied Lakes are Representative of the Adirondack Mountain Region. New York State Energy Research and Development Authority Report 06-17.
Sullivan, T.J., I.J. Fernandez. A.T. Herlihy, C.T. Driscoll, T.C. McDonnell, N.A. Nowicki, K.U.
Snyder and J.W. Sutherland. 2006b. Acid-base characteristics of soils in the Adirondack Mountains, New York. Soil Science Society of America Journal 70:141-152.
USDA Forest Service. 2004. Bailey’s Ecoregions and Subregions of the United States, Puerto
Rico, and the U.S. Virgin Islands: National Atlas of the United States. Reston, Virginia. USDA Forest Service. 2005. Northeastern Area Forest Sustainability and Planning. USDA Forest
Service ECOMAP Team, Washington, DC. USDA NRCS. 2008. Web Soil Survey. US Department of Agriculture National Resource
Conservation Service. Washington, DC. Available online at: <http://websoilsurvey.nrcs.usda.gov/app/>.
USDA SCS. 1960. Soil Survey of Lewis County New York. US Department of Agriculture Soil
Conservation Service. Washington, DC. USEPA. 2007. Effects of Acid Rain - Surface Waters and Aquatic Animals. Available online at
<http://www.epa.gov/acidrain/effects/surface_water.html>.

61
US Fish and Wildlife Service. 2010. National Wetlands Inventory Wetlands Mapper. Available online at < http://www.fws.gov/wetlands/Data/Mapper.html>.
Vitousek, P.M. and W.A. Reiners. 1975. Ecosystem succession and nutrient retention: a
hypothesis. BioScience 25:376-381. White, G., I. Fernandez and G. Wiersma. 1999. Impacts of ammonium sulfate treatment on the
foliar chemistry of forest trees at the Bear Brook Watershed in Maine. Environmental Monitoring and Assessment 55:235-25

62
APPENDIX I Quality Control
This appendix provides detection limits and QA/QC procedures for the M.J. Mitchell analytical laboratory, Syracuse, New York. Detection Limits: Source: Method Detection Limit by Standards Methods for the Examination of Water and
Wastewater (18th
Analyte
edition) 1030 E.
Detection Limit
NH4 10 μg L+ NO
-1 3 10 μg L-
SO
-1 4 10 μg L2-
Cl
-1 10 μg L-
Total Dissolved Nitrogen (TDN)
-1 10 μg L
Ca
-1 0.1 μg L2+
Mg
-1 0.1 μg L2+
K
-1 0.1 μg L+
Na
-1 0.1 μg L+
Dissolved Organic Carbon (DOC)
-1 0.1 mg L
-1

63
Summary of QA/QC procedures. NH4
+ Alkalinity (Autoanalyzer) MDL = 0.017 mg/L N MDL = 1.83 mg/L CaCO2 blanks per run
3 2 blanks per run
1(x3) QC per run : 37.97 µeq/L NH4 + 1 QC per run : 50 mg/L CaCO3-4 replicates per run
3 3-4 replicates per run
NO3- (KCl on Autoanalyzer) Anions (Ion Chromatograph)
MDL = 0.97 µmol/L MDL = 0.06 mg/L Cl
- MDL = 0.09 mg/L NO3
-
2 blanks per run
MDL = 0.07 mg/L SO41 QC per run : 51µeq/L NO
2+ 3 -
3-4 replicates per run 2 blanks per run
2 QC's per run :
42.3, 98.7 µeq/L Cl31.2, 156.15 µeq/L NO
- 3
80.65, 100.0 µeq/L SO-
4
2+ 3-4 replicates per run
Total Nitrogen (Autoanalyzer) DOC MDL = 0.03 mg/L N MDL = 0.07 mg/L C 2 blanks per run 2 blanks per run 5 QC's per run :
50 µeq/L L-Cysteine 51 µeq/L NO315.5 µeq/L EDTA
-
59.9 µeq/L NH457.1 µeq/L NO
+
1(x3) QC per run : 5ppm DOC
2
3-4 replicates per run 3-4 replicates per run

64
Cations (ICP) Analyte Low QC High QC Na 5.00 ppm 10.00 ppm Mg 5.00 ppm 10.00 ppm K 2.50 ppm 25.00 ppm Ca 5.00 ppm 10.00 ppm Al 5.00 ppm 10.00 ppm 1 blank per run Replicates of samples every 10th sample.
pH No blanks QC of 5.00pH used directly after calibrating, and after every 10 samples.

65
CN Analysis 1 blank per run 9 QC's per run Each sample replicated once per run QC ranges 1% Range 3% Range 5% Range 10% Range
element reported results low high low high low high low high
Aspartic Acid Carbon 36.09 35.729 36.451 35.007 37.173 34.286 37.895 32.481 39.699 Aspartic Acid Nitrogen 10.52 10.415 10.625 10.204 10.836 9.994 11.046 9.468 11.572 Italian Soil A Carbon 2.003 1.983 2.023 1.943 2.063 1.903 2.103 1.803 2.203 Italian Soil A Nitrogen 0.193 0.191 0.195 0.187 0.199 0.183 0.203 0.174 0.212 Acetanilide Carbon 71.09 70.379 71.801 68.957 73.223 67.536 74.645 63.981 78.199 Acetanilide Nitrogen 10.36 10.256 10.464 10.049 10.671 9.842 10.878 9.324 11.396 LECO 1002 Carbon 0.77 0.762 0.778 0.747 0.793 0.732 0.809 0.693 0.847 LECO 1002 Nitrogen 0.04 0.040 0.040 0.039 0.041 0.038 0.042 0.036 0.044 LECO 1005 Carbon 48.01 47.530 48.490 46.570 49.450 45.610 50.411 43.209 52.811 LECO 1005 Nitrogen 2.55 2.525 2.576 2.474 2.627 2.423 2.678 2.295 2.805 Italian Soil B Carbon 2.010 1.990 2.030 1.950 2.070 1.910 2.111 1.809 2.211 Italian Soil B Nitrogen 0.200 0.198 0.202 0.194 0.206 0.190 0.210 0.180 0.220

66

67
GENERAL QA/QC PROCEDURES: Source: Mitchell, M.J. and P.J. McHale. 2001. Biogeochemistry Procedural Manual (Rev. 3).
State University of New York, College of Environmental Science and Forestry, Department of Environmental and Forest Biology. Syracuse, New York.
All Instruments M.J. Mitchell Labs April 12, 1993 (Revised February 1, 2001) 1) CALIBRATION STANDARDS Fresh calibration standards should be used to calibrate each instrument at least daily or as often as suggested for a particular technique. (Refer to Laboratory Manual for specifics.) 2) INITIAL CALIBRATION VERIFICATION (ICV) Immediately after calibrating system, the calibration curve must be verified and documented for every analyte by the analysis of a suitable calibration check standard. It is preferable to use a certified solution of the analytes in the same concentration range as the samples. It is not acceptable to rerun a calibration standard.
3) CONTINUING CALIBRATION VERIFICATION (CCV) To ensure calibration accuracy during each analysis run, a calibration check standard must be analyzed at a suggested frequency of 10% or every two hours, whichever is more frequent. The calibration check standard must be prepared independent of the calibration standards. We prefer to use EPA samples or NIST samples when available. 4) BLANK SAMPLES A calibration blank or DDW should be analyzed with each run. If some sample preparation was required, a preparation blank must be analyzed. The preparation blank consists of DDW processed through each sample preparation and analysis procedure. A preparation blank must be prepared with each sample preparation group.

68
5) DUPLICATE SAMPLE ANALYSIS One duplicated sample must be analyzed in each run or with each group of samples. The relative percent differences for each component are calculated as follows: RPD = absolute value of (S-D) x 100 (S+D)/2 RPD = Relative percent difference S = First sample value D = Duplicate sample value
*****IMPORTANT POINT TO REMEMBER*****
If you are experiencing analytical problems with the above QA/AC samples or standards STOP!!!!!!!!! Remedy the problem before continuing and rerun the samples run with the problematic QA/QC sample(s).

69
General Procedures for Handling Standards For all standards great care should be taken to ensure that the sample does not become contaminated. Once material is taken from a container it should never be returned to that container. Solid NBS standards should be subsampled and placed in glass vials in a desiccator and this subsample used for all analyses. For EPA solution samples, the standard should be formulated according to the directions given with the quality control standards. The working solution should be kept at 1°C and sealed tightly. When the solution sample is low in volume (i.e. <75 ml) a new standard should be prepared. The old standard and the new standard should be compared to each other before discarding any old standard. For all measured components any variation between standards greater than the known analytical variation should be checked and the reason for the variation ascertained before proceeding. Major points: 1) Handle standards with great care. 2) Use laboratory and certified standards on a routine and regular basis as indicated in the
sheet on quality control and assurance. 3) Be certain that the same standards or a known equivalent are used for any procedure at all
times in the laboratory. 4) Check the results of the standards before proceeding with further analyses. If there is any
deviation from expected analytical variation (usually less than 5%), ascertain the source of the error and correct it.

70
Standards for Quality Control and Assurance Analysis Certified Standard
Chloride (Cl- SPEX CertiPrep IC Instrument-Check Standard 1 )
Nitrate (NO3- SPEX CertiPrep IC Instrument-Check Standard 1 )
Sulfate (SO42- SPEX CertiPrep IC Instrument-Check Standard 1 )
pH pH 5.00, Certified Buffer Solution
Ammonium (NH4+ Env. Res. Associates Nutrients, Cat. No. 509 )
Calcium (Ca2+ SPEX CertiPrep, Ca, 1000 mg/L )
Sodium (Na+ SPEX CertiPrep, Na, 1000 mg/L )
Potassium (K+ SPEX CertiPrep, K, 1000 mg/L )
Magnesium (Mg2+ SPEX CertiPrep, Mg, 1000 mg/L )
Total Al in Solution SPEX CertiPrep, Al, 1000 mg/L
Silicon (Si) EM Science, 1000 ppm standard
Dissolved Organic Carbon (DOC) LabChem, Inc. Carbon Standard 1000 ppm, organic
Total C, H, N Solid Acetanilide, LECO 1005
Total Sulfur Solid
Total Nitrogen In Solution
SPEX CertiPrep, Ammonium Standard, 1000 mg/L (for NH4+);
Ultra Scientific ICUS-181, Custom Inorganic Standard (for NO3-);
SPEX CertiPrep, Nitrite-N, 1000 mg/L (for NO2-
Total Alkalinity
); L-Cysteine Hydrochloride reagent; DiSodium EDTA, reagent grade
NA

71
APPENDIX II List of Associated Research Products and Presentations
NYSERDA – EMEP Annual Meeting, Albany, NY. 2005. Assessment of Nitrogen and Acidic
Deposition Impacts to Terrestrial and Aquatic Ecosystems of the Tug Hill. (Poster with M. J. Mitchell and P. Crast).
Tug Hill Tomorrow Land Trust. “Nitrogen and acid deposition on the Tug Hill: searching for
signals.” Booneville, NY (Keynote Address, Annual Dinner, 10/2007).

For information on otherNYSERDA reports, contact:
New York State Energy Research and Development Authority
17 Columbia CircleAlbany, New York 12203-6399
toll free: 1 (866) NYSERDAlocal: (518) 862-1090
fax: (518) 862-1091

Assessment of Nitrogen and Acid Deposition Impacts to Terrestrial and Aquatic Ecosystems of the Tug Hill, 2005-2007
December 2010
New York State Energy Research and Development AuthorityVincent A. Delorio, Esq., Chairman | Francis J. Murray, Jr., President and CEO
State of New York Andrew M. Cuomo, Governor