assessment of petroleum from the new albany shale … · 3. thickness and percentage of source rock...
TRANSCRIPT
Feasibility Study of Material-Balance Assessment of Petroleum from the
New Albany Shale in the Illinois Basin
U.S. GEOLOGICAL SURVEY BULLETIN 2137
~----------------------l ") I
\ I , I ( ,--------------,
..1 I + : + I I • "' • * I
I . I
I I
I I I
J ' s -~

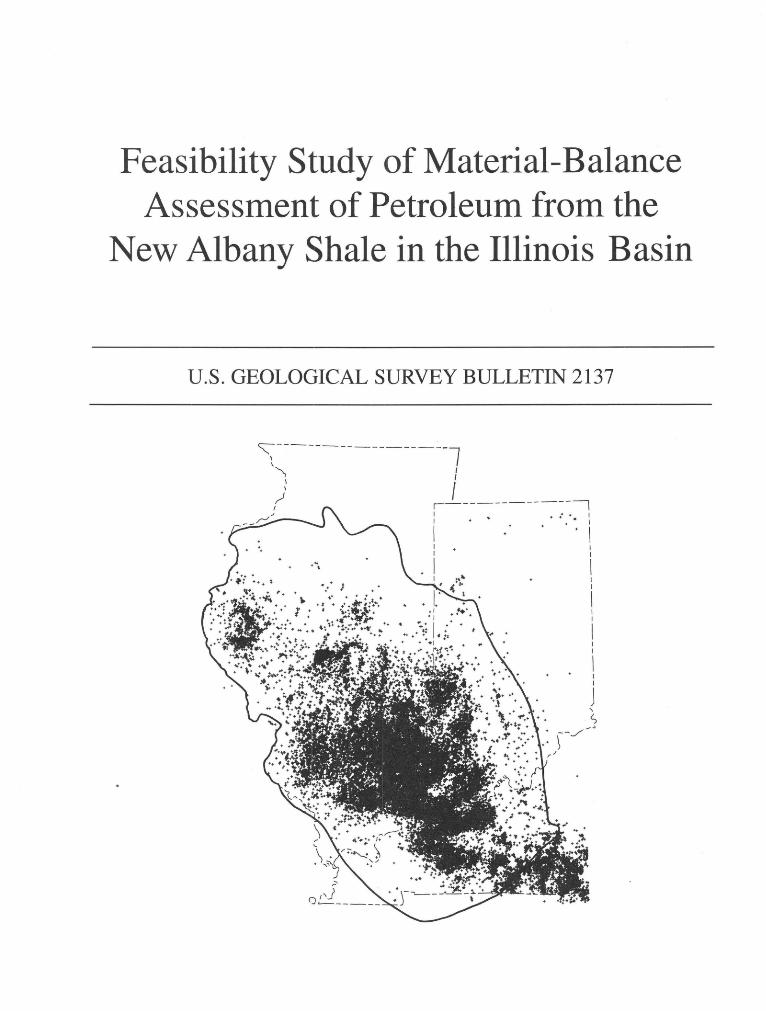
Cover. Map showing locations of wells that penetrate Mississippian or Upper Devonian rocks in the Illinois Basin (heavy line). Data from Petroleum Information Corp. Well History Control System.
Feasibility Study of Material-Balance Assessment of Petroleum from the New Albany Shale in the Illinois Basin
By M.D. Lewan, J.B. Comer, T. Hamilton-Smith, N.R. Hasenmueller, J.M. Guthrie, J.R. Hatch, D.L. Gautier, andW.T. Frankie
U.S. GEOLOGICAL SURVEY BULLETIN 2137
A material-balance assessment of the petroleum expelled from source rocks in the New Albany Shale and accountable petroleum within the Illinois Basin
UNITED STATES. GOVERNMENT PRINTING OFFICE, WASHINGTON : 1995
U.S. DEPARTMENT OF THE INTERIOR
BRUCE BABBITT, Secretary
U.S. GEOLOGICAL SURVEY
Gordon P. Eaton, Director
For sale by U.S. Geological Survey, Information Services Box 25286, Federal Center
Denver, CO 80225
Any use of trade, product, or firm names in this publication is for descriptive purposes only and does not imply endorsement by the U.S. Government
Library of Congress Cataloging-in-Publication Data
Feasibility study of material-balance assessment of petroleum from the New Albany Shale in the Illinois Basin I by M.D. Lewan ... [et al.].
p. em. - (U.S. Geological Survey bulletin: 2137) Supt. of Docs. no.: I 19.3:2137 1. Petroleum reserves-Illinois Basin. 2. Petroleum-Geology-Illinois
Basin. 3. New Albany Shale (Ind. and Ky.) I. Lewan, M.D. (Michael D.), 1948-II. Series. QE75.B9No. 2137 [TN872.A5] 557.3 s-dc20 95-24456 [553.2'8'0977 CIP
CONTENTS
Abstract........................................................................................................................... 1 Introduction..................................................................................................................... 1 Methods and Results . . . .. .. . ...... ... ... . ... ... ........ .. . . .. .. ..... ......... .. .. .. . ... ... ... .. ... ..... .. ..... .... ......... 4
Source-Rock Characterization . ... .. . . .. . . . .... .......... .. .. . ............ .. . . .. ...... .. . ...... ........ .. .. . .. 4 Stratigraphy..................................................................................................... 4 Thickness . . ............. .. .. . ..... .. ... . . . . ... .. ....... .. . .. ... . .. . ............ ... ..... ... . . . ..... .......... ..... 5 Thermal Maturity . . ...... ... .. .. ... .... ... .. . . . . . . . . .. .. .... ... . . .. . .. ............ ...... .. ......... .......... 5 Volume............................................................................................................ 5 Organic Richness .......... ......... .. . . . . . . . . . .. ............... .. . .. ... ....... .. ......... ........ .. ......... 9
Expulsion Factor..................................................................................................... 13 Rock-Eval Pyrolysis........................................................................................ 14 Hydrous Pyrolysis........................................................................................... 15
Accountable In-Place Petroleum............................................................................. 16 Discussion ....... ......... .. . ............ ... ... .. . . . ... . . . .. .. .............. .. . . . .. ............ .. . ..... ... . . . ..... ........... .... 20
Petroleum Charge .................................................................................................... 20 Petroleum Losses ............... .. .. .. . . . . . . . . . ... . .. ......... ..... .. ... ....... .. . . . . ......... .. ...... ...... .. . ...... 23 Material Balance ......... .. ....... .. .. ......... ........ .. . . . ... .......... .. .. . ...... ...... .. ....... ....... .. ......... 24 Future Research ....................................................................................................... 25
Conclusions..................................................................................................................... 26 Acknowledgments ........................................................................................................... 27 References Cited . . . . . . ........ .. . .. ......... ... ... ................ .. . . . ......... .. . . . ................ ...... ...... ...... ...... 27
FIGURES
1. Map of Illinois, Indiana, and western Kentucky showing outline of the Illinois Basin based on outcrop, subcrop, and limit of the New Albany Shale............................................................................................................... 3
2. Correlation of New Albany Shale in the Illinois Basin............................................................................................... 4 3. Northwest-southeast and west-east stratigraphic cross sections of the New Albany Shale
in the Illinois Basin...................................................................................................................................................... 6 4. Isopach map of Blocher Member of New Albany Shale............................................................................................. 7 5. Isopach map of Selmier Member of New Albany Shale............................................................................................. 7 6. Isopach map of "upper shale composite" member of New Albany Shale ......... ............................. ............................ 8 7. Isoreflectance contour map, Illinois Basin.................................................................................................................. 8 8. Empirical relationship between mean Rock-Eval hydrogen indices and mean random vitrinite
reflectances from core samples of New Albany Shale................................................................................................ 9 9. Relationship between TOC per m2 and thickness of source rock................................................................................ 14
10. Relationship between Rock-Eval expulsion factors and hydrogen index................................................................... 17 11. Quantity of oil expelled from hydrous-pyrolysis experiments.................................................................................... 17 12. Relationship between hydrous-pyrolysis expulsion factors and hydrogen index....................................................... 17 13. Relationship between Fischer assay yields and heating rates..................................................................................... 20 14. Change in measured inert organic carbon and calculated original total organic carbon from
Rock-Eval pyrolysis with increasing maturity ..... -....................................................................................................... 21
Ill

IV CONTENTS
TABLES
1. Summary ofTOC and Rock-Eva! data on cores of New Albany Shale..................................................................... 10 2. Surface area and volume of source rocks in members of New Albany Shale............................................................. 11 3. Thickness and percentage of source rock in members of New Albany Shale............................................................ 12 4. Organic richness of immature source rocks in members of New Albany Shale......................................................... 13 5. Mass of total organic carbon in source rocks in members of New Albany Shale....................................................... 14 6. Rock-Eva! expulsion factors....................................................................................................................................... 16 7. Quantity of petroleum expelled from the New :Albany Shale as determined by Rock-Eva! expulsion factors.......... 18 8. Quantity of petroleum expelled from the New Albany Shale as determined by hydrous-pyrolysis
expulsion factors.......................................................................................................................................................... 19 9. Calculated inert and original organic carbon from Rock-Eva! data............................................................................ 22
10. Material balance of accountable petroleum and petroleum charge from source rocks of the New Albany Shale....................................................................................................................................................... 25

FEASIBILITY STUDY OF MATERIAL-BALANCE ASSESSMENT OF PETROLEUM FROM THE
NEW ALBANY SHALE IN THE ILLINOIS BASIN
By M.D. Lewan, 1 J.B. Comer,2 T. Hamilton-Smith,3 N.R. Hasenmueller,2 J.M. Guthrie,4
J.R. Hatch, 1 D.L. Gautier, 1 and W.T. Frankie5
ABSTRACT
This study examines the feasibility of assessing petroleum resources of an established petroleum basin by a material-balance method. This method involves determining the amount of petroleum (1) expelled from mature and overmature source rocks, (2) discovered in place, and (3) lost by migration, surface leakage, and erosion. The Illinois Basin was used for this study because of its extensive drilling history as an established petroleum basin, good estimates of discovered in-place petroleum from production data, welldeveloped geological framework based on subsurface data, and availability of geochemical databases on source rocks of the New Albany Shale and related petroleum. Although additional research is needed to fully develop this method, the results from this study indicate that a material-balance assessment is feasible. The amount of petroleum expelled from source rocks in the New Albany Shale within the Illinois Basin is estimated to be between 152 and 236 billion barrels. Currently, 12 billion barrels of this expelled petroleum has been discovered in place. Vertical secondary migration along fractures and faults appears to have been dominant in the Illinois Basin. However, 18 to 55 billion barrels of residual petroleum may be lost within carrier beds as a result of some lateral secondary migration. In-place tar deposits of western Kentucky represent 15 to 30 billion bar·rels of original undegraded petroleum, and an additional 46 to 91 billion barrels of petroleum may have been lost due to erosion of the Upper Pennsylvanian through Permian
1U.S. Geological Survey, Box 25046, Denver Federal Center, Denver, co 80225.
2Indiana Geological Survey, 611 North Walnut Grove, Bloomington, IN 47405.
3Kentucky Geological Survey, 228 Mining and Mineral Resources, University of Kentucky, Lexington, KY 40506-0107.
4Department of Geology, Indiana University, Bloomington, IN 47405. 5Illinois State Geological Survey, 615 East Peabody Drive, Cham
paign, IL 61820.
section. Although this material balance yields reasonable values, the uncertainty in assumptions and variability in values make it too equivocal at this time to determine the amount of petroleum remaining to be discovered. This feasibility study yields a broad range of -37 to 144 billion barrels of petroleum from the New Albany Shale that remain to be discovered in conventional or unconventional accumulations in the Illinois Basin. The -37 billion barrels indicates that possibly no more undiscovered petroleum remains to be found and that the amounts of accountable petroleum lost to carrier beds or erosion are overstated. The 144 billion barrels indicates that possibly the expulsion factors or the steadystate model for organic richness for the source rocks in the mature part of the basin are overstated. Although this range is broad, it does encompass and does not completely exceed the range of accountable petroleum within the basin. Future research directed toward the uncertainties in petroleum expulsion factors and original organic richness of mature source rocks is attainable and will significantly enhance the utility of this assessment method.
INTRODUCTION
The increasing dependence on foreign petroleum and the decreasing domestic exploration effort in the United States are important national concerns. In order to properly posture domestic and foreign policies to optimize sources of future energy supplies, accurate and credible assessments of petroleum resources in the United States and the world are essential. Assessments of undiscovered petroleum are currently based on statistical evaluations and geological analogs of discovered petroleum. These types of assessments typically reflect amounts of petroleum to be found by existing technologies and exploration strategies and do not necessarily reflect ultimate amounts of unconventional and undiscovered conventional petroleum remaining to be found in a sedimentary basin.

2 MATERIAL-BALANCE ASSESSMENT OF PETROLEUM, NEW ALBANY SHALE, ILLINOIS BASIN
A more scientifically based method to determine the ultimate petroleum potential of a sedimentary basin may be through a material-balance assessment. This method requires the evaluation of petroleum charge and petroleum losses within a sedimentary basin. Petroleum charge is the amount of petroleum expelled from mature and over-mature source rocks. Petroleum losses are the amounts of petroleum lost as a result of leakage to the surface or dispersed and residual amounts along migration pathways. The difference between these two parameters gives the ultimate petroleum potential of a sedimentary basin. The difference between the ultimate petroleum potential and discovered in-place petroleum gives the amount of undiscovered petroleum remaining within a sedimentary basin. This amount includes both undiscovered conventional and unconventional petroleum.
Determining petroleum charge requires realistic expulsion factors for identified source rocks and a thorough characterization of mature and over-mature source rocks. The first requirement has been problematic in the past because open, anhydrous laboratory pyrolysis methods (i.e., RockEva!) are unrepresentative of natural processes and grossly overestimate the amounts of petroleum that are expelled from a source rock (Lewan, 1994). This obstacle has more recently been alleviated in part through the development of a laboratory pyrolysis method (i.e., hydrous pyrolysis) that more closely simulates natural petroleum generation and expulsion (Lewan, 1993). As a result, more realistic expulsion factors for source rocks can be determined. The second requirement, to characterize mature and over-mature source rocks, has not been an obstacle in the past but has often been neglected or oversimplified. Two of the most common transgressions of this requirement are the inclusion of large volumes of organic-lean rocks that have no significant potential as source rocks and the use of only the most organic-rich samples to represent an entire mixed section of source and non-source rock. Currently, knowledge of what constitutes a petroleum source rock and availability of completely cored sections of source rocks have made the fulfillment of this requirement more attainable than in the past.
Determining petroleum losses within a sedimentary basin remains a challenging task. Although considerable efforts have been made to study the expulsion of petroleum from source rocks and the reservoir character of entrapped petroleum, few studies have been made on the intermediate processes responsible for migration of petroleum from source rock to trap. Past attempts to quantify petroleum lost during migration have invoked enormous petroleum losses because of exaggerated ultimate petroleum charge values determined by Rock-Eva! pyrolysis. Most of these postulated petroleum losses were attributed to surface leakage, which typically could not be justified by the presence of heavy-oil or tar deposits. In addition, these studies were based on petroleum migration through porous rocks, with only minimal consideration being given to migration along regional fractures or faults. Determining petroleum losses
during migration becomes a more realistic and practical. challenge with more realistic values of ultimate petroleum charge, a greater awareness of the consequences of surface leakage, and a new appreciation for migration along fractures and faults.
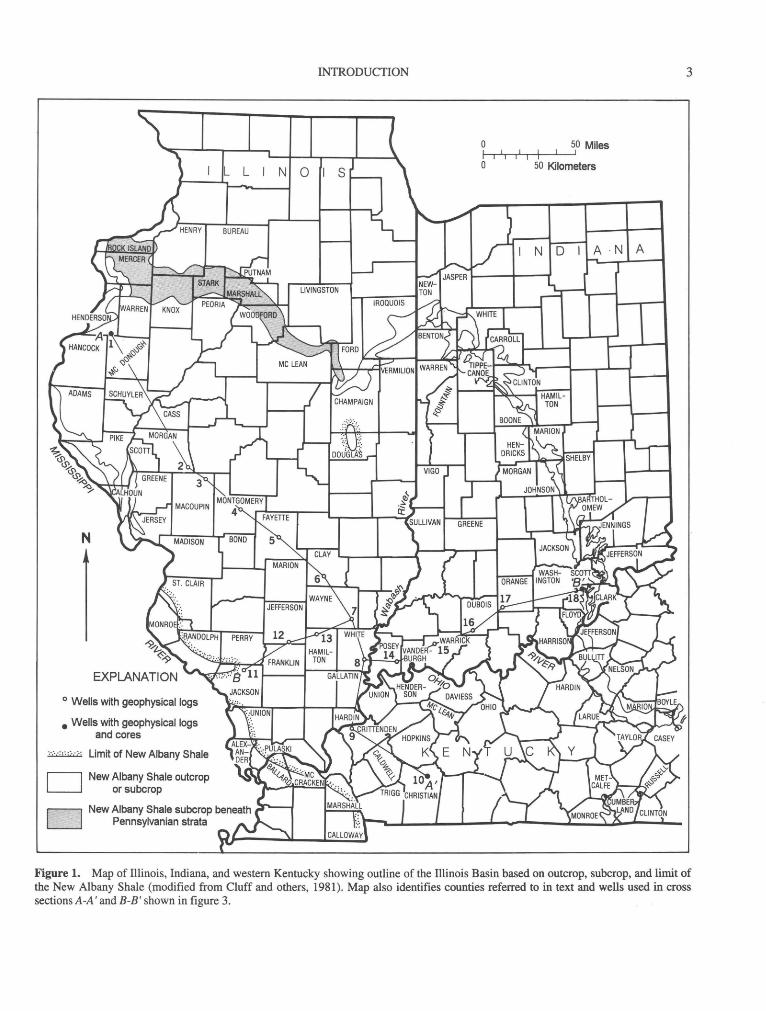
The overall objective of this study is to determine the feasibility of conducting a material-balance assessment of petroleum within a sedimentary basin. This feasibility is evaluated with respect to amounts and types of data needed, plausibility and utility of assessment values obtained, and timeliness and achievability of future research required. Determining the feasibility of this type of assessment was considered to be best served by studying an established petroleum basin with known quantities of discovered inplace petroleum, sufficient subsurface data for a well-constrained geological framework, and available geochemical data for source-rock characterization. The Illinois Basin (fig. 1) meets these prerequisites with complete assessments of discovered in-place petroleum (Mast and Howard, 1990), a well-established regional stratigraphy (Leighton and others, 1990), and available geochemical databases on the New Albany Shale (Frost, 1980; Robl and others, 1983; Hasenmueller and Leininger, 1987; Comer and others, 1994).
The Illinois Basin has almost 1, 700 named fields that produce from approximately 7,000 separate sandstone and carbonate reservoirs (Oltz and others, 1990). The established nature of petroleum production in this basin is reflected in its percentage of stripper production (96 percent), which is more than six times higher than the national average (Oltz and others, 1990). An estimate of the original petroleum in place for known fields in the basin is 12 billion barrels (Mast and Howard, 1990), with an additional 3.4 billion barrels of in-place tar (Noger, 1987; Crysdale and Schenk, 1988). Geochemical correlations and stratigraphic position of reservoirs indicate that more than 99 percent of the produced petroleum was sourced by the New Albany Shale (Hatch and others, 1990). The New Albany Shale consists of varying amounts of brownish-black, organic-rich shale and greenishgray, organic-lean shale. This formation is present in the subsurface throughout much of the basin, with thicknesses ranging from less than 40 m at the basin margins to more than 140m in the basin depocenter.
The term petroleum as used in this study refers to naturally occurring liquids that consist predominantly of hydrocarbons (e.g., heavy oil, crude oil, and condensates). Although the definition of petroleum is sometimes expanded to include natural gas (e.g., Levorsen, 1967), natural gas is not considered in this feasibility study, and only the strict definition of petroleum (i.e., from the Latin petra, rock and oleum, oil) is used. It should also be emphasized that this feasibility study only addresses petroleum expelled from source rocks within the New Albany Shale. Other source rocks within the Illinois Basin have been suggested (Cluff and Byrnes, 1990; Bond and others, 1971), with source rocks within the Scales and Brainard Shales (Ordovician) being
N
~~ ~")>
EXPLANATION
0 Wells with geophysical logs
• Wells with geophysical logs and cores
D D
Limit of New Albany Shale
New Albany Shale outcrop or subcrop
INTRODUCTION 3
o 50 Miles r-1 .......... .._., 1--T'I i......,....J\1---'-----'1
o 50 Kilometers
A
Figure 1. Map of Illinois, Indiana, and western Kentucky showing outline of the Illinois Basin based on outcrop, subcrop, and limit of the New Albany Shale (modified from Cluff and others, 1981). Map also identifies counties referred to in text and wells used in cross sections A-A' and B-B' shown in figure 3.

4 MATERIAL-BALANCE ASSESSMENT OF PETROLEUM, NEW ALBANY SHALE, ILLINOIS BASIN
CHRONOSTRATIGRAPHIC UNITS ROCK UNITS
::2: LU ten >en
(/)
::J 0 cr. L.U u..
z 0 c:c cr. < u
GLOBAL
cr: LU
:s: 0 _J
en LU
ffi en
z: <( en <( z: cr: ::::l 0 t-
NORTH AMER ICAN NORTHWEST
CENTRAL ILLINOIS1
•2
WESTERN ILLINOIS 1
SOUTHWESTERN SOUTHEASTERN ILLINOIS1 ILLINOIS1
< """ s. Si lt- ville Springvil le Shale z ~ <(z: LBiumrleinstgotonne B~urlingto n Borden Spring-
0::: §~ JJ HJ I) ,I_ IJ Me~pen J.)-1. +-s_to_n_e__.___s_ha_le-+- --..._ ~ ~ ~-cJstarrs Cave Ls' Cho uteau Chouteau\ CJ) :;;;:: ~ ~~s, seau Limestone Limestone (.() 0 z-:r:: McCraneyls '\I
- 0 al vi IJacobsChapei Bect CJ) :r: ~ ..0 I' CJ) ~ Nutwood Bed -o ::2: l Henryvi lle I - C) c: Q.)
~ z Hannibal and Shale Mbr. ~ ~ Bed J
WESTERN KENTUCKY 3
SOUTHWESTERN SOUTHEASTERN WEST -CENTRAL INOIANA 4 INDIANA4 KENTUCKY 5
New Providence llPro~~d~n ce Shale Shale
/R;k~;J Roc:~ ) Li~~stone Lime~t~·;e \
Hannibal
IJacobsChapeiBectl
I Henryvi lle I
Bed
0.
"' New ~ Providence g S hal~
Rockford '\t [ Limestone ~
~ New
Providence Shale Mbr.
Rock~Jf Lsuru \
:;;;:: Saverton :e en s ~ \ 1-----t--+---+-- -t-?- S Lou•s-1_ Hart~~ c c '"v, F II '
'";,, Mhbarlse. '"L"sa ~ .§ -s a mg _ ~ _ ~ ~~ Run
Member .c ~ \ t::: J5 Fall ing ~ E Run
~ Falling Run Bed
}g Cl) ~Saverton Cl) ~ ~ ;;; Bed en Jg Shale 1 Jg~ ~
E§ ~ Bed
z: <(
~ ~ en Mbr. I en t--
Cl)
z: z:
::::l "' f-------1 ~ ~
g ~ Grassy Creek 2 Grassy Creek 2 Grassy Creek
and Sweetland
Creek Shale Mbrs.
}g Grassy Creek Cl)
}g
Clegg Creek Member
LU ~ g; and <i: Shale <i: en Shale ~ Grassy Creek ~ 2 Sweetland g; Mbr. g; cr: ::2:
;:;: ~ "' Mbr.
~ Member z <(
z 0
> L.U
Cl
LU 0... 0... ::::l
z <(
G Creek Shale z: z:
z -o-
Mbrs.
Sylamore Ss. Mbr
z:
I ~ llli~ f-?-- -?-Cedar Valley
z: <(
E >
Limestone2
~ . . ~ LU Waps1p1n1con
Sweetland Creek Shale Mbr.
Sylamore Ss Mbr ~~
Limeston~;
~------------~' Member extends into Ordovician rocks in 2 From Shaver and others (1985)
.D
<i: g; z:
!Unconformity beneath Sylamore Sandstone I I Modified from Cluff and others (1981)
northwest centra\ Illinois and western Il linois 3 Modified from Schwalb and Norris (1980)
.D
<i: g; z:
4 From Hasenmueller and Bassett (1981)
5 Mod1fied from Conkin and Conkin ( 1972); Beard (1980); Sable and Dever (1990); and Ettensohn and others (1991)
I \ Biostratigraphic evidence indicates that the basal part of the Jeffersonville Limestone is Emsian (Lower Devonian) . See Devera and Fraunfelter (1988) : Conkin and Conkin (1984)
Figure 2. Correlation of New Albany Shale in the Illinois Basin (modified from Hasenmueller and others, 1994). Rock-unit thicknesses are not to scale. Fm., Formation; Gp., Group; J.C., Jacobs Chapel; Ls., Limestone; Mbr., Member; Sh., Shale; Slts., Siltstone; Ss., Sandstone.
prime candidates as additional sources for petroleum (Guthrie and Pratt, 1994) that are not considered in this study.
METHODS AND RESULTS
SOURCE-ROCK CHARACTERIZATION
A petroleum source rock is defined in this study as a rock containing oil-prone organic matter and a total organic carbon (TOC) content equal to or greater than 2.5 weight percent. This TOC limit is based on the petrographic study of Devonian and Mississippian black shales by Lewan (1987). This study showed that a critical quantity of organic matter is needed to generate sufficient bitumen to form a continuous organic network within the matrix of a source rock for expulsion of petroleum to occur. Rocks with oil-prone organic
matter that is dispersed within a mineral matrix may not generate sufficient bitumen to form this continuous network if its original TOC is less than 2.5 weight percent. As a result, these organic-lean rocks may generate but not expel petroleum. Although this TOC limit of 2.5 weight percent is high compared to earlier proposed limits of 0.4 to 1.4 weight percent (Ronov, 1958), higher TOC limits in excess of 2.5 weight percent are now being suggested (Bordenave and others, 1993).
STRATIGRAPHY
The New Albany Shale is a time-transgressive unit extending from Middle Devonian to Early Mississippian (Cluff and others, 1981). Figure 2 gives stratigraphic ages, nomenclature, and correlation of rock units within and
METHODS AND RESULTS 5
adjacent to the New Albany Shale in different parts of the Illinois Basin. The New Albany Shale overlies Middle Devonian limestones (Sellersburg Limestone, Lingle Formation, and North Vernon Limestone) throughout most of the basin. This basal contact is generally conformable in southern and eastern Illinois, but, farther to the north and west, the basal shale grades laterally into argillaceous limestone, dolostone, and shale of the Lingle and Alto Formations (North, 1969). The New Albany Shale is overlain by Early to Late Mississippian strata throughout most of the basin. However, in northern Illinois, the formation has been partly eroded and is overlain by Pennsylvanian strata. In a small area in extreme southern Illinois, the New Albany Shale is overlain by Upper Cretaceous rocks (Collinson and Atherton, 1975). As shown in figure 2, the New Albany Shale has been locally subdivided into as many as 13 lithologic members. 6 The regional relationships of these members are shown in the two cross sections of figure 3. Only the members containing organicrich, brownish-gray to black shales capable of generating petroleum are considered in this study. These members include the Blocher, Selmier, Sweetland Creek, Grassy Creek, Morgan Trail, Camp Run, and Clegg Creek Members. The Blocher, Grassy Creek, Morgan Trail, and Clegg Creek Members consist almost entirely of organic-rich, brownishblack to grayish-black, laminated, pyritic shale. The Selmier, Camp Run, and Sweetland Creek Members consist of varying amounts of organic-lean, greenish-gray shale and organic-rich, brownish-black shale. For a detailed discussion on the stratigraphy of the New Albany Shale, see Hasenmueller and others ( 1994 ).
THICKNESS
Thickness of mature and over-mature source rock within a sedimentary basin is a critical parameter in determining the volume of source rock for calculating petroleum charge. An isopach map of the New Albany Shale has been constructed for the Illinois Basin (Cluff and others, 1981), which has been useful in reconstructing paleoenvironments and defining depocenters. Unfortunately, a map of this type includes thicknesses of members that do not contain petroleum source rocks (i.e., Hannibal, Saverton, and Ellsworth Members) and portions of members that are not petroleum source rocks (i.e., Selmier and Camp Run Members). Inclusion of these non-source-rock thicknesses can significantly exaggerate the petroleum charge, and, therefore, an isopach map of only source rocks within the New Albany Shale is
6The Illinois State Geological Survey uses lithic modifiers for the shale members of the New Albany Shale (Blocher Shale Member, Selmier Shale Member, Sweetland Creek Shale Member, Grassy Creek Shale Member, Saverton Shale Member, and Hannibal Shale Member). The Indiana Geological Survey and Kentucky Geological Survey do not use lithic modifiers. For simplicity, this report does not use lithic modifiers.
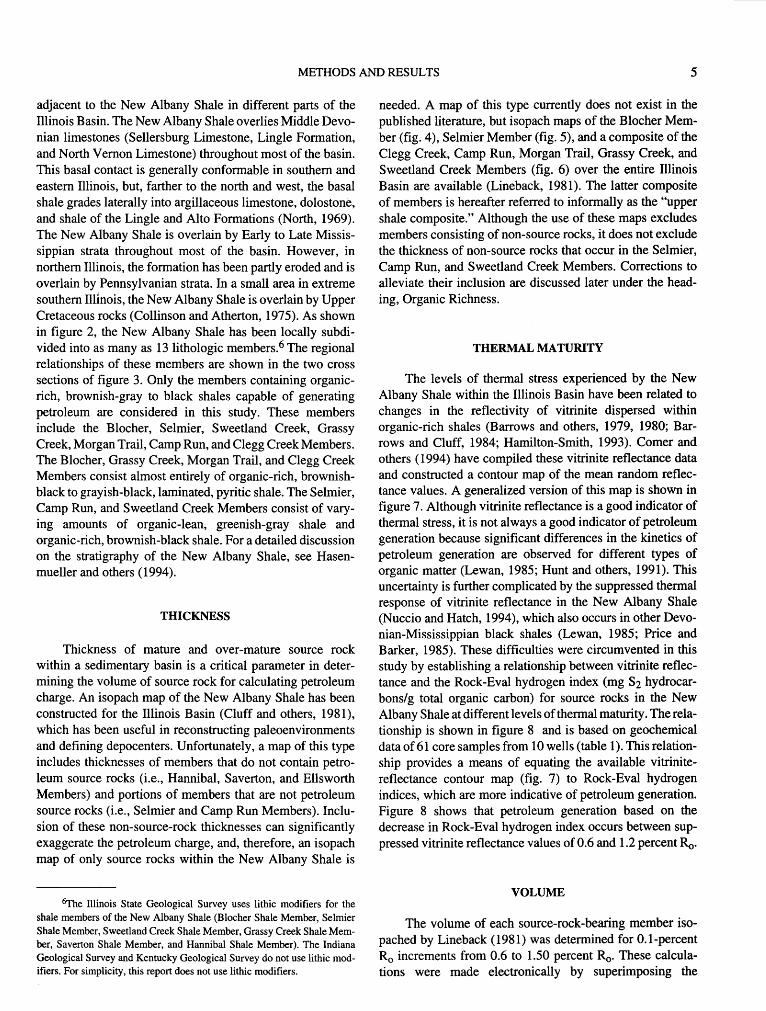
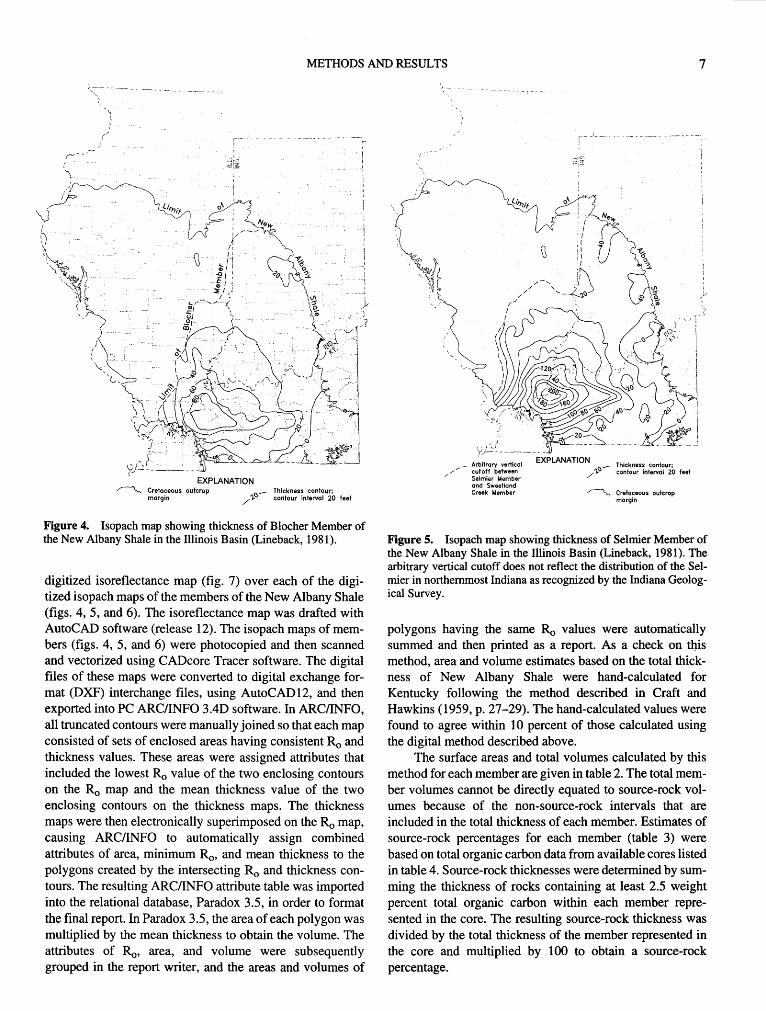
needed. A map of this type currently does not exist in the published literature, but isopach maps of the Blocher Member (fig. 4), Selmier Member (fig. 5), and a composite of the Clegg Creek, Camp Run, Morgan Trail, Grassy Creek, and Sweetland Creek Members (fig. 6) over the entire Illinois Basin are available (Lineback, 1981). The latter composite of members is hereafter referred to informally as the "upper shale composite." Although the use of these maps excludes members consisting of non-source rocks, it does not exclude the thickness of non-source rocks that occur in the Selmier, Camp Run, and Sweetland Creek Members. Corrections to alleviate their inclusion are discussed later under the heading, Organic Richness.
THERMAL MATURITY
The levels of thermal stress experienced by the New Albany Shale within the Illinois Basin have been related to changes in the reflectivity of vitrinite dispersed within organic-rich shales (Barrows and others, 1979, 1980; Barrows and Cluff, 1984; Hamilton-Smith, 1993). Comer and others (1994) have compiled these vitrinite reflectance data and constructed a contour map of the mean random reflectance values. A generalized version of this map is shown in figure 7. Although vitrinite reflectance is a good indicator of thermal stress, it is not always a good indicator of petroleum generation because significant differences in the kinetics of petroleum generation are observed for different types of organic matter (Lewan, 1985; Hunt and others, 1991). This uncertainty is further complicated by the suppressed thermal response of vitrinite reflectance in the New Albany Shale (Nuccio and Hatch, 1994), which also occurs in other Devonian-Mississippian black shales (Lewan, 1985; Price and Barker, 1985). These difficulties were circumvented in this study by establishing a relationship between vitrinite reflectance and the Rock-Eval hydrogen index (mg S2 hydrocarbons/g total organic carbon) for source rocks in the New Albany Shale at different levels of thermal maturity. The relationship is shown in figure 8 and is based on geochemical data of 61 core samples from 10 wells (table 1). This relationship provides a means of equating the available vitrinitereflectance contour map (fig. 7) to Rock-Eval hydrogen indices, which are more indicative of petroleum generation. Figure 8 shows that petroleum generation based on the decrease in Rock-Eval hydrogen index occurs between suppressed vitrinite reflectance values of 0.6 and 1.2 percent Ro.
VOLUME
The volume of each source-rock-bearing member isopached by Lineback (1981) was determined for 0.1-percent R0 increments from 0.6 to 1.50 percent Ro. These calculations were made electronically by superimposing the

6 MATERIAL-BALANCE ASSESSMENT OF PETROLEUM, NEW ALBANY SHALE, ILLINOIS BASIN
A
m ft
30LOO 20
10 50 50 mi
0 50 km
B
Chouteau Ls.
EXPLANATION
S Fossiliferous limestone
Ell Bioturbated mudstone
C Indistinctly bedded and poorly laminated shale
f_--.:J Finely laminated shale
fi:J Calcareous shale
10
18
Rockford Ls.
A'
B'
Figure 3. Northwest-southeast (A-A') and west-east (B-B') stratigraphic cross sections of the New Albany Shale showing regional relations among members (modified from Cluff and others, 1981, and Devera and Hasenmueller, 1990). Fm., Formation; Gp., Group; J.C., Jacobs Chapel; Ls., Limestone; Mbr., Member; Slts., Siltstone; Ss., Sandstone. Numbers indicate wells along line of section.
METHODS AND RESULTS 7
- - ~--'- - - ~ -- ---, r
_ Thickness contour; / 'l.l) contour interval 20 feet
Figure 4. Isopach map showing thickness of Blocher Member of the New Albany Shale in the Illinois Basin (Lineback, 1981).
digitized isoreflectance map (fig. 7) over each of the digitized isopach maps of the members of the New Albany Shale (figs. 4, 5, and 6). The isoreflectance map was drafted with AutoCAD software (release 12). The isopach maps of members (figs. 4, 5, and 6) were photocopied and then scanned and vectorized using CADcore Tracer software. The digital files of these maps were converted to digital exchange format (DXF) interchange files, using AutoCAD12, and then exported into PC ARC/INFO 3.4D software. In ARC/INFO, all truncated contours were manually joined so that each map consisted of sets of enclosed areas having consistent Ro and thickness values. These areas were assigned attributes that included the lowest Ro value of the two enclosing contours on the Ro map and the mean thickness value of the two enclosing contours on the thickness maps. The thickness maps were then electronically superimposed on the Ro map, causing ARC/INFO to automatically assign combined attributes of area, minimum Ro. and mean thickness to the polygons created by the intersecting Ro and thickness contours. The resulting ARC/INFO attribute table was imported into the relational database, Paradox 3.5, in order to format the final report. In Paradox 3.5, the area of each polygon was multiplied by the mean thickness to obtain the volume. The attributes of Ro, area, and volume were subsequently grouped in the report writer, and the areas and volumes of
_ Arbitrary vertical EXPLANATION .-- Thickness contour; .// ~~~~~:r b~~w~~~r / 'l.l) contour interval 20 feet
and Sweetland Creek Member ~ Cretaceous outcrop
margin
Figure 5. Isopach map showing thickness of Selmier Member of the New Albany Shale in the Illinois Basin (Lineback, 1981). The arbitrary vertical cutoff does not reflect the distribution of the Selmier in northernmost Indiana as recognized by the Indiana Geological Survey.
polygons having the same Ro values were automatically summed and then printed as a report. As a check on tl)is method, area and volume estimates based on the total thickness of New Albany Shale were hand-calculated for Kentucky following the method described in Craft and Hawkins (1959, p. 27-29). The hand-calculated values were found to agree within 10 percent of those calculated using the digital method described above.
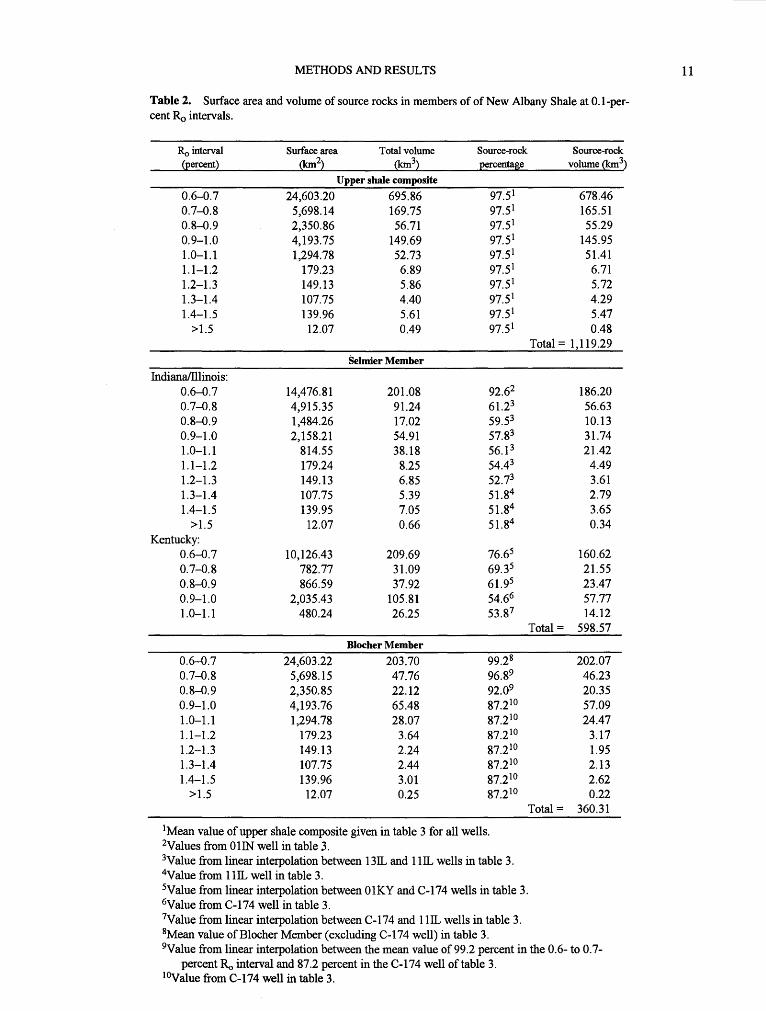
The surface areas and total volumes calculated by this method for each member are given in table 2. The total member volumes cannot be directly equated to source-rock volumes because of the non-source-rock intervals that are included in the total thickness of each member. Estimates of source-rock percentages for each member (table 3) were based on total organic carbon data from available cores listed in table 4. Source-rock thicknesses were determined by summing the thickness of rocks containing at least 2.5 weight percent total organic carbon within each member represented in the core. The resulting source-rock thickness was divided by the total thickness of the member represented in the core and multiplied by 100 to obtain a source-rock percentage.

8 MATERIAL-BALANCE ASSESSMENT OF PETROLEUM, NEW ALBANY SHALE, ILLINOIS BASIN
Figure 6. Isopach map showing thickness of the ''upper shale composite," which consists of the thickness of the Sweetland Creek and Grassy Creek Members of the New Albany Shale west of the limit of the Selmier Member, the thickness of the Grassy Creek Member only where the Selmier Member is recognized in Illinois and Kentucky, and the combined thickness of the Morgan Trail, Camp Run, and Clegg Creek Members of the New Albany Shale in Indiana (Lineback, 1981). The arbitrary vertical cutoff does not reflect the distribution of the Selmier in northernmost Indiana as recognized by the Indiana Geological Survey.
As shown in table 3, the composite of upper shale members has a narrow range of source-rock percentages from 92 to 100 percent, with no systematic change between vitrinite reflectances of 0.44 and 0.95 percent Ro· The mean sourcerock percentage of 97.5 percent obtained from these cores was used for all of the upper shale composite to determine volume of source rock in this mapped unit as shown in table 2. The total calculated volume of source rock in this upper shale composite is 1,119 km3, with more than 60 percent of this volume occurring in the 0.6- to 0.7-percent Ro interval (table 2). Inclusion of the non-source rocks of the Sweetland Creek Member in this upper shale composite does not influence these source-rock volumes because this member only occurs at vitrinite reflectance levels of less than 0.6 percent Ro. The Blocher Member also has a narrow range of sourcerock percentages from 98 to 100 percent from vitrinite reflectances of 0.44 to 0.70 percent Ro (table 3). A mean of
in value
Figure 7. Isoreflectance contour map based on random reflectance measurements of vitrinite in the New Albany Shale (modified from Comer and others, 1994).
99.2 percent was calculated for this range of source-rock percentages and was used to determine the volume of source rock in the Blocher Member for the 0.6- to 0.7-percent Ro interval (table 2). The lower source-rock percentage in the cored Blocher Member of the C-174 well was used to calculate the volume of source rock at vitrinite reflectance intervals greater than 0.9 percent Ro (table 2). Source-rock percentages for the 0.7- to 0.8- and 0.8- to 0.9-percent Ro intervals were estimated by interpolating between the 99.2 percent of the 0.6- to 0.7-percent Ro interval and the 87.2 percent of the 0.9- to 1.0-percent Ro interval. Midpoint reflectance values (i.e., 0.75 and 0.8 percent Ro) for the two intermediate vitrinite-reflectance intervals were used in this linear interpolation to derive the source-rock percentages given in table 2. The resulting total source-rock volume for the Blocher Member is 360 km3 (table 2), with 56 percent of this total occurring in the 0.6- to 0.7-percent Ro interval.
Estimating the source-rock percentage of the Selmier Member is more complicated because of the large variations in amount of non-source rocks and the limited data. Table 3 shows the source-rock percentage varies from 2 to 93 percent, and the mean value of 55 percent would not accurately represent the entire member. A more representative approach was used by estimating source-rock percentages

METHODS AND RESULTS 9
E ~()
><O WI-
700
600
~~ 500 ---
zti: w<!J <!Ja: ow a: a.. 400 0() >-I ICJ) _J~ <(<(
~ ffi 300 ~()-J o::! a:~
~ 200
100
Petroleum generation and expulsion
a~._~~~--~._~~~--~._~~~~
0.3 0.5 0.7 0.9 1.1 1.3 1.5 1.7
VITRINITE REFLECTANCE, IN PERCENT Ro
Figure 8. Emperical relationship between mean Rock~Eval hy~ drogen indices (HI) and mean random vitrinite reflectances (% Ro) from core samples of New Albany Shale at different levels of thermal maturity within the Illinois Basin (see table 1). The relationship from a vitrinite reflectance of 0.5 to 0.95 is described by the expression: H1=6,558xexp(-4.27x% Ro), and the relationship from a vitrinite reflectance of 0.95 to 1.65 is described by the expression: Hl=154.69(% Ro)2-472.92(% Ro)+424.36. HC, hydrocarbons; Tocm, total organic carbon of of mature and over-mature source rocks. Vertical bars indicate one standard deviation.
for the Selmier Member in Illinois and Indiana from cores in the OliN, 13IL, and 1liL wells and in Kentucky from cores in the 01KY, C-174, and 1liL wells. In Illinois and Indiana, the source-rock percentage of 92.6 percent (table 2) for the 0.6- to 0.7-percent Ro interval is based on the value derived from the OliN core (table 3). Source-rock percentages for the vitrinite reflectance intervals between 0.7 and 1.3 percent Ro in Illinois and Indiana are derived from a linear interpolation between values from cores in wells 13IL and 1liL. The interpolated values were determined for the midpoint vitrinite reflectance values of each interval (i.e., 0.75, 0.85, 0.95, 1.05, 1.15, and 1.25 percent Ro), and the resulting sourcerock percentages of the vitrinite reflectance intervals higher than 1.3 percent Ro are kept constant at 51.8 percent on the basis of the 1liL core.
The source-rock percentages for the Selmier Member in Kentucky are calculated in a similar manner, but with core data from wells 01KY, C-174, and 1liL (table 3). Values in table 3 for midpoints of vitrinite reflectance intervals between 0.6 and 0.9 percent Ro are derived by a linear interpolation between core data of wells 01KY and C-174. The source-rock percentage of 54.6 percent of the C-174 core is used for the 0.9- to 1.0-percent Ro interval. The value of 53.8 percent for the 1.0- to 1.1-percent Ro interval is derived from an interpolation between values from wells C-174 and 1liL. The total volume of source rock in the Selmier Member in all three States is 599 km3 (table 2), with 58 percent of the total occurring in the 0.6- to 0.7-percent Ro interval. The interpolations used to determine the source-rock percentage of the Selmier Member rely on a positive relationship between source-rock thickness and thermal maturity. Although a general relationship of this type is observed by comparing rock thickness in figure 5 with thermal maturity in figure 7, the relationship is not a simple linear relationship as assumed in these interpolations. More work is needed to better constrain these sourcerock percentages, but, based on available data, these values represent the best estimates currently available.
ORGANIC RICHNESS
More than 90 volume percent of the organic matter in source rocks of the New Albany Shale consists of oil-prone, amorphous, type-II kerogen (Barrows and Cluff, 1984). The amount of organic matter within the source rocks is most readily expressed as weight percent of total organic carbon (TOC). Cores from six wells were used to determine a weighted mean TOC value for source rocks in each member. These cores represent complete sections and were sampled in sufficient detail to provide representative weighted means, which are given in table 4. The means were weighted with respect to the thickness of source rock represented by the sample analyzed for TOC. The low thermal maturity level ( <0.6 percent Ro) of these cores ensures that no significant loss of organic carbon has occurred due to expulsion of generated petroleum or natural gas. The remaining challenge is how to project these weighted TOC means into the higher thermal maturity levels of the basin where organic carbon is reduced due to expulsion of petroleum and natural gas and where source-rock thicknesses may increase by two-fold (table 3).
Two simple models for determining the original TOC content of the thermally mature and over-mature source rocks were used in this study. These two models are considered to represent end members, with the original TOC content most likely occurring somewhere between them. The first model assumes that the amount of organic matter deposited and preserved in source rocks remained constant during the deposition of the source rocks over the entire

10 MATERIAL-BALANCE ASSESSMENT OF PETROLEUM, NEW ALBANY SHALE, ILLINOIS BASIN
Table 1. Summary of TOC and Rock-Eval data on cores of New Albany Shale representing different levels of thermal maturity in the Illinois Basin.
[Mean and standard deviation are given for TOC and Rock-Eval data. Ro. mean random vitrinite reflectance; TOC, total organic carbon; Rx, rock; wt. %, weight percent. See text under heading of Rock-Eva! Pyrolysis for definition of S1 and S2 hydrocarbons]
Wells Number of l~ TOC S1 hydrocarbons s2 hydrocarbons Hydrogen index included• samples (percent) (wt. %Rx) (mg/gRx) (mg/gRx) (mgS2ffOC)
SDH-305, SDH-308 SDH-309, 02IL 30 0.54 7.07± 3.96 1.75±0.52 42.25±21.33 621.6±98.3
OllN, C-219 10 0.62 4.66±2.30 1.29±0.81 24.05±9.14 528.8±81.7
13IL 5 0.70 4.26±1.24 1.44±0.30 13.10±4.22 304.2±34.7
C-174 9 0.95 4.16±1.46 0.30±0.17 4.76±1.72 114.7±17.6
11IL 2 1.30 5.48±2.00 0.59±0.24 4.00±1.67 71.0±5.0
RM 5 1.65 6.91±1.44 0.34±0.11 4.66±1.65 65.2±8.8
• SDH-305, Indiana Geological Survey No. 305, Jackson Co., Indiana. SDH-308, Indiana Geological Survey No. 308, Harrison Co., Indiana. SDH-309, Indiana Geological Survey No. 309, Floyd Co., Indiana. 02IL, Tristar Production No. ID, Lancaster, Effmgham Co., illinois. OliN, Phegley Farms No. I, Sullivan Co., Indiana. C-219, Canton Rock Quarry, Trigg Co., Kentucky. 131L, Gordon T. Jenkins No. 1 Simpson, Wayne Co., illinois. C-174, Sheridan Target D.D.H. 66ST-4, Crittenden Co., Kentucky. 111L, Rector & Stone No. 1 Missouri Portland Cement, Hardin Co., illinois. RM, Rose Mineral Exploration, Hardin Co., illinois.
basin, and the thickening of source rocks is the result of increased input of inorganic components. This dilution model predicts that the weighted mean TOC content of a source rock would decrease proportionally to increases in thickness of a source rock. The second model assumes that the amount of organic matter deposited and preserved in a source rock maintains constant proportionality with input of inorganic components. This steady-state model predicts that the weighted mean TOC content of a source rock would remain constant irrespective of changes in the thickness of a source rock.
The dilution model requires determining the fixed mass of organic carbon deposited and preserved beneath a surfacearea unit of each source-rock member. Table 4 gives the calculated mass of organic carbon per square meter of sourcerock surface area for each source-rock member in the thermally immature wells. The bulk-rock densities (PRx) needed for this determination were calculated from a linear relationship established between TOC values and bulk-rock densities measured on six immature samples of New Albany Shale, with TOC values ranging from 2.46 to 14.34 weight percent and bulk densities ranging from 2.15 to 2.37 Mg/m3. Using the relationship, PRx=-0.018(TOC)+2.40, mean bulkrock densities were determined from the weighted mean TOC values of each member represented in the well cores (table 4). Multiplying these mean bulk densities by the thickness of source rock yields the mass of source rock
beneath 1 m2 of surface area for the source-rock members in each well. The mass of organic carbon deposited and preserved beneath 1 m2 of surface area may then be determined by multiplying the source-rock mass per square meter by the decimal fraction of the weighted mean TOC content. Large standard deviations (table 4) indicate that the assumption of this model is questionable and the use of mean values is difficult to justify. An alternative is to use TOC mass/area units from a thermally immature well that is nearest to the thermally maturing depocenter. The well used for this purpose was 01 KY, which is less than 1 km from an isoreflectance contour of 0.6 percent Ro and 72 km from an isoreflectance contour of 1.0 percent Ro. The calculated values of TOC mass/area for this well are 0.82, 2.38, and 4.17 Mg/m2
for the Blocher, Selmier, and upper shale composite members, respectively (table 4). Multiplying these values by the surface areas given for each member at 0.1-percent Ro intervals (table 2) gives, according to this model, the original TOC mass of thermally mature and over-mature source rocks (table 5).
The steady-state model requires determining the mean mass of organic carbon deposited and preserved within a volume unit of source rock. Figure 9 shows the relationship between mass of TOC/surface area and thickness of source rock. A lineru: regression of these data from tables 3 and 4 gives a slope of 197.7 kg ofTOC per cubic meter of source rock and a near-zero intercept for all source-rock members.
METHODS AND RESULTS
Table 2. Surface area and volume of source rocks in members of of New Albany Shale at 0.1-per-cent Ro intervals.
Ro interval Surface area Total volume Source-rock {Eercent2 (km22 (km32 ~ercentaGe
Upper shale composite
0.6-0.7 24,603.20 695.86 97.51
0.7-0.8 5,698.14 169.75 97.51
0.8-0.9 2,350.86 56.71 97.51
0.9-1.0 4,193.75 149.69 97.51
1.0-1.1 1,294.78 52.73 97.51
1.1-1.2 179.23 6.89 97.51
1.2-1.3 149.13 5.86 97.51
1.3-1.4 107.75 4.40 97.51
1.4-1.5 139.96 5.61 97.51
>1.5 12.07 0.49 97.51
Selmier Member
fudianallllinois: 0.6-0.7 14,476.81 201.08 92.62
0.7-0.8 4,915.35 91.24 61.23
0.8-0.9 1,484.26 17.02 59.53
0.9-1.0 2,158.21 54.91 57.83
1.0-1.1 814.55 38.18 56.1 3
1.1-1.2 179.24 8.25 54.43
1.2-1.3 149.13 6.85 52.73
1.3-1.4 107.75 5.39 51.84
1.4-1.5 139.95 7.05 51.84
>1.5 12.07 0.66 51.84
Kentucky: 0.6-0.7 10,126.43 209.69 76.65
0.7-0.8 782.77 31.09 69.35
0.8-0.9 866.59 37.92 61.95
0.9-1.0 2,035.43 105.81 54.66
1.0-1.1 480.24 26.25 53.87
Blocher Member
0.6-0.7 24,603.22 203.70 99.28
0.7-0.8 5,698.15 47.76 96.89
0.8-0.9 2,350.85 22.12 92.09
0.9-1.0 4,193.76 65.48 87.210
1.0-1.1 1,294.78 28.07 87.210
1.1-1.2 179.23 3.64 87.210
1.2-1.3 149.13 2.24 87.210
1.3-1.4 107.75 2.44 87.210
1.4-1.5 139.96 3.01 87.210
>1.5 12.07 0.25 87.210
1Mean value of upper shale composite given in table 3 for all wells. 2Values from OliN well in table 3. 3Value from linear interpolation between 13ll.- and I liT- wells in table 3. 4Value from I liT- well in table 3. 5Value from linear interpolation between Ol!<.Y and C-174 wells in table 3. 6Value from C-174 well in table 3. 7Value from linear interpolation between C-17 4 and I liT- wells in table 3. 8Mean value of Blocher Member (excluding C-174 well) in table 3.
Source-rock volume (km_3)
678.46 165.51 55.29
145.95 51.41 6.71 5.72 4.29 5.47 0.48
Total= 1,119.29
186.20 56.63 10.13 31.74 21.42
4.49 3.61 2.79 3.65 0.34
160.62 21.55 23.47 57.77 14.12
Total= 598.57
202.07 46.23 20.35 57.09 24.47
3.17 1.95 2.13 2.62 0.22
Total= 360.31
9Value from linear interpolation between the mean value of99.2 percent in the 0.6- to 0.7-percent Ro interval and 87.2 percent in the C-174 well of table 3.
10Value from C-174 well in table 3.
11

12 MATERIAL-BALANCE ASSESSMENT OF PETROLEUM, NEW ALBANY SHALE, ILLINOIS BASIN
Table 3. Thickness and percentage of source rock in members of New Albany Shale determined in available well cores.
[Mean value for source-rock percentage for Blocher Member does not include data for well C-174; Ro. mean random vitrinite reflectance]
Well Ro Total Source-rock Source-rock Source of name (percent) thickness (m) thickness (m) percentage data
Upper shale composite
SDH-308 0.44 22.11 21.75 98.4 SDH-273 0.46 18.03 17.96 99.6 A-ll 0.50 16.29 15.68 96.3 2
SDH-305 0.50 28.46 27.24 95.7 SDH-309 0.53 26.29 26.05 99.1 OlKY 0.56 22.17 20.47 92.3 3
OliN 0.63 25.96 25.22 97.1 13IL 0.70 40.66 40.66 100.0 3
C-174 0.95 36.11 35.81 99.2 4
Mean= 97.5
Sebnier Member
SDH-273 0.46 8.69 3.48 40.0 SDH-305 0.50 4.70 0.09 1.9 OlKY 0.56 16.41 13.66 83.2 3
OliN 0.63 9.03 8.36 92.6 13IL 0.70 18.85 11.71 62.1 3
C-174 0.95 62.53 34.16 54.6 4
lliL 1.30 53.50 27.72 51.8 3
Mean= 55.2
Blocher Member
SDH-308 0.44 4.82 4.82 100.0 SDH-273 0.46 4.97 4.94 99.4 A-ll 0.50 3.48 3.48 100.0 2
SDH-305 0.50 3.66 3.60 98.4 SDH-309 0.53 5.12 5.06 98.8 OlKY 0.56 5.82 5.75 98.8 OliN 0.63 3.23 3.17 98.1 I
13IL 0.70 8.78 8.78 100.0 3
Mean= 99.2 C-174 0.95 14.03 12.23 87.2 4
1Nancy Hasenmueller, Indiana Geological Survey. 2Thomas Robl, Center for Applied Energy Research, University of Kentucky. 3Cluff and others (1981) and Frost (1980). 4John W. Smith, Laramie Petroleum Research Center.
This slope may be equated to a mean TOC content of 8.82 weight percent with a bulk-rock density of 2.24 Mg/m3 for all the source rocks in the New Albany Shale. Multiplying this slope value by the source-rock volumes given for each member at 0.1-percent Ro intervals (table 2) gives, according to this model, the original TOC mass in the mature and overmature source rocks (table 5). Comparison of results from both models (table 5) shows the TOC mass determined by the steady-state model is 44 percent greater than that determined by the dilution model.
A model predicting an increase in TOC content of the source rocks as the New Albany Shale thickens into the depocenter was not considered likely on the basis of available
data and analogous studies of source rocks in other basins. A significant portion of this thickening is a result of an increase in thickness of greenish or olive-gray, organic-lean shales as described in cores from wells lliL and 13IL (Cluff and others, 1981). This increase in non-source rocks is especially obvious in the Selmier Member, as suggested by the thicknesses of indistinctly bedded and poorly laminated shales in the cross sections of figure 3. These rocks are typically partially bioturbated and are considered not to represent periods of anoxic conditions within the basin (Cluff, 1980). In addition, thickening of Devonian-Mississippian source rocks around the Findlay arch and in the western Appalachian Basin results in a decrease in their TOC contents. Robl and
METHODS AND RESULTS 13
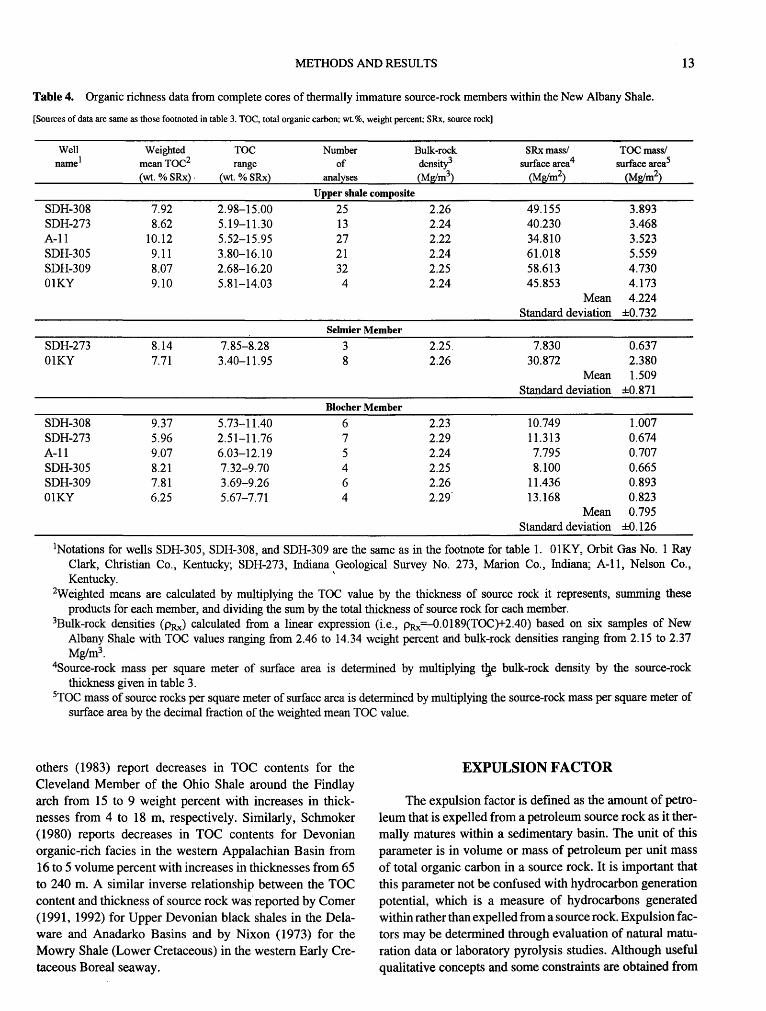
Table 4. Organic richness data from complete cores of thermally immature source-rock members within the New Albany Shale.
[Sources of data are same as those footnoted in table 3. TOC, total organic carbon; wt. %, weight percent; SRx, source rock]
Well Weighted TOC Number Bulk-rock SRxmass/ TOCmass/ name1 mean TOC2 range of densitY surface area4 surface area5
(wt. %SRx) · (wt. %SRx) analyses (Mglm3) (Mg/m2) (Mg/m2)
Upper shale composite
SDH-308 7.92 2.98-15.00 25 2.26 49.155 3.893 SDH-273 8.62 5.19-11.30 13 2.24 40.230 3.468 A-ll 10.12 5.52-15.95 27 2.22 34.810 3.523 SDH-305 9.ll 3.80-16.10 21 2.24 61.018 5.559 SDH-309 8.07 2.68-16.20 32 2.25 58.613 4.730 01KY 9.10 5.81-14.03 4 2.24 45.853 4.173
Mean 4.224 Standard deviation ±0.732
Selmier Member
SDH-273 01KY
8.14 7.71
7.85-8.28 3.40-11.95
3 2.25. 8 2.26
7.830 0.637 30.872 2.380
Mean 1.509 Standard deviation ±0.871
Blocher Member
SDH-308 9.37 5.73-11.40 6 2.23 10.749 1.007 SDH-273 5.96 2.51-11.76 7 2.29 11.313 0.674 A-ll 9.07 6.03-12.19 5 2.24 7.795 0.707 SDH-305 8.21 7.32-9.70 4 2.25 8.100 0.665 SDH-309 7.81 3.69~9.26 6 2.26 11.436 0.893 01KY 6.25 5.67-7.71 4 2.29" 13.168 0.823
Mean 0.795 Standard deviation ±0.126
1Notations for wells SDH-305, SDH-308, and SDH-309 are the same as in the footnote for table 1. 01KY, Orbit Gas No. 1 Ray Clark, Christian Co., Kentucky; SDH-273, fudiana Geological Survey No. 273, Marion Co., fudiana; A-11, Nelson Co., Kentucky. '
2Weighted means are calculated by multiplying the TOC value by the thickness of source rock it represents, summing these products for each member, and dividing the sum by the total thickness of source rock for each member.
3Bulk-rock densities (PRx) calculated from a linear expression (i.e., PRx=-0.0189(TOC)+2.40) based on six samples of New Albany Shale with TOC values ranging from 2.46 to 14.34 weight percent arid bulk-rock densities ranging from 2.15 to 2.37 Mg/m3.
4Source-rock mass per square meter of surface area is determined by multiplying ~e bulk-rock density by the source-rock thickness given in table 3.
5TOC mass of source rocks per square meter of surface area is determined by multiplying the source-rock mass per square meter of surface area by the decimal fraction of the weighted mean TOC value.
others (1983) report decreases in TOC contents for the Cleveland Member of the Ohio Shale around the Findlay arch from 15 to 9 weight percent with increases in thicknesses from 4 to 18 m, respectively. Similarly, Schmoker ( 1980) reports decreases in TOC contents for Devonian organic-rich facies in the western Appalachian Basin from 16 to 5 volume percent with increases in thicknesses from 65 to 240 m. A similar inverse relationship between the TOC content and thickness of source rock was reported by Comer (1991, 1992) for Upper Devonian black shales in the Delaware and Anadarko Basins and by Nixon (1973) for the Mowry Shale (Lower Cretaceous) in the western Early Cretaceous Boreal seaway.
EXPULSION FACTOR
The expulsion factor is defined as the amount of petroleum that is expelled from a petroleum source rock as it thermally matures within a sedimentary basin. The unit of this parameter is in volume or mass of petroleum per unit mass of total organic carbon in a source rock. It is important that this parameter not be confused with hydrocarbon generation potential, which is a measure of hydrocarbons generated within rather than expelled from a source rock. Expulsion factors may be determined through evaluation of natural maturation data or laboratory pyrolysis studies. Although useful qualitative concepts and some constraints are obtained from

14 MATERIAL-BALANCE ASSESSMENT OF PETROLEUM, NEW ALBANY SHALE, ILLINOIS BASIN
Table 5. Mass of total organic carbon in New Albany Shale source rocks as determined by dilution and steady-state models.
[TOC, total organic carbon. SS, TOC mass for steady-state model; D, TOC mass for dilution model. Mbr, Member; Fm, Formation]
Ro interval (percent)
0.6-D.7 0.7-D.8 0.8-D.9 0.9-1.0 1.0-1.1 1.1-1.2 1.2-1.3 1.3-1.4 1.4-1.5
>1.5
Dilution model
T0Cmass1
(Tg)
Steady-state Percent model difference
TOC mass2 {[(SS/D)xl00)-100} (Tg)
Upper shale composite
102,595 134,132 23,761 32,721
9,803 10,931 17,488 28,854 5,399 10,164
747 1,327 622 1,131 449 848 584 1,081
50 95
31 38 12 65 88 78 82 89 85 90
"Mbr" total 161,498 221,284 37
0.6-D.7 0.7-D.8 0.8-D.9 0.9-1.0 1.0-1.1 1.1-1.2 1.2-1.3 1.3-1.4 1.4-1.5
>1.5
Mbrtotal
0.6-D.7 0.7-D.8 0.8-D.9 0.9-1.0 1.0-1.1 1.1-1.2 1.2-1.3 1.3-1.4 1.4-1.5
>1.5
Mbr total
Selmier Member
58,556 13,562 5,595 9,981 3,082
427 355 256 333 29
92,176
68,566 15,456 6,643
17,696 7,026
888 714 552 722 67
118,329 Blocher Member
20,175 4,672 1,928 3,439 1,062
147 122 88
115 10
31,758
39,950 9,140 4,023
11,288 4,837
627 385 420 518 44
Fm total 285,432
71,232
410,845
17 14 19 77
128 108 101 116 117 131
28
98 96
109 228 355 327 216 377 350 340
124
44
1Surface areas given in table 2 for the upper shale composite, Selmier, and Blocher Members are multiplied by 4.17, 2.38, and 0.82 Mg/m2, respectively.
2Source-rock volumes given in table 2 are multiplied by the 197.7x10⁶ Mglk:m3 slope derived from linear regression of data plotted in figure 9.
expulsion factors derived from natural maturation data (Momper, 1978; Jones, 1981), the vastness of sedimentary basins, limited subsurface data, _and dynamics of fluid flow
6.0
-a: cnw 5.0 llitij ~~(0 (.)W 0 -a: .... a: <C X 4.0 (.) ::> S2' :zog <(00 (.!J a: a: a:w w 3.0 oa.. u :X::(.) a: uo=> 01-0 a:(/)(/) 2.0 u:.~ ~ (.)a: ~~ Oz 1.0 (/)_
5 10 15 20 25 30
SOURCE-ROCK THICKNESS, IN METERS
Figure 9. Relationship between grams of total organic carbon (TOC) per square meter of source-rock surface area (table 4) and source-rock thickness, in meters (table 3), for thermally immature source rocks. Linear regression describes the relationship with a zero intercept and a slope of 197.7 kg TOC/m3 (correlation coefficient = 0.991 ).
over geological time make it unfeasible to obtain applicable quantitative concepts. Therefore, it becomes essential to employ laboratory pyrolysis methods that simulate the natural processes to develop a quantitative determination of expulsion factors. The two laboratory pyrolysis methods considered in this study are Rock-Eval pyrolysis and hydrous pyrolysis.
ROCK-EVAL PYROLYSIS
This open anhydrous-pyrolysis method typically consists of heating 50 to 150 mg of powdered rock in an oven that is continuously swept with flowing helium at low pressures (<138 kPa). The powdered rock is initially heated at a constant temperature between 250°C and 300°C for 3 to 5 minutes. The volatilized products that are released during this heating are swept with helium into a flame ionization detector for quantification of hydrocarbon content. These readily volatilized hydrocarbons are considered to be unbound to the organic matter within the rock and are designated as "S 1" hydrocarbons. Immediately following this initial isothermal heating, the powdered rock is heated at a rate of 25°C/min or 30°C/ min to a final temperature of 600°C, which is maintained for 1 minute. The pyrolyzed products that are generated during this heating are vaporized and swept with helium into a flame ionization detector for quantification of hydrocarbon content. These pyrolyzed hydrocarbons are considered to be bound to the organic matter within the rock and are designated as "S2" hydrocarbons.

METHODS AND RESULTS 15
Although vaporization of generated hydrocarbons by this pyrolysis method has no resemblance to natural conditions under which petroleum is generated and expelled in sedimentary basins (Lewan, 1993, 1994), it has been successfully used to provide rapid evaluations of the relative hydrocarbon potential and thermal maturity of source rocks (Bordenave and others, 1993). Cooles and others (1986) extended these routine screening applications of Rock-Eval pyrolysis to determine expulsion factors of source rocks for direct application in petroleum material-balance studies within sedimentary basins (e.g., Mackenzie and Quigley, 1988; MacGregor and McKenzie, 1987). The central assumption in this algebraic scheme is that a fixed fraction of organic carbon cannot be vaporized as S 1 and S2 hydrocarbons by Rock-Eval pyrolysis irrespective of the thermal maturity of a source rock. This inactive organic carbon is referred to as being "inert." Another assumption in this approach is that gas generation is sufficiently negligible during petroleum formation to allow hydrocarbon yields to be equated to petroleum yields (Cooles and others, 1986). This approach requires determination of total, pyrolyzed, and volatilized organic carbon in immature and mature source rocks. The volatilized and pyrolyzed organic carbon (Ct and C2, respectively) are determined respectively by multiplying the St and S2 hydrocarbons from Rock-Eval pyrolysis by 0.85, which is an approximation of the carbon fraction of petroleum (Cooles and others, 1986). Inert organic carbon (CI) is calculated by subtracting the sum of Ct and C2 from the total organic carbon (TOC) of a source rock. An "o" superscript is used to denote organic carbon from immature source rocks that have not lost organic carbon due to petroleum or natural gas expulsion. An "m" superscript is used to denote organic carbon from mature or over-mature source rocks that have lost organic carbon due to petroleum or natural gas expulsion. All of these organic carbon values are in units of grams of carbon per gram of source rock (g C/g Rx).
The first step in this approach is to determine the fraction of total organic carbon that occurs as inert organic carbon in the immature source rock (i.e., X1°), which is determined by the expression:
0 TOC0
- (C2°+C1°) XI=------
TOC0 (1)
The assumption that this fraction of inert organic carbon remains constant with increasing thermal maturity (i.e., xlo = xim) allows the calculation of the original total organic carbon of the immature equivalent of a mature source rock (TOC0 m) by the expression:
(2)
The difference between the total organic carbon calculated for the original source rock (TOC0 m) and measured on the mature source rock (TOCm) is considered the amount of organic carbon lost from the mature source rock as a result of hydrocarbon expulsion. This quantity may be divided by the original total organic carbon of the mature source rock (TOC0 m) to determine the grams of expelled carbon per gram of original total organic carbon of the source rock. Dividing this quantity by the carbon fraction of petroleum (0.85) gives an expulsion factor in grams of petroleum expelled from a mature source rock per gram of original total organic carbon in its original immature state (g HC/g TOC0 m).
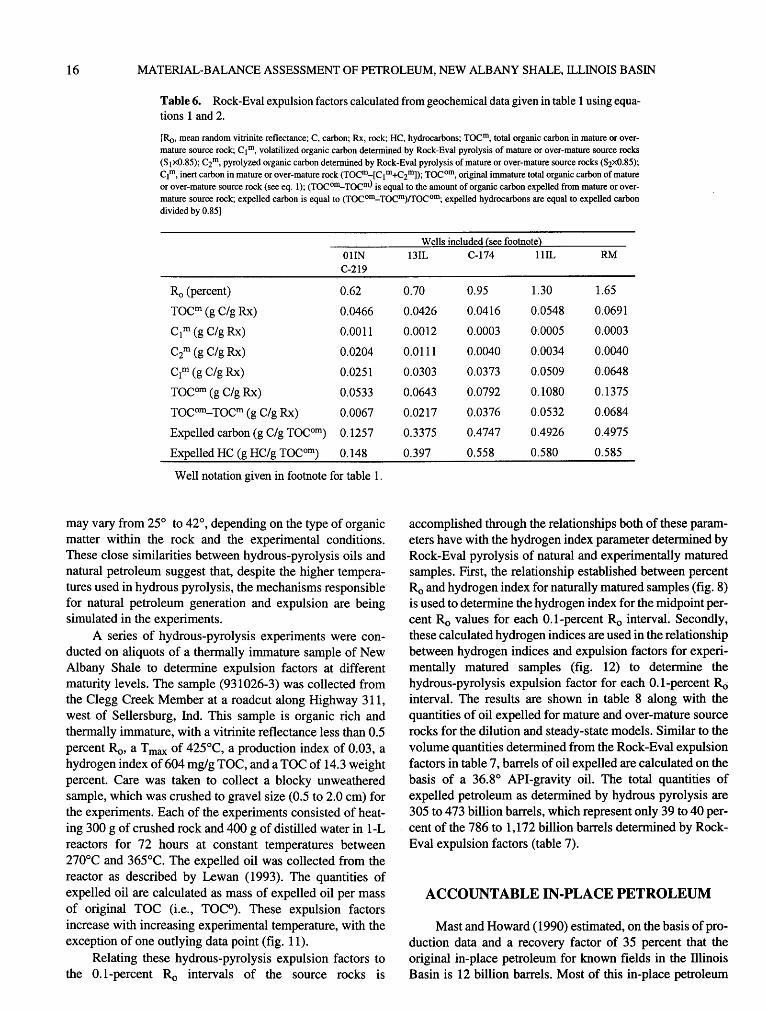
This approach is applied to the mean values of the natural data set given in table 1. The fraction of inert organic carbon (X1°) is calculated by equation 1 to be 0.4712. This value is used to calculate the original total organic carbon of the mature and over-mature source rocks using equation 2. The resulting Rock-Eval expulsion factors are given in table 6. The relation between these expulsion factors and hydrogen indices may be described by a second-degree polynomial as shown in figure 10. This expression and the relation between percent Ro values and hydrogen indices in figure 9 allow the calculation of expulsion factors for the midpoint values for each 0.1-percent Ro interval. Results of this operation and the calculated quantities of expelled hydrocarbons for the dilution and steady-state models are given in table 7. Assuming that the expelled hydrocarbons measured by Rock-Eval pyrolysis are similar to petroleum produced in the Illinois Basin, barrels of expelled petroleum are calculated on the basis of an API gravity of 36.8° (Mast, 1970). The dilution and steady-state models respectively predict 786 and 1,172 billion barrels of petroleum were expelled from source rocks in the New Albany Shale.
HYDROUS PYROLYSIS
This closed pyrolysis method typically consists of heating 300 to 500 g of rock chips (0.5 to 2.0 em) in the presence of liquid water in a 1-L reactor at a constant temperature between 250°C and 365°C for 3 to 6 days (Lewan, 1993). Internal pressures are a result of water vapor and generated gases within the headspace of the reactor and may range from 10 to more than 20 MPa, depending on the experimental temperature, organic richness of sample, and heating duration. If the rock sample is a potential source rock and the experimental time and temperature conditions are sufficient, a free-flowing liquid oil is expelled from the rock and accumulates on the surface of the water within the reactor (Lewan, 1985; Huizinga and others, 1988; Peters and others, 1990; Baskin and Peters, 1992). This expelled oil has a gross, molecular, and isotopic composition similar to natural petroleum (Lewan, 1983, 1993; Peters and others, 1990; Lewan and others, 1978, 1983). API gravities of these oils
16 MATERIAL-BALANCE ASSESSMENT OF PETROLEUM, NEW ALBANY SHALE, ILLINOIS BASIN
Table 6. Rock-Eval expulsion factors calculated from geochemical data given in table 1 using equa
tions 1 and 2.
[Ro, mean random vitrinite reflectance; e, carbon; Rx, rock; He, hydrocarbons; Tocm, total organic carbon in mature or overmature source rock; elm, volatilized organic carbon determined by Rock-Eval pyrolysis of mature or over-mature source rocks (SI x0.85); e2m, pyrolyzed organic carbon determined by Rock-Eval pyrolysis of mature or over-mature source rocks (S2x0.85); elm, inert carbon in mature or over-mature rock (Tocm-[e 1 m+C2mD; Toe om, original immature total organic carbon of mature or over-mature source rock (see eq. 1 ); (Toe om_ Toem) is equal to the amount of organic carbon expelled from mature or overmature source rock; expelled carbon is equal to (TOe om_ TOCm)rrOe0 m; expelled hydrocarbons are equal to expelled carbon divided by 0.85]
OliN C-219
R 0 (percent) 0.62
Tocm (g C/g Rx) 0.0466
elm (g C/g Rx) 0.0011
C2m (g C/g Rx) 0.0204
cr(g C/gRx) 0.0251
Tocom (g C/g Rx) 0.0533
Tocom_ Tocm (g C/g Rx) 0.0067
Expelled carbon (g C/g TOC0 m) 0.1257
Expelled HC (g HC/g TOC0 m) 0.148
Well notation given in footnote for table 1.
may vary from 25° to 42°, depending on the type of organic matter within the rock and the experimental conditions. These close similarities between hydrous-pyrolysis oils and natural petroleum suggest that, despite the higher temperatures used in hydrous pyrolysis, the mechanisms responsible for natural petroleum generation and expulsion are being simulated in the experiments.
A series of hydrous-pyrolysis experiments were conducted on aliquots of a thermally immature sample of New Albany Shale to determine expulsion factors at different maturity levels. The sample (931026-3) was collected from the Clegg Creek Member at a roadcut along Highway 311, west of Sellersburg, Ind. This sample is organic rich and thermally immature, with a vitrinite reflectance less than 0.5 percent Ro, a T max of 425°C, a production index of 0.03, a hydrogen index of 604 mg/g TOC, and a TOC of 14.3 weight percent. Care was taken to collect a blocky unweathered sample, which was crushed to gravel size (0.5 to 2.0 em) for the experiments. Each of the experiments consisted of heating 300 g of crushed rock and 400 g of distilled water in 1-L reactors for 72 hours at constant temperatures between 270°C and 365°C. The expelled oil was collected from the reactor as described by Lewan (1993). The quantities of expelled oil are calculated as mass of expelled oil per mass of original TOC (i.e., TOC0
). These expulsion factors increase with increasing experimental temperature, with the exception of one outlying data point (fig. 11).
Relating these hydrous-pyrolysis expulsion factors to the 0.1-percent Ro intervals of the source rocks is
Wells included (see footnote)
13IL C-174 lliL RM
0.70 0.95 1.30 1.65
0.0426 0.0416 0.0548 0.0691
0.0012 0.0003 0.0005 0.0003
0.0111 0.0040 0.0034 0.0040
0.0303 0.0373 0.0509 0.0648
0.0643 0.0792 0.1080 0.1375
0.0217 0.0376 0.0532 0.0684
0.3375 0.4747 0.4926 0.4975
0.397 0.558 0.580 0.585
accomplished through the relationships both of these parameters have with the hydrogen index parameter determined by Rock-Eval pyrolysis of natural and experimentally matured samples. First, the relationship established between percent Ro and hydrogen index for naturally matured samples (fig. 8) is used to determine the hydrogen index for the midpoint percentRo values for each 0.1-percent Ro interval. Secondly, these calculated hydrogen indices are used in the relationship between hydrogen indices and expulsion factors for experimentally matured samples (fig. 12) to determine the hydrous-pyrolysis expulsion factor for each 0.1-percent ·Ro interval. The results are shown in table 8 along with the quantities of oil expelled for mature and over-mature source rocks for the dilution and steady-state models. Similar to the volume quantities determined from the Rock-Eval expulsion factors in table 7, barrels of oil expelled are calculated on the basis of a 36.8° API-gravity oil. The total quantities of expelled petroleum as determined by hydrous pyrolysis are 305 to 473 billion barrels, which represent only 39 to 40 percent of the 786 to 1,172 billion barrels determined by RockEva! expulsion factors (table 7).
ACCOUNTABLE IN-PLACE PETROLEUM
Mast and Howard ( 1990) estimated, on the basis of production data and a recovery factor of 35 percent that the original in-place petroleum for known fields in the Illinois Basin is 12 billion barrels. Most of this in-place petroleum

METHODS AND RESULTS 17
0.6
~E 0.5 Oo 1-(.) (.)Q <CI-LL~ 0.4 Z<( Oa: (j)(!) ...Ja: =>w 0.3 O...o...
[;Su _.J: <Ccn >~ 0.2 ~~ (.)(!) Oz a:-
0.1
0.0 0 100 200 300 400 500 600 700
ROCK-EVAL HYDROGEN INDEX, IN MILLIGRAMS HC PER GRAM Tocm
Figure 10. Relationship between expulsion factors (EF) determined by Rock-Eval pyrolysis (table 6) and Rock-Eval hydrogen indices (HI) (table 1). The curve is defined by the expression: EF=0.616-43.26x1Q-5(HI)-88.68xlo-s(HI)2. HC, hydrocarbons; Tocom, original immature total organic carbon of mature and overmature source rocks; TOcm, total organic carbon of of mature and over-mature source rocks.
0.30
0.20
0.10 Original
unheated sample
0.00 ~
260 280 300 320 340 360 380
EXPERIMENTAL TEMPERATURE FOR 72 HOURS, IN DEGREES CELSIUS
Figure 11. Quantity of petroleum expelled from hydrous-pyrolysis experiments conducted isothermally at temperatures from 27\fC to 365°C for 72 hours with aliquots of a sample from Clegg Creek Member of the New Albany Shale. TOC0
, total organic carbon of immature source rocks.
occurs in reservoirs of Carboniferous age, with more than 60 percent occurring in Chesterian sandstones, 18 percent occurring in Valmeyeran sandstones, and 13 percent occurring in Pennsylvanian sandstones. Organic geochemical correlations indicate that more than 99 percent of the
en Ci5 ~0 ou ~ ~ 0.3 0...~ cn<C :>II: Q(!) a: a: ow ~ ~ 0.2
~5 _.en -~ 0<( oa: ~ (!) 0.1 ...JZ w-o... >< w
100 200 300 400 500 600 700
ROCK-EVAL HYDROGEN INDEX, IN MILLIGRAMS HC PER GRAM TOcom
Figure 12. Relationship between expulsion factors derived from hydrous pyrolysis (HPEE) and hydrogen index (HI) determined by Rock-Eval pyrolysis on rock recovered from the hydrous-pyrolysis experiments (fig. 11). The curve is described by the expression: HPEE=0.399-99.60xHr5(HI)+573.26xlo-9(HI)2. HC, hydrocarbons; TOC om, original immature total organic carbon of mature and over-mature source rocks; TOC 0 , total organic carbon of immature source rocks.
discovered in-place petroleum of the basin has been sourced by the New Albany Shale (Hatch and others, 1990).
In addition to free-flowing producible petroleum, tarsand deposits occur at or near the surface in various sandstones of Late Mississippian and Early Pennsylvanian age. These tar deposits are dispersed around the margins of the eastern Moorman syncline of western Kentucky and appear to be closely associated with faults, paleovalleys, and stratigraphic traps (Noger, 1987). Conventional oil production has been obtained locally from the same sandstones a few kilometers down-dip (Williams and others, 1982). Some of these deposits have local seeps that flow as much as 10 barrels per year (McGrain, 1976). Resource assessments of these deposits are classified as measured and speculative. Measured reserves are based on core analyses of tar encountered in wells, and speculative reserves are based on reported tar shows on drilling logs, occasional core analyses, and geological interpretations (Noger, 1987). Measured in-place tar has been determined to be 1. 73 billion barrels, and speculative in-place tar has been determined to be 1.68 billion barrels (Kuuslqaa, 1984; Crysdale and Schenk, 1988; Noger, 1987). These values give a total in-place tar of 3.41 billion barrels, which extends over 2,500 km2 of surface area and from the surface to a 183-m depth (Noger, 1987). No organic geochemical correlations have established the source rock for these tars, and opinions vary: Russell (1933) suggests that Late Mississippian marine shales are the source, and

18 MATERIAL-BALANCE ASSESSMENT OF PETROLEUM, NEW ALBANY SHALE, ILLINOIS BASIN
Table 7. Quantity of petroleum expelled from the New Albany Shale as determined by Rock-Eval expulsion factors.
[Ro, mean random vitrinite reflectance; HC, hydrocarbon; TOC, total organic carbon; bbl, barrel; Mbr, Member; Fm, Formation]
Rock-Eval Dilution model Steady-state model Ro interval expulsion Vaporized Expelled Vaporized Expelled (percent) factor1 hydrocarbons2 petroleum4 hydrocarbons3 petroleum4
(kg HC/Mg TOC) (Tg) (billion bbl) (Tg) (billion bbl)
Upper shale composite
0.6-0.7 290.62 29,816 223.07 38,981 291.63 0.7-0.8 437.44 10,394 77.76 14,313 107.08 0.8-0.9 513.91 5,038 37.69 5,617 42.03 0.9-1.0 555.04 9,706 72.62 16,015 119.82 1.0-1.1 565.23 3,052 22.83 5,745 42.98 1.1-1.2 573.09 428 3.20 760 5.69 1.2-1.3 578.95 360 2.69 655 4.90 1.3-1.4 582.86 262 1.96 494 3.70 1.4-1.5 585.06 341 2.55 633 4.73
>1.5 585.55 29 0.22 56 0.42 "Mbr" total 59,426 444.59 83,269 622.98
Selmier Member
0.6-0.7 290.62 17,017 127.31 19,926 149.08 0.7-0.8 437.44 5,932 44.38 6,761 50.58 0.8-0.9 513.91 2,875 21.51 3,414 25.54 0.9-1.0 555.04 5,540 41.45 9,822 73.48 1.0-1.1 565.23 1,742 13.03 3,971 29.71 1.1-1.2 573.09 244 1.83 509 3.81 1.2-1.3 578.95 205 1.54 413 3.09 1.3-1.4 582.86 149 1.12 321 2.41 1.4-1.5 585.06 195 1.46 422 3.16
>1.5 585.55 17 0.13 39 0.29 Mbrtotal 33,916 253.76 45,598 341.15
Blocher Member
0.6-0.7 290.62 5,863 43.86 11,610 86.86 0.7-0.8 437.44 2,044 15.29 3,998 29.91 0.8-0.9 513.91 991 7.41 2,068 15.47 0.9-LO 555.04 1,909 14.28 6,265 46.87 1.0-1.1 565.23 600 4.49 2,734 20.46 1.1-1.2 573.09 84 0.63 359 2.69 1.2-1.3 578.95 71 0.53 223 1.67 1.3-1.4 582.86 52 0.39 245 1.83 1.4-1.5 585.06 67 0.50 303 2.27
>1.5 585.55 6 0.04 26 0.19 Mbr total 11,687 87.42 27,831 208.22 Fm total 105,029 785.77 156,698 1,172.34
1Hydrogen index for the midpoint of each 0.1-percent Ro interval was determined from the relationship in figure 8 and the resulting hydrogen index was used to determine the Rock-Eval expulsion factor from the relationship in figure 10.
2Rock-Eval expulsion factor (x10-3) is multiplied by the TOC mass as determined by the dilution model in table 5.
3Rock-Eval expulsion factor (xi0-3) is multiplied by the TOC mass as determined by the steady-state model in table 5.
4A petroleum density of 840.76 kg/m3 (i.e., 36.8°API gravity) is divided into the mass of vaporized hydrocarbons and the quotient is multiplied by 6.29 to convert cubic meters to billion barrels.

METHODS AND RESULTS 19
Table 8. Quantity of petroleum expelled from the New Albany Shale as determined by hydrous-pyrolysis expulsion factors.
[Ro. mean random vitrinite reflectance; TOC, total organic carbon; bbl, barrel; Mbr, Member; Fm, Formation]
Hydrous-pyrolysis Dilution model Steady-state model Ro interval, expulsion Expelled Expelled Expelled Expelled (percent) factor1 oil2 petroleum4 oil3 petroleum4
~~ oil/M~ Toq {T~ ~illion bbQ {T~ ~illion bbQ
Upper shale composite
0.6-0.7 87.45 8,972 67.12 11,730 87.75 0.7-0.8 173.94 4,133 30.92 5,691 42.58 0.8-0.9 242.86 2,381 17.81 2,655 19.86 0.9-1.0 292.43 5,114 38.26 8,438 63.13 1.0-1.1 306.76 1,656 12.39 3,118 23.33 1.1-1.2 318.52 238 1.78 423 3.16 1.2-1.3 327.75 204 1.53 371 2.77 1.3-1.4 334.14 150 1.12 283 2.12 1.4-1.5 337.83 197 1.48 365 2.73
>1.5 338.66 17 0.13 32 0.24 "Mbr" total 23,062 172.53 33,106 247.67
Selmier Member
0.6-0.7 87.45 5,121 38.31 5,996 44.86 0.7-0.8 173.94 2,359 17.65 2,688 20.11 0.8-0.9 242.86 1,359 10.17 1,613 12.07 0.9-1.0 292.43 2,919 21.84 5,175 38.71 1.0-1.1 306.76 945 7.07 2,155 16.12 1.1-1.2 318.52 136 1.02 283 2.12 1.2-1.3 327.75 116 0.87 234 1.75 1.3-1.4 334.14 86 0.64 184 1.38 1.4-1.5 337.83 112 0.84 244 1.82
>1.5 338.66 10 0.07 23 0.17 Mbrtotal 13,163 98.48 18,595 139.11
Blocher Member
0.6-0.7 87.45 1,764 13.20 3,494 26.14 0.7-0.8 173.94 813 6.08 1,590 11.89 0.8-0.9 242.86 468 3.50 977 7.31 0.9-1.0 292.43 1,006 7.52 3,301 24.70 1.0-1.1 306.76 326 2.44 1,484 11.10 1.1-1.2 318.52 47 0.35 200 1.49 1.2-1.3 327.75 40 0.30 12£ 0.94 1.3-1.4 334.14 29 0.22 140 1.05 1.4-1.5 337.83 39 0.29 175 1.31
>1.5 338.66 3 0.03 15 0.11 Mbrtotal 4,535 33.93 11,502 86.04 Fm total 40,760 304.94 63,203 472.82
1Hydrogen indices for the midpoint value of each 0.1-percent Ro interval was determined from the relationship in figure 8 and the resulting hydrogen indices were used to determine hydrous-pyrolysis expulsion factors from the relationship in figure 12.
2Hydrous-pyrolysis expulsion factor ( x 1 o-3) is multiplied by the TOC mass as determined by the dilution model in table 5.
3Hydrous-pyrolysis expulsion factor ( x 1 o-3) is multiplied by the TOC mass as determined by the steady-state model in table 5.
4A petroleum density of 840.76 kg/m3 ·(i.e., 36.8°API gravity) is divided into the mass of expelled oil and the quotient is multiplied by 6.29 to convert cubic meters to billion barrels.
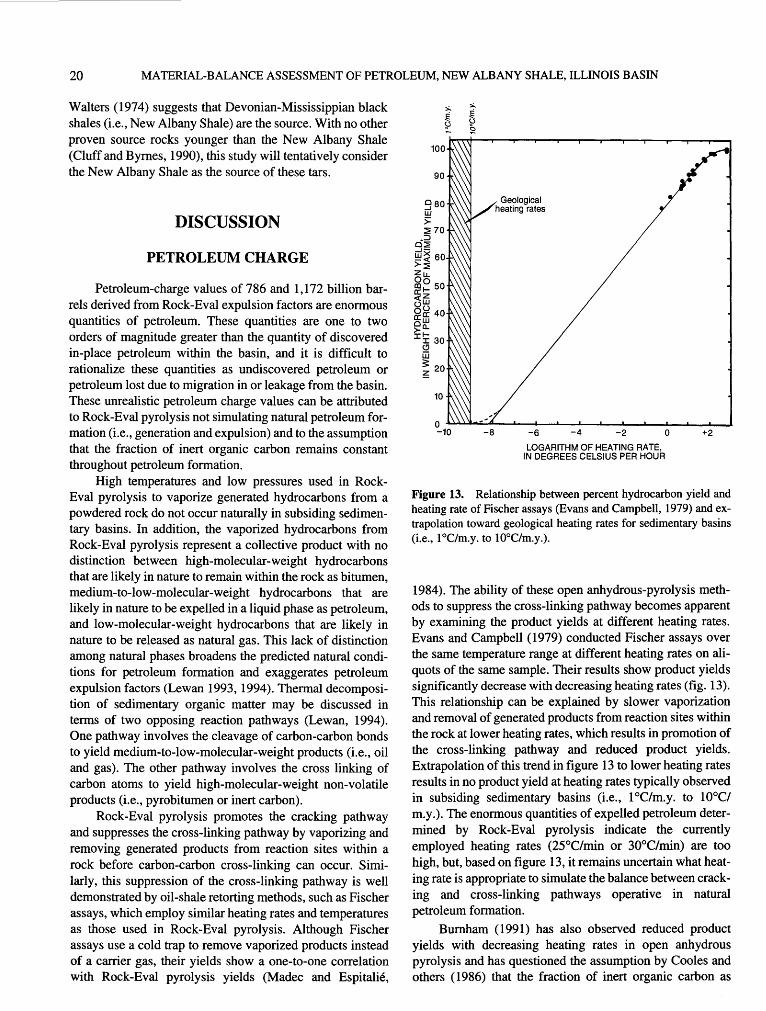
20 MATERIAL-BALANCE ASSESSMENT OF PETROLEUM, NEW ALBANY SHALE, ILLINOIS BASIN
Walters (1974) suggests that Devonian-Mississippian black shales (i.e., New Albany Shale) are the source. With no other proven source rocks younger than the New Albany Shale (Cluff and Byrnes, 1990), this study will tentatively consider the New Albany Shale as the source of these tars.
DISCUSSION
PETROLEUM CHARGE
Petroleum-charge values of 786 and 1,172 billion barrels derived from Rock-Eval expulsion factors are enormous quantities of petroleum. These quantities are one to two orders of magnitude greater than the quantity of discovered in-place petroleum within the basin, and it is difficult to rationalize these quantities as undiscovered petroleum or petroleum lost due to migration in or leakage from the basin. These unrealistic petroleum charge values can be attributed to Rock-Eval pyrolysis not simulating natural petroleum formation (i.e., generation and expulsion) and to the assumption that the fraction of inert organic carbon remains constant throughout petroleum formation.
High temperatures and low pressures used in RockEva! pyrolysis to vaporize generated hydrocarbons from a powdered rock do not occur naturally in subsiding sedimentary basins. In addition, the vaporized hydrocarbons from Rock-Eval pyrolysis represent a collective product with no distinction between high-molecular-weight hydrocarbons that are likely in nature to remain within the rock as bitumen, medium-to-low-molecular-weight hydrocarbons that are likely in nature to be expelled in a liquid phase as petroleum, and low-molecular-weight hydrocarbons that are likely in nature to be released as natural gas. This lack of distinction among natural phases broadens the predicted natural conditions for petroleum formation and exaggerates petroleum expulsion factors (Lewan 1993, 1994). Thermal decomposition of sedimentary organic matter may be discussed in terms of two opposing reaction pathways (Lewan, 1994). One pathway involves the cleavage of carbon-carbon bonds to yield medium-to-low-molecular-weight products (i.e., oil and gas). The other pathway involves the cross linking of carbon atoms to yield high-molecular-weight non-volatile products (i.e., pyrobitumen or inert carbon).
Rock-Eval pyrolysis promotes the cracking pathway and suppresses the cross-linking pathway by vaporizing and removing generated products from reaction sites within a rock before carbon-carbon cross-linking can occur. Similarly, this suppression of the cross-linking pathway is well demonstrated by oil-shale retorting methods, such as Fischer assays, which employ similar heating rates and temperatures as those used in Rock-Eval pyrolysis. Although Fischer assays use a cold trap to remove vaporized products instead of a carrier gas, their yields show a one-to-one correlation with Rock-Eval pyrolysis yields (Madec and Espitalie,
90
10
~1~0~~~-BL-~---6~~--~4~~--~2--~~0--.__+.2~
LOGARITHM OF HEATING RATE, IN DEGREES CELSIUS PER HOUR
Figure 13. Relationship between percent hydrocarbon yield and heating rate of Fischer assays (Evans and Campbell, 1979) and extrapolation toward geological heating rates for sedimentary basins (i.e., 1 °C/m.y. to 10°C/m.y.).
1984). The ability of these open anhydrous-pyrolysis methods to suppress the cross-linking pathway becomes apparent by examining the product yields at different heating rates. Evans and Campbell ( 1979) conducted Fischer assays over the same temperature range at different heating rates on aliquots of the same sample. Their results show product yields significantly decrease with decreasing heating rates (fig. 13). This relationship can be explained by slower vaporization and removal of generated products from reaction sites within the rock at lower heating rates, which results in promotion of the cross-linking pathway and reduced product yields. Extrapolation of this trend in figure 13 to lower heating rates results in no product yield at heating rates typically observed in subsiding sedimentary basins (i.e., 1 °C/m.y. to 10°C/ m.y.). The enormous quantities of expelled petroleum determined by Rock-Eval pyrolysis indicate the currently employed heating rates (25°C/min or 30°C/min) are too high, but, based on figure 13, it remains uncertain what heating rate is appropriate to simulate the balance between cracking and cross-linking pathways operative in natural petroleum formation.
Burnham (1991) has also observed reduced product yields with decreasing heating rates in open anhydrous pyrolysis and has questioned the assumption by Cooles and others (1986) that the fraction of inert organic carbon as

DISCUSSION 21
~ 0.24 ()
~ 0.22
:2 ~(2 0.20 Z<!J wa: ~w 0.18 oa... ()5 0.16 zcc Oa: ~<( 0.14 <(U uu uz 0.12
:zc; c; a: 0.10 a:O 0 ~ 0.08
<( a: " 0.06 ~
·•·• ···············································-Measured original TOO···
t Original
unheated sample Measured inert organic
t carbon""'- .
260 280 300 320 340 360
EXPERIMENTAL TEMPERATURE FOR 72 HOURS, IN DEGREES CELSIUS
380
Figure 14. Change in measured inert organic carbon and calculated original total organic carbon (TOC0 m) from Rock-Eval pyrolysis (Cooles and others, 1986) with increasing maturity, as induced by hydrous pyrolysis on aliquots of an immature sample of Clegg Creek Member of the New Albany Shale (fig. 11).
determined by Rock-Eval pyrolysis remains constant throughout petroleum formation. The rock recovered from the series of hydrous-pyrolysis experiments conducted on aliquots of shale from the Clegg Creek Member (fig. 11) provide samples at various stages of petroleum formation to further test this assumption. Rock-Eval data on the rock recovered from these experiments is given in table 9. The inert and original total organic carbon contents (C1° and TOC0
) of the unheated rock are 67.5 and 143.4 mg/g of rock, respectively. These values give an inert organic carbon fraction of0.471 (eq. 1), which is used with the data in table 9 to calculate the inert (C1) and original total organic carbon contents (TOC0 m) at different maturities induced by hydrous pyrolysis. Calculations are made with equation 2, which assumes that the inert organic carbon fraction (C1) remains constant with increasing thermal maturity. The plotted results in figure 14 indicate that this assumption is not valid and that the amount of inert organic carbon, as determined by Rock-Eval pyrolysis, increases significantly with increasing thermal maturity. This increase results in significant overestimates of original total organic carbon (TOC0 m) by as much as 39 percent (fig. 14). These overestimates of original total organic carbon in thermally mature rocks result in higher calculated organic carbon losses attributed to petroleum expulsion, which explain in part the unrealistic expulsion factors and enormous quantities of expelled petroleum derived from Rock-Eval pyrolysis.
These results suggest that, in addition to heating rate, the maturity level of a source rock can also influence the results from open anhydrous pyrolysis. This influence is not surprising when one considers the changes that occur to
organic matter and its distribution within a source rock with increasing thermal maturity. Sedimentary organic matter in thermally immature source rocks occurs predominantly as an insoluble solid kerogen, which is distributed within the mineral matrix as insular domains (Lewan, 1987). In naturally and experimentally matured source rocks, the kerogen domains decompose into a viscous, high-molecular-weight bitumen that impregnates the microporosity and parting planes of the rock to form a continuous organic network (Lewan, 1987). These state and distribution changes of the organic matter with increasing thermal maturity are also accompanied by compositional changes in the remaining bitumen as saturate-enriched petroleum is expelled from the rock (Lewan, 1993). Therefore, it is conceivable, with all of these physical and chemical changes occurring to the organic matter with increasing maturation, that the response from Rock-Eval pyrolysis would be different for the same rock at different maturity levels. The observed increase of inert organic carbon with increasing thermal maturation as shown in figure 14 indicates an increasing preference for the crosslinking pathway with increasing maturity of a source rock.
Although the petroleum charge determined by RockEva! pyrolysis is approximately 2.5 times greater than the petroleum charge determined by hydrous pyrolysis, the latter is still large relative to the discovered in-place petroleum within the basin. Hydrous pyrolysis exaggerates the natural processes responsible for petroleum expulsion (Lewan, 1994) and, therefore, should not be directly applied to sedimentary basins (Lewan, 1994). Three likely causes of this exaggeration by hydrous pyrolysis include enhanced solubility of H20 in the bitumen network, reduced hydrostatic pressure, and enhanced thermal expansion of petroleum products.
Comparison of yields from closed pyrolysis experiments under hydrous and anhydrous conditions show the presence of water significantly suppresses the cross-linking pathway and promotes generation of soluble organic products (Comet and others, 1986; Tannenbaum and others, 1986; Lewan, 1993). Lewan (1992) suggests that the enhancement of yield under hydrous conditions relative to anhydrous closed conditions is a result of dissolved H20 in the bitumen network acting as a source of hydrogen. It has been experimentally established that the solubility of water in hydrocarbons is two orders of magnitude higher than the solubility of hydrocarbons in water (Tsonopoulos and Wilson, 1983; Heidman and others, 1985; Skripka and Boksha, 1976; Guerrant, 1964; Griswold and Kasch, 1942). However, this high solubility of water in hydrocarbons is strongly dependent on temperature, with water solubilities being more than one order of magnitude higher at temperatures used in hydrous pyrolysis (300°C to 365°C) than at temperatures encountered in subsiding sedimentary basins ( 1 00°C to 200°C). A reduction of a possible hydrogen source by this magnitude is expected to promote the cross-linking pathway and reduce petroleum yields and expulsion factors under

22 MATERIAL-BALANCE ASSESSMENT OF PETROLEUM, NEW ALBANY SHALE, ILLINOIS BASIN
Table 9. Rock-Eval data and calculated inert carbon and original total organic carbon in rocks recovered from hydrous-pyrolysis experiments on aliquots of a sample from the Clegg Creek Member of the New Albany Shale.
[See fig. 11. See text for definitions of s1 and S2. HC, hydrocarbons; Rx, rock; wt. %, weight percent; TOC, total organic carbon; C, carbon]
Hydrous-pyrolysis 81 82 TOC Hydrogen cl c2 Inert Original conditions HC HC (wt.%Rx) index 81-carbon 82-carbon carbon Toc1
(DCfor72h) (mg/gRx) (mg/gRx) (82/gTOC) (g C/gRx) (gC/gRx) (gC/g Rx) (gC/gRx)
unheated 2.72 86.56 14.34 269.7 1.87 85.01 14.56 285.0 2.42 82.93 14.31 300.2 4.53 78.28 14.09 310.1 6.39 69.56 13.90 320.3 8.24 57.05 13.31 330.1 11.49 44.37 12.70 340.2 10.67 33.71 12.04 350.5 7.44 19.56 11.21 355.1 6.37 12.50 10.72 360.3 5.05 10.94 10.64 365.0 4.70 9.32 10.58
1Inert organic carbon fraction= 0.471 (see eq. 1).
natural conditions. Research is currently under way to determine the degree to which hydrous pyrolysis exaggerates expulsion in sedimentary basins (Lewan, 1994), but the differences in expulsion between anhydrous and hydrous pyrolysis (Lewan, 1993) suggest that exaggeration by a factor of 2 is conceivable.
Several experimental studies have demonstrated that increasing hydrostatic pressure can significantly reduce hydrocarbon yields from source rocks (Price and Wenger, 1992; Freund and others, 1992, figs. 2 and 3; Michels and others, 1992). Hydrous pyrolysis typically operates at hydrostatic pressures slightly higher than the vapor pressure of water as determined by the experimental temperature and amount of gas generated from the pyrolyzed rock (Lewan, 1993). The hydrous-pyrolysis experiments conducted at 330°C for 72 hours by Michels and others (1992) showed a total yield (bitumen + expelled oil) reduction of 34 weight percent at a pressure of 70 MPa and 58 weight percent at a pressure of 130 MPa relative to the total yields under typical hydrous-pyrolysis conditions at a pressure of 13 MPa. According to paleoreconstructions of the Illinois Basin, the New Albany Shale was within peak petroleum generation at depths from 2.44 to 3.36 km (Cluff and Byrnes, 1990). If the New Albany Shale at these depths was under normal hydrostatic conditions ( 10.2 kPa/m), the water pressure would be 24.9 to 34.3 MPa. Under overpressure conditions, approaching lithostatic pressures (20.4 kPa/m), the water pressure at these same depths would be 49.8 to 68.5 MPa (HamiltonSmith, 1993). This latter range of water pressures would correspond approximately to a 25 to 35 percent reduction in yield based on the hydrous-pyrolysis results of Michels and others (1992) at 330°C for 72 hours.
603.6 0.0023 0.0736 0.0675 0.1434 583.9 0.0016 0.0723 0.0718 0.1524 579.5 0.0021 0.0705 0.0706 0.1499 555.6 0.0039 0.0665 0.0705 0.1497 500.4 0.0054 0.0591 0.0744 0.1580 428.6 0.0070 0.0485 0.0776 0.1648 349.4 0.0098 0.0377 0.0795 0.1688 280.0 0.0098 0.0287 0.0827 0.1756 174.5 0.0063 0.0166 0.0892 0.1894 116.6 0.00~4 0.0106 0.0912 0.1936 102.8 0.0043 0.0093 0.0928 0.1970 88.1 0.0040 0.0079 0.0939 0.1994
The higher temperatures used in hydrous pyrolysis relative to natural petroleum generation may also exaggerate expulsion factors because of greater thermal expansion of generated petroleum within source rocks. The specific volume of petroleum with a 29° API gravity is 1.21 cm3/g at 100°C and 1.51 cm3/g at 315°C (GPSA, 1987). Therefore, a given mass of petroleum generated in a source rock by hydrous pyrolysis at 315°C will occupy 25 percent more volume than that generated in a source rock by natural subsidence to 1 00°C. This percent of volume increase may reflect an equivalent increase in petroleum expulsion during hydrous pyrolysis. Most petroleum expulsion models require the porosity of a source rock to be filled with bitumen or petroleum before expulsion occurs (e.g., Durand and others, 1987; Leythaeuser and others, 1987). Lewan (1987) reports notable expansion of source-rock cores recovered from hydrous-pyrolysis experiments as a result of the opening of oil-filled parting fractures parallel to the bedding fabric. Although petroleum densities at temperatures in excess of 320°C are not available, extrapolation of the lower temperature trends ( <320°C) suggests volume increases may exceed 30 percent at experimental temperatures of 350°C.
Although hydrous pyrolysis simulates natural petroleum formation, as indicated by the composition of its expelled oil and petrographic character of its recovered rock, its expulsion factors appear to be exaggerated to some degree compared to natural expulsion factors. Additional research is critical to determining the degree of exaggeration. However, the general evaluation of water solubility, hydrostatic pressure, and thermal expansion effects suggest that it would be reasonable to assume natural expulsion factors to be at least one-half of the hydrous-pyrolysis expulsion factors. This temporary estimated correction to the
DISCUSSION 23
hydrous-pyrolysis expulsion factors would reduce the petroleum charge values to 152 and 236 billion barrels for the dilution and steady-state models, respectively.
PETROLEUM LOSSES
Petroleum losses within the Illinois Basin may occur as residual oil in porous-rock carrier beds; surface leakage in the form of tar seeps; and eroded traps, carrier beds, or seeps in the post-Pennsylvanian section. More than 90 percent of the accountable produced,petroleum within the Illinois Basin occurs in reservoirs that are stratigraphically at least 350 m above the New Albany Shale. No continuous porous strata capable of serving as a regional carrier bed occurs within this intervening section between source and reservoir. As a result, it becomes necessary to advocate petroleum migration through regional fractures and faults. Secondary migration through fractures and faults has been advocated as effective pathways in other sedimentary basins (e.g., Bell, 1989; Price, 1980; du Rouchet, 1984). Evidence of this mode of secondary migration in the Illinois Basin includes the association of tar sands with faults in western Kentucky (Williams and others, 1982), lenticular reservoirs encased in impervious strata of the Ste. Genevieve Limestone and Cypress Sandstone (Seyler and Cluff, 1990), and the apparent migration of petroleum along faults to account for petroleum in Pennsylvanian reservoirs (Swann and Bell, 1958; Seyler and Cluff, 1990).
Although secondary migration through fractures and faults appears to be significant in the Illinois Basin, porous carrier beds may have been critical to lateral migration of petroleum away from faults and fracture conduits. The regional extent and good reservoir character of the Aux Vases Sandstone (Mississippian) make it a strong candidate as a regional carrier bed. This possible carrier bed varies in thickness from an average of 7.6 m in the central part of the basin to 61 m in the western part of the basin (Seyler and Cluff, 1990), and it is an exploration target from which almost 1 billion barrels of petroleum have been produced (Treworgy, 1990). It has a mean porosity of 18 percent and a mean permeability of 76 mD based on data from 179 fields (Mast, 1970). The Sylamore Member (Devonian), which occurs at the base of the New Albany Shale, has also been suggested as a possible carrier bed (Oltz and Crocket, 1989; Bethke and others, 1991 ). However, this rock unit varies in thickness from a few centimeters to 1.6 m and has a discontinuous distribution, as mapped by Workman and Gillette (1956), that make its significance as a regional carrier bed unlikely.
The importance of considering porous-rock units as carrier beds is the ability of granular rocks to retain residual petroleum after they have served as carrier beds (Schowalter, 1979). This residual petroleum in carrier beds has been
advocated as the cause of the enormous quantities of petroleum that must have been lost, based on the enormous quantities of expelled petroleum determined by Rock-Eval pyrolysis (Mackenzie and Quigley, 1988). Schowalter ( 1979) suggests that only the upper few feet of a potential carrier bed experiences petroleum migration, and England and others (1987) suggest that only 1 to 10 percent of the cross-sectional area of a carrier bed experiences petroleum migration. The amount of residual petroleum that remains in this portion of carrier bed that experiences petroleum migration ranges from 10 to 30 percent of the pores for water-wet sandstones (Schowalter and Hess, 1982). The surface area of the Aux Vases Sandstone that contains a sandstone-to-shale ratio greater than 1:8, as mapped by Swann and Bell (1958), is 54.5x10⁹ m2. Assuming that 3m of this entire area acted as a carrier bed with a mean porosity of 18 percent, 10 to 30 percent of this pore volume equates to 18.5 to 55.5 billion barrels of unrecoverable residual petroleum lost in the carrier bed. Currently, these quantities cannot be substantiated by petroleum shows from drilling reports or cores. Therefore, this range is treated as a maximum loss that includes residual petroleum that may have occurred on a more local scale in other sandstones younger than the Aux Vases Sandstone.
Petroleum may also be lost from a basin as a result of untrapped petroleum leaking out of carrier beds, faults, or fractures at or near the surface. Although weathering of leaking petroleum by evaporation, water washing, microbial degradation, polymerization, and autp-oxidation (Hunt, 1979, p. 411) may result in as much as 90 percent loss of the original petroleum, a residual tar will remain to indicate the occurrence of petroleum leakage. The only major tar deposits within the Illinois Basin occur in sandstones that subcrop at or immediately overlie the Mississippian-Pennsylvanian unconformity in western Kentucky. These tar-sand deposits comprise an in-place resource of 3.4 billion barrels, with 1. 73 billion barrels being measured and 1.68 billion barrels being speculative (Kuuskraa, 1984; Noger, 1987; Crysdale and Schenk, 1988). The API gravity of the tar is typically 10° (Ward, 1983; Fedde and Zavada, 1983; Moore and others, 1984), with a mean sulfur content of 1.66 weight percent (Ward, 1983; Fedde and Zavada, 1983; Hosterman and others, 1990; Thomas and others, 1983). These properties are significantly different than those of the produced petroleum of the Illinois Basin, which has a mean API gravity of 36.8° (Mast, 1970) and a mean sulfur content 0.22 weight percent (Huff, 1987).
Subsurface degradation of produced petroleum to tar with these properties has been documented in the Brea Olinda field of the Los Angeles Basin (W.L. Orr, written commun., 1994). Microbial activity or water washing is the usual cause of this degradation (Bailey and others, 1973). These processes do not appear to add or remove sulfur, which occurs predominantly in the more aromatic and highmolecular-weight fraction of most petroleum (W.L. Orr, written commun., 1994). As a result, sulfur content can be
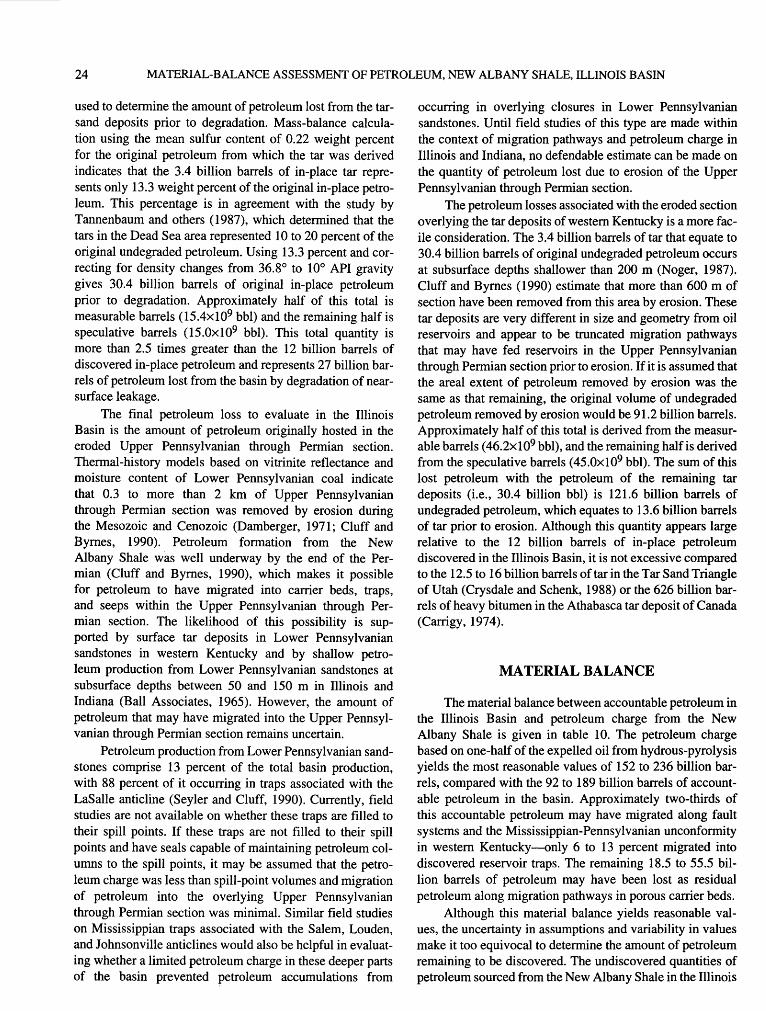
24 MATERIAL-BALANCE ASSESSMENT OF PETROLEUM, NEW ALBANY SHALE, ILLINOIS BASIN
used to determine the amount of petroleum lost from the tarsand deposits prior to degradation. Mass-balance calculation using the mean sulfur content of 0.22 weight percent for the original petroleum from which the tar was derived indicates that the 3.4 billion barrels of in-place tar represents only 13.3 weight percent of the original in-place petroleum. This percentage is in agreement with the study by Tannenbaum and others ( 1987), which determined that the tars in the Dead Sea area represented 10 to 20 percent of the original undegraded petroleum. Using 13.3 percent and correcting for density changes from 36.8° to 10° API gravity gives 30.4 billion barrels of original in-place petroleum prior to degradation. Approximately half of this total is measurable barrels (15.4x10⁹ bbl) and the remaining half is speculative barrels (15.0x10⁹ bbl). This total quantity is more than 2.5 times greater than the 12 billion barrels of discovered in-place petroleum and represents 27 billion barrels of petroleum lost from the basin by degradation of nearsurface leakage.
The final petroleum loss to evaluate in the Illinois Basin is the amount of petroleum originally hosted in the eroded Upper Pennsylvanian through Permian section. Thermal-history models based on vitrinite reflectance and moisture content of Lower Pennsylvanian coal indicate that 0.3 to more than 2 km of Upper Pennsylvanian through Permian section was removed by erosion during the Mesozoic and Cenozoic (Damberger, 1971; Cluff and Byrnes, 1990). Petroleum formation from the New Albany Shale was well underway by the end of the Permian (Cluff and Byrnes, 1990), which makes it possible for petroleum to have migrated into carrier beds, traps, and seeps within the Upper Pennsylvanian through Permian section. The likelihood of this possibility is supported by surface tar deposits in Lower Pennsylvanian sandstones in western Kentucky and by shallow petroleum production from Lower Pennsylvanian sandstones at subsurface depths between 50 and 150 m in Illinois and Indiana (Ball Associates, 1965). However, the amount of petroleum that may have migrated into the Upper Pennsylvanian through Permian section remains uncertain.
Petroleum production from Lower Pennsylvanian sandstones comprise 13 percent of the total basin production, with 88 percent of it occurring in traps associated with the LaSalle anticline (Seyler and Cluff, 1990). Currently, field studies are not available on whether these traps are filled to their spill points. If these traps are not filled to their spill points and have seals capable of maintaining petroleum columns to the spill points, it may be assumed that the petroleum charge was less than spill-point volumes and migration of petroleum into the overlying Upper Pennsylvanian through Permian section was minimal. Similar field studies on Mississippian traps associated with the Salem, Louden, and Johnsonville anticlines would also be helpful in evaluating whether a limited petroleum charge in these deeper parts of the basin prevented petroleum accumulations from
occurring in overlying closures in Lower Pennsylvanian sandstones. Until field studies of this type are made within the context of migration pathways and petroleum charge in Illinois and Indiana, no defendable estimate can be made on the quantity of petroleum lost due to erosion of the Upper Pennsylvanian through Permian section.
The petroleum losses associated with the eroded section overlying the tar deposits of western Kentucky is a more facile consideration. The 3.4 billion barrels of tar that equate to 30.4 billion barrels of original undegraded petroleum occurs at subsurface depths shallower than 200m (Noger, 1987). Cluff and Byrnes (1990) estimate that more than 600 m of section have been removed from this area by erosion. These tar deposits are very different in size and geometry from oil reservoirs and appear to be truncated migration pathways that may have fed reservoirs in the Upper Pennsylvanian through Permian section prior to erosion. If it is assumed that the areal extent of petroleum removed by erosion was the same as that remaining, the original volume of undegraded petroleum removed by erosion would be 91.2 billion barrels. Approximately half of this total is derived from the measurable barrels (46.2x10⁹ bbl), and the remaining half is derived from the speculative barrels (45.0x10⁹ bbl). The sum of this lost petroleum with the petroleum of the remaining tar deposits (i.e., 30.4 billion bbl) is 121.6 billion barrels of undegraded petroleum, which equates to 13.6 billion barrels of tar prior to erosion. Although this quantity appears large relative to the 12 billion barrels of in-place petroleum discovered in the Illinois Basin, it is not excessive compared to the 12.5 to 16 billion barrels of tar in the Tar Sand Triangle of Utah (Crysdale and Schenk, 1988) or the 626 billion barrels of heavy bitumen in the Athabasca tar deposit of Canada (Carrigy, 1974).
MATERIAL BALANCE
The material balance between accountable petroleum in the Illinois Basin and petroleum charge from the New Albany Shale is given in table 10. The petroleum charge based on one-half of the expelled oil from hydrous-pyrolysis yields the most reasonable values of 152 to 236 billion barrels, compared with the 92 to 189 billion barrels of accountable petroleum in the basin. Approximately two-thirds of this accountable petroleum may have migrated along fault systems and the Mississippian-Pennsylvanian unconformity in western Kentucky-only 6 to 13 percent migrated into discovered reservoir traps. The remaining 18.5 to 55.5 billion barrels of petroleum may have been lost as residual petroleum along migration pathways in porous carrier beds.
Although this material balance yields reasonable values, the uncertainty in assumptions and variability in values make it too equivocal to determine the amount of petroleum remaining to be discovered. The undiscovered quantities of petroleum sourced from the New Albany Shale in the Illinois
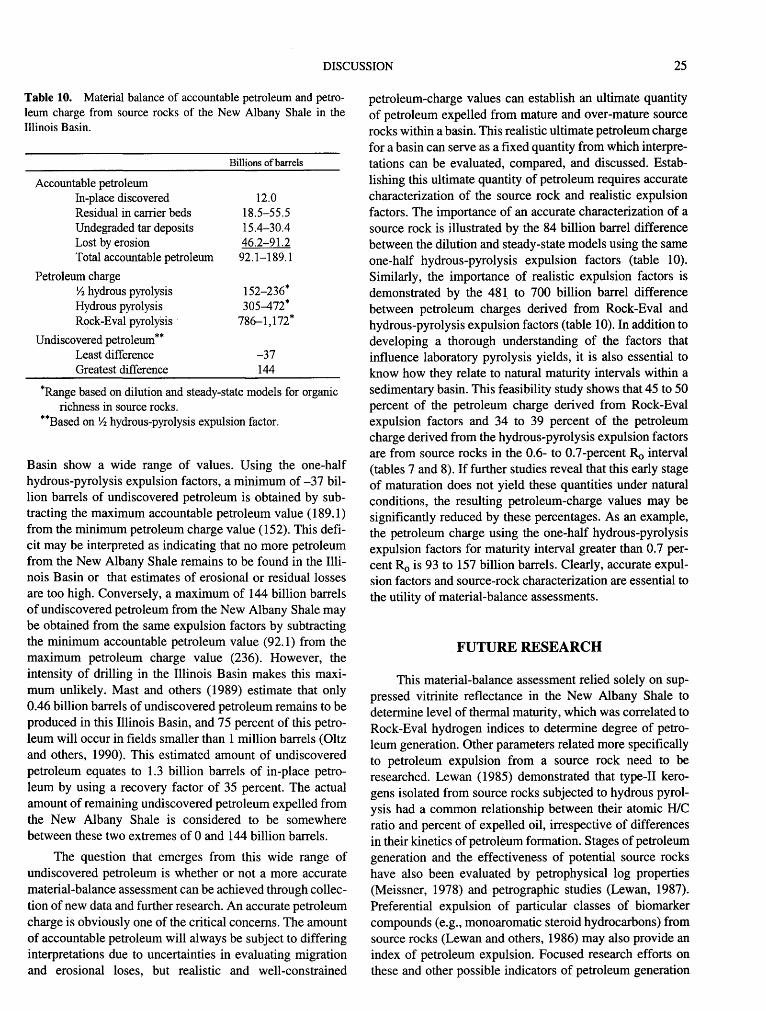
DISCUSSION 25
Table 10. Material balance of accountable petroleum and petroleum charge from source rocks of the New Albany Shale in the Illinois Basin.
Accountable petroleum In-place discovered Residual in carrier beds Undegraded tar deposits Lost by erosion Total accountable petroleum
Petroleum charge Yi hydrous pyrolysis Hydrous pyrolysis Rock-Eval pyrolysis ·
Undiscovered petroleum** Least difference Greatest difference
Billions ofbarrels
12.0 18.5-55.5 15.4-30.4 46.2-91.2 92.1-189.1
152-236* 305-472*
786-1,172*
-37 144
*Range based on dilution and steady-state models for organic richness in source rocks.
**Based on Yi hydrous-pyrolysis expulsion factor.
Basin show a wide range of values. Using the one-half hydrous-pyrolysis expulsion factors, a minimum of -37 billion barrels of undiscovered petroleum is obtained by subtracting the maximum accountable petroleum value ( 189.1) from the minimum petroleum charge value (152). This deficit may be interpreted as indicating that no more petroleum from the New Albany Shale remains to be found in the Illinois Basin or that estimates of erosional or residual losses are too high. Conversely, a maximum of 144 billion barrels of undiscovered petroleum from the New Albany Shale may be obtained from the same expulsion factors by subtracting the minimum accountable petroleum value (92.1) from the maximum petroleum charge value (236). However, the intensity of drilling in the Illinois Basin makes this maximum unlikely. Mast and others (1989) estimate that only 0.46 billion barrels of undiscovered petroleum remains to be produced in this Illinois Basin, and 75 percent of this petroleum will occur in fields smaller than 1 million barrels (Oltz and others, 1990). This estimated amount of undiscovered petroleum equates to 1.3 billion barrels of in-place petroleum by using a recovery factor of 35 percent. The actual amount of remaining undiscovered petroleum expelled from the New Albany Shale is considered to be somewhere between these two extremes of 0 and 144 billion barrels.
The question that emerges from this wide range of undiscovered petroleum is whether or not a more accurate material-balance assessment can be achieved through collection of new data and further research. An accurate petroleum charge is obviously one of the critical concerns. The amount of accountable petroleum will always be subject to differing interpretations due to uncertainties in evaluating migration and erosional loses, but realistic and well-constrained
petroleum-charge values can establish an ultimate quantity of petroleum expelled from mature and over-mature source rocks within a basin. This realistic ultimate petroleum charge for a basin can serve as a fixed quantity from which interpretations can be evaluated, compared, and discussed. Establishing this ultimate quantity of petroleum requires accurate characterization of the source rock and realistic expulsion factors. The importance of an accurate characterization of a source rock is illustrated by the 84 billion barrel difference between the dilution and steady-state models using the same one-half hydrous-pyrolysis expulsion factors (table 10). Similarly, the importance of realistic expulsion factors is demonstrated by the 481. to 700 billion barrel difference between petroleum charges derived from Rock-Eval and hydrous-pyrolysis expulsion factors (table 10). In addition to developing a thorough understanding of the factors that influence laboratory pyrolysis yields, it is also essential to know how they relate to natural maturity intervals within a sedimentary basin. This feasibility study shows that 45 to 50 percent of the petroleum charge derived from Rock-Eval expulsion factors and 34 to 39 percent of the petroleum charge derived from the hydrous-pyrolysis expulsion factors are from source rocks in the 0.6- to 0.7-percent Ro interval (tables 7 and 8). If further studies reveal that this early stage of maturation does not yield these quantities under natural conditions, the resulting petroleum-charge values may be significantly reduced by these percentages. As an example, the petroleum charge using the one-half hydrous-pyrolysis expulsion factors for maturity interval greater than 0. 7 percentRo is 93 to 157 billion barrels. Clearly, accurate expulsion factors and source-rock characterization are essential to the utility of material-balance assessments.
. FUTURE RESEARCH
This material-balance assessment relied solely on suppressed vitrinite reflectance in the New Albany Shale to determine level of thermal maturity, which was correlated to Rock-Eval hydrogen indices to determine degree of petroleum generation. Other parameters related more specifically to petroleum expulsion from a source rock need to be researched. Lewan (1985) demonstrated that type-II kerogens isolated from source rocks subjected to hydrous pyrolysis had a common relationship between their atomic H/C ratio and percent of expelled oil, irrespective of differences in their kinetics of petroleum formation. Stages of petroleum generation and the effectiveness of potential source rocks have also been evaluated by petrophysical log properties (Meissner, 1978) and petrographic studies (Lewan, 1987). Preferential expulsion of particular classes of biomarker compounds (e.g., monoaromatic steroid hydrocarbons) from source rocks (Lewan and others, 1986) may also provide an index of petroleum expulsion. Focused research efforts on these and other possible indicators of petroleum generation

26 MATERIAL-BALANCE ASSESSMENT OF PETROLEUM, NEW ALBANY SHALE, ILLINOIS BASIN
and expulsion are attainable and relevant to obtaining more accurate material-balance assessments in the future.
Additional research is needed to understand the natural factors that control petroleum expulsion from source rocks. Hydrous-pyrolysis experiments have shown that the presence of water (Lewan, 1993), hydrostatic pressure (Michels and others, 1992), mineral matrix (Lewan and Whitney, 1993), and amount of organic matter (Lewan, 1987) can have a significant effect on petroleum expulsion. These factors need to be quantified and related to chemical and physical mechanisms responsible for petroleum generation and expulsion for reasonable extrapolations to natural conditions. Specific to this material balance on the Illinois Basin, additional experimental work is needed on other members of the New Albany Shale. This study assumed that the experimental results on the sample from the Clegg Creek Member are representative of source rocks in all of the members of the New Albany Shale.
Collection of source rocks and examination of their relationship to carrier beds in the subsurface also needs further study. Price (1994) maintains that the petroleum potential remaining in a mature source rock is underestimated because of significant petroleum losses to the drilling mud as cuttings or cores move up the borehole for collection at the wellhead. If this phenomenon is common, expulsion factors will be overestimated and a major petroleum resource remaining within source rocks may be unrecognized. In addition, the thickness of a source rock and its relationship to adjacent carrier beds may significantly influence expulsion factors. Leythaeuser and others ( 1988) have presented geochemical data on cores from the North Sea that suggest expulsion efficiencies are greater at the margins of thick source rocks where they are in contact with carrier beds. This interpretation can be tested in the Illinois Basin at the contact between the Sylamore Member and overlying organic-rich shales in the New Albany Shale.
Although an accurate petroleum charge is critical to establishing an upper limit for a material-balance assessment, an accurate determination of petroleum losses during secondary migration is critical to establish the amount of undiscovered petroleum remaining within a basin. Detailed studies on migration pathways of petroleum from the mature source rock to convergence in traps or divergence throughout the basin are needed. Petroleum accumulations and seeps along migration pathways need to be evaluated in terms of spill points, seal integrity, and related accumulations. Secondary migration through regional or tectonic fractures, fault zones, or permeable porous strata need to be evaluated from buoyancy and fluid-flow models, compositional data on fluid inclusions, secondary porosity occurrences and timing, petroleum shows and staining, and compositional changes in migrated petroleum. A major assumption in this feasibility study is that tar deposits in western Kentucky were derived from petroleum expelled from the New Albany Shale. Although organic geochemical studies have correlated the
petroleum in Illinois with the New Albany Shale (Hatch and others, 1990), no geochemical correlations have established the source of petroleum and tar in western Kentucky. These tars may account for more than two-thirds of the accountable petroleum within the basin. Therefore, an organic geochemical study to establish the source rock of these tars is essential to future material-balance assessments of the Illinois Basin.
Although this future research represents a major scientific effort, the focusing of this basic research effort has immediate applications to providing more accurate and credible petroleum resource assessments.
CONCLUSIONS
Critical to a material-balance assessment is the petroleum charge of source rocks within a basin. The two essential components for an accurate petroleum charge are wellcharacterized source rocks and realistic petroleum expulsion factors. Although the thermally immature cores and outcrops of the New Albany Shale are well characterized, the effect of significant thickening of this rock unit on its organic richness at higher maturity levels has not been well characterized. The steady-state and dilution models used in this study serve as good end members in projecting organic richness of the source rocks in their depocenter, but more accurate and member-specific models for organic richness are needed. This enhanced accuracy is attainable through better characterization of source rocks in cores representing higher levels of thermal maturity within the basin.
It also becomes apparent from this study that results from laboratory pyrolysis methods cannot be directly used to determine expulsion factors for naturally matured source rocks. The unnatural method by which a product is derived in Rock-Eval pyrolysis and the incorrect assumption that inert carbon of a source rock remains constant with increasing thermal maturity results in unrealistic petroleum-charge values ranging from 786 to 1, 172 billion barrels of petroleum. Although hydrous pyrolysis simulates the natural processes involved in petroleum generation and expulsion, the higher temperatures and lower hydrostatic pressures in these experiments compared with natural conditions results in exaggerated expulsion factors. More research is needed to evaluate the degree of exaggeration, but a qualitative evaluation suggests that hydrous pyrolysis may exaggerate expulsion factors by a factor of 2. Using this factor to correct expulsion efficiencies derived from hydrous pyrolysis gives more realistic petroleum-charge values ranging from 152 to 236 billion barrels of petroleum. Thirty-four to thirty-nine percent of this petroleum charge is derived from source rocks with thermal maturities between 0.6 and 0.7 percent Ro. If future studies indicate that petroleum expulsion did not occur within this maturity interval, then the petroleum charge for the basin could decrease to a range of 93 to 157 billion barrels.

REFERENCES CITED 27
Accounting for the amount of petroleum lost within or from a basin is also critical to a material-balance assessment. This aspect requires accurate determinations of residual petroleum in porous carrier beds, surface leakage because of insufficient traps along migration pathways, and removal of reservoired petroleum by erosion. Secondary migration in the Illinois Basin appears to have been dominated by vertical migration along fractures and faults. The significance of this style of migration is demonstrated by the fault-related tar sands of western Kentucky, which represent 15 to 30 billion barrels of undegraded petroleum. An additional 46 to 91 billion barrels of petroleum may have existed in overlying reservoirs before they were eroded during post-Permian time. These values suggest that more than two-thirds of the accountable petroleum expelled from the New Albany Shale migrated through fractures or faults into western Kentucky. This study also suggests that as much as 18 to 56 billion barrels of residual petroleum may reside in the Aux Vases Sandstone and other porous rocks, which may have acted in part as a porous carrier bed for lateral migration. It becomes apparent from this type of assessment that additional research on delineating migration pathways and understanding fluid flow from source rocks to traps is essential.
Petroleum material-balance assessments of established petroleum basins are feasible. Critical to this method is accurate determinations of petroleum charge from a source rock, discovered in-place petroleum, and petroleum losses due to migration, leakage, and erosion. Although this material balance yields reasonable values, the uncertainty in assumptions and variability in values make it too equivocal at this time to determine the precise amount of petroleum remaining to be discovered. This feasibility study yields a broad range of -37 to 144 billion barrels of petroleum from the New Albany Shale that remain to be discovered in conventional or unconventional accumulations of the Illinois Basin. The -37 billion barrels indicates that possibly no more undiscovered petroleum remains to be found or that the amounts of accountable petroleum loss to carrier beds or erosion are overstated. The 144 billion barrels indicates that possibly the expulsion factors or the steady-state model for organic richness for the source rocks in the mature part of the basin are overstated. Although this range is broad, it does encompass and does not completely exceed the range of accountable petroleum within the basin. As further data and research refine this type of assessment, this broad range of undiscovered petroleum is expected to narrow and provide a more precise upper limit to statistical-analog assessments currently employed. In addition, the quantitative understanding gained by material-balance assessments of established petroleum basins will provide a more scientific method for assessing petroleum in frontier basins on a global scale.
ACKNOWLEDGMENTS
This study was conducted as part of the 1995 National Assessment of United States Oil and Gas Resources by the U.S. Geological Survey under the direction of Donald Gautier. The timely completion of this study was made possible by the rapid and dedicated response of the Illinois State Geological Survey, Indiana Geological Survey, and Kentucky Geological Survey to the U.S. Geological Survey's request to conduct a material-balance feasibility study on the Illinois Basin. The authors appreciate the efforts of Illinois State Geological Survey in hosting the initial meeting that deliberated on the undertaking of this study in April 1994. The authors also appreciate the efforts of the Indiana Geological Survey in organizing field work for sample collection in October 1994, which was the actual start of this study. Lisa Pratt at Indiana University is also appreciated for encouraging her Ph.D. candidate, John Guthrie, to take time away from his dissertation to assist in the hydrous-pyrolysis experiments used in this study. The authors acknowledge and appreciate the efforts of Ted Daws in conducting RockEva! pyrolysis on the samples used in this study and Paul N. Irwin (Indiana Geological Survey) in computing the surface areas and volumes of source rocks used in this study. Barbara T. Hill and John Day in the photographic section and Roger Purcell and Kimberly Sowder in the technology transfer section of the Indiana Geological Survey are also acknowledged for their preparation of figures for this study. Critical reviews of this study by John M. Hunt (Woods Hole Oceanographic Institution), Joel Leventhal, Richard Mast, Leigh Price, Katherine V ames, and David Morse (Illinois State Geological Survey) provided helpful suggestions and comments that enhanced the clarity and content of the final manuscript. This publication, with its various data sets and convoluted text covering a wide range of concepts and computations, greatly benefited in clarity, organization, and quality from the thorough editing by Richard Scott. Lastly, the authors acknowledge the dedicated efforts of M.H. Barrows, R.M. Cluff, J.A. Lineback, R.F. Mast, M.C. Noger, and D.H. Swann in providing the geological framework that made this study possible.
REFERENCES CITED
Bailey, N.J.L., Jobson, A.M., and Rogers, M.A., 1973, Bacterial degradation of crude oil: Comparison of field and experimental data: Chemical Geology, v. 11, no. 1, p. 203-221.
Ball Associates, 1965, Surface and shallow-oil-impregnated rocks and shallow oil fields in the United States: Oklahoma City, Interstate Oil Compact Commission, U.S. Bureau of Mines Monograph 12,375 p.
Barrows, M.H., and Cluff, R.M., 1984, New Albany Shale Group (Devonian-Mississippian) source rocks and hydrocarbon generation in the Illinois Basin, in Demaison, G., and Murris, R.J.,

28 MATERIAL-BALANCE ASSESSMENT OF PETROLEUM, NEW ALBANY SHALE, ILLINOIS BASIN
eds., Petroleum Geochemistry and Basin Evolution: American Association of Petroleum Geologists Memoir 35, p. 111-138.
Barrows, M.H., Cluff, R.M., and Harvey, R.D., 1979, Petrology and maturation of dispersed organic matter in the New Albany Shale Group of the Illinois Basin, in Barlow, H., ed., Proceedings of the Third Eastern Gas Shale Symposium, October 1-3, 1979: DOE/METC/UP-79/6, p. 85-114.
---1980, Organic petrography, in Bergstrom, R.E., Shimp, N.F., and Cluff, R.M., eds., Geologic and Geochemical Studies on the New Albany Shale Group (Devonian-Mississippian) in Illinois: Illinois State Geological Survey Final Report to U.S. Department of Energy, Contract DE-AC21-76ET12142, p. 63-75.
Baskin, D.K., and Peters, K.E., 1992, Early generation characteristics of a sulfur-rich Monterey kerogen: American Association of Petroleum Geologists Bulletin, v. 76, no. 1, p. 1-13.
Beard, J., 1980, Devonian black shale study of western Kentucky, final status report: Morgantown, W.Va., Morgantown Energy Technology Center, U.S. Department of Energy, Contract EW-78-S-21-8215, 113 p.
Bell, J.S., 1989, Vertical migration of hydrocarbons at Alma, offshore Eastern Canada: Bulletin of Canadian Petroleum Geology,v.37,no.3,p.358-364.
Bethke, C.M., Reed, J.D., and Oltz, D.P., 1991, Long-range petroleum migration in the Illinois Basin: American Association of Petroleum Geologists Bulletin, v. 75, no. 5, p. 925-945.
Bond, D.C., Atherton, E., Bristol, H.M., Buschbach, T.C., Stevenson, D.L., Becker, L.E., Dawson, T.A., Fernalld, E.C., Schwalb, H., Wilson, E.N., Statler, A.T., Stearns, R.G., and Buehner, J.H., 1971, Possible future petroleum potential of region 9-Illinois Basin, Cincinnati arch, and northern Mississippi Embayment, in Cram, I.H., ed., Future Petroleum Provinces of the U.S.: Their Geology and Potential: American Association of Petroleum Geologists Memoir 15, v. 2, p. 1165-1218.
Bordenave, M.L., Espitalie, J., Leplat, P., Oudin, J.L., and Vandenbroucke, M., 1993, Screening techniques for source rock evaluations, in Bordenave, M.L., ed., Applied Petroleum Geochemistry: Paris, Editions Technip, p. 217-278.
Burnham, A.K., 1991, Oil evolution from a self-purging reactor: Kinetics and composition at 2°C/min and 2°C/h: Energy & Fuels, v. 5, no. 1, p. 205-214.
Carrigy, M.A., 197 4, Mesozoic geology of the Fort McMurray area, in Carrigy, M.A., ed., Guide to the Athabasca Oil Sands Area: Alberta Research Council Information Series 65, p. 77-102.
Cluff, R.M., 1980, Paleoenvironment of the New Albany Shale Group (Devonian-Mississippian) of Illinois: Journal of Sedimentary Petrology, v. 50, no. 3, p. 767-780.
Cluff, R.M., and Byrnes, A.P., 1990, Lopatin analyses of maturation and petroleum generation in the Illinois Basin, in Leighton, M.W., Kolata, D.R., Oltz, D.P., and Eidel, J.J., eds., Interior Cratonic Basins: American Association of Petroleum Geologists Memoir 51, p. 425-454.
Cluff, R.M., Reinboud, M.L., and Lineback, J.A., 1981, The New Albany Shale Group of Illinois: Illinois Geological Survey Circular 518, 83 p.
Collinson, C., and Atherton, E., 1975, Devonian System, in Willman, H.B., Atherton, E., Buschbach, T.C., Collinson, C., Frye, J.C., Hopkins, M.E., Lineback, J.A., and Simon, J.A., eds.,
Handbook of Illinois Stratigraphy: Illinois State Geological Survey Bulletin 95, p. 104-123.
Comer, J.B., 1991, Stratigraphic analysis of the Upper Devonian Woodford Formation, Permian Basin, west Texas and southeastern New Mexico: Texas Bureau of Economic Geology, Report of Investigation No. 201,63 p.
---1992, Organic geochemistry and paleogeography of Upper Devonian formations in Oklahoma and northwestern Arkansas, in Johnson, K.S., and Cardott, B.J., eds., Source Rocks in the Southern Midcontinent-1990 Symposium: Oklahoma Geological Survey Circular No. 93, p. 70-93.
Comer, J.B., Smidchens, Z., Irwin, P.N., Sowder, K.H., Frankie, W.T., Lumm, D.K., and Hamilton-Smith, T., 1994, Map showing mean random vitrinite reflectance (Ro) for New Albany Shale (Devonian and Mississippian) in the Illinois Basin, in Hasenmueller, N.R., and Comer, J.B., eds., Gas Potential of the New Albany Shale (Devonian and Mississippian) in the Illinois Basin: Gas Research Institute Final Report 92/0391, Illinois Basin Studies-2, plate 7.
Comet, P.A., McEvoy, J., Giger, W., and Douglas, A.G., 1986, Hydrous and anhydrous pyrolysis of DSDP leg 75 kerogens-A comparative study using a biological marker approach: Organic Geochemistry, v. 9, no. 4, p. 171-182.
Conkin, J.E., and Conkin, B.M., 1972, Guide to the Rocks and Fossils of Jefferson County, Kentucky, Southern Indiana, and Adjacent Areas: Louisville, Ky., University of Louisville Printing Services, 331 p.
---1984, Devonian and Mississippian bone beds, paracontinuities, and pyroclastics, and the Silurian-Devonian paraconformity in southern Indiana and northwestern Kentucky, in Rast, N., and Hay, H., eds., Field Trip Guide for Geological Society of America Annual Meeting, Southeastern and North-Central Sections: Lexington, Ky., University of Kentucky and Kentucky Geological Survey, p. 25-42.
Cooles, G.P., Mackenzie, A.S., and Quigley, T.M., 1986, Calculation of petroleum masses generated and expelled from source rocks: Organic Geochemistry, v. lO, nos. 1-3, p. 235-245.
Craft, B.C., and Hawkins, M.P., 1959, Applied Petroleum Reservoir Engineering: Englewood Cliffs, N.J., Prentice Hall, 437 p.
Crysdale, B.L., and Schenk, C.J., 1988, Bitumen-bearing deposits of the United States: U.S. Geological Survey Bulletin 1784, 45p.
Damberger, H.H., 1971, Coalification pattern of the Illinois Basin: Economic Geology, v. 66, no. 3, p. 488-494.
Devera, J.A., and Fraunfelter, G.H., 1988, Middle Devonian paleogeography and tectonic relationships east of the Ozark dome, southeastern Missouri, southwestern Illinois, and parts of southwestern Indiana and western Kentucky, in McMillan, N.J., Embry, A.F., and Glass, D.J., eds., Second International Symposium on the Devonian System: Calgary, Alberta, Canadian Society of Petroleum Geologists, v. 2, p. 179-197.
Devera, J.A., and Hasenmueller, N.R., 1990, Kaskaskia sequence Middle and Upper Devonian Series through Mississippian Kinderhookian Series, in Leighton, M.W., Kolata, D.R., Oltz, D.P., and Eidel, J.J., eds., Interior Cratonic Basins: American Association of Petroleum Geologists Memoir 51, p. 113-123.
Durand, B., Hue, A.Y., and Oudin, J.L., 1987, Oil saturation and primary migration: Observations in shales and coals from the Kerbau wells, Mahakam Delta, Indonesia, in Doligez, B., ed.,

REFERENCES CITED 29
Migration of Hydrocarbons in Sedimentary Basins: Paris, Editions Technip, p. 173-195.
England, W.A., Mackenzie, A.S., Mann, D.M., and Quigley, T.M., 1987, The movement and entrapment of petroleum fluids in the subsurface: London, Journal of the Geological Society, v. 144, p. 327-347.
Ettensohn, P.R., Barnett, S.F., and Norby, R.D., 1991, Middle Devonian black shales in Kentucky, in Proceedings, 1990 Eastern Oil Shale Symposium: Lexington, University of Kentucky Institute for Mining and Minerals Research, IMMR90/20 1, p. 218-226.
Evans, R.A., and Campbell, J.H., 1979, Oil shale retorting-A correlation of selected infrared absorbance bands with process heating rates and oil yields: In Situ, v. 3, p. 33-51.
Fedde, P.A., and Zavada, R.A., 1983, Solvent extraction of Kentucky tar sand in a 200 ton per day pilot plant, in Feingold, B.W., and Patla, T.J., eds., Synthetic Fuels from Oil Shale and Tar Sands: Chicago, Institute of Gas Technology, p. 563-578.
Freund, H., Clouse, J.A., and Otten, G.A., 1992, The effect of pressure on the kinetics of kerogen pyrolysis: American Chemical Society, Division of Fuel Chemistry Preprints, v. 37, no. 4, p. 1628-1635.
Frost, J.K., 1980, Chemical analysis of Devonian shales: Organic carbon content, in Bergstrom, R.E., Shimp, N.F., and Cluff, R.M., eds., Geologic and Geochemical Studies of the New Albany Shale Group (Devonian-Mississippian) in Illinois: Illinois State Geological Survey Final Report to U.S. Department of Energy, DOEIMETC/12142-26, p. 95-105.
Gas Processors Suppliers Association [GPSA], 1987, Engineering Data Book, Physical Properties, sec. 23: Tulsa, Gas Processors Suppliers Association, p. 23-1-23-65.
Griswold, J., and Kasch, J.E., 1942, Hydrocarbon-water solubilities at elevated temperatures and pressures: Industrial and Engineering Chemistry, v. 34, no. 7, p. 804-806. ·
Guerrant, R.P., 1964, Hydrocarbon-water solubilities at high temperatures under vapor-liquid-liquid equilibrium conditions: M.S. thesis, Pennsylvania State University, Department of Chemical Engineering, 124 p.
Guthrie, J.M., and Pratt, L.M., 1994, Geochemical indicators of depositional environment and source-rock potential for the Upper Ordovician Maquoketa Group, Illinois Basin: American Association of Petroleum Geologists Bulletin, v. 78, no. 5, p. 744-757.
Hamilton-Smith, T., 1993, Gas exploration in the Devonian shales of Kentucky: Kentucky Geological Survey, ser. XI, bulletin 4, 31 p.
Hasenmueller, N.R., and Bassett, J.L., 1981, Stratigraphy, in Hasenmueller, N.R., and Woodard, G.S., eds., Studies of the New Albany Shale (Devonian and Mississippian) and Equivalent Strata in Indiana: Bloomington, Indiana Geological Survey; Morgantown, W. Va., Morgantown Energy Teclmology Center, U.S. Department of Energy, DOE/MC/05204-1128, p. 5-32.
Hasenmueller, N.R., Boberg, W.S., Lumm, O.K., Hamilton-Smith, T., and Comer, J.B., 1994, Stratigraphy, in Hasenmueller, N.R., and Comer, J.B., eds., Gas Potential of the New Albany Shale (Devonian and Mississippian) in the Illinois Basin: Gas Research Institute Final Report 92/0391, Illinois Basin Studies-2, p. 14-21.
Hasenmueller, N.R., and Leininger, R.K., 1987, Oil-shale prospects for the New Albany Shale in Indiana: Indiana Geological Survey Special Report 40, 31 p.
Hatch, J.R., Risatti, J.B., and King, J.D., 1990, Geochemistry oflllinois Basin oils and hydrocarbon source rocks, in Leighton, M.W., Kolata, D.R., Oltz, D.P., and Eidel, J.J., eds., Interior Cratonic Basins: American Association of Petroleum Geologists Memoir 51, p. 403-424.
Heidman, J.L., Tsonopoulos, C., Brady, C.J., and Wilson, G.M., 1985, High-temperature mutual solubilities of hydrocarbons and water-Part II; Ethylbenzene, ethylcyclohexane, and n-octane: AIChE Journal, v. 31, no. 3, p. 376-384.
Hosterman, J.W., Meyer, R.F., Palmer, C.A., Doughten, M.W., and Anders, D.E., 1990, Chemistry and mineralogy of natural bitumens and heavy oils and their reservoir rocks from the United States, Canada, Trinidad, Tobago, and Venezuela: U.S. Geological Survey Circular 1047, 19 p.
Huff, B.G., 1987, Petroleum Industry in Illinois, 1985: Illinois State Geological Survey, Illinois Petroleum, no. 128, 140 p.
Huizinga, B.J., Aizenshtat, Z.A., and Peters, K.E., 1988, Programmed pyrolysis-gas chromatography of artificially matured Green River kerogen: Energy& Fuels, v. 2, no. 1, p. 74-81.
Hunt, J.M., 1979, Petroleum Geochemistry and Geology: San Francisco, W.H. Freeman and Co., 617 p.
Hunt, J.M., Lewan, M.D., and Rennet, J-C., 1991, Modeling oil generation with time-temperature index graphs based on the Arrhenius equation: American Association of Petroleum Geologists Bulletin, v. 75, no. 4, p. 795-807.
Jones, R.W., 1981, Some mass balance and geological constraints on migration mechanisms: American Association of Petroleum Geologists Bulletin, v. 65, no. 1, p. 103-122.
Kuuskraa, V .A., 1984, Major tar sand and heavy oil deposits of the United States, in Proceedings of the 1984 Eastern Oil Shale Symposium: Lexington, University of Kentucky Institute for Mining and Mineral Research and Kentucky Energy Cabinet, p. 117-123.
Leighton, M.W., Kolata, D.R., Oltz, D.P., Eidel, J.J., eds., 1990, Interior Cratonic Basins: American Association of Petroleum Geologists Memoir 51, 819 p.
Levorsen, A.l., 1967, Geology of Petroleum (2nd ed.): San Francisco, W.H. Freeman and Co., 724 p.
Lewan, M.D., 1983, Effects of thermal maturation on stable organic carbon isotopes as determined by hydrous pyrolysis of Woodford Shale: Geochimica et Cosmochimica Acta, v. 47, no. 8, p. 1471-1479.
---1985, Evaluation of petroleum generation by hydrous pyrolysis experimentation: Philosophical Transactions of the Royal Society of London, ser. A, v. 315, no. 1531, p. 123-134.
---1987, Petrographic study of primary petroleum migration in the Woodford Shale and related rock units, in Doligez, B., ed., Migration of Hydrocarbons in Sedimentary Basins: Paris, Editions Technip, p. 113-130.
---1992, Water as a source of hydrogen and oxygen in petroleum formation by hydrous pyrolysis: American Chemical Society, Division of Fuel Chemistry Preprints, v. 37, no. 4, p. 1643-1648.
---1993, Laboratory simulation of petroleum formation by hydrous pyrolysis, in Engel, M.H., and Macko, S.A., eds., Organic Geochemistry Principles and Applications: New York, Plenum Press, p. 419-442.

30 MATERIAL-BALANCE ASSESSMENT OF PETROLEUM, NEW ALBANY SHALE, ILLINOIS BASIN
---1994, Assessing natural oil expulsion from source rocks by laboratory pyrolysis, in Magoon, L., and Dow, W., eds., The Petroleum System-From Source to Trap: American Association of Petroleum Geologists Memoir No. 60, p. 52-70.
Lewan, M.D., Bjor~y. M., and Dolcater, D.L., 1986, Effects ofthermal maturation on steroid hydrocarbons as determined by hydrous pyrolysis of phosphoria retort shale: Geochimica et Cosmochimica Acta, v. 50, no. 9, p. 1977-1987.
Lewan, M.D., and Whitney, C.G., 1993, The inhibitory effect of smectite on petroleum expulsion in hydrous pyrolysis experiments: American Chemical Society Program and Abstracts of the 205th National Meeting, Division of Geochemistry, abstract no. 58.
Leythaeuser, D., Schaefer, R.G., and Radke, M., 1987, On the primary migration of petroleum, in Proceedings of the 12th World Petroleum Congress, Houston, 1987: London, Wiley and Sons, v. 2, p. 227-238.
---1988, Geochemical effects of primary migration of petroleum in Kimmeridge source rocks from Brae field area, North Sea. 1: Gross composition of C15+-soluble organic matter and molecular composition of Cts+-saturated hydrocarbons: Geochimica et Cosmochimica Acta, v. 52, no. 3, p. 701-713.
Lineback, J.A., 1981, Coordinated study of the Devonian black shale in the Illinois Basin: Illinois, Indiana, and western Kentucky: Final Report of U.S. Department of Energy Contract DE-AS21-78MC08214, 36 p.
MacGregor, D.S., and McKenzie, A.G., 1987, Quantification of oil generation and migration in the Malacca Strait region, Central Sumatra: Proceedings of the 15th Annual Indonesian Petroleum Association, October, 1986, p. 305-319.
Mackenzie, A.S., and Quigley, T.M., 1988, Principles of geochemical prospect appraisal: American Association of Petroleum Geologists Bulletin, v. 72, no. 4, p. 399-415.
Madec, M., and Espitalie, J., 1984, Application of pyrolysis to the characterization and the upgrading of the Toarcian oil shales from the Paris Basin: Fuel, v. 63, p. 1720-1725.
Mast, R.F., 1970, Size, development, and properties of Illinois oil fields: Illinois State Geological Survey, Illinois Petroleum, no. 93,42 p.
Mast, R.F., Dolton, G.L., Crovelli, R.A., Root, D.H., Attanasi, E.D., Martin, P.E., Cooke, L.W., Carpenter, G.B., Pecora, W.C., and Rose, M.B., 1989, Estimates of undiscovered conventional oil and gas resources in the United States-A part of the Nation's energy endowment: U.S. Geological Survey and Minerals Management Service, 44 p.
Mast, R.F., and Howard, R.H., 1990, Oil and gas production andrecovery estimates in the Illinois Basin, in Leighton, M.W., Kolata, D.R., Oltz, D.P., and Eidel, J.J., eds., Interior Cratonic Basins: American Association of Petroleum Geologists Memoir 51, p. 295-298.
McGrain, P., 1976, Tar sands (rock asphalt) of Kentucky-Areview: Kentucky Geological Survey, Series X, Report of Investigation 19, 16 p.
Meissner, F.F., 1978, Petroleum geology of the Bakken Formation, Williston Basin, North Dakota and Montana, in Economic Geology of the Williston Basin Symposium: Billings, Montana Geological Society, p. 207-327.
Michels, R., Landais, P., Elie, M., Gerard, L., and Mansuy, L., 1992, Evaluation of factors influencing the thermal maturation of organic matter during confined pyrolysis experiments:
American Chemical Society, Division of Fuel Chemistry Preprints, v. 37, no. 4, p. 1588-1594.
Momper, J.A., 1978, Oil migration limitations suggested by geological and geochemical considerations, in Roberts, W.H., and Cordell, R.J., eds., Physical and Chemical Constraints on Petroleum Migration: American Association of Petroleum Geologists Short Course, v. 1, p. Bl-B60.
Moore, H.F., Johnson, C.A., Sutton, W.A., Henton, L.M., and Chaffin, M.H., 1984, Aviation turbine fuels from tar sands, bitumen, and heavy oils: Process analysis: Wright-Patterson Air Force Base, Ohio, Air Force Wright Aeronautical Laboratories, AFWAL-TR-84-2070, part I, 144 p.
Nixon, R.P., 1973, Oil source beds in Cretaceous Mowry Shale of northwestern interior United States: American Association of Petroleum Geologists Bulletin, v. 57, no. 1, p. 136-161.
Noger, M.C., 1987, Tar-sand exploration in Kentucky, in Meyer, R.F., ed., Exploration for Heavy Crude Oil and Natural Bitumen: American Association of Petroleum Geologists, Studies in Geology 25, p. 521-536.
North, W.G., 1969, The Middle Devonian strata of southern Illinois: Illinois State Geological Survey Circular 441, 48 p.
Nuccio, V.F., and Hatch, J.R., 1994, Potential problems using vitrinite reflectance to calibrate thermal history models in the Illinois Basin: American Association of Petroleum Geologists Annual Convention, Official Program, Denver, v. 3, p. 226.
Oltz, D.P., and Crockett, J.E., 1989, Focusing future exploration in mature basins: Maturation and migration models integrated with timing of major structural events in Illinois: American Association of Petroleum Geologists Bulletin, v. 73, no. 8, p. 1037.
Oltz, D.P., Rupp, J.A., Keith, B., and Beard, J., 1990, Future hydrocarbon opportunities in the Illinois Basin, in Leighton, M.W., Kolata, D.R., Oltz, D.P., and Eidel, J.J., eds., Interior Cratonic Basins: American Association of Petroleum Geologists Memoir 51, p. 491-502.
Peters, K.E., Moldowan, J.M., and Sundararaman, P., 1990, Effects of hydrous pyrolysis on biomarker thermal maturity parameters: Monterey phosphatic and siliceous members: Organic Geochemistry, v. 15, no. 3, p. 249-265.
Price, L.C., 1980, Utilization and documentation of vertical oil migration in deep basins: Journal of Petroleum Geology, v. 2, no. 4, p. 353-387.
---1994, Basin richness and source rock disruption-A fundamental relationship?: Journal of Petroleum Geology, v. 17, no. 1, p. 5-38.
Price, L.C., and Barker, C.E., 1985, Suppression of vitrinite reflectance in amorphous-rich kerogen-A major unrecognized problem: Journal of Petroleum Geology, v. 8, no. 1, p. 59-84.
Price, L.C., and Wenger, L.M., 1992, The influence of pressure on petroleum generation and maturation as suggested by aqueous pyrolysis: Organic Geochemistry, v. 19, nos. 1-3, p. 141-159.
Robl, T.L., Barron, L.S., Koppenaal, D.W., and Bland, A.E., 1983, The geology and geochemistry of Devonian shales in south and west-central Kentucky, in Proceedings of the 1983 Eastern Oil S~ale Symposium, November 13-16, 1983, Lexington, Ky., University of Kentucky Institute for Mining and Minerals Research, p. 59-71.
Ronov, A.V., 1958, Organic carbon in sedimentary rocks in relation to the presence of petroleum: Geochemistry, no. 5, p. 510-536.

REFERENCES CITED 31
Rouchet, J., du, 1984, Migration in fracture networks; An alternative interpretation of the supply of the "giant" tar accumulations in Alberta, Canada-!: Journal of Petroleum Geology, v. 7,no.4,p.381-402.
Russell, W.L., 1933, The origin of the asphalt deposits of western Kentucky: Economic Geology, v. 28, no. 6, p. 571-586.
Sable, E.G., and Dever, G.R., Jr., 1990, Mississippian rocks in Kentucky: U.S. Geological Survey Professional Paper 1503, 125 p.
Schmoker, J.W., 1980, Organic content of Devonian shale in westem Appalachian Basin: American Association of Petroleum Geologists Bulletin, v. 64, no. 12, p. 2156-2165.
Schowalter, T.T., 1979, Mechanics of secondary hydrocarbon migration and entrapment: American Association of Petroleum Geologists Bulletin, v. 63, no. 5, p. 723-760.
Schowalter, T.T., and Hess, P.D., 1982, Interpretation of subsurface hydrocarbon shows: American Association of Petroleum Geologists Bulletin, v. 66, no. 9, p. 1302-1327.
Schwalb, H.R., and Norris, R.L., 1980, Studies of New Albany Shale in western Kentucky, final report: Morgantown, W.Va., Morgantown Energy Technology Center, U.S. Department of Energy, DOEJMETC/8215-1, 55 p.
Seyler, B., and Cluff, R.M., 1990, Petroleum traps in the Illinois Basin, in Leighton, M.W., Kolata, D.R., Oltz, D.P., and Eidel, J.J., eds., Interior Cratonic Basins: American Association of Petroleum Geologists Memoir 51, p. 361-402.
Shaver, R.H., Mikulic, D.G., Collinson, C., Atherton, E., Baxter, J.W., Kolata, D.R., Jacobson, R.J., Lineback, J.A., Palmer, J.E., Sargent, M.L., Trask, C.B., Willman, H.B., and Schwalb, H.K., 1985, Midwestern basin and arches region, in Lindberg, F.A., ed., Correlation of Stratigraphic Units of North America: American Association of Petroleum Geologists COSUNA Chart Series, 1 sheet.
Skripka, V.G., and Boksha, O.A., 1976, Solubility of water in individual n-alkanes and their mixtures at elevated temperatures and pressures [in Russian]: Trudi Vsesouznogo NauchndIssledo-Vatel' skogo Instituta, v. 61, p. 96-110.
Swann, D.H., and Bell, A.H., 1958, Habitat of oil in the Illinois Basin, in Weeks, L.G., ed., Habitat of Oil: Tulsa, American Association of Petroleum Geologists, p. 447-472.
Published in the Central Region, Denver, Colorado Manuscript approved for publication May 31, 1995 Edited by Richard W. Scott, Jr. Graphics prepared by the Indiana Geological Survey Photocomposition by Shelly A. Fields Cover art created by Mitchell E. Henry
*U.S. GOVERNMENT PRINTING OFFICE: 1995-673-046(86123
Tannenbaum, E., Huizinga, B.J., and Kaplan, I.R., 1986, Role of minerals in thermal alteration of organic matter-ll: A material balance: American Association of Petroleum Geologists Bulletin, v. 70, no. 9, p. 1156-1165.
Tannenbaum, E., Starinsky, A., and Aizenshtat, Z., 1987, Light oils-Transformation to heavy oils and asphalts-Assessment of the amounts of hydrocarbons removed and hydrologicalgeological control of the process, in Meyer, R.F., ed., Exploration for Heavy Crude Oil and Natural Bitumen: American Association of Petroleum Geologists, Studies in Geology No. 25, p. 221-239.
Thomas, K.P., Barbour, R.V., Branthaver, J.P., and Dorrence, S.M., 1983, Chemical and physical properties of tar sand, bitumens, and thermally recovered oils, in Feingold, B. W., and Patla, T.J., eds., Synthetic Fuels from Oil Shale and Tar Sands: Chicago, Institute of Gas Technology, p. 191-210.
Treworgy, J.D., 1990, Kaskaskia sequence Mississippian Valmeyeran and Chesterian Series, in Leighton, M.W., Kolata, D.R., Oltz, D.P., and Eidel, J.J., eds., Interior Cratonic Basins: American Association of Petroleum Geologists Memoir 51, p. 109-112.
Tsonopoulos, C., and Wilson, G.M., 1983, High-temperature mutual solubilities of hydrocarbons and water-Part 1: Benzene, cyclohexane and n-hexane: AIChE Journal, v. 29, no. 6, p. 990-999.
Walters, E.J., 1974, Review of the world's major oil sand deposits, in Hills, L. V., ed., Oil Sands-Fuel of the Future: Canadian Society of Petroleum Geologists, Memoir 3, p. 148-167.
Ward, G.D., 1983, In-situ production of heavy oil from Kentucky tar sand, in Feingold, B.W., and Patla, T.J., eds., Synthetic Fuels from Oil Shale and Tar Sands: Chicago, Institute of Gas Technology, p. 595-610.
Williams, D.A., Noger, M.C., and Gooding, P.J., 1982, Investigation of subsurface tar-sand deposits in western Kentucky: Kentucky Geological Survey, Series XI, Information Circular 7, 25 p.
Workman, L.E., and Gillette, T., 1956, Subsurface stratigraphy of the Kinderhook Series in Illinois: Illinois State Geological Survey Report of Investigation 189,46 p.