assessment of pollution risk mapping methods in an eastern ... of pollution.pdfcomparative...
TRANSCRIPT

55
INTRODUCTION
Good quality freshwater resources are getting limited with an uneven geographical distribu-tion during the last few decades, mainly due to pollution pressures from anthropogenic activi-ties (Dimitriou 2008; Matiatos 2016). This prob-lem is enhanced for the groundwater resources which degrade at an even faster pace due to the increasing pressure from climate change, popu-lation growth and economic activities (Eckhardt & Stackelberg 1995; Zhang et al. 1996; Karatzas & Psarropoulou 2014).
The assessment and mapping of groundwa-ter vulnerability and pollution risk is a widely used, modern approach, to recognize and demar-cate areas that are more prone to contamination than others, as a result of the physical protective mechanisms and the existing pollution pressures (Babiker et al. 2005; Dimitriou et al. 2008; Mar-tínez-Bastida et. al 2010). The output from this process is important since it allows the prioritiza-tion of groundwater bodies based on their degree
of groundwater vulnerability and pollution risk, which can then dictate the need for preventive and/or restoration measures.
The groundwater pollution risk depends on both the vulnerability of the aquifer (due to its natural characteristics) and the pollution loads above the soil surface (Dimitriou et al. 2008) and therefore an area can be characterized by high or very high vulnerability but at the same time of very low pollution risk, if the associated pollution pressures are limited. (Boughriba et al. 2010)
In order to assess the groundwater vulner-ability several methods exist, each one hav-ing specific advantages and disadvantages. Gogu & Dassargu (2000), and Gogu et al. (2003) applied various such techniques and performed a comparative assessment to identify the optimum methodology. The results of this study indicated that each method provided different results be-cause the groundwater vulnerability is not a mea-surable quantity but a qualitative index, which often leads to ambiguous results. Nevertheless, in areas with spatially or temporally limited wa-
Journal of Ecological Engineering Received: 2017.10.18Accepted: 2017.11.02Published: 2018.01.01Volume 19, Issue 1, January 2018, pages 55–68
https://doi.org/10.12911/22998993/79646
Assessment of Pollution Risk Mapping Methods in an Eastern Mediterranean Catchment
Dimitrios Michalopoulos1, Elias Dimitriou1,2*
1 Hellenic Open University, School of Science and Technology, Patras, Greece, e-mail: [email protected] Hellenic Centre for Marine Research, Institute of Inland Waters, Anavissos, Attika, Greece* Corresponding author’s e-mail: [email protected]
ABSTRACTThe protection and preservation of good groundwater quality is of critical importance worldwide, nowadays. In-creasing urbanization, economic development and agricultural activities, combined with limited precipitation con-tribute to the quantitative and qualitative degradation of groundwater resources, especially in the eastern Mediter-ranean region. For this purpose, a series of actions are implemented including groundwater vulnerability mapping that can depict prone to pollution aquifers which need protection and/or restoration measures. In this study, the efficiency of two well-known methodologies (COP and DRASTIC) for groundwater vulnerability and pollution risk mapping was assessed in the Sperchios river basin. The vulnerability and pollution risk maps of the two meth-odologies were spatially compared to each other and the observed similarities and differences were discussed and explained. The output of the study shows that in the particular geoenvironmental conditions DRASTIC method performs better than the COP, particularly in the lowland, porous media aquifer.
Keywords: vulnerability mapping, pollution risk mapping, groundwater pollution, COP, DRASTIC

Journal of Ecological Engineering Vol. 19(1), 2018
56
Figure 1. Geological map of Sperchios catchment
ter and pollution related data, groundwater vul-nerability and pollution risk mapping can offer valuable information for the sustainable manage-ment and protection of the groundwater resources (Dimitriou et al., 2008).
The recent legislative framework in most countries, including European Union member states (Groundwater Directive, 2006/118/EC) promotes the need to improve the groundwater management practices by using state-of-the-art techniques and approaches such as the vulner-ability and pollution risk mapping.
In the particular study, two different vulner-ability and risk assessment methods have been used (COP and DRASTIC) to compare and evaluate them in an Eastern Meditteranean case study area (Spercheios river – Central Greece). The COP method is a relatively newly developed approach within the European COST ACTION 620 project, (Zwahlen 2003) focusing mainly on the protection of carbonate aquifers (Daly et al. 2002; Vias et al.,2006; Karaouzas et al., 2008; Dimitriou et al. 2008; Polemio et al., 2009). The DRASTIC methodology (Aller et. al. 1987) is widely used approach which has provided satis-factory results mainly on porous media aquifers
(Babiker et al. 2005; Panagopoulos et al., 2006; Voudouris et al. 2010).
METHODOLOGY
Study Area
Sperchios’ basin is located on the East of con-tinental Greece (Fig. 1) and covers an area of 1818 Km2 with an average height of 636 m (Dimitriou et al. 2011). The topographic terrain is particular-ly steep towards the south with an average slope of 33% (Psomiadis 2010), due to Mountain Oiti (maximum altitude 2150 m). The basin is struc-tured by igneous and sedimentary rocks with the greater percentage of the area covered by flysch formations (41%) followed by alluvial deposits (24.9%), carbonate rocks (19.4%) and ophiolitic formation (10%, Fig. 1).
The main land uses in the area are: a) ag-ricultural (26.4% of the basin), b) pastures (34.1%), c) forests (34.8%) and d) urban or abandoned areas 4.7% (Dasenakis et al. 2007). The average monthly temperatures range within the year from 6.9oC to 26.1oC, while the aver-
57
Journal of Ecological Engineering Vol. 19(1), 2018
age annual precipitation varies strongly within the basin from 515 mm to 1693 mm (due to oro-graphic effect).
COP Method
The COP methodology (Zwahlen 2003) was developed under the European program COST ACTION 620 in order to assess and map the gen-eral vulnerability, especially in karstic aquifers. It is the acronym of the three main factors C, O, P used for the vulnerability assessment of the aqui-fer. It represents an important step forward in as-sessing the vulnerability of groundwater inside the karst aquifers, particularly in Mediterranean-type conditions (Vias et al. 2006). It takes into account the specific hydrogeological properties of karst formations and can be implemented, considering variable climatic conditions and different types of carbonate aquifers, in both diffuse flow and in pipe flow systems (Polemio et al. 2009). This method produces three maps for the study area that de-scribe: (a) the flow concentration (C map), (b) the protection of the overlying layers of the aquifer (O map) and (c) the rainfall regime (P map) which can affect positively or negatively the natural protec-tion (Dimitriou et al. 2008; Karaouzas et al. 2009).
For the construction of the aforementioned maps, geological, topographical, and soil maps have been acquired by the Institute of Geological and Mineralogical Explorations (IGME) and the Geographic Topography Department of the Hel-lenic Army while for the land use map, the Corine Land Cover system has been used. A series of re-cent hydrogeological studies provided additional data for the study area (Dasenakis et al. 2005; Psomiadis 2010).
To construct the C Map, the study area was classified according to the degree of karstifica-tion (the existence of permeable – impermeable surface layers) based on the geological map, the inclination (from the topographic map) and veg-etation cover ratio (from Forestry and land use maps) in accordance with the weighting factors of the methodology.
For the O Map, which describes the protec-tion provided to the aquifer from the surface soil layers (soil cover [OS]) and the overlying geo-logical formations (OL), the data that was inserted regards: (a) the soil texture of overlying layers (clayey to sandy texture with thickness ranging from 0.5m to 1m) and (b) the lithology and the conditions of the unsaturated zone (in formations
with high to low permeability with aquifers rang-ing from confined to unconfined).
Finally, the P Map depicts the spatial dis-tribution of the amount and intensity of rainfall in the basin (Karaouzas et al. 2009) and reflects the impact of rainfall on the transfer of the pol-lutant in the groundwater. The relevant precipita-tion data were acquired from the local network of meteorological stations belonging to the National Meteorological Service (NMS) and the National Observatory of Athens (NOA).
The algebraic multiplication of the three aforementioned maps produced the basin’s vul-nerability index which was classified on 5 vulner-ability classes as indicated by the COP methodol-ogy (Zwahlen 2003).
DRASTIC Method
The DRASTIC method (Aller et al. 1987) is one of the most widely used for the assessment of groundwater vulnerability with several key hy-drogeological parameters forming its basis. The DRASTIC technique is flexible and the user can modify it by adding parameters or by changing weighting factors (Al-Adamat et al. 2003; Vou-douris 2006; Kazakis & Voudouris 2015).
The word DRASTIC is an acronym resulting from the initials of: Depth to groundwater, Re-charge rate, Aquifer media, Soil media, Topogra-phy, Impact of vadose zone and hydraulic Con-ductivity of the aquifer.
The DRASTIC Index (DI) calculated from the following equation:
DI = DrDw + RrRw + ArAw + SrSw + + TrTw + IrIw + CrCw (1)
where: the r index is the value and the w in-dex the weight of each parameter (Nobre et al. 2007).
The Drastic index (DI) is derived from the evaluation of each parameter with a weighting factor ranging from 1 to 5 (w index) and the value of each hydrogeological parameter with values ranging from 1 to 10 (r index) based on their im-pact on the aquifer’s vulnerability.
The same information and data was used for both vulnerability methods (COP and DRAS-TIC), while for DRASTIC the ‘Depth to the Aquifer’ parameter was extracted from datasheets regarding 107 boreholes in the area. The recharge rate (R) resulted from the amount of rainfall in the basin multiplied by the relevant infiltration coef-

Journal of Ecological Engineering Vol. 19(1), 2018
58
ficients for each hydrogeologic formation type (Psomiadis 2010). The factors referring to the aquifer media (A) and the impact of the vadose zone (I) resulted from the use of the geological maps in combination with the boreholes descrip-tion. The parameter of the hydraulic conductivity factor (C) was extracted by using the local hydro-lithologic maps based on the permeability of the region’s formations. Finally, the parameters men-tioned in the soil media (S) and Topography (ter-rain inclination) (T) were calculated based on the corresponding soil and topographic maps with the use relevant GIS tools (ArcMap software).
Risk mapping
Groundwater Pollution Risk is defined as the possibility of an aquifer’s quality to be degraded through transfer of chemical or other substances from surface pollution sources (Nobre et al. 2007). The Risk map is the result of the combination of the vulnerability and the pollution pressures map (Hazard map, Karaouzas et al. 2009). The hazard map was produced by using the Corine Land cov-er map for the study area after assigning a hazard index to each separate land cover class according to the relevant Cost Action 620 project methodol-ogy (Zwhalen 2003).
The product of each vulnerability map (COP and DRASTIC) with the respective hazard map was estimated based on the equation:
Ri = ρ / Ηi (1)where: Ri is the Risk intensity index, Hi the Hazard index and ρ the vulnerabil-
ity index from the vulnerability maps.
The resulting Risk maps incorporated 5 class-es (from very low to very high), according to Table 1.
Comparative assessment
The vulnerability and risk maps from the COP and DRASTIC methods were initially compared in the ArcMap software by estimating the per-
centage coverage for each class in the study area as well as the geographical trends of the differ-ences and similarities. The descriptive statistics of the different maps were estimated and com-pared to each other while a qualitative compari-son followed by using pollutants concentration maps in the lowland part of the catchment which were correlated with the risk indices of COP and DRASTIC maps. For this purpose, a network of validation points was created randomly in the Ar-cMap software by using a cell size of 300 me-ters. From these cells, the geographic coordinates were extracted, as well as the risk values from the two COP and DRASTIC maps respectively. Next, the 20277 pairs of risk values were used in a statistical analysis software (SPSS) to perform a similarity analysis.
Moreover, data regarding concentrations of Nitrate (NO3) and Phosphate (PO4) ions have been used to assess the efficiency of the exam-ined methods, from existing boreholes based on earlier research efforts (Psomiadis 2010). The NO3 and PO4 concentrations have been spatially interpolated in the central part of the basin where the boreholes exist by using Spline interpolation algorithm. The risk values of the all the cells of the interpolated surface (300 m size) from COP and DRASTIC maps were correlated with the NO3 and PO4 concentrations of the same points in order to identify which method is in agreement with the data and therefore performs better.
All of the above comparisons illustrated the strengths and weaknesses of each method in the specific type of Eastern Mediterranean basins as well as the potential improvements that the methods need.
RESULTS
Hazard map
The hazard map of the case study area (Figure 2), indicates that the main polluting pres-sures appear in the lowlands, at the central part of
Table 1. Classification based on the categories of Risk map
ρ Ηi 1/ Hi ρ*(1/Ηi) Risk class5 0–24 >0.042 >0.167 1 Very low4 24–48 0.042–0.021 0.167–0.063 2 Low3 48–72 0.021–0.014 0.063–0.028 3 Moderate2 72–96 0.014–0.014 0.028–0.010 4 High1 96–120 <0.010 <0.010 5 Very high

59
Journal of Ecological Engineering Vol. 19(1), 2018
Spercheios basin, where intensive farming activi-ties and rural towns and villages without waste-water treatment plants systems exist. The highest pressures occur in areas where industries, quarries and sanitary landfills are sited, as well as settle-ments that are not connected to sewage networks or dispose their effluents in septic tanks. The rest of the area that covers mainly the mountainous part of the basin and consist of natural vegetation areas, are classified as of low and very low pol-lution hazard. This map has been combined with the following groundwater vulnerability maps from COP and DRASTIC methods to estimate the corresponding pollution risk maps.
Vulnerability and Risk mapping
The vulnerability maps (COP and DRAS-TIC) show that the areas that are mostly prone to pollution, are the ones consisting mainly by carbonate formations (Figures 3 and 4). Both methods display areas ranging from very high to very low vulnerability, while the very low vulner-ability areas cover most of the examined basin in both methods.
Moderate vulnerability areas are the ones mainly covered by high-permeability limestone,
with relatively steep slopes, presence of imper-meable soil horizon and relatively high intensity rainfall. These conditions provide some degree of physical protection to the naturally vulner-able limestones which are therefore classified as of moderate vulnerability. Moreover, areas with karstified limestone of high permeability, with complete lack or permeable soil horizon, moder-ate slopes and rainfall intensity are classified as of high and very high vulnerability (Figures 3 and 4).
The main difference between the two vulner-ability maps can be observed in the central, low-land part of the basin, where the DRASTIC meth-od displays moderate and high vulnerability val-ues where COP illustrates low vulnerability val-ues (Figures 3 and 4). The vulnerability classes in the mountainous part of the basin are very similar in both methods apart from some specific, lim-ited regions in which COP map is classified as of moderate and DRASTIC as of high vulnerability.
Both methods agree on the same classes in the largest part of the basin (72.59%) which covers mainly the highland part of the basin (Table 2).
Most of the differences in vulnerability clas-sification are located mainly in areas dominated by tertiary sediments, as well as in mountainous karstic formation regions at the northeast part of
Figure 2. Hazard map of Spercheios’ basin

Journal of Ecological Engineering Vol. 19(1), 2018
60
Figure 3. Vulnerability map of the COP method
Figure 4. Vulnerability map of the DRASTIC method

61
Journal of Ecological Engineering Vol. 19(1), 2018
the basin. In these areas, (22.5% of the basin), the COP method indicates lower vulnerability than DRASTIC. Differences appear also in the south-east part of the basin (4.9% of the basin) where, DRASTIC methodology displays lower vulner-ability than COP (Table 2).
The commonly classified areas in both meth-ods are geographically restricted to the mountain-ous part of the basin as well as to the southeastern part (figure 5). The central and eastern part of the basin (mainly alluvial sediments and ophiolites respectively) are classified differently (28% of the basin). The degree of similarity between the two methods, in each vulnerability class, indicate that
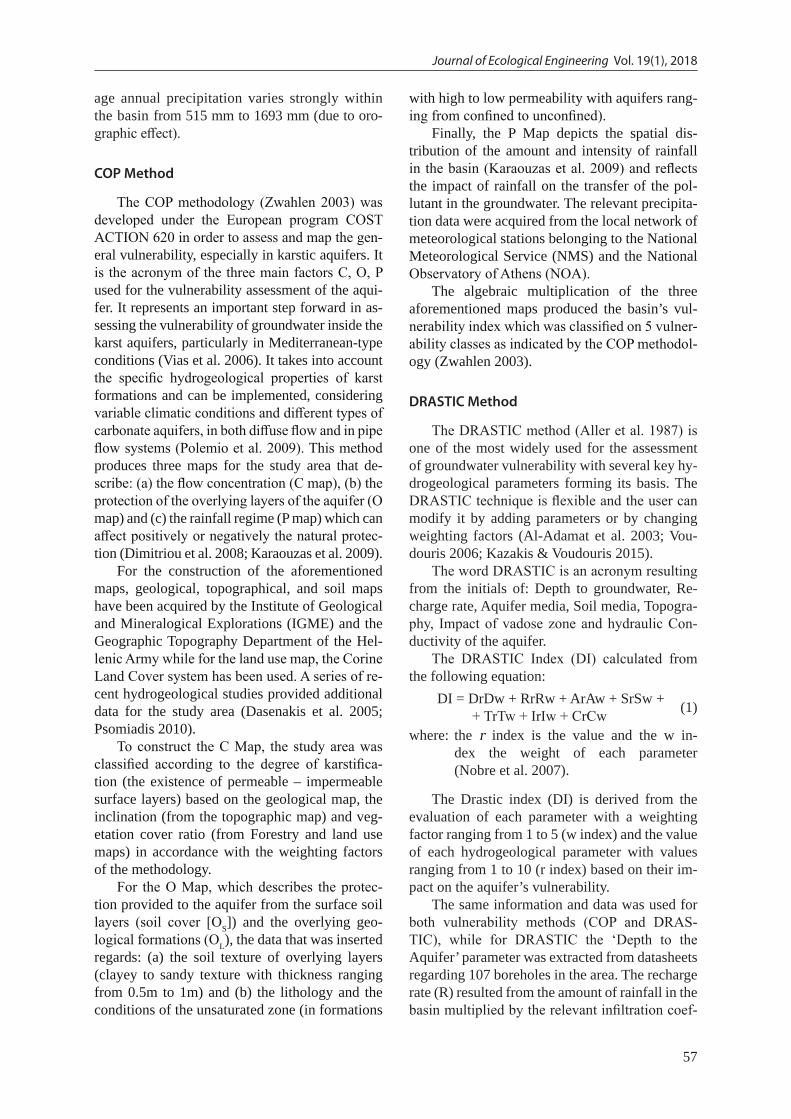
the highest agreement is in the very low vulnera-bility class (in 54.2% of the basin) while in the rest of the classes the agreement fluctuates from 0% (in very high vulnerability), to 7% in low vulner-ability (Figure 6). COP map covers larger areas in the very low and low vulnerability classes while DRASTIC illustrates larger surfaces in moderate and high classes (more ‘pessimistic’ results).
Similarly, the risk maps of the two meth-ods show values ranging from very low to high (4 classes), thus lacking values of very high risk (less than 1% of the basin in both meth-ods, Figures 7 and 8, Table 3). This is because the hazard map of the study basin (Figure 2) il-
Table 2. Comparative table of DRASTIC – COP vulnerability classification
Vulnerability classification Area km2 Area km2 (aggregate) Area % Area % (aggretate)
DRASTIC > COP0.0088
411.180.0005
22.534.40 1.88376.77 20.63
COP > DRASTIC 89.34
89.424.89
4.90.09 0.005
COP = DRASTIC 1325.56 72.59TOTAL 1826.17 100
Figure 5. Common areas of the Drastic and COP methods for each vulnerability class
Journal of Ecological Engineering Vol. 19(1), 2018
62
Figure 6. Comparative percentage bar chart of areas occupied by vulnerability classes
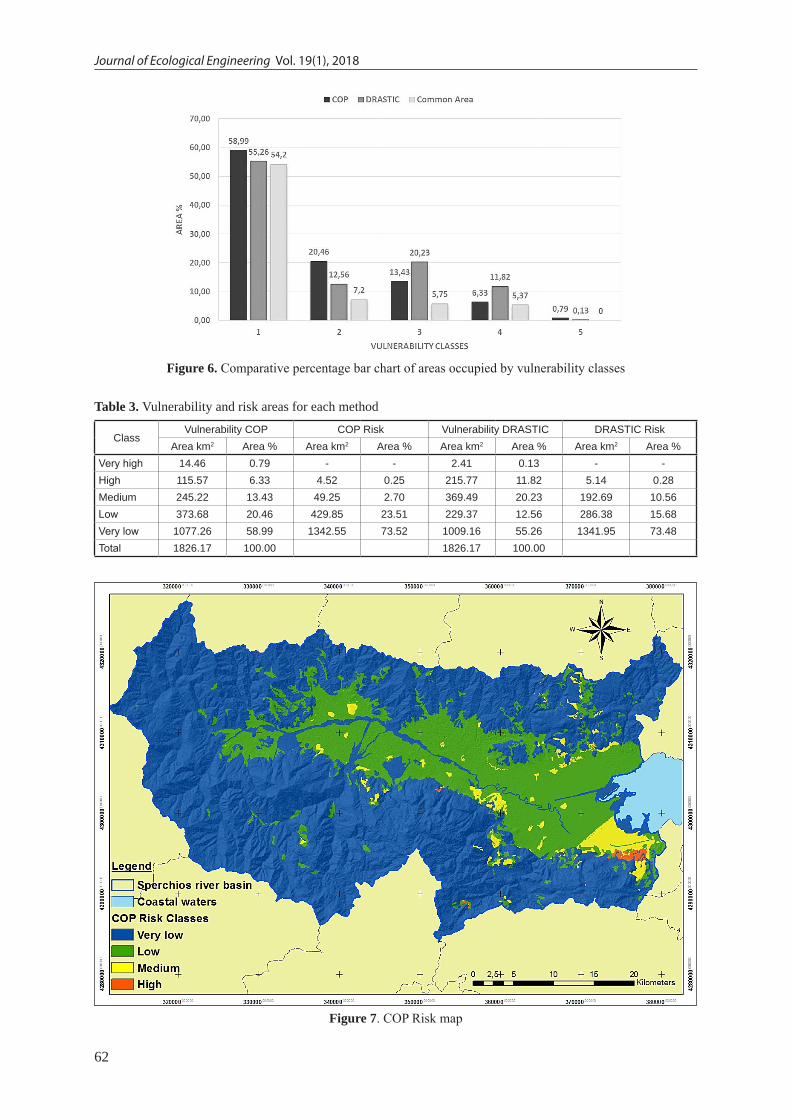
Table 3. Vulnerability and risk areas for each method
ClassVulnerability COP COP Risk Vulnerability DRASTIC DRASTIC Risk
Area km2 Area % Area km2 Area % Area km2 Area % Area km2 Area %Very high 14.46 0.79 - - 2.41 0.13 - -High 115.57 6.33 4.52 0.25 215.77 11.82 5.14 0.28Medium 245.22 13.43 49.25 2.70 369.49 20.23 192.69 10.56Low 373.68 20.46 429.85 23.51 229.37 12.56 286.38 15.68Very low 1077.26 58.99 1342.55 73.52 1009.16 55.26 1341.95 73.48Total 1826.17 100.00 1826.17 100.00
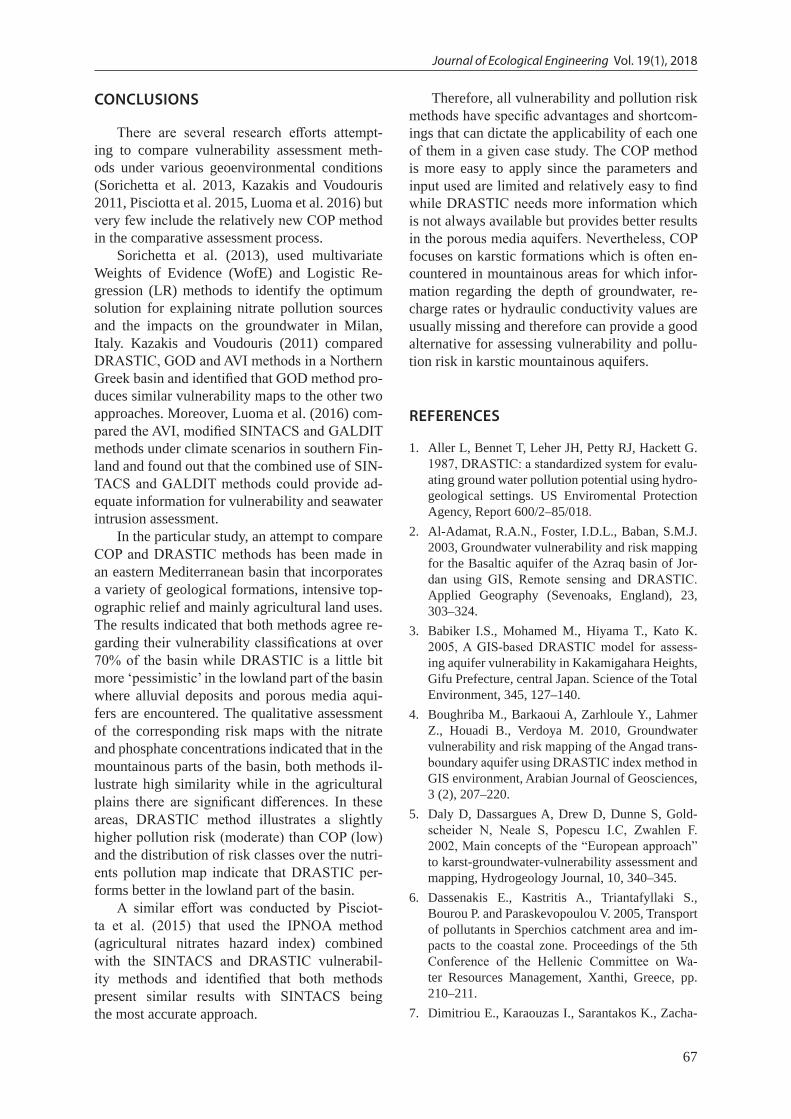
Figure 7. COP Risk map

63
Journal of Ecological Engineering Vol. 19(1), 2018
lustrates very limited areas of high hazard and none of very high hazard. DRASTIC displays most of the lowland area as of moderate pollution risk while COP illustrates the same area as of low vulnerability. The peripheral, high altitude part of the basin is characterized as of very low pollution risk in both methodologies while DRASTIC pres-ents a higher percentage of rural/urban areas as of moderate risk in relation to the COP.
Statistical analysis of the Risk maps
The validation points (20277 points) in the two risk maps (COP and DRASTIC) were strong-ly correlated, (r = 0.715) at p < 0.05, which indi-cate that both methodologies perform consistent-ly, in a similar pattern, at the particular study area.
The distribution of the validation points in risk classes illustrates that for the very low risk category both methodologies perform almost identically (more than 99% agreement) while in low risk class COP has 33% more points than DRASTIC and in the moderate risk class DRAS-TIC incorporates approximately 3 times more points than COP (Fig. 9). This shows that DRAS-
TIC tends to be more “pessimistic”, with respect to pollution risk, than COP. Moreover, the high pollution risk class points are below 0.3% of the total and the difference between the methods is negligible which do not allow for safe conclu-sions to be drawn for the particular class.
The descriptive statistics confirm the afore-mentioned statements since the mean and standard deviation of the risk index for Drastic is slightly higher than COP while kyrtosis and skewness are higher COP compared to DRASTIC (Table 4).
Qualitative comparison of the two methods
The methods efficiency was also assessed based on NO3 and PO4 concentrations from bore-holes that exist mainly in the lowland part of the basin, on the alluvial aquifer. Thus, this compari-son is mostly valid for the porous media aquifer where most of the pollution pressures and ground-water abstractions are located.
The distribution of PO4 in the study area shows high values (more than 1 mg/l) in the east-ern and western parts of the lowland area where relatively large towns and agricultural areas exist.
Figure 8. DRASTIC Risk map

Journal of Ecological Engineering Vol. 19(1), 2018
64
The Spercheios deltaic region is also rich in PO4 which is expected due to the intensive farming practices that are applied there (Figure 10). The NO3 levels are particularly elevated (more than 60 mg/l) in the northwest, central and southeast parts of the study area which coincide with exten-sive agricultural plains. The areas with high NO3 and PO4 concentrations (Figures 10 and 11) fall mostly within the moderate pollution risk zone in the DRASTIC map and within the low pollution risk zone in the COP map (Figures 7 and 8).
The frequency distribution diagrams of ni-trate and phosphate ions are pretty similar for both methods in the very low pollution risk class (class 1) while the differences increase as pollu-tion risk increases (Figures 12 and 13). The COP has a large part of its low pollution risk zone with NO3 values above 20 mg/l, which is not the case for DRASTIC while the contrary is ob-served for the areas characterized as of moder-ate pollution risk (class 3, Figure 12). The COP
method illustrates a significant part of the high risk zone in areas with relatively low NO3 val-ues (below 20 mg/l) while DRASTIC indicates a relatively smooth distribution of its high risk areas in NO3 values above 20 mg/l (with a peak at 60 mg/l, figure 12). Regarding phosphates, both methods present similar patterns for the very low and low risk zones while in the moder-ate risk zone DRASTIC have a larger area dis-tributed in high PO4 values than COP. However, in the high risk zone COP performs better than the DRASTIC method since it illustrates an in-creasing area as PO4 values increase (Figure 13). Therefore, given the above-mentioned trends, DRASTIC method is more efficient than COP in the lowland part of the basin, where alluvial aquifers exist which was partially expected since COP method focuses mostly on the protection of Karstic aquifers while DRASTIC structure is more compliant with the characteristics of sedi-mentary, free-surface groundwater bodies.
Figure 9. Frequency diagram of each method’s risk class
Table 4. Analysis results of the two methodsCOP Risk DRASTIC Risk
Mean 1.297 Mean 1.377
Standard Error 0.004 Standard Error 0.005
Standard Deviation 0.529 Standard Deviation 0.682
Sample variance 0.279 Sample variance 0.465
Kurtosis 2.556 Kurtosis 1.230
Skewness 1.686 Skewness 1.593
Sum 26309 Sum 27929
Count 20277 Count 20277

65
Journal of Ecological Engineering Vol. 19(1), 2018
Figure 10. Phosphate allocation in central
Figure 11. Nitrate allocation in central basin

Journal of Ecological Engineering Vol. 19(1), 2018
66
Figure 12. Frequency histograms of nitrates concentrations per risk class
Figure 13. Frequency histograms of phosphate concentrations per risk class
67
Journal of Ecological Engineering Vol. 19(1), 2018
CONCLUSIONS
There are several research efforts attempt-ing to compare vulnerability assessment meth-ods under various geoenvironmental conditions (Sorichetta et al. 2013, Kazakis and Voudouris 2011, Pisciotta et al. 2015, Luoma et al. 2016) but very few include the relatively new COP method in the comparative assessment process.
Sorichetta et al. (2013), used multivariate Weights of Evidence (WofE) and Logistic Re-gression (LR) methods to identify the optimum solution for explaining nitrate pollution sources and the impacts on the groundwater in Milan, Italy. Kazakis and Voudouris (2011) compared DRASTIC, GOD and AVI methods in a Northern Greek basin and identified that GOD method pro-duces similar vulnerability maps to the other two approaches. Moreover, Luoma et al. (2016) com-pared the AVI, modified SINTACS and GALDIT methods under climate scenarios in southern Fin-land and found out that the combined use of SIN-TACS and GALDIT methods could provide ad-equate information for vulnerability and seawater intrusion assessment.
In the particular study, an attempt to compare COP and DRASTIC methods has been made in an eastern Mediterranean basin that incorporates a variety of geological formations, intensive top-ographic relief and mainly agricultural land uses. The results indicated that both methods agree re-garding their vulnerability classifications at over 70% of the basin while DRASTIC is a little bit more ‘pessimistic’ in the lowland part of the basin where alluvial deposits and porous media aqui-fers are encountered. The qualitative assessment of the corresponding risk maps with the nitrate and phosphate concentrations indicated that in the mountainous parts of the basin, both methods il-lustrate high similarity while in the agricultural plains there are significant differences. In these areas, DRASTIC method illustrates a slightly higher pollution risk (moderate) than COP (low) and the distribution of risk classes over the nutri-ents pollution map indicate that DRASTIC per-forms better in the lowland part of the basin.
A similar effort was conducted by Pisciot-ta et al. (2015) that used the IPNOA method (agricultural nitrates hazard index) combined with the SINTACS and DRASTIC vulnerabil-ity methods and identified that both methods present similar results with SINTACS being the most accurate approach.
Therefore, all vulnerability and pollution risk methods have specific advantages and shortcom-ings that can dictate the applicability of each one of them in a given case study. The COP method is more easy to apply since the parameters and input used are limited and relatively easy to find while DRASTIC needs more information which is not always available but provides better results in the porous media aquifers. Nevertheless, COP focuses on karstic formations which is often en-countered in mountainous areas for which infor-mation regarding the depth of groundwater, re-charge rates or hydraulic conductivity values are usually missing and therefore can provide a good alternative for assessing vulnerability and pollu-tion risk in karstic mountainous aquifers.
REFERENCES
1. Aller L, Bennet T, Leher JH, Petty RJ, Hackett G. 1987, DRASTIC: a standardized system for evalu-ating ground water pollution potential using hydro-geological settings. US Enviromental Protection Agency, Report 600/2–85/018.
2. Al-Adamat, R.A.N., Foster, I.D.L., Baban, S.M.J. 2003, Groundwater vulnerability and risk mapping for the Basaltic aquifer of the Azraq basin of Jor-dan using GIS, Remote sensing and DRASTIC. Applied Geography (Sevenoaks, England), 23, 303–324.
3. Babiker Ι.S., Mohamed M., Hiyama T., Kato K. 2005, A GIS-based DRASTIC model for assess-ing aquifer vulnerability in Kakamigahara Heights, Gifu Prefecture, central Japan. Science of the Total Environment, 345, 127–140.
4. Boughriba M., Barkaoui A, Zarhloule Y., Lahmer Z., Houadi B., Verdoya M. 2010, Groundwater vulnerability and risk mapping of the Angad trans-boundary aquifer using DRASTIC index method in GIS environment, Arabian Journal of Geosciences, 3 (2), 207–220.
5. Daly D, Dassargues A, Drew D, Dunne S, Gold-scheider N, Neale S, Popescu I.C, Zwahlen F. 2002, Main concepts of the “European approach” to karst-groundwater-vulnerability assessment and mapping, Hydrogeology Journal, 10, 340–345.
6. Dassenakis E., Kastritis A., Triantafyllaki S., Bourou P. and Paraskevopoulou V. 2005, Transport of pollutants in Sperchios catchment area and im-pacts to the coastal zone. Proceedings of the 5th Conference of the Hellenic Committee on Wa-ter Resources Management, Xanthi, Greece, pp. 210–211.
7. Dimitriou E., Karaouzas I., Sarantakos K., Zacha-
Journal of Ecological Engineering Vol. 19(1), 2018
68
rias I., Bogdanos I., Diapoulis A. 2008, Ground-water risk assessment at a heavily industrialised catchment and the associated impacts on a peri-urban wetland, Journal of Environmental Manage-ment, 88, 526–538.
8. Dimitriou E., Mentzafou A, Tzortziou M., Zeri Ch. 2011, Environmental monitoring and pollu-tion pressures identification in Sperchios river catchment. Proceedings of the 3rd International CEMEPE & SECOTOX Conference, Skiathos, pp. 323–328.
9. Eckhardt, D.A.V., Stackelberg, P.E. 1995. Relation of ground-water quality to land use on Long Island, New York Ground Water, 33, 1019–1033.
10. Gogu R.C., Dassargues A. 2000, Current trends and future challenges in groundwater vulnerability assessment using overlay and index methods, En-vironmental Geology 39 (6), 549–559.
11. Gogu R.C., Dassargues A., Hallet V. 2003, Com-parison of aquifer vulnerability assessment tech-niques. Application to the Neblon River basin (Belgium), Environmental Geology, 44, 881–892.
12. Karaouzas I., Dimitriou E., Skoulikidis N., Gritza-lis K., Colombari E. 2009, Linking Hydrogeologi-cal and Ecological Tools for an Integrated River Catchment Assessment, Environ Model Assess, 14, 677–689.
13. Karatzas G. and Psarropoulou E. 2014, Pollution of nitrates – Contaminant Transport in heterogeneous porous media: A case study of the coastal aquifer of Corinth, Greece, Global NEST Journal, 16 (1), 9–23.
14. Kazakis N. and Voudouris K. 2015, Groundwater vulnerability and pollution risk assessment of po-rous aquifers to nitrate: Modifying the DRASTIC method using quantitative parameters, Journal of Hydrology, 525, 13–25.
15. Kazakis N., Voudouris K., 2011, Comparison of three applied methods of groundwater vulnerabil-ity mapping: A case study from the Florina basin, Northern Greece, Advances in the Research of Aquatic Environment, Part of the series Environ-mental Earth Sciences, Springer, pp. 359–367.
16. Luoma S., Okkonen J., Korkka-Niemi K., 2016, Comparison of the AVI, modified SINTACS and GALDIT vulnerability methods under future cli-mate-change scenarios for a shallow low-lying coastal aquifer in southern Finland, Hydrogeology Journal, doi:10.1007/s10040–016–1471–2.
17. Martínez-Bastida J.J., Arauzo M., Valladolid M. 2010, Intrinsic and specific vulnerability of ground-water in central Spain: the risk of nitrate pollution, Hydrogeology Journal, 18, 681–698.
18. Matiatos I. 2016, Nitrate source identification in groundwater of multiple land-use areas by combin-ing isotopes and multivariate statistical analysis: A case study of Asopos basin (Central Greece), Sci-ence of the Total Environment, 541, 802–814.
19. Nobre R.C.M., Rotunno Filho O.C., Mansur W.J., Nobre M.M.M., Cosenza C.A.N. 2007, Ground-water vulnerability and risk mapping using GIS, modeling and a fuzzy logic tool, Journal of Con-taminant Hydrology, 94, 277–292.
20. Panagopoulos G.P., Antonakos A.K., Lambrakis N.J. 2006, Optimization of the DRASTIC method for groundwater vulnerability assessment via the use of simple statistical methods and GIS, Hydro-geology Journal, 14, 894–911.
21. Polemio M., Casarano D., Limoni P. P. (2009), Karstic aquifer vulnerability assessment methods and results at a test site (Apulia, southern Italy), Nat. Hazards Earth Syst. Sci., 9, 1461–1470.
22. Psomiadis, E. (2010), Geomorphologic and En-vironmental Changes Research in the Sperchios’ River Basin Utilizing New Technologies. PhD Thesis elaborated at the Agricultural University of Athens, Laboratory of Mineralogy-Geology.
23. Pisciotta A., Cusimano G., Favara R., 2015, Groundwater nitrate risk assessment using intrin-sic vulnerability methods: A comparative study of environmental impact by intensive farming in the Mediterranean region of Sicily, Italy, Journal of Geochemical Exploration, Vol. 156, pp. 89–100.
24. Sorichetta A, Ballabio C, Masetti M, Robinson GR Jr, Sterlacchini S., 2013, A comparison of data-driven groundwater vulnerability assessment methods, Ground Water, 51 (6): 866–879.
25. Vıas J.M., Andreo B., Perles M.J., Carrasco F., Vadillo I., Jimenez P. 2006, Proposed method for groundwater vulnerability mapping in carbonate (karstic) aquifers: the COP method, Hydrogeology Journal, 14, 912–925.
26. Voudouris Κ., 2006, Environmental Hydrogeol-ogy, AUTH, Thessaloniki, pp. 169–181.
27. Voudouris K., Kazakis N., Polemio M., Kareklas K. 2010, Assessment of Intrinsic Vulnerability us-ing the DRASTIC model and GIS in the Kiti Aqui-fer, Cyprus, European Water, 30, 13–24.
28. Zhang W.L., Tian Z.X., Zhang N., Li X.Q. 1996. Ni-trate pollution of groundwater in northern China. Ag-riculture Ecosystems & Environment, 59, 223–231.
29. Zwahlen F. 2003, Vulnerability and Risk Mapping for the Protection of Carbonate (Karst) Aquifers, COST Action 620, Final Report.