assessment of psychiatric symptoms using the scl-90assessment of psychiatric symptoms using the...
TRANSCRIPT
Department of Psychiatry Helsinki University
Finland
Assessment of psychiatric symptoms
using the SCL-90
Matti Holi
ACADEMIC DISSERTATION
To be publicly discussed with the assent of the Medical Faculty of the University of Helsinki,
in the Auditorium of the Lapinlahti Hospital, Helsinki, on 28.3.2003, at 12 noon
SUPERVISORS Docent Veikko Aalberg, MD, PhD Department of Child and Adolescent Psychiatry Hospital for Children and Adolescents University of Helsinki Helsinki Docent Mauri Marttunen, MD, PhD National Public Health Institute Helsinki and Peijas Hospital Vantaa REVIEWERS Professor Pirkko Räsänen, MD, PhD Department of Psychiatry University of Oulu Oulu Docent Timo Partonen, MD, PhD National Public Health Institute Helsinki OPPONENT Professor Heimo Viinamäki, MD, PhD Department of Psychiatry University of Kuopio Kuopio
ISBN 951-91-5703-7 (print) ISBN 952-10-1003-7 (PDF) Helsinki University Printing House Helsinki 2003

To Raija and Pentti

CONTENTS
ABBREVIATIONS 8
1 LIST OF ORIGINAL PUBLICATIONS 9
2 ABSTRACT 10
3 INTRODUCTION 11
4 REVIEW OF THE LITERATURE 12
4.1 Psychiatric symptoms 12
4.1.1 Classification of symptoms 12
4.1.2 Descriptive diagnostics 13
4.2 Psychiatric rating scales 15
4.2.1 Clinical use of rating scales 16
4.2.2 Psychometric concepts of reliability and validity 16
4.2.2.1 Reliability 17
4.2.2.2 Validity 17
4.2.2.3 Validity in screening 18
4.2.3 State vs. trait characteristics 19
4.3 Self-report questionnaires 19
4.3.1 Basic concepts 20
4.3.2 Factors affecting accuracy of self-reports 20
4.3.3 Unique characteristics of self-report questionnaires 21
4.3.4 Use of self-reports for case identification in epidemiological studies 22
4.3.5 Self-reports as outcome measures 23
4.3.6 Self-reports in assessment of personality traits 24
4.4 Psychological defenses 24
4.5 Symptom Checklist 90 (SCL-90) 24
4.5.1 A brief history 25
4.5.2 Descriptive profile 25
4.5.3 Description of SCL-90 symptom dimensions and global indices 27
4.5.4 Reliability and validity of SCL-90 28
4.5.4.1 Reliability 28
4.5.4.2 Validity 29
4.5.4.2.1 Convergent validity 29
4.5.4.2.2 Discriminant validity 30
4.5.4.2.3 Construct validity 31
4.5.4.3 Conclusions on reliability and validity of SCL-90 31
4.5.5 SCL-90 as an outcome measure 31
4.5.6 SCL-90 as a psychiatric screening instrument 32
4.5.7 SCL-90 as a brief measure of mental status 32
4.5.8 Use of SCL-90 in Finland 32
4.5.9 Different versions of SCL-90 33
4.6 Measuring outcome in psychiatric treatment trial by self-report 33
4.6.1 Change in symptom distress during queuing to psychological
treatment 33
4.6.2 Change in symptom distress of chronic inpatients during biological
treatment 34
4.7 Conclusions based on the literature 35
5 AIMS OF THE STUDY 36
6 SUBJECTS AND METHODS 37
6.1 Subjects 37
6.1.1 Studies I-III 37
6.1.2 Study IV 38
6.1.3 Study V 38
6.1.4 Ethical considerations 38
6.2 Methods 39
6.2.1 Measures 39
6.2.1.1 SCL-90 39
6.2.1.2 Defense Style Questionnaire (DSQ) 39
6.2.1.3 General Health Questionnaire 36 (GHQ-36) 40
6.2.1.4 Sense of Coherence Questionnaire (SOC) 40
6.2.1.5 Positive and Negative Symptoms Scale (PANSS) 40
6.2.1.6 Mini Mental State Examination (MMSE) 40
6.2.2 Statistical methods for Studies I-III and previously unpublished data 40
6.2.3 Methods for Study IV 41
6.2.4 Methods for Study V 42
7 RESULTS 44
7.1 Validity of SCL 90 (Study I) 44
7.1.1 Norms for community and outpatient samples 44
7.1.2 Reliability 44
7.1.3 Validity 46
7.1.3.1 Discriminant validity 46
7.1.3.2 Dimensionality (construct validity) 46
7.2 SCL-90 in screening (Study II) 46
7.3 Association between psychological defenses and psychiatric
symptoms (Study III) 48
7.4 SCL-90 as an outcome measure: 1. Psychotherapy trial (Study IV) 52
7.5 SCL-90 as an outcome measure: 2. Biological treatment trial (Study V)55
7.6 Items and subscales of SCL-90 that best differentiate between patients
and community (unpublished data) 58
8 DISCUSSION 59
8.1 Utility of SCL-90 59
8.1.1 Reliability and validity 59
8.1.2 Utility in screening 59
8.1.3 Potential in measuring change 60
8.1.4 Optimal items and subscales for differentiation 60
8.2 Association between symptoms and defenses 60
8.3 SCL-90 as an outcome measure 61
8.3.1 Change in symptom distress during queuing to psychological
treatment 61
8.3.2 Change in symptom distress during biological treatment 63
8.3.3 Sensitivity of SCL-90 in measuring change 64
8.4 Methodological issues 64
8.4.1 Samples and setting in Studies I-III 64
8.4.2 Specific issues of Study III 65
8.4.3 Study IV 66
8.4.4 Study V 67
8.5 Conclusions 67
8.5.1 Implications for research 68
8.5.2 Clinical implications 68
9 ACKNOWLEDGEMENTS 70
10 REFERENCES 72
11 APPENDICES 83
8
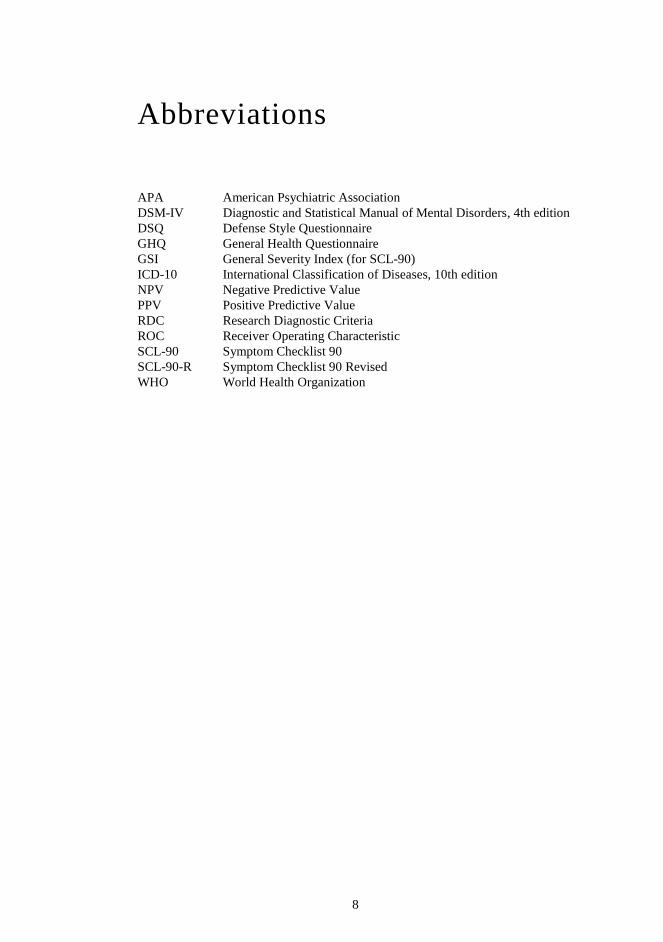
Abbreviations
APA American Psychiatric Association DSM-IV Diagnostic and Statistical Manual of Mental Disorders, 4th edition DSQ Defense Style Questionnaire GHQ General Health Questionnaire GSI General Severity Index (for SCL-90) ICD-10 International Classification of Diseases, 10th edition NPV Negative Predictive Value PPV Positive Predictive Value RDC Research Diagnostic Criteria ROC Receiver Operating Characteristic SCL-90 Symptom Checklist 90 SCL-90-R Symptom Checklist 90 Revised WHO World Health Organization

9
1 List of original publications:
This thesis is based on the following original publications, which are referred to in the text by Roman numerals I-V:
I Holi MM, Sammallahti PR, Aalberg VA. A Finnish validation study of the SCL-90. Acta Psychiatr Scand 97: 42-46, 1998.
II Holi MM, Marttunen M, Aalberg VA. Comparison of the GHQ-36, the GHQ-12 and the SCL-90 as psychiatric screening instruments in the Fin-nish population. Nord J Psychiatry, in press.
III Holi MM, Sammallahti PR, Aalberg VA. Defense styles explain psychiat-ric symptoms: an empirical study. J Nerv Ment Dis 187: 654-660, 1999.
IV Holi MM, Knekt P, Marttunen M, Rissanen H, Kaipainen M, Lindfors O. Queuing for psychotherapy and self-reported psychiatric symptoms. Am J Psychiatry, submitted.
V Holi MM, Eronen M, Toivonen K, Toivonen P, Marttunen M, Naukkarinen H. Left prefrontal rTMS in schizophrenia. Schizophr Bull, in press.
In addition, some unpublished data have been included in this thesis.
10
2 Abstract
Rating scales bring reliability to psychiatric research and have become a predomi-nant tool in psychiatric measurement. Self-report questionnaires have unique char-acteristics that make them sensitive to technical, linguistic, environmental, and cul-tural factors. For this reason, it is important to investigate their properties in each new patient population, culture, or language in which they are used. This thesis investigated the utility of the Finnish translation of the Symptom Checklist 90 (SCL-90), a psychiatric self-report inventory containing 90 questions, in a Finnish population.
The psychometric properties of the SCL-90 were evaluated (Studies I-II). Its re-liability proved to be good. Its validity as a measure of general symptom distress was also good as it discriminated and screened patients from the community as well as two widely used screening instruments in Finland. Its construct validity as a multidimensional instrument was, however, insufficient since factor analysis did not produce the original nine symptom dimensions.
Study III used the SCL-90 as a measure of psychiatric status and clarified the associations between psychological defense mechanisms and psychiatric symp-toms. The main finding was that an immature defense style correlated with the most severe symptoms.
In Studies IV and V the SCL-90 was used as an outcome measure. In Study IV, it was the only outcome measure and detected a significant improvement in general symptom severity during queuing to psychotherapy. Surprisingly, the improvement could mainly be accounted for by the initial symptom severity; the more symptoms at baseline, the greater improvement in symptoms. Study V utilized the SCL-90 in a very unusual setting: a biological treatment trial in schizophrenia. It was used as a secondary outcome measure with the rationale of supplementing data received by the PANSS with self-report data. This supplementary exploration was undertaken since the biological treatment, rTMS, was a novel one and the author wanted to gather subjective experience on it.
In conclusion, the performance of the SCL-90 in Finland was similar to that in other countries. It proved to be an adequate psychiatric research instrument; it was practical, reliable, valid, and sensitive to change. It may have some interesting clinical applications as a combined screening and follow-up instrument for patients with mental problems.
11
3 Introduction
Two particularly noteworthy developments have taken place in psychiatry in the last three decades. The classification of psychiatric disorders has become descrip-tive and the use of standardized assessment methods has grown rapidly (Myers & Winters 2002). The reason behind both of these advances is the need for reliability. Doctors can agree on what symptoms certain patient has, thus making the descrip-tive classification reliable. Standardized methods as rating scales allow for reliable comparison and communication of findings in psychiatric research (Corcoran & Fischer 2000).
Certain properties are required for a rating scale to be adequate and useful. These properties include practicality, sensitivity to change, variability, and inter-pretability. Particularly important are the two principal psychometric properties of a rating scale: reliability and validity (Stewart 1990). Reliability minimizes random error and validity minimizes systematic error of a rating scale. The evaluation of a rating scale’s reliability and validity is the key to judging its potential value for a particular purpose (Blacker & Endicott 2000).
Self-report questionnaires are rating scales that have unique properties, as they
rely on the judgment of the respondent. Because they are sensitive to administra-tive, environmental, cultural, and linguistic factors (Babor et al. 1990), they must be validated in each new patient population, language, or culture in which they are used.
The Symptom Checklist 90 (SCL-90) is a psychiatric self-report inventory. The
90 items in the questionnaire are scored on a five-point Likert scale, indicating the rate of occurrence of the symptom during the time reference. It is intended to measure symptom intensity on nine different subscales (Derogatis et al. 1973). It has been shown to have a good reliability as its internal consistency is high. Results concerning its validity are controversial; it discriminates patients from normal con-trols, thus having some rough discriminant validity, but there have been problems in replicating the original dimensions in factor analytical studies. The SCL-90 has been used widely as an outcome measure, as a measure of mental status, and as a screening instrument.
The Finnish translation of the SCL-90 originates from 1975. No published data
on the translation process exist. While it has been used in numerous studies (Lehti-nen et al. 1985, Viinamäki et al. 2002), it has not been properly evaluated. This thesis investigates the utility of the SCL-90 in a Finnish population.
12
4 Review of the literature
As the topic of this dissertation is the SCL-90, a psychiatric self-report symptom inventory, this review of the literature deals with psychiatric symptoms and their measurement. First, it focuses on the great relevance of psychiatric symptoms to today’s psychiatry, especially to the current diagnostic classification systems. It then describes issues associated with psychiatric rating scales, paying particular attention to their psychometric properties. Finally, through self-report instruments, the review covers the symptom-centered self-report: the SCL-90.
4.1 Psychiatric symptoms
Psychiatry is concerned with phenomenology and the study of mental phenomena. Signs and symptoms play a central role in the current conceptualization of psychia-try and communication within the field. Psychiatric signs are objective findings observed by the clinician, such as obvious motor restlessness, whereas symptoms are subjective experiences, such as a person's complaint of feeling depressed or anxious. Thus, with symptoms, a doctor must rely on the patient’s self-report, often with no objective tests being available to confirm or disconfirm these symptoms (Kessler et al. 2000). In psychiatry, as in other fields of medicine, signs and symp-toms are not always clearly defined and they overlap with each other.
Symptoms are central in psychiatry because they can be assessed more reliably than many other theoretical constructs. While there are many different theoretical orientations within modern psychiatry, clinicians and researchers can generally agree on how the disorders look like (Williams 1988). To put it in other words, clinicians and researchers can more or less reliably agree on what symptoms and signs are present in individual patients.
The need for reliability in diagnostic procedures has led to a symptom criteria-based classification in psychiatry (Spitzer et al. 1978). Similarly, the need for reli-able measurement in psychiatric research has lead into development of different psychiatric rating scales.
4.1.1 Classification of symptoms
Most psychiatric textbooks provide an exhaustive list of psychiatric symptoms and signs classified in different ways. Psychiatric lexicons list over 200 psychiatric symptoms and signs (e.g. WHO 1994, Ayd 1995). Kaplan and Sadock’s synopsis of psychiatry (Kaplan et al. 1994) classifies them in the following way: I. Consciousness: A. Disturbances of consciousness
B. Disturbances of attention C. Disturbances in suggestibility
13
II. Emotion: Affect
Mood Other emotions such as anxiety, fear, or apathy. Physiological disturbances associated with mood
III. Motor behavior : For example, catatonia, stereotypy, akathisia, and
psychomotor agitation IV. Thinking: Disturbances in form or process of thinking
Specific disturbances in form of thought Specific disturbances in content of thought
V. Speech Disturbances in speech Aphasic disturbances VI. Perception Disturbances of perception Disturbances associated with cognitive disorder Disturbances associated with conversion and dis-
sociation VII. Memory Disturbances of memory
VIII. Intelligence Mental retardation
Dementia Pseudodementia Concrete thinking Abstract thinking
IX. Insight X. Judgment This grouping of symptoms is only one of many ways to classify symptoms. Most psychiatric signs and symptoms have their roots in normal behavior and represents points along a continuum of behavior from normal to pathological (Kaplan et al. 1994).
4.1.2 Descriptive diagnostics
The need for a classification of mental disorders has existed throughout the history of medicine, but there has been little agreement on which disorders should be in-cluded and the optimal method for their organization (DSM-IV-TR, 2000). The nomenclatures have differed in their relative emphasis on suggested phenomenol-ogy, etiology, and course as defining features. The number of diagnostic categories has ranged from only a handful to thousands (DSM-IV-TR, 2000).
The current classificatory approach to psychiatric conditions is highly descrip-tive, and atheoretical with regard to causes, which is somewhat antithetical to un-derstanding the person experiencing the illness in addition to de-emphasizing a compassionate approach towards patients (Sadock 2000). The rationale underlying
14
this classificatory approach is a lack of knowledge on the precise etiology of most psychiatric conditions, which made the old etiology-based diagnostic procedures less reliable (Spitzer et al. 1978).
The “Mental Disorders” section of the ICD-10 (1992) in Europe and the DSM-IV (1994) in the USA are the main current official diagnostic systems in psychia-try. They provide the nomenclature of psychiatry and the language by which psy-chiatrists communicate with each other (Williams 1988). Both of them are descrip-tive systems; they describe the manifestations of the mental disorders, and only rarely do they attempt to account for how the disturbances come about. They are a practical and common sense nosology of psychiatric disorders that is intended to improve communication in clinical practice and in research (Frances et al. 1994).
Their developmental history started from the need to collect statistical informa-tion about mental disorders in the first half of the 20th century (DSM-IV-TR, 2000). The European ICD versions and the American DSM versions have devel-oped hand in hand.
ICD-6 and DSM-I: The sixth edition of the ICD (ICD-6) was the first to contain a section for mental disorders, and its variant, DSM-I from 1952, was the first offi-cial manual of mental disorders with a focus on clinical utility, as it provided de-scriptions for the mental disorder categories it listed (Williams 1988).
ICD-8 and DSM-II: In the early 1960s the World Health Organization (WHO) made an effort to improve the reliability of diagnoses (Sartorius 1992), resulting in the ICD-8. As a part of this process, a comprehensive review of diagnostic issues was conducted by British psychiatrist Stengel, who emphasized in his report the need for explicit definitions as a means of promoting reliable clinical diagnoses (DSM-IV-TR 2000). In 1968, the American Psychiatric Association (APA) de-cided to publish a new edition of the DSM, the DSM-II, without any major revi-sions, to coincide with the publication of the ICD-8 (Williams 1988).
RDC: The concept of diagnostic criteria was introduced into psychiatric prac-tice through the Feighner et al. (1972) criteria, which covered 16 diagnostic catego-ries. These criteria were revised and expanded in 1978 to the Research Diagnostic Criteria (RDC), covering 21 categories (Spitzer et al. 1978).
ICD-9 and DSM-III: The DSM-III, the development of which co-ordinated with the ICD-9, incorporated operational criteria for over 150 diagnostic categories into its classification system (Williams 1988, Sartorius 1992). Its methodological inno-vations included a strictly descriptive approach, a multi-axial system, and explicit diagnostic criteria. Since the DSM-III, the DSM-III-R followed by the DSM-IV have been implemented. Revision and further validation of psychiatric diagnostic classification is an ongoing process, as knowledge on psychiatric disorders contin-ues to accumulate (Widiger et al. 1994).
DSM-V and ICD-11: Text revision of the DSM-IV (DSM-IV-TR) was pub-
lished in 2000 and development of the next revision of the DSM, the DSM-V, has begun and will be published in the near future (Widiger & Clark 2002). The next revision of the ICD, the ICD-11, is also underway (Fulford 2002).
15
As the current diagnostic system is descriptive and categorical, it opens the pos-sibility that the boundaries between different syndromes do not represent the true underlying conditions, of which we have insufficient knowledge (First et al. 1995). To put it in psychometric terms, although the descriptive system is reliable, it is not necessarily valid. As descriptive diagnostics view diseases as groups of symptoms, the issue of comorbidity, or overlap between different syndromes, is not straight-forward. As First et al. (1995) put it in their DSM-IV handbook of differential di-agnosis “A naive and mistaken view of comorbidity might assume that a patient assigned with more than one descriptive diagnosis actually has multiple independ-ent conditions”. According to these authors, DSM-IV diagnoses should be consid-ered descriptive building blocks that are useful for communicating diagnostic in-formation.
4.2 Psychiatric rating scales
A rating scale is a measuring instrument where the rated object is assigned to cate-gories or continua that have numerals assigned to them (Kerlinger & Lee 2000). Thousands of rating scales are available for just about any area of human function-ing (Corcoran & Fischer 2000). They became increasingly popular in the second half of the 20th century in response to the declining interest in projective measures, along with an increasing focus on scientific measurement, refinements in diagnos-tic nomenclature, and need for outcome measures in clinical trials (Myers & Win-ters 2002). There has been growing awareness of the importance of reliable and valid information on clinical status in psychiatry (Bech et al. 1993).
The term rating scale includes self-reported rating scales (questionnaires) and observer rating scales. Psychiatric rating scales provide a means of quantifying as-pects of a patient’s psyche, behavior, and relationships with individuals and society (Myers & Winters 2002). They provide relatively rapid assessment of specific con-structs with simply derived numerical scores which are easy to interpret. Many psychiatric rating scales are able to measure carefully chosen features of well-formulated concepts. They facilitate reliable comparison and communication of findings.
The adequacy of rating scales can be judged in terms of their variability, reli-ability, validity, sensitivity, practicality, and interpretability (Stewart 1990). Good variability means that the scores on a particular sample are spread over the full range of the scale, not limited to one end of it. Reliability and validity are discussed in the following section. Sensitivity here does not mean case detection but rather the ability to detect changes in the measured construct. Practicality refers to how easy or difficult the use of a scale is in practice. Good interpretability refers to the meaning of particular scores and differences in score values over time or between individuals.
Developing and validating research instruments is vitally important for collect-ing accurate information and has an obvious impact on its validity and reliability (National Institution of Health 1998). Data collection instruments developed for a particular population (defined by age, sex, or cultural group) may not be valid for other populations, and thus, continued improvement and innovation in validating
16
data collection instruments is important for all types of research settings (National Institution of Health 1998).
4.2.1 Clinical use of rating scales
The use of rating scales in clinical practice can yield many benefits, but the utility of each rating scale has must be evaluated before it is used in a new clinical setting (Pincus et al. 2000).
Benefits to individual patients, as compared with those offered by unstructured clinical examinations may include improvement in 1) collection of information (e.g. all relevant topics covered), 2) synthesis of information (e.g. categorization or quantification of symptoms), and 3) reporting of information (e.g. consistency of assessment over time and providing a standardized “language” for communicating with other doctors) (Zarin 2000). Adverse effects may be cost, or negative conse-quences of possible false results (Zarin 2000).
According to Pincus et al. (2000), rating scales may be used in a clinical context to:
1) screen and thus identify individuals with certain characteristics 2) assist diagnosis according to current diagnostic systems 3) assess clinical features beyond diagnosis to facilitate treatment selec-
tion 4) monitor benefits and adverse effects of treatment (e.g. follow up
change in symptoms) 5) other uses, such as determining the prognosis or for administrative
purposes (e.g. disability or forensic documentation)
The author is unaware of the existence of any research on how widely rating scales are used in clinical settings in Finland or globally.
4.2.2 Psychometric concepts of reliability and valid-ity
The two principal psychometric properties of a rating scale are reliability and validity. To be useful, rating scales should be reliable (i.e., consistent and repeatable even if performed at different times or under different conditions) and valid (i.e., represent the true state of nature). No scale is totally reliable and/ valid (Blacker & Endicott 2000).
Lack of reliability is referred to as random error, and lack of validity as system-atic error (Del Boca & Noll 2000). During scale construction reliability is deter-mined first to minimize random error, thereby allowing detection of any systematic error. To be valid, a scale must be fairly reliable, but to be reliable a scale does not need to be valid (Corcoran & Fisher 2000). Thus, high reliability is no guarantee of good scientific results, but good scientific results cannot be obtained without reli-ability (Kerlinger & Lee 2000). Evaluation of a rating scale’s reliability and valid-ity is the key to judging its potential value for a particular purpose (Blacker & En-dicott 2000).
17
4.2.2.1 Reliabili ty
Reliability refers to the consistency with which 1) all of a scale’s items measure the same construct and 2) the scale measures the construct in the same way every time. Some general synonyms for reliability are consistency, reproducibility, and repeat-ability (Stewart 1990). Reliability reveals whether the scale performs the same way every time it is used across persons, situations, and time (Corcoran & Fisher 2000).
1. Internal reliability or internal consistency measures the homogeneity of the scale. It reveals how consistent the individual items are with each other. Scales measuring unitary construct are expected to have high internal consistency. Multi-factorial scales usually have lower internal consistency (Blacker & Endicott 2000). Generally, the more items the scale has, the higher its internal consistency. Internal consistency is typically reported as either Cronbach’s coefficient α (Cronbach 1951) or split half reliability (Kuder & Richardson 1937). Values of 0.50 or greater are considered adequate; values between 0.70 and 0.90 are optimal (Stewart 1990).
2. Test-retest reliability assesses whether a scale is stable over time. If the vari-able measured has not changed, then the scores should be similar over administra-tions.
3. Inter-rater reliability refers to agreement between different raters and is sometimes represented by kappa values (Cohen 1960). Although no absolute cut-off points exist for kappa coefficients, some sources provide rough guidelines for their interpretation. According to Fleiss (1981), values exceeding 0.75 suggest strong agreement above chance, values in the range of 0.40-0.75 indicate fair levels of agreement above chance, and values of less than 0.40 are indicative of poor agreement above chance levels. Gardner (1995) recommends that kappa exceed 0.70 before proceeding with additional data analyses.
.
4.2.2.2 Validity
Validity relates to how the scale actually reflects the construct that is being exam-ined, or in other words, whether the scale assesses what it was designed to assess. Validity must be established against multiple criteria. The types of validity referred to in the literature include content, face, expert, criterion, predictive, concurrent, convergent, discriminant, known groups, and construct. This may be confusing, especially as the definitions of these terms are not always consistent. Three of these validity types are basic: content, criterion and construct validity (Stewart 1990).
1. Content validity refers to how the instrument reflects the content of the meas-ured construct. It assesses whether the scale’s items represent the entity being measured (Corcoran & Fisher 2000). There are two approaches to content validity: face validity and expert validity (logical content validity). Face validity asks whether under subjective and superficial scrutiny the item appears to cover the de-sired content. Expert validity refers to the procedure the scale’s developer has used to evaluate the content of the items (Stewart 1990).
2. Criterion validity is more empirically based, assessing the scale’s relation to other scales or other criteria (external validators). There are two types of criterion validity: predictive validity and concurrent validity (Blacker & Endicott 2000). Predictive validity refers to the extent we can predict other phenomena by the in-

18
strument. Concurrent validity refers to the scale‘s correlation with an event that is assessed simultaneously. Two types of concurrent validity are convergent validity and discriminant validity. Convergent validity is the extent to which the scale cor-relates with some theoretically relevant variable with which it should correlate. Discriminant validity compares a scale’s scores for groups that are known to differ in the measured phenomena; if the scale is valid, then the groups should have dif-ferent scores.
3. Construct validity refers to how the instrument suits the theoretical construct of the measured idea (Corcoran & Fisher 2000). It links psychometric notions and practices to theoretical notions (Kerlinger & Lee 2000). Factor analysis reveals how the internal structure of the instrument fits the theoretical structures (Kim & Mueller 1978). It is used to examine whether the intercorrelations among items demonstrate the expected structure for the construct (do theoretically similar items “load on” the same factor?). One can also include items from other instruments that measure similar and dissimilar constructs. The items from the construct under in-vestigation are expected to load on the same factors as items from measures of similar constructs and on different factors from measures of different constructs.
Examining convergence with other instruments for the same phenomenon re-lates to construct validity, as does the divergence from theoretically unrelated phe-nomena (Blacker & Endicott 2000).
4.2.2.3 Validity in screening
The screening performance of a questionnaire or other screening test is expressed in terms of sensitivity, specificity, and positive and negative predictive value (PPV and NPV, respectively) (Blacker & Endicott 2000). These so-called validity coeffi-cients express the relations of the test to an external case criterion. Sensitivity is defined as the number of true cases detected by the test (true-positives) divided by the number of all the cases. Specificity is the number of true-negatives divided by the number of all non-cases. PPV is the probability of a positively tested subject to be a case, and NPV the probability of a negatively screened subject to be a non-case. In general, the more sensitive a test is, the less specific it becomes. This “trade-off” is easiest to see when a threshold score is used; as the cut-off is low-ered, sensitivity rises but specificity falls.
ROC analysis is a method for graphic description of the overall diagnostic accu-racy of a screening test (Murphy et al. 1987). It summarizes the validity coeffi-cients of the test by plotting sensitivity against the false-positive rate for all possi-ble cut-off points. The overall performance of an instrument can be calculated as the area under the ROC curve. The more the curve is situated in the upper left cor-ner, the more sensitivity correlates with specificity, i.e., the more successful the discrimination between cases and non-cases. For a random test with a discrimina-tory ability that is no better than chance, the area under the ROC curve is 0.5; a value of 1.0 represents perfect discriminatory ability (Erdreich & Lee 1981).
The optimal cut-off points for a screening test (using the optimal trade-off be-tween sensitivity and specificity) can be evaluated by Youden’s index (Youden 1950), which is calculated as follows: sensitivity + specificity - 1. With a theoreti-

19
cally optimal screening instrument (with sensitivity and specificity of 100%) Youden’s index is 1.00.
4.2.3 State vs. trait characteristics
Rating scales measure different kinds of characteristics. These characteristics may rapidly change from moment to moment or be more permanent. Changing charac-teristics are called state features. Permanent characteristics, in turn, are known as trait features. A “trait” is a relatively enduring or stable characteristic of an indi-vidual and is broadly defined, while a “state” is a more transitory emotional condi-tion typically elicited by a particular stimulus or environmental condition. Contro-versy continues over whether human personality and functioning are best concep-tualized in terms of traits or states (Corcoran & Fischer 2000). In psychiatry, per-sonality and defenses are usually conceived as “traits”, and symptoms as “states”.
4.3 Self-report questionnaires
The first psychological symptom self-report scale was a result of Robert Wood-worth’s insight into the potential for each man “to interview himself” during a shortage of psychiatrists in World War I (1914-1918) (Woodworth 1918). The scale was named the Personal Data Sheet, and it represents the first systematic ex-ample of this mode of psychological measurement.
At the end of World War II, in the 1940s, there was growing concern about the prevalence of mental illness, as many service recruits for the war were found to suffer from emotional disorders, returning from the war with traumatic stress reac-tions (Kessler et al. 2000). This led to the initiation of local and national surveys, where clinicians made the evaluation of caseness (Leighton 1959). Later, clinician judgment was abandoned in favor of less expensive self-report symptom rating scales (Gurin et al. 1960).
Self-reports were the main instrument of community psychiatric epidemiology through the 1970s (Kessler et al. 2000). The main reasons for their popularity over clinician caseness judgments were 1) they were inexpensive, 2) their continuous nature seemed to be better suited for constellation of symptoms in the community than the dichotomous clinician judgment, and 3) clinician-based clinical interviews lacked good psychometric properties (Dohrenwend et al. 1978). One of the disad-vantages of self-reports was that there was nothing in those scales that allowed re-searchers to discriminate between people who did and did not have significant psy-chiatric problems (Kessler et al. 2000). Some researchers developed rules for clas-sifying people with scores above a certain threshold on distress scales as psychiat-ric cases (Radloff 1977). These cut-off points were usually based on statistical analyses, and controversy surrounded the decision where to allocate the cut-off (Kessler et al. 2000). The dichotomous clinician judgment also lacked precision. Establishment of the RDS at the end of the 1970s (Spitzer et al. 1978) and later the development of research diagnostic interviews (Spitzer et al. 1992) led to growing reliability in defining cases in psychiatric research.
20
Self-report questionnaires are any group of written questions to which partici-pants are asked to respond in writing, often by checking or circling responses. They are an easy and straightforward way of measuring mental health (Morgan & Harmon 2001) and provide a primary source of information in a wide range of clinical and research settings (National Institute of Health 1998).
The term “self-report” includes not only pen-and-paper questionnaires but also computer-administered self-reports and self-report interviews. A method is called self-report when it does not require a clinician’s administration or judgment (Kessler et al. 2000). Self-report interviews rely on the judgment of the respondent, with the survey interviewer merely recording responses (Eaton et al. 2000).
In this thesis, the term “self-report questionnaire” refers to those self-reports where respondents fill out the questionnaire themselves.
4.3.1 Basic concepts
Questionnaires are usually structured and tend to use closed-ended questions. Open-ended questions, by contrast, do not provide alternative answers; instead
participants must formulate answers in their own words. These types of questions and questionnaires are easy for the surveyor to formulate but can be difficult to code and are demanding for participants (Morgan & Harmon 2001). Closed-ended questions ask participants to choose among discrete categories and select the one that best reflects their opinion or situation. These questions may be Likert-type items to which the respondent indicates agreement or disagreement on an intensity scale (Corcoran & Fischer 2000).
Originally, Likert items were statements about which participants are asked to indicate whether they strongly agree, agree, are undecided, disagree, or strongly disagree. Each of these types of answers is given a numerical value from 1 to 5 (Morgan & Harmon 2001). These answer types and their numerical weight may be modified in questionnaires, depending on their topic. In the SCL-90, for example, the distress of symptoms is rated from 0 = not at all, to 4 = extremely (Derogatis et al. 1973).
4.3.2 Factors affecting accuracy of self-reports
Reliability and validity issues that were discussed earlier with rating scales gener-ally are valid also for self-report questionnaires. Here I concentrate on issues that affect reliability and validity of primarily self-report questionnaires.
In questionnaires, unlike in expert-rated scales, participants must formulate an-
swers or make choices between different possibilities, which makes the situation of rating somewhat different from a rating scale, where a professional makes the choice. Recent investigations have begun to analyze the cognitive processes that underlie self-reports (National Institute of Health 1998). These processes include the comprehension of questions, the retrieval of information from memory, and the use of heuristics and prior beliefs in responding, which in turn are influenced by biological, social, and cultural factors. All of these affect the validity and reliability of self-reports (National Institution of Health 1998).
21
The question-answering process with self-reports, as with other psychiatric rat-ing scales, is affected by social context, which includes cultural norms, the organ-izational setting in which data are collected, and the immediate interpersonal situa-tion at the time questionnaire is filled out (Babor et al. 1990). This immediate in-terpersonal situation may include, for example, other people present in the room during the self-report (Del Boca & Noll 2000). In addition to social context, re-spondents’ characteristics, task variables, and respondents’ motivation and cogni-tive processes affect the way the questionnaire is filled out (Babor et al. 1990).
Respondent characteristics include enduring qualities, such as personality char-acteristics (e.g. need for approval), attitudes and beliefs (e.g. regarding mental health or illness), intelligence level, and cognitive impairment, as well as transitory conditions connected with physical condition, for instance (Del Boca & Noll 2000). These respondent factors affect the validity of self-report data. Another re-spondent factor which may affect the validity of self-report questionnaires is the general desire to present oneself in a favorable fashion (Schwarz 1999). Because in self-report questionnaires all questions are face valid and inquire about emotional or behavioral difficulties, individuals may exaggerate or minimize their degree of distress (Goldman et al 2000). Factitious disorders, for instance, cause the patients to over-report symptoms.
Task variables include a wide range of variables relating to question form, wording, and mode of administration (paper-and-pencil, computer-assisted, per-sonal interview). These variables strongly affect the response accuracy to the ques-tionnaire (Schwartz et al. 1999). They may also reveal the purpose of the assess-ment, thus influencing respondents’ motivation to respond honestly (Del Boca & Noll 2000). There is some evidence that in computer-assisted assessments respon-dents tend to report higher levels of pathological behavior than in other methods (Turner et al. 1998). Other task variables include the clarity of instructions, se-quencing of questions, type of information requested (e.g. everyday occurrences or rare occasions; well-defined events or complicated feelings), complexity and dura-tion of the task, number and range of response options, and the time interval con-sidered for assessment (e.g. past week or month vs. past year).
Motivation, a critical variable affecting response accuracy, is connected both to respondent characteristics and situational factors (Del Boca & Noll 2000). Other factors that affect motivation are linked the physical and psychological state of the respondent. Fatigue, depressive symptoms, and anxiety can decrease cooperation and motivation, and thus impact on response accuracy (Del Boca & Noll 2000).
Cognitive and communication processes involved in answering a questionnaire are similar to those that characterize discourse in everyday social interaction: atten-tion, comprehension, retrieval of information from memory, integration of this in-formation to previously processed data and response selection (Babor et al. 1990).
4.3.3 Unique characteristics of self-report ques-tionnaires
There are some unique characteristics in psychiatric self-report questionnaires compared with other assessment channels. Benefits include flexibility, adaptability, and cost-effectiveness (self-report provides economy of professional time, as the administration, scoring, and initial clinical evaluation can be done by nonprofes-sional staff) (Corcoran & Fischer 2000, Del Boca & Noll 2000). Furthermore,
22
questionnaires are highly portable and can be linked to the respondent through a variety of communications technologies, such as the telephone, computer, and even interactive television (Del Boca & Noll 2000). The data obtained by questionnaires are suited to quantitative analysis and can be compared within and between indi-viduals (Corcoran & Fischer 2000).
According to Derogatis (1983), a self-report reflects information straight from
the “experiencing self”, which is the person directly involved in the phenomena. An external observer does not share this “experience” directly. Self-reports can provide access to information that may be observable only through self-reports, such as magical thinking or feelings (Corcoran & Fischer 2000). In a clinical con-text, self-report questionnaires may help both clinicians and patients to address sensitive or embarrassing topics (Derogatis 1983, Corcoran & Fischer 2000). Self-reports also have the potential to be theoretically neutral (Corcoran & Fischer 2000).
Disadvantages of self-report questionnaires include their unsuitability for psy-
chotic disorders, in which lack of insight precludes relying heavily on the subject's judgment as to the presence or absence of a symptom, or the impairment it may generate (Eaton et al. 1991). Self-report questionnaires may cause a reactive effect in the respondent, resulting in the assessment process altering the actual problem (Corcoran & Fischer 2000). Respondents may also distort the truth to provide so-cially desirable responses (Corcoran & Fischer 2000).
In interviewer-based rating scales, the interviewer is trained to have a thorough
understanding of the criteria being evaluated. He is provided with some entry ques-tions and suggestions for the types of follow-up questions, after which he is al-lowed to query the respondent as much as necessary to clarify the meaning of ques-tions and answers. He makes a judgment on each item enquired about (Kessler et al. 2000). In self-reports, it is necessary to rely on the wording of the fully struc-tured question to be sufficiently clear to operationalize the criteria (Kessler et al. 2000). When a question is fairly clear, as is the case with recurrent thoughts of death and suicidal ideation, there may be little difference between an interviewer-based rating scale and self-reports (Blazer et al. 1994). Much more difficult is to assess conceptually complex criteria as “diminished ability to think or concentrate, or indecisiveness” by a self-report (Kessler et al. 2000). Thus, discrepancies exist between self-reports and clinical diagnostic interviews, and it seems that the poten-tial for self-report instruments is greatest when the results are not strictly dependent on threshold values (Eaton et al. 2000).
4.3.4 Use of self-reports for case identification in epidemiological studies
The main problem in psychiatric epidemiology has been development and applica-tion of case-assessment instruments for large-scale studies (Regier & Burke 2000). Prior to 1980, valid identification of cases in large samples of nonclinical popula-tions was difficult because of the lack of an explicit set of diagnostic criteria. The most common approach to case identification used a self-report questionnaire, which yielded scores that reflected the probability that a subject had a diagnosable
23
mental disorder, with higher scores indicating a greater likelihood. Usually, a cut-off score was calculated to separate the sample into two groups—cases and non-cases (Regier & Burke 2000). Self-report questionnaires are still (in the era of ex-plicit diagnostic criteria) referred as part of survey research methods, as they are well-suited for surveys (Morgan & Harmon 2001).
Large biases are present in studying cases from clinical populations and trying to extrapolate the results to the general population. Questionnaires given to large general population samples are more reliable means for survey purposes. They are also cost-effective, as no professional time is needed for their administration (Ea-ton et al. 2000).
A carefully chosen small research sample from a large population is typically drawn (Morgan & Harmon 2001). This can be done by using a self-report ques-tionnaire as a screening instrument. The General Health Questionnaire (GHQ) (Goldberg 1972) is an example of an instrument used in numerous epidemiological studies (e.g. Johnstone & Goldberg 1976, Aalto-Setälä et al. 2002, Cox et al. 2002). Some self-report questionnaires have been successfully used as screening instruments in a clinical setting to identify psychopathology in primary care and in the community (Johnstone & Goldberg 1976, Schmitz et al. 1999). When a ques-tionnaire is used in screening, a threshold value is required to define cases. A threshold value is also needed for determination of prevalence estimates of disor-ders by self-reports, when they are used as a part of descriptive epidemiology (Ea-ton et al. 2000). There are significant variations in the best threshold values of psy-chiatric questionnaires used for screening in populations from, for example, differ-ent cultures and countries (Van Hemert et al. 1995, Goldberg et al. 1998). Valida-tion studies are recommended to determine the optimal threshold value for each new population where a questionnaire is used for screening (Goldberg et al. 1998).
As mentioned earlier, discrepancies exist between self-reports and clinical diag-nostic interviews when exact descriptive diagnostics are in question (Eaton et al. 2000). It seems that the potential for self-report instruments is greatest when the results are not strictly dependent on the threshold for the presence or absence of a specific diagnosis (Eaton et al. 2000).
4.3.5 Self-reports as outcome measures
Self-reports are well-suited to comparisons, especially to self-referenced compari-son before and after clinical interventions (Corcoran & Fischer 2000). This com-parison reveals the amount of change in a selected characteristic due to treatment or to the passage of time. Measurement of outcome is essentially a measurement of change due to a clinical intervention. Self-reports are used widely as outcome measures in all kinds of psychiatric clinical trials, including such large research projects as the National Institution of Mental Health (NIMH) treatment of depres-sion project (Elkin et al. 1985) and the Sheffield psychotherapy project (Shapiro & Firth 1987), which used both observer rated and self-report measures. Self-reports, such as the GHQ and the Beck Depression Inventory (BDI) (Beck et al. 1961), have also been recently used as primary outcome measures (Ward et al. 2000, Blay et al. 2002).
24
4.3.6 Self-reports in assessment of personality traits
Standardized personality inventories present series of statements describing behav-iors. Participants are asked to indicate whether the statement is characteristic of their behavior by checking yes or no or by indicating how typical it is for them (Morgan & Harmon 2001).
Personality traits that have been measured by self-report questionnaires include defenses (Bond et al. 1983), sense of coherence (Antonovsky 1993), alexithymia (Bagby et al. 1986), addictive (Patton et al. 1994), and psychopathic features (San-doval et al. 2000).
Although self-reports have low reliability in diagnosing personality disorders according to DSM-III-R Axis II diagnostics (Perry 1992), different dimensions of personality have been measured by the Tridimensional Personality Questionnaire (TPQ) and correlated with categorical personality diagnostics (Cloninger et al. 1993).
4.4 Psychological defenses
The defense concept refers to the ways people deceive and divert themselves to make their reality (outer and inner) seem more tolerable. Ego defense mechanisms have been a central theoretical construct in psychodynamic theory since their de-scription by Sigmund Freud. They are believed to function at an unconscious level to maintain homeostasis by preventing painful ideas, emotions, and drives from forcing their way into consciousness. Sigmund Freud, and later his daughter Anna Freud, suggested that a connection exists between defense mechanisms and symp-toms (Freud 1926, Freud 1937).
Vaillant et al. (1986) have demonstrated that defenses can be presented as a hi-erarchy of defense styles, from mature to neurotic to immature. Bond et al. (1983) developed a questionnaire where the conscious derivatives of the different defenses are assessed. He relied on factor analysis to determine the grouping of the defenses and got results that supported the hierarchy suggested by Vaillant.
4.5 Symptom Checklist 90 (SCL-90)
The SCL-90 is a self-report questionnaire originally oriented towards symptomatic behavior of psychiatric outpatients (Derogatis et al. 1973). It was initially devel-oped for drug trials to assess the “relative efficacy of psychotherapeutic agents” (Derogatis et al. 1973). It has since been applied as a psychiatric case-finding in-strument, as a measure of symptom severity, and as a descriptive measure of psy-chopathology in different patient populations (Derogatis 2000). The SCL-90 is in-tended to measure symptom intensity on nine different subscales. The 90 items of the questionnaire are scored on a five-point Likert scale, indicating the rate of oc-currence of the symptom during the time reference. The instrument's global index of distress is the Global Severity Index (GSI), which is the mean value of all of the
25
items. The SCL-90 normally requires between 12 and 20 minutes to complete (Derogatis 2000).
4.5.1 A brief history
The long developmental history of the Symptom Checklist 90 (SCL-90) starts from the Cornell Medical Index (CMI) (Wider 1948), which was originally designed to screen recruits in the Second World War and was intended to both save doctors’ time and increase the accuracy of clinical diagnosis.
The "Discomfort Scale" (Parloff et al. 1953) was developed for use primarily as an improvement measure for psychotherapy studies, comprising a series of symp-toms from the CMI and supplemented with items from another scale.
Several refinements and additions of items were made by different researchers to yield the Hopkins Symptom Checklist (HSCL), which was the first form of the questionnaire to be used as a criterion measure in psychotropic drug trials (Derog a-tis et al. 1974).
The HSCL had numerous minor variations, but the 58-question version was a major landmark in the scale’s evolution (Derogatis et al. 1974). This scale, termed the Symptom Distress Checklist (SCL) (Derogatis et al. 1973), comprised mainly conventional neurotic symptoms and had a four-point scale of distress. The SCL was examined by many researchers; in some of the studies, its items were clustered by experienced clinical raters, in others, a factor analysis was done. Four to six clusters were achieved, and while they demonstrated some reliability and validity, they had limitations (Derogatis et al. 1974). Not all areas of psychiatric sympto-mathology were covered by the SCL, and some items did not measure the five pri-mary constructs of the scale, or were included in many constructs at the same time, thus bringing “noise” to the instrument.
According to Derogatis (1983), during a systematic psychometric development program certain items of the five primary symptom dimensions of the HSCL were dropped and 45 new items, subsumed under four new symptom dimensions, were added to create the SCL-90, and later, the SCL-90-Revised version (SCL-90-R), which contains only minor revisions to the SCL-90. Thus, the first five symptom dimensions of the SCL-90 were evolved from factor analytic studies on the SCL, and the other four were rationally developed and later validated (Derogatis et al. 1973).
4.5.2 Descriptive profile
The SCL-90 is a 90-item self-report symptom inventory designed primarily to re-flect the psychological symptom patterns of psychiatric and medical patients. It is a measure of current, point-in-time psychological symptom status, not a measure of personality. Each item of the questionnaire is rated by the patient on a five-point scale of distress from 0 (none) to 4 (extreme). The SCL-90 consists of the follow-ing nine primary symptom dimensions:
I. Somatization II. Obsessive-compulsive III. Interpersonal sensitivity
26
IV. Depression V. Anxiety VI. Hostility VII. Phobic anxiety VIII. Paranoid ideation IX. Psychoticism
The instrument's three global indices of distress are:
I. Global Severity Index (GSI) II. Positive Symptom Distress Index (PSDI) III. Positive Symptom Total (PST)
Administration
The questionnaire requires a brief introduction by a nurse, technician, or clinical interviewer to ensure validity (Derogatis 2000). The introduction can be very short but should allow time for the patient to ask questions (Derogatis 1983).
Instructions
Instructions are quite simple, as the above sample shows: “Below is a list of problems and complaints that people sometimes have. Read each one carefully and select one of the numbered descriptors that best describes how much discomfort that problem has caused to you during the past 7 days INCLUDING TODAY. Place that number in the open block to the right of the prob-lem. Do not skip any items, and print your number clearly. If you change your mind, erase your first number completely.” (Derogatis 1983)
Time set
The standard time set given with the SCL-90 is “7 days including today”, but it is designed with a flexible time window so that evaluations over other specific peri-ods of time can be made (Derogatis 1983).
Administration t ime
The SCL-90 requires between 12 and 20 minutes to complete. The typical time for administrative instruction is 1-2 minutes (Derogatis 2000).
Target samples
The SCL-90 is designed for a broad spectrum of populations, ranging from nonpa-tient “normal” populations to medical patients or individuals with psychiatric dis-orders. Like other self-reports, SCL-90 should not be administered to delirious, mentally retarded, or floridly psychotic patients (Derogatis 1983).
27
4.5.3 Description of SCL-90 symptom dimensions and global indices
Each of the nine symptom dimensions comprises 6-13 items. The scores on each dimension are means of the scores of all items of the dimension. The mean scores on the nine dimensions can be expressed as a symptom profile (see Fig. 1). The items in Finnish are presented in Appendix 1. The description of the original sug-gested dimensions is as follows:
Somatization (SOM, 12 items)
This dimension reflects distress arising from bodily perceptions. Complaints fo-cused on cardiovascular, gastrointestinal, respiratory, and other systems with auto-nomic mediation are included. Many of these symptoms are included in diagnostic criteria of anxiety disorders and have a high prevalence in disorders with suggested functional etiology. All of them may, naturally, be reflections of a physical illness.
Obsessive-compulsive (O-C, 10 items)
This dimension reflects symptoms typical of obsessive-compulsive disorder. The focus is on thoughts, impulses, and actions that are experienced as irresistible by the individual but are of an ego-alien or unwanted nature. Experiences of cognitive attenuation are also included in this dimension.
Interpersonal sensitivity (INS, 9 i tems)
This dimension focuses on feelings of personal inadequacy and inferiority in com-parisons with others. Self-deprecation, uneasiness, and discomfort during interper-sonal interactions are included here.
Depression (DEP, 13 i tems)
Most of the typical symptoms of depressive syndromes according to current diag-nostic criteria are included here. Symptoms of dysphoric mood and affect as well as signs of withdrawal of life interest, lack of motivation, and loss of vital energy are represented. Feelings of hopelessness, thoughts of suicide, and cognitive and somatic correlates of depression are included.
Anxiety (ANX, 10 items)
This dimension is composed of symptoms that are associated with manifest anxi-ety. Nervousness, tension, and trembling as well as feelings of terror and panic are included. Some somatic correlates of anxiety are also included here.
Hostility (HOS, 6 items)
Thoughts, feelings, or actions characteristic of the negative affect state of anger are reflected here. Qualities such as aggression, irritability, rage, and resentment are included.
28
Phobic anxiety (PHO, 7 items)
Phobic anxiety is defined as a persistent fear response to a specific person, place, object, or situation which is characterized as being irrational and disproportionate to the stimulus. It leads to avoidance or escape behavior. The items of this dimen-sion are actually all manifestations of agoraphobia.
Paranoid ideation (PAR, 6 items)
Paranoid ideation is represented here as a disordered mode of thinking. Projective thinking, hostility, suspiciousness, grandiosity, centrality, fear of loss of autonomy, and delusions are viewed as primary reflections of this disorder.
Psychoticism (PSY, 10 items)
The construct of psychoticism is represented here as a continuous dimension of human experience. The scale provides a continuum from mild interpersonal alien-ation to dramatic evidence of psychosis. Items include withdrawal, isolation, and schizoid lifestyle as well as first-rank schizophrenia symptoms such as hallucina-tions and thought-broadcasting.
Additional i tems (7 items)
These items contribute to the global scores of the questionnaire but are not scored collectively as a dimension. They primarily touch upon disturbances in appetite and sleep patterns.
Global indices of distress (GSI, PSDI, PST)
The scores on the nine symptom dimensions are expressed as a profile of symp-toms. The global indices provide a means of communicating an individual’s pa-thology with a single number. There are three suggested global indices for the SCL-90: 1) Global Severity Index (GSI), which is the average score of the 90 items of the questionnaire, 2) Positive Symptom Distress Index (PSDI), which is the av-erage score of the items scored above zero, and 3) Positive Symptoms Total (PST), which is the number of items scored above zero (Derogatis 1983). The GSI is sug-gested to be the best single indicator of the current level of the disorder. PSDI, as a pure intensity measure, probably also assesses the response style of the patient, i.e. whether the patient is “augmenting” or “attenuating” his symptoms (Derogatis 1983).
4.5.4 Reliability and validity of SCL-90
4.5.4.1 Reliabili ty
Reliability measures on SCL-90 are of two types, internal consistency and test-retest. Interrater reliability is not relevant as this is a self-report.
29
Internal consistency coefficients (Cronbach’s α) have been reported for the SCL-90 subscales and global indices across such different populations as control groups (Derogatis 1983), psychiatric inpatients (Rauter et al. 1995), and substance abuse inpatients (Zack et al. 1998) as well as cancer patients (Fitch et al. 1995). The internal consistencies have been good. For example, coefficient α in a study with 209 symptomatic volunteers ranged from 0.77 to 0.90 (Derogatis et al. 1976).
Stability coefficients (test-retest reliability) for the SCL-90-R have generally been adequate across a range of patient groups and test-retest intervals (Derogatis 2000). A study with a test-retest interval of 1 week for 94 mixed psychiatric outpa-tients had a range of 0.78–0.90 (Derogatis 1983); a second study with a 10-week interval between tests had correlation coefficients ranging from 0.68 to 0.80 (Dero-gatis 2000).
4.5.4.2 Validity
The results of studies concerning the validity of the instrument are controversial; there is strong support for its validity as a measure of general symptom severity and changes in symptom severity but less support for its suggested dimensionality.
4.5.4.2.1 Convergent validity
Convergent and discriminant validity are different aspects of concurrent validity, which together with predictive validity are components of criterion validity. Stud-ies have generally lent more support for convergent than discriminant validity. Of the scales of the SCL-90, the DEP and the ANX scales have the most evidence of some convergent and discriminant validity. The O-C scale has also been studied separately and found to have questionable convergent and weak discriminant valid-ity.
Some studies have claimed good convergent validity for the SCL-90 (Derogatis et al. 1976, Dinning & Evans 1977). In these studies, the nine SCL-90 dimensions were found to correlate with analogous measures from other tests. Derogatis et al. (1976) demonstrated that the nine primary symptom dimensions of the SCL-90 correlated significantly in a convergent fashion with like score constructs on the Minnesota Multiphasic Personality Inventory (MMPI). Peveler & Fairburn (1990) compared the SCL-90-R scores with those obtained from the investigator-based interview, the Present State Examination, in two samples: patients with chronic physical disease (diabetes mellitus) and patients with bulimia nervosa. There was good agreement between the two methods of measurement in both samples.
The DEP and ANX scales of the SCL-90 seem have good convergent and dis-criminant validity. The SCL-90 ANX, PHO, and DEP scales and the GHQ-28 anxiety/insomnia and severe depression scales in a psychiatric outpatient popula-tion were compared with DSM-III diagnosis, and with prototypical anxiety and depression scales; the SCL-90 ANX and DEP scales showed good convergent and discriminant validity (Koeter 1992). The Hamilton depression and anxiety rating scales and the SCL-90 scales were psychometrically investigated in a British cross-national sample of patients with a variety of nonpsychotic symptoms of anxiety
30
and depression, and a high concurrent validity was found between both DEP and ANX scales and discomfort (Bech et al. 1992). In a study of 900 psychiatric outpa-tients, the DEP scale of the SCL-90-R was correlated with the Beck Depression Inventory (BDI) (Beck et al. 1961) total score but not with the Beck Anxiety In-ventory (BAI) (Beck & Steer 1987) total score. At the same time, the ANX scale of the SCL-90-R was correlated with the BAI total score but not with the BDI total score (Derogatis 2000). In a study of 79 inpatient adolescents, the SCL-90-R DEP scale had a higher corre-lation with the Children’s Depression Inventory (CDI) (Kovacs 1985) than with the Social Maladjustment Scale of the Jesness Inventory (Jesness 1996). By contrast, the PAR scale had a higher correlation with the Social maladjustment scale than with the CDI (McGough & Curry 1992).
In a study of 54 outpatients with obsessive-compulsive disorder (OCD), the O-C scale correlated significantly with other scales that measure obsessive-compulsive symptoms, but it was generally more strongly related to the SCL-90-R DEP and ANX scales than to other measures of obsessive-compulsive symptoms, indicating questionable divergent validity (Kim et al. 1992). The findings also sug-gested that the O-C scale may be insensitive in assessing change in obsessive-compulsive symptoms. In another study, the O-C scale was examined using a multi-trait multi-method approach in a sample of 54 outpatients with OCD. The O-C scale proved to be internally consistent, but the evidence for convergent valid-ity was mixed, and the results suggested poor discriminant and criterion-related validities. Overall, the SCL-90-R was concluded to be a poor measure of OCD symptoms (Woody et al. 1995).
4.5.4.2.2 Discriminant validity
A few studies do claim adequate discriminant validity for the instrument. In Dero-gatis et al. (1976), the result that the dimensions correlated to a lesser degree with nonanalogous scales than they did with analogous scales is interpreted as a demonstration of discriminant validity. Using discriminant analysis, Rief and Fich-ter (1992) found that the SCL-90 can distinguish between patients with dysthymia, anxiety disorders, and anorexia nervosa.
By contrast, Dinning and Evans (1977) reported that the original dimensions correlated with nonanalogous measures and with one another, an indication of low discriminant validity. In addition, Clark and Friedman (1983) found differences in the mean intensity levels between anxious, depressed, and schizophrenic patients but no difference in profile shapes. In the study of Morgan et al. (1998), two pa-tient groups, anxious and depressed patients, filled out the SCL-90-R. Factor analysis on ANX and DEP items yielded two separate factors, which speaks for some discriminant validity for at least these subscales.
Discriminant validity at the level of patients vs. the normal population has been shown by a few studies (Schmitz et al. 1999).
4.5.4.2.3 Construct validity
Although studies by Derogatis et al. (2000) have generally found support for nine dimensions corresponding closely to the subscales of the SCL-90, there is mount-
31
ing evidence of problems in replicating the nine factor groups, which makes the dimensionality of the SCL-90 questionable (Clark & Friedman 1983).
Cyr et al. (1985) have concluded that the SCL-90-R is best considered a unidi-mensional measure of overall psychological distress. According to Hoffman and Overall (1978), within a heterogenous clinical population, the SCL-90 measures only a single global distress factor, rather than nine distinct dimensions. This find-ing was repeated in an unselected outpatient data by Evenson et al. (1980). Lack of dimensionality by factor analysis has also been shown for a comorbid abuser popu-lation (Zack et al. 1998), an acute involuntary adult patient population (Rauter et al. 1995), and adult and adolescent crisis samples (Bonynge 1993). German (Schmitz et al. 1999) and Norwegian (Vassend & Skrondal 1998) studies could not replicate the original dimensions for the SCL-90-R.
Some factor analytic studies of the SCL-90-R have yielded from six dimensions (depression, somatization, anger or hostility, paranoia-psychoticism, phobic anxi-ety, and obsessive-compulsive) to two highly correlated dimensions (anxious-depression and paranoid thinking) (Derogatis 2000).
4.5.4.3 Conclusions on reliability and validity of SCL-90
According to the reviewed literature, the reliability of the SCL-90 is good. The in-ternal consistency of the instrument in particular seems high. The validity findings are, however, controversial: a few studies claim some convergence to theoretically similar constructs; most report a lack of sufficient discriminant validity. The few studies on the instrument’s ability to discriminate patients from the general popula-tion support this rough discriminant validity. Most of the studies on construct va-lidity do not support the originally reported dimensional structure of the instru-ment.
The factor structure of the SCL-90 should be empirically established for each
new population in which it is applied because the structure tends to depend on the sample examined (Clark & Friedman 1983, Rief & Fichter 1992). This has been done in some populations, including different groups of psychiatric outpatients such as those with dysthymia, anxiety disorders, and anorexia nervosa (Rief & Fichter 1992), psychiatric inpatients with functional psychoses and neuroses (Din-ning & Evans 1977), veteran psychiatric population suffering from anxiety, depres-sion, and schizophrenia (Clark & Friedman 1983), and a nonpsychiatric healthy population (Derogatis 1983). This kind of validation has also been done in some countries, such as Germany (Schmitz et al.1999).
4.5.5 SCL-90 as an outcome measure
The SCL-90 is well-suited for measuring general mental health and changes in symptoms (Bech et al. 1993, Derogatis 2000). The SCL-90 has been used as a cen-tral outcome measure in numerous clinical trials. It has been used in many psy-chopharmacological trials (Davidson et al. 1978, 1981, 1983, Kahn et al. 1987, Barlow et al. 1988, Primeau et al. 1990, Holland et al. 1991, Strayer et al. 1994, Florkowski et al. 1998, Pani et al. 2000) as well as in psychotherapy trials (Piper et al. 1990, Selmi et al. 1990, Shapiro & Firth-Cozar 1990, van der Sande et al. 1997,
32
de Jonghe et al. 2001). The GSI and sometimes the DEP and ANX subscales have been used as psychiatric outcome measures.
4.5.6 SCL-90 as a psychiatric screening instrument
According to Derogatis (2000), the SCL-90-R has received the most support for wide-ranging use as a screening instrument of global psychological distress. In other sources, the SCL-90 is not considered to be an optimal psychiatric screening instrument since briefer questionnaires, such as the GHQ, are available for that purpose (Bech et al. 1993). A recent study suggests that the screening ability of the SCL-90-R is limited in consultation-liaison setting, as it failed to sufficiently dis-criminate somatic patients with diagnosed mental problems from those without them (Schmitz et al. 2002). The SCL-90-R has been used as a clinical screening instrument in a few studies in primary care (Schmitz et al. 1999, Schmitz et al. 2001).
4.5.7 SCL-90 as a brief measure of mental status
The SCL-90 has been used in numerous studies as a brief indicator of mental health (Hauff & Vaglum 1995, Derecho et al. 1996, Koh et al. 2002, Preston et al. 2002). Several recent studies that use the SCL-90 as a measure of mental status concern mental health issues in a nonpsychiatric setting (Boudrez & De Basker 2001, Skydsbjerg et al. 2001, Yang 2001, Arlt et al. 2002, Osterberg et al. 2002).
4.5.8 Use of SCL-90 in Finland
Cross-cultural validation studies have been conducted in different countries (Schmitz et al. 1999) and in a population of immigrants (Noh & Avison 1992). In Finland, a validation study has not yet been done, although the SCL-90 has been used in a few studies.
No published data are available on the Finnish translation process for the SCL-90, but the author is aware of two different translations, which are very simi-lar.
Parts of the Finnish version of the SCL-90 have been used in large epidemiol-ogical studies; the ANX and SOM subscales in Mini-Suomi (Lehtinen et al. 1985) and the SOM subscale in Terveys-2000 (Kansanterveyslaitos 2002). It has also re-cently been used as an outcome measure in two studies on depression (Antikainen et al. 2001, Viinamäki et al. 2002). The whole scale as well as individual subscales have been used as indicators of mental status (Honkalampi et al. 1999, Valkamo et al. 2001, Kaustio et al. 2002)
A briefer version of the SCL-90, the SCL-25, has been used as a screening in-strument (Joukamaa et al. 1994, Joukamaa et al. 1995, Karlsson et al. 2000) and as an indicator of mental status (Joukamaa et al. 1996, Sipila et al. 2001). Its screen-ing performance in a Finnish population has been evaluated in a recent study (Vei-jola et al. in press).
33
4.5.9 Different versions of SCL-90
The SCL-90-R is a copyright version of the SCL-90. It is nearly identical to SCL-90, with only two different questions in the ANX scale and some minor alterations in few other items (Derogatis 2000). Most validation work has been done with the SCL-90 (e.g. Derogatis et al. 1976). Both versions are used extensively. The SCL-90-R can be purchased with a manual for interpretation, which includes standards for different psychiatric and nonpsychiatric populations. To suit clinical work, the SCL-90-R scores are converted to standard T-scores (ranging from a minimum of 30 to a maximum of 80) by referring to the appropriate population-based norm ta-bles provided by the test manual. A T-score of 50 represents the mean T-score of the respective normal population, and the T-score range from 40 to 60 represents the normal range (as defined by the mean ± SD). Most scientific results published with the SCL-90 or the SCL-90-R use simple mean values for the nine subscales and the GSI.
Older versions include the 35-, 58-, and 65-item scales (Bech et al. 1993). The brief symptom checklist with 58 items is a copyright version marketed with a man-ual similar to the SCL-90-R. The SCL-25 has been used as a psychiatric screening instrument.
4.6 Measuring outcome in psychiatric treatment trials by self-report
SCL-90 may be used as the primary or even the only outcome measure in treatment trials. In these situations, the researcher has to trust patients to reliably report symptoms. In other studies, especially in larger projects, the SCL-90 has been used as one of many outcome measures (Knekt et al. 2003). Its function then is to pro-vide one aspect of outcome, that of self-conceived well-being. In studies with psy-chotic patients, self-reports are suggested to be unreliable (Eaton et al. 2000), and thus, should not be used as primary outcome measures.
4.6.1 Change in symptom distress during queuing to psychological treatment
A self-report may, for at least two reasons, be useful as a primary outcome measure in the setting of queuing to psychotherapy. Firstly, the patients are usually nonpsy-chotic outpatients with the capacity to evaluate their own symptoms. Secondly, a clinical interview could interfere more than a self-report with a patients’ condition and cause a treatment-like effect.
During a queuing period changes in psychiatric symptoms may occur due to the untreated course of the disorder in question or because of hope or frustration of having to wait for help (Parloff 1986). Patients on a waiting-list have been used as control groups for different psychotherapies to distinguish the effect of the treat-ment on the spontaneous course of the illness (Parloff 1986).
34
Coryell et al. (1994) found that an untreated depressive episode remits after 26.5 weeks on average. In another words, during the first six months depression remits in 2% of subjects per week (Posternak & Miller 2001). With a focus on the natural course of major depression, a recent meta-analysis with 19 studies and 221 patients targeted the symptom change in major depression while being on waiting-list (Posternak & Miller 2001). The waiting periods were from 2 to 20 weeks. An overall mean reduction of 10-15% in the Hamilton Depression Rating Scale (HDRS) and BDI occurred during the waiting period (Posternak & Miller 2001).
In anxiety disorders, improvement while waiting for treatment is less clear then for depression. For example, a recent meta-analysis (Fedoroff, 2001) on social phobia yielded changes close to zero for waiting-list control subjects. In studies on generalized anxiety disorder the change in anxiety scale scores (HARS, STAI) while being on waiting-list has ranged from –4% to 14% (Durham, 1993). How-ever, in a recent meta-analysis of cognitive therapies on panic symptoms, 26% of waiting-list controls were panic-free at end-point (Goldberg, 1998).
Some treatment studies have measured the symptom severity with the symptom checklist-90 (SCL-90) (Derogatis et al. 1973): In a study on computer-administered cognitive therapy, waiting-list group improved 0.5 SD:s during 2 months measured both by DEP subscale and GSI (Selmi 1990). In an SCL-90 study on short-term individual psychotherapy of 8 weeks of family practice patients with mixed psy-chiatric problems, waiting-list group improved by 13% (Brodaty & Andrews 1983). In two studies on personality disorders, patients on waiting-list improved between 4.5% and 7% on the SCL-90 global score (Winston et al. 1994, Winston et al. 1991).
Besides the spontaneous remitting course of major depression, treatment-seeking (Kellner & Sheffield 1971) and obtaining a thorough evaluation (Sox et al. 1981) are assumed to cause therapeutic benefits. The distinction between the spon-taneous and the non-spontaneous effects during queuing has not been studied pre-viously (Posternak & Miller 2001), as subjects in waiting-lists have not been the focus of interest in treatment trials.
4.6.2 Change in symptom distress of chronic inpa-tients during biological treatment
As the patients in this setting have psychotic symptoms, self-report alone may not be the most reliable way of measuring treatment outcome (Eaton et al. 2000). The use of a self-report is justified for other purposes however. When a new treatment is being studied, attention must be paid to a variety of different effects and side-effects. A self-report with a wide range of different symptoms could be useful in this situation.
Transcranial magnetic stimulation (TMS) allows noninvasive stimulation of brain neurons using changing magnetic fields. Repetitive TMS (rTMS) has clinical potential based on its capability to modify the activity of the stimulated cortical area. This modification lasts longer than the duration of the stimulation and extends beyond the stimulated area to other brain areas through trans-synaptic effects (Holi 1999).
Repetitive transcranial magnetic stimulation (rTMS) of the left dorsolateral pre-frontal cortex (DLPFC) has been studied mainly as a therapeutic tool for major de-
35
pression (Pascual-Leone et al. 1996, George et al. 1997). High-frequency rTMS has been reported to normalize the hypoactive left DLPFC found in a portion of depressed patients (George et al. 1995).
Some preliminary rTMS studies have demonstrated improvement in mood (Geller et al. 1997), in anxiety and restlessness (Feinsod et al. 1998), and in nega-tive symptoms (Cohen et al. 1999) in schizophrenic patients. A single case of bene-ficial effects of rTMS in catatonia has been published (Grisaru et al. 1998). Three treatment studies of rTMS in schizophrenia patients have been published to date. Low-frequency left temporoparietal TMS seemed to reduce auditory halluci-nations in schizophrenia patients (Hoffman et al. 2000), low-frequency right pre-frontal rTMS over two weeks had no effect on symptoms (Klein et al. 1999), and high-frequency left prefrontal rTMS showed some therapeutic effect on symptoms (Rollnick et al. 2000).
4.7 Conclusions based on the literature
The use of rating scales is justified in many clinical settings and is crucial in re-search settings. Developing and validating research instruments is vitally important for collecting accurate information. Instruments developed for a particular popula-tion (defined e.g. by age, sex or cultural group) may not be valid for other popula-tions. The SCL-90 has been used to measure psychiatric symptoms in outcome studies and epidemiological studies and to describe mental status. It has been probably used as a clinical tool at least in USA, where it has been evaluated in the Handbook of Psychiatric Measures (APA 2000).
In Finland, parts of the SCL-90 have been used in two major surveys, the Mini-Suomi in the 1980s and the Terveys-2000, as an indicators of mental health. It has also been used as an outcome measure in two clinical studies.
The SCL-90 has not yet been psychometrically tested in Finland; its reliability, validity, and usefulness as an outcome measure have not been assessed. Studies evaluating translated research instruments such as the SCL-90 are needed to ensure accurate collection of psychiatric information.
36
5 Aims of the study
This thesis examined the SCL-90 in a Finnish population. The instrument’s psy-chometric properties and its usefulness were evaluated. Detailed aims of the study were as follows: I To validate the SCL-90 in a Finnish population and to set community
norms for it (Study I) II To evaluate the SCL-90 as a screening instrument in the Finnish population
and to compare it with two other screening instruments (Study II) III To use the SCL-90 to empirically examine the relation between psychiatric
self-reported symptoms and defense mechanisms (Study III) IV To use the SCL-90 as a primary outcome measure in a psychiatric treat-
ment trial in a typical psychotherapy research setting (Study IV) V To use the SCL-90 as a secondary, subjective exploratory outcome meas-
ure in a nontypical sample of psychotic patients in a biological treatment trial (Study V)
37
6 Subjects and Methods
6.1 Subjects
6.1.1 Studies I-III
The subjects comprised a community sample and an outpatient sample. The com-munity sample (n=337 for Studies I and III) was recruited from employees of the city of Espoo. Possible mental diseases were not ruled out in this sample. The community sample of Study II (n=315) were those subjects from the community sample who satisfactorily filled out (more than 2/3 of the items) both the SCL-90 and the GHQ-36.
The questionnaires were mailed to 600 subjects, 56% (n=337) of whom subse-quently returned them. In total, 50% (n=300) of subjects returned the question-naires after the first mailing, and the remaining 6% (n=37) returned them after a reminder. Of this sample, 40% (n=136) were men and 60% (n=201) were women. The average age of responders was 37 (range 18-64) years. For the 306 subjects with data on education available, the level of education was as follows: 49% (n=151) primary or secondary school, 15% (n=47) high school or college, and 35% (n=108) academic studies or degree.
Of the subjects who failed to return the questionnaires, 63% (n=166) were men and 37% (n=97) were women. The average age of these subjects was 35 (range 16-76) years, and their level of education was as follows: 55% (n=143) primary or secondary school, 12% (n=32) high school or college, and 32% (n=84) academic studies or degree. Data on education were unavailable for four individuals who did not return the questionnaire. A significant difference was present in age (independ-ent sample t-test, p<0.0005) and sex (chi-square test, p<0.0005), but not in level of education (chi-square test, p=0.34), between those who returned the questionnaire and those who did not.
The outpatient sample of Study I (n=249) is a consecutive sample of patients at-
tending the Helsinki University Outpatient Clinic of Psychiatry between 1 March 1992 and 31 December 1993. The clinic serves as a psychiatric tertiary care unit in the Helsinki district, which has a population of approximately one million. Of these patients, 31% were men and 69% were women. The average age was 36 (range 18-62) years and education levels were as follows: 15% primary school, 35% secon-dary school, 39% high school/college, and 11% academic degree.
The outpatient sample of Study II (n=207) were those subjects from Study I who satisfactorily filled out (more than 2/3 of the items) both the SCL-90 and the GHQ-36. Of these patients, 30% (n=62) were men and 70% (n=143) women. Their average age was 36 (range 18-62) years. Of the 118 subjects with data available on education, the level of education was as follows: 48% (n=56) primary or secondary school, 36% (n=43) high school or college, and 16% (n=19) academic studies or degree.
38
The outpatient sample for Study III (n=122) were those subjects from Study I, who satisfactorily filled out both the SCL-90 and the DSQ. Of these 13% were men and 87% women. Their average age was 36 (range 19-62) years and levels of edu-cation were as follows: 16% primary school, 34% secondary school, 39% high school or college, and 11%, academic degree.
Missing data were treated as follows: missing values in the items of each in-
strument (SCL-90, DSQ, GHQ, SOC) were replaced by the subject’s average value for the existing items on each instrument. If a subject left three items unfilled in the SCL-90, the items were replaced by the mean value of the existing 87 items.
6.1.2 Study IV
The sample consists of patients (n=367) referred by general practitioners or psy-chiatrists to a randomized psychotherapy trial comparing four different psycho-therapies, the Helsinki Psychotherapy Study. The sample represents the population which usually receives psychotherapy funding from the Finnish Social Insurance Institution (Knekt et al. submitted).
To enter the study, patients had to be aged 20-45 years and suffer from depres-sive or anxiety disorder. A videotaped DSM-IV criteria-based diagnostic interview was conducted for all the patients. Fifty-seven percent (n=205) of the sample suf-fered from depressive disorder (major depressive disorder, dysthymia, bipolar 2, or depressive disorder not otherwise specified) and 14% (n=52) from anxiety disorder (Social or other phobias, obsessive-compulsive disorder, generalized anxiety disor-der, panic disorder with or without agoraphobia, and post traumatic stress disor-der); 29% (n=103) suffered from combined depressive and anxiety disorder. Of this sample 75% (n=276) were women and 25% (n=91) were men. The average age was 32 (range 20-45) years, and the level of education of the sample was as fol-lows: 25% primary school, 47% secondary school, high school or college, and 28% academic degree.
6.1.3 Study V
The sample for this study comprised 22 chronic inpatients from a state mental hos-pital in western Finland with a DSM-IV schizophrenia diagnosis verified by Struc-tured Clinical Interview for DSM-IV (SCID) (First et al. 1995). Nineteen of the patients were men and 20 right-handed. Those with major physical or neurological abnormalities were excluded. Of the 22 patients, 10 were of paranoid, one of cata-tonic, three of hebephrenic, six of undifferentiated, and two of residual type schizophrenia.
6.1.4 Ethical considerations
Studies I-IV were approved by the ethics committee of Helsinki University Central Hospital. In Study V, written informed consent was obtained from the subjects af-ter a complete description of the study. Study V was approved by the ethics com-mittee of Vaasa hospitals.
39
6.2 Methods
6.2.1 Measures
In Studies I, II, and III, the subjects filled out four questionnaires: the SCL-90, the Defense Style Questionnaire (DSQ) (Bond et al. 1983), the General Health Ques-tionnaire-36 (GHQ-36) (Goldberg 1972), and Antonovsky’s Sense Of Coherence Scale (SOC) (Antonovsky 1993).
In Study IV, the SCL-90 was filled out along with a brief questionnaire on so-cioeconomic factors, physical health, and prior treatments.
In Study V, the patients, filled out the SCL-90 and were also rated by the Posi-tive and Negative Symptoms Scale (PANSS) (Kay et al. 1987), and the Mini Men-tal State Examination (MMSE) (Folstein et al. 1975).
6.2.1.1 SCL-90
The SCL-90 was initially introduced in the literature review (see section 4.5). The SCL-90 is a self-report questionnaire designed for use as a psychiatric case-finding instrument, as a measure of global symptom severity, and as a descriptive measure of psychopathology. It is intended to measure symptom intensity on nine different subscales.
The questionnaire was a Finnish translation of the SCL-90 used in several stud-ies in Finland. The translation from American English to Finnish was produced by two translators separately. The two translations were compared, and found to be highly similar. Time of reference for the symptoms was one year in Studies I-III, one month in Study IV, and one week in Study V.
6.2.1.2 Defense style questionnaire (DSQ)
The DSQ (Defense Style Questionnaire) is a self-report questionnaire designed to tap the conscious derivatives of the unconscious defenses (Bond et al. 1983). It is still in development and has several versions with a different number of items to be scored on a nine-point scale. The subject's defensive profile can be calculated from the results. According to Bond’s original factor analytical study (1983), four basic defensive styles emerge from the questionnaire: mature, neurotic, borderline (im-age-distorting), and immature. In Andrews et al.’s study (1989), defense mecha-nisms were relabeled according to the DSM III-R, and six items were discarded. Only three factors could be found: mature, neurotic, and immature. Former factor analytical studies in the Finnish general population (Sammallahti et al. 1994, Sammallahti & Aalberg 1995) have yielded four factors similar to Bond’s original factors (Bond et al. 1983). The items of the DSQ assess the conscious derivatives of defenses, which are scored by taking the mean score of the representative items. We used the 72-item version with 20 DSM III-R relabeled defenses (Andrews et al. 1989).

40
6.2.1.3 General Health Questionnaire 36 (GHQ-36)
The GHQ-36 is a self-report questionnaire designed to identify short-term changes in mental health. It is a shortened version of the GHQ-60 (Goldberg & Williams 1988). It provides a state measure of the degree to which a subjects feel that their present state “over the past few weeks“ is unlike their usual state. The GHQ-36 has a four-point response scale that is usually scored in a bimodal fashion as follows: a symptom is present ”not at all” (0), “same as usual” (0), “rather more than usual” (1), and “much more than usual” (1). For psychometric analyses, it is also possible to use a simple Likert scale (0-1-2-3). The total score, obtained by summing up the scores of the individual items, is a measure of severity of illness (Goldberg & Wil-liams 1988).
The GHQ-12 is a widely used brief screening instrument, that has produced re-sults comparable with the longer versions of the GHQ (Goldberg et al. 1997). It usually requires 2 to 5 minutes to complete. It can be extracted from the 36-item GHQ version, as was done in this study.
6.2.1.4 Sense of Coherence Questionnaire (SOC)
Antonovsky’s (1987) Sense of Coherence Scale (SOC) is a questionnaire that measures coping, mainly from a sociological point of view. The SOC construct is composed of three components, each supposed to be essential in coping with psy-chosocial stressors. A high sense of coherence indicates that a person generally finds life to be meaningful, manageable, and comprehensible. SOC consists of 29 items; respondents are asked to select a response on a seven-point semantic differ-ential scale with two anchoring phrases. The measure is basically unidimensional as the items have strong intercorrelations. SOC is reported to have high reliability and has been shown to be associated with various measures of good health (An-tonovsky 1993).
6.2.1.5 Positive and Negative Symptoms Scale (PANSS)
The PANSS (Kay et al. 1987) is a 30-item rating scale made up of four subscales measuring positive and negative syndromes, their differential, and general severity of illness. It is a reliable and valid measure of different schizophrenia symptoms (Kay et al. 1988) and has been used as a main symptom measure in numerous stud-ies on schizophrenia.
6.2.1.6 Mini Mental Status Examination (MMSE)
The MMSE (Folstein et al. 1975) is a 30-item validated screening tool for cogni-tive impairment, a score exceeding 24 indicating impairment.
6.2.2 Statistical methods for Studies I-III and previously unpublished data
In Study I, the mean values of the original nine subscales and the General Severity Index (GSI) (Derogatis et al. 1973) were calculated for the two samples, and the
41
two average profiles were compared. The ability to distinguish between patients and controls (discriminant validity) was checked by independent samples’ two-tailed t-test and by discriminant function analysis. Internal consistency of the origi-nal subscales was tested by Cronbach's coefficient α. To evaluate dimensionality
(construct validity) of the questionnaire, intercorrelations of individual subscales were calculated to determine the extent of their interdependence. Dimensionality was also tested by factor analysis. Principal Component Analysis (PCA) of all data as well as of both samples separately was carried out.
In Study II, as preliminary analyses of the SCL-90 and the GHQ-36, 1) the cor-relation between the total raw scores was estimated by Pearson’s correlation coef-ficient, 2) the internal consistencies of the two above mentioned scales and the GHQ-12, which can be extracted from the GHQ-36, were tested by Cronbach’s α, and 3) the mean total raw scores of the three scales for the two samples were com-pared by independent samples’ two-tailed t-test.
We used ROC analysis to compare screening performance of the GHQ-36, the GHQ-12, and the SCL-90. Belonging to the patient or to the community sample was our external criterion. The optimal cut-off points were evaluated by Youden’s index (Youden 1950).
In Study III, maximum likelihood factor analysis was performed for the DSQ on the whole sample to confirm the factorial structure reported earlier (Andrews et al. 1989). After Cattel’s scree test (Cattel 1966), the extracted factors were rotated by Varimax rotation with Kaiser normalization. Two-tailed t-test comparisons of the defense scores of women and men were done. We examined subjects who scored significantly higher (0.5 SD) than the average score of the community sample on certain defense styles according to the procedure described by Bond (1983), and calculated their mean GSI and mean symptom profiles from the SCL-90.
Multiple regression analysis was used to find out how much of the variation in the GSI and the specific symptom scales the defense styles and the different de-fense mechanisms would explain. Listwise deletion of cases with missing values was performed. Separate regression analyses were performed on the community sample and on the patient sample. The contribution of individual defense styles or defense mechanisms was based on their β values (Munro & Page 1993).
Two-tailed t-test was used to compare defense styles and defense mechanisms of patients and the community sample with the same level of self-reported symp-tom distress according to GSI (subjects scoring between one SD and two SDs above the mean GSI value of the community sample).
Some new data were obtained by comparing the patient and community sample
means of all the SCL-90 items and subscales. The mean differences were calcu-lated to determine the questions and subscales that best differentiate between the samples.
6.2.3 Methods for Study IV
After referral to the study, the SCL-90 was mailed to the patient along with a brief questionnaire including socioeconomic factors and previous treatment. This was considered to be the start of the waiting period and the baseline of this study. The

42
average queuing time was 75 (range 9-292) days during which a wash-out of pos-sible antidepressants was carried out. The SCL-90 was filled out for the second time at the endpoint of this study, as a part of a comprehensive initial evaluation of the Helsinki Psychotherapy Study.
The association between symptom change and the possible explaining factors (sociodemographic factors, previous treatment, psychiatric diagnoses, length of queuing time, and baseline GSI score) was assessed by both linear and logistic modeling. Mean reduction of the baseline GSI score from baseline to endpoint was used as a measure of the symptom change for the linear model. Reduction of 50% or more in the GSI score was defined as clinical response. Odds ratio for this re-sponse was used as a measure of strength of association for the logistic model. Po-tential confounding factors (sex, age, marital status, education, employment status, earlier psychotherapy within 2 years, psychiatric diagnoses, and baseline GSI score) were included in the primary models, and those with no effect on change (p value >0.2) were excluded from final models. Interaction terms between queuing time and baseline SCL-90 score and Axis II diagnosis were included in the models. P-values for significance were determined based on the F-distribution in the linear model and based on the likelihood ratio test in the logistic model. Tests for trend were carried out by including continuous variables in the model. The calculations were performed with PROC GLM of SAS, version 8 (SAS Institute Inc., 1999).
6.2.4 Methods for Study V
After complete description of the study, written informed consent was obtained and subjects were randomly assigned to real or sham treatments. Concealment of the allocation was guaranteed by opening the closed randomization envelopes just be-fore the first stimulation of the first session.
At baseline, the groups receiving active repetitive transcranial magnetic stimu-lation (rTMS) and sham stimulation did not differ significantly by sex, inpatient status, or history of alcohol abuse. Their mean ages were 38.5 (SD=10.2) and 34.8 (SD=9.8) years, respectively. The mean duration of current hospitalization was 4.2 (SD=4.6) and 4.5 (SD=4.0) years, and total duration of illness was 13.5 (SD=8.9) and 12.9 (SD=12.0) years, respectively. The mean PANSS total value, indicating the severity of illness was 105.2 (SD=41.2) and 110.3 (SD=20.2), respectively. No statistically significant differences were present in any of the baseline values.
We allowed unlimited but stable concomitant drug therapy. Among the 11 pa-tients receiving rTMS, concomitant drug therapy mainly consisted of clozapine for seven patients (one combined with risperidone, and one with olanzapine), olanzap-ine for two, quetiapine for one, and zuclopentixol for one patient. The mean chlor-promazine equivalent dose was 1168 mg. In the rTMS group, four also received SSRIs, three mood stabilizers (valproate or oxcarbazine at therapeutical levels), and five benzodiazepines (mean lorazepam equivalent dose 4.6 mg).
Among the 11 patients receiving sham treatment, concomitant drug therapy consisted mainly of clozapine for seven patients and olanzapine for four patients. The mean chlorpromazine equivalent dose was 1309 mg. Four also received SSRIs, three mood stabilizers (valproate or oxcarbazine at therapeutical levels), and three benzodiazepines (mean lorazepam equivalent dose 4 mg). No statistically signifi-cant differences in concomitant antipsychotic or other drug treatments were present between the two groups. The doses of the drugs were stable throughout the trial.
43
Transcranial magnetic stimulation was administered by a 70-mm figure-eight-shaped coil (Magstim Co., UK) to the left dorsolateral prefrontal cortex (measured as 5 cm anterior to the optimal site for activating the right abductor pollicis brevis) with the following safety guidelines fulfilling characteristics: 10 Hz, 100% of mo-tor threshold, 20 trains of 5 seconds each, 30 seconds apart. The stimulation pa-rameters, taken from earlier depression studies, are suggested to have DLPFC-activating properties (e.g. Pasqual-Leone et al. 1996). The threshold was deter-mined at rest with surface electromyography by using the method of limits (i.e., the intensity required to evoke at least a 50 microvolt peak-to-peak potential in four of the eight trials over the optimal site). The coil was tangential to the scalp at 45° to the parasagittal line, with the handle pointing backwards in the actual rTMS condi-tion. In the sham condition, the coil was held at 90° to the scalp with both wings touching the scalp.
The SCL-90 was filled out by the patients at pre- and post-testing. Self-reports
are rarely used with psychotic patients, but we used the SCL-90 along with the PANSS to also obtain the patient’s subjective view on possible symptom change. We considered this supplementary subjective report especially important since rTMS is a novel treatment with largely unknown mechanisms of action. All sub-scales of the SCL-90 were analyzed along with the GSI, with special attention paid to the DEP and PSY scales. Reasons for this special interest were 1) for the DEP scale: previous knowledge on the effect of rTMS on depressive symptoms and 2) for the PSY scale: our sample was chronically psychotic and our treatment targeted these symptoms.
Psychiatrists blind to the treatment groups assessed symptoms at baseline and at
the end of two weeks of rTMS. The MMSE for rough cognitive functioning and the PANSS were assessed at both timepoints. Serum cortisol (Cors), thyroid-stimulating hormone (TSH), and prolactin (Prol) concentrations as well as motor threshold were measured at these timepoints. Rating scale scores and laboratory values for all patients were analyzed for change over the two-week treatment pe-riod. A paired sample two-tailed t-test was used to examine the significance of change within the groups. The size of any change in the rTMS and the sham groups was compared by an independent sample two-tailed t-test. Intention-to-treat analy-sis was used, and a 20% decrease in the patient’s total PANSS score was defined as our primary outcome measure.
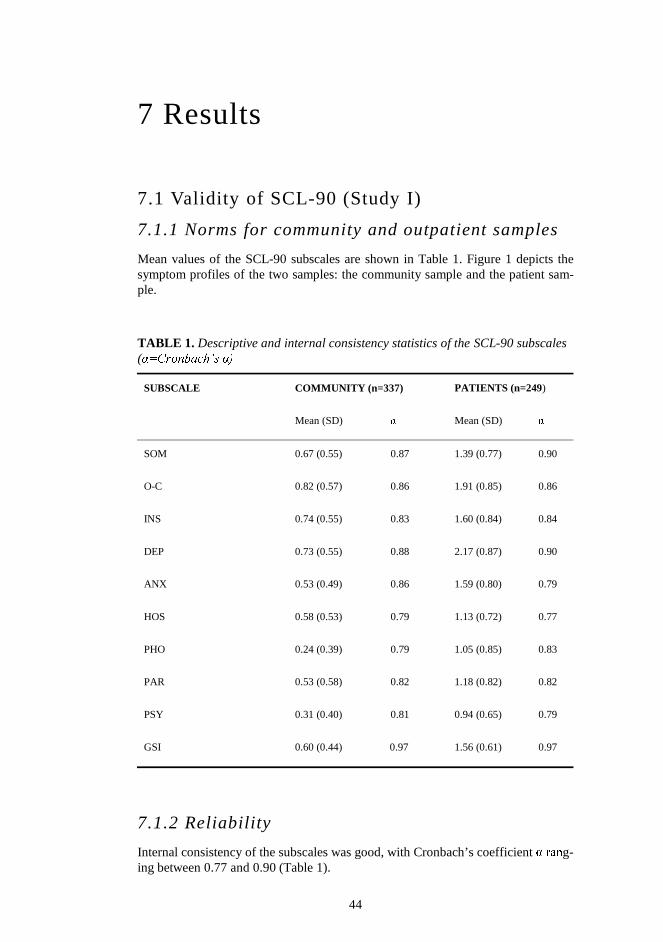
44
7 Results
7.1 Validity of SCL-90 (Study I)
7.1.1 Norms for community and outpatient samples
Mean values of the SCL-90 subscales are shown in Table 1. Figure 1 depicts the symptom profiles of the two samples: the community sample and the patient sam-ple.
TABLE 1. Descriptive and internal consistency statistics of the SCL-90 subscales (α=Cronbach’s α)
SUBSCALE COMMUNITY (n=337) PATIENTS (n=249)
Mean (SD) α Mean (SD) α
SOM 0.67 (0.55) 0.87 1.39 (0.77) 0.90
O-C 0.82 (0.57) 0.86 1.91 (0.85) 0.86
INS 0.74 (0.55) 0.83 1.60 (0.84) 0.84
DEP 0.73 (0.55) 0.88 2.17 (0.87) 0.90
ANX 0.53 (0.49) 0.86 1.59 (0.80) 0.79
HOS 0.58 (0.53) 0.79 1.13 (0.72) 0.77
PHO 0.24 (0.39) 0.79 1.05 (0.85) 0.83
PAR 0.53 (0.58) 0.82 1.18 (0.82) 0.82
PSY 0.31 (0.40) 0.81 0.94 (0.65) 0.79
GSI 0.60 (0.44) 0.97 1.56 (0.61) 0.97
7.1.2 Reliability
Internal consistency of the subscales was good, with Cronbach’s coefficient α rang-ing between 0.77 and 0.90 (Table 1).
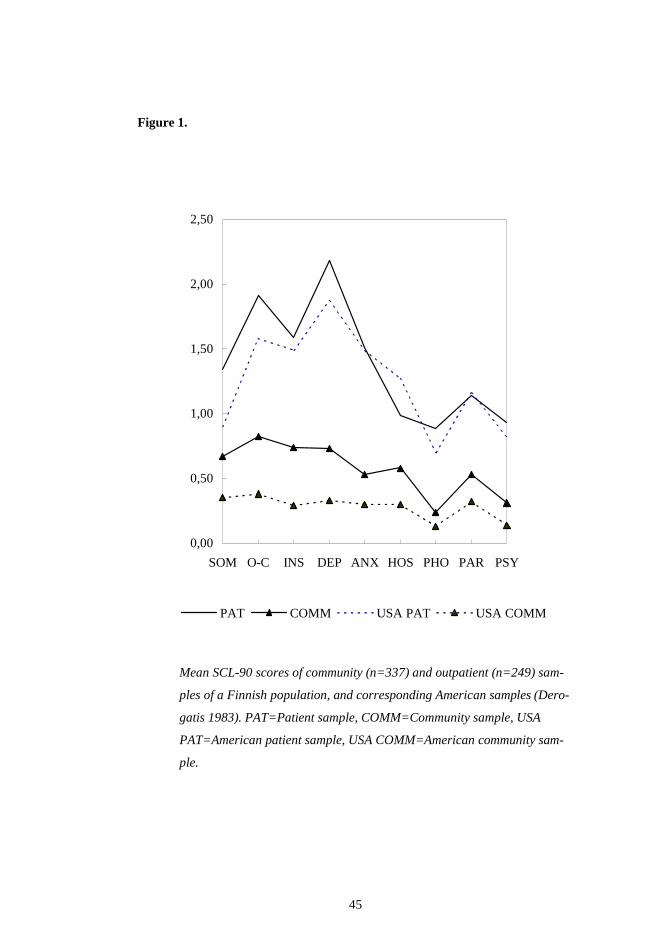
45
Figure 1.
������������������������������������������������������������������������������������������������������������������������������������������������������������������������������������������������������������������������������������������������������������������������������������������������������������������������������������������������������������������������������������������������������������������������������������������������������������������������������������������������������������������������������������������������������������������������������������������������������������������������������������������������������������������������������������������������������������������������������������������������������������������������������������������������������������������������������������������������������������������������������������������������������������������������������������������������������������������������������������������������������������������������������������������������������������������������������������������������������������������������������������������������������������������������������������������������������������������������������������������������������������������������������������������������������������������������������������������������������������������������������������������������������������������������������������������������������������������������������������������������������������������������������������������������������������������������������������������������������������������������������������������������������������������������������������������������������������������������������������������������������������������������������������������������������������������������������������������������������������������������������������������������������������������������������������������������������������������������������������������������������������������������������������������������������������������������������������������������������������������������������������������������������������������������������������������������������������������������������������������������������������������������������������������������������������������������������������������������������������������������������������������������������������������������������������������������������������������������������������������������������������������������������������������������������������������������������������������������������������������������������������������������������������������������������������������������������������������������������������������������������������������������������������������������������������������������������������������������������������������������������������������������������������������������������������������������������������������������������������������������������������������������������������������������������������������������������������������������������������������������
0,00
0,50
1,00
1,50
2,00
2,50
SOM O-C INS DEP ANX HOS PHO PAR PSY
PAT COMM USA PAT USA COMM
Mean SCL-90 scores of community (n=337) and outpatient (n=249) sam-
ples of a Finnish population, and corresponding American samples (Dero-
gatis 1983). PAT=Patient sample, COMM=Community sample, USA
PAT=American patient sample, USA COMM=American community sam-
ple.
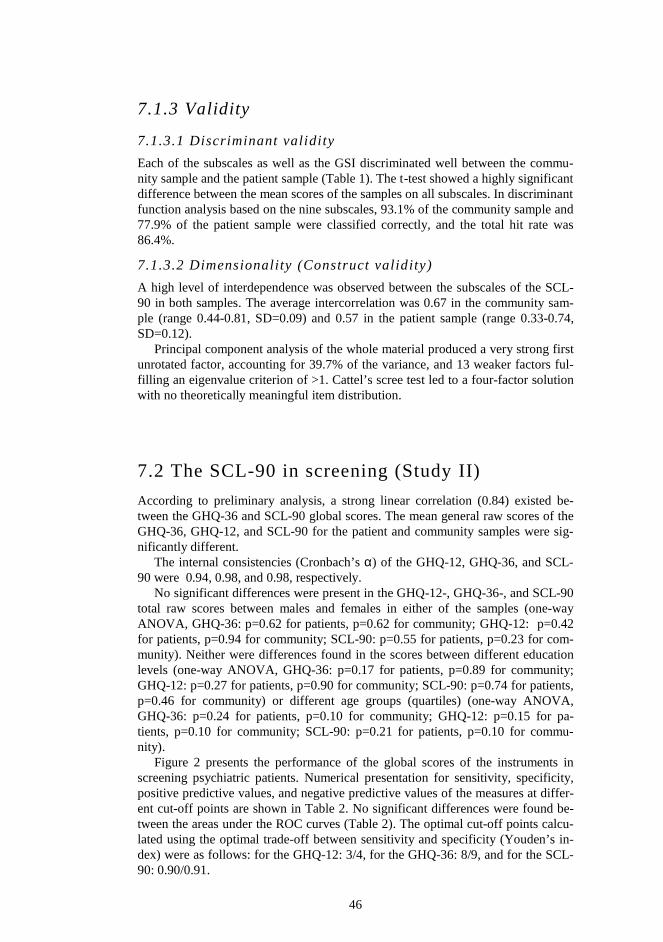
46
7.1.3 Validity
7.1.3.1 Discriminant validity
Each of the subscales as well as the GSI discriminated well between the commu-nity sample and the patient sample (Table 1). The t-test showed a highly significant difference between the mean scores of the samples on all subscales. In discriminant function analysis based on the nine subscales, 93.1% of the community sample and 77.9% of the patient sample were classified correctly, and the total hit rate was 86.4%.
7.1.3.2 Dimensionality (Construct validity)
A high level of interdependence was observed between the subscales of the SCL-90 in both samples. The average intercorrelation was 0.67 in the community sam-ple (range 0.44-0.81, SD=0.09) and 0.57 in the patient sample (range 0.33-0.74, SD=0.12).
Principal component analysis of the whole material produced a very strong first unrotated factor, accounting for 39.7% of the variance, and 13 weaker factors ful-filling an eigenvalue criterion of >1. Cattel’s scree test led to a four-factor solution with no theoretically meaningful item distribution.
7.2 The SCL-90 in screening (Study II)
According to preliminary analysis, a strong linear correlation (0.84) existed be-tween the GHQ-36 and SCL-90 global scores. The mean general raw scores of the GHQ-36, GHQ-12, and SCL-90 for the patient and community samples were sig-nificantly different.
The internal consistencies (Cronbach’s α) of the GHQ-12, GHQ-36, and SCL-90 were 0.94, 0.98, and 0.98, respectively.
No significant differences were present in the GHQ-12-, GHQ-36-, and SCL-90 total raw scores between males and females in either of the samples (one-way ANOVA, GHQ-36: p=0.62 for patients, p=0.62 for community; GHQ-12: p=0.42 for patients, p=0.94 for community; SCL-90: p=0.55 for patients, p=0.23 for com-munity). Neither were differences found in the scores between different education levels (one-way ANOVA, GHQ-36: p=0.17 for patients, p=0.89 for community; GHQ-12: p=0.27 for patients, p=0.90 for community; SCL-90: p=0.74 for patients, p=0.46 for community) or different age groups (quartiles) (one-way ANOVA, GHQ-36: p=0.24 for patients, p=0.10 for community; GHQ-12: p=0.15 for pa-tients, p=0.10 for community; SCL-90: p=0.21 for patients, p=0.10 for commu-nity).
Figure 2 presents the performance of the global scores of the instruments in screening psychiatric patients. Numerical presentation for sensitivity, specificity, positive predictive values, and negative predictive values of the measures at differ-ent cut-off points are shown in Table 2. No significant differences were found be-tween the areas under the ROC curves (Table 2). The optimal cut-off points calcu-lated using the optimal trade-off between sensitivity and specificity (Youden’s in-dex) were as follows: for the GHQ-12: 3/4, for the GHQ-36: 8/9, and for the SCL-90: 0.90/0.91.
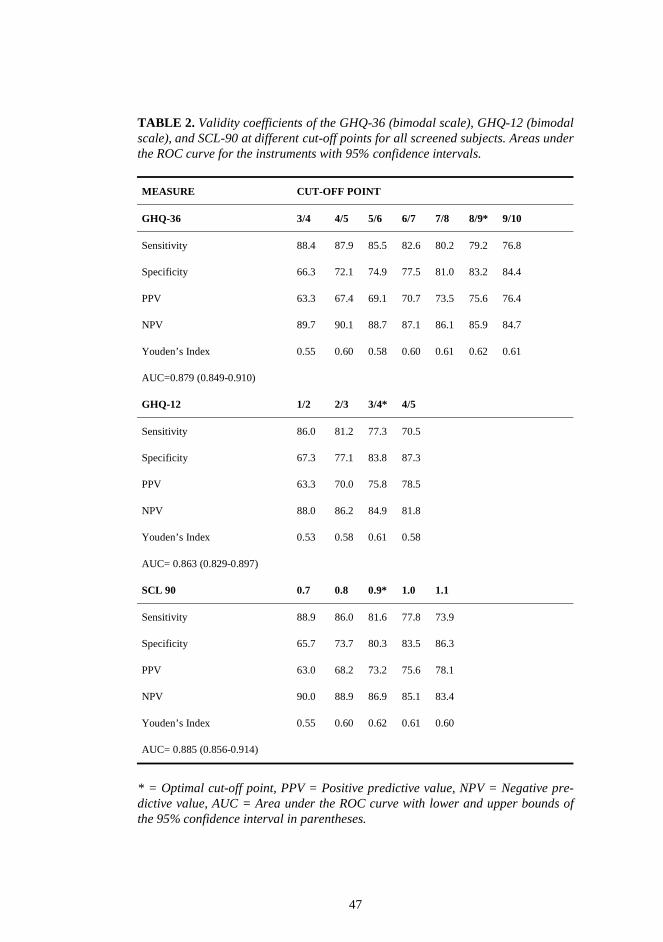
47
TABLE 2. Validity coefficients of the GHQ-36 (bimodal scale), GHQ-12 (bimodal scale), and SCL-90 at different cut-off points for all screened subjects. Areas under the ROC curve for the instruments with 95% confidence intervals.
MEASURE CUT-OFF POINT
GHQ-36 3/4 4/5 5/6 6/7 7/8 8/9* 9/10
Sensitivity 88.4 87.9 85.5 82.6 80.2 79.2 76.8
Specificity 66.3 72.1 74.9 77.5 81.0 83.2 84.4
PPV 63.3 67.4 69.1 70.7 73.5 75.6 76.4
NPV 89.7 90.1 88.7 87.1 86.1 85.9 84.7
Youden’s Index 0.55 0.60 0.58 0.60 0.61 0.62 0.61
AUC=0.879 (0.849-0.910)
GHQ-12 1/2 2/3 3/4* 4/5
Sensitivity 86.0 81.2 77.3 70.5
Specificity 67.3 77.1 83.8 87.3
PPV 63.3 70.0 75.8 78.5
NPV 88.0 86.2 84.9 81.8
Youden’s Index 0.53 0.58 0.61 0.58
AUC= 0.863 (0.829-0.897)
SCL 90 0.7 0.8 0.9* 1.0 1.1
Sensitivity 88.9 86.0 81.6 77.8 73.9
Specificity 65.7 73.7 80.3 83.5 86.3
PPV 63.0 68.2 73.2 75.6 78.1
NPV 90.0 88.9 86.9 85.1 83.4
Youden’s Index 0.55 0.60 0.62 0.61 0.60
AUC= 0.885 (0.856-0.914)
* = Optimal cut-off point, PPV = Positive predictive value, NPV = Negative pre-dictive value, AUC = Area under the ROC curve with lower and upper bounds of the 95% confidence interval in parentheses.
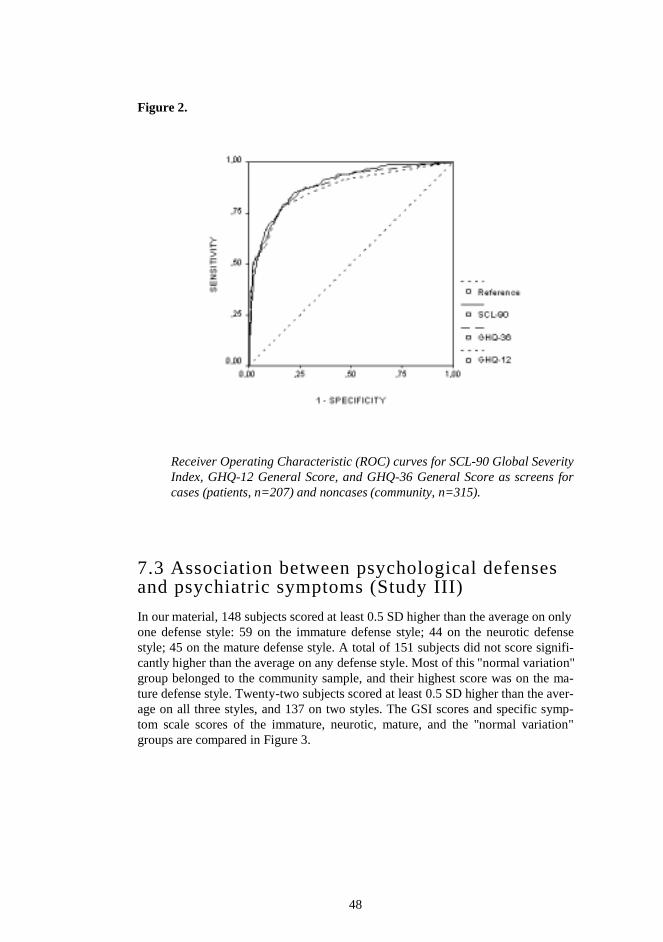
48
Figure 2.
Receiver Operating Characteristic (ROC) curves for SCL-90 Global Severity Index, GHQ-12 General Score, and GHQ-36 General Score as screens for cases (patients, n=207) and noncases (community, n=315).
7.3 Association between psychological defenses and psychiatric symptoms (Study III)
In our material, 148 subjects scored at least 0.5 SD higher than the average on only one defense style: 59 on the immature defense style; 44 on the neurotic defense style; 45 on the mature defense style. A total of 151 subjects did not score signifi-cantly higher than the average on any defense style. Most of this "normal variation" group belonged to the community sample, and their highest score was on the ma-ture defense style. Twenty-two subjects scored at least 0.5 SD higher than the aver-age on all three styles, and 137 on two styles. The GSI scores and specific symp-tom scale scores of the immature, neurotic, mature, and the "normal variation" groups are compared in Figure 3.
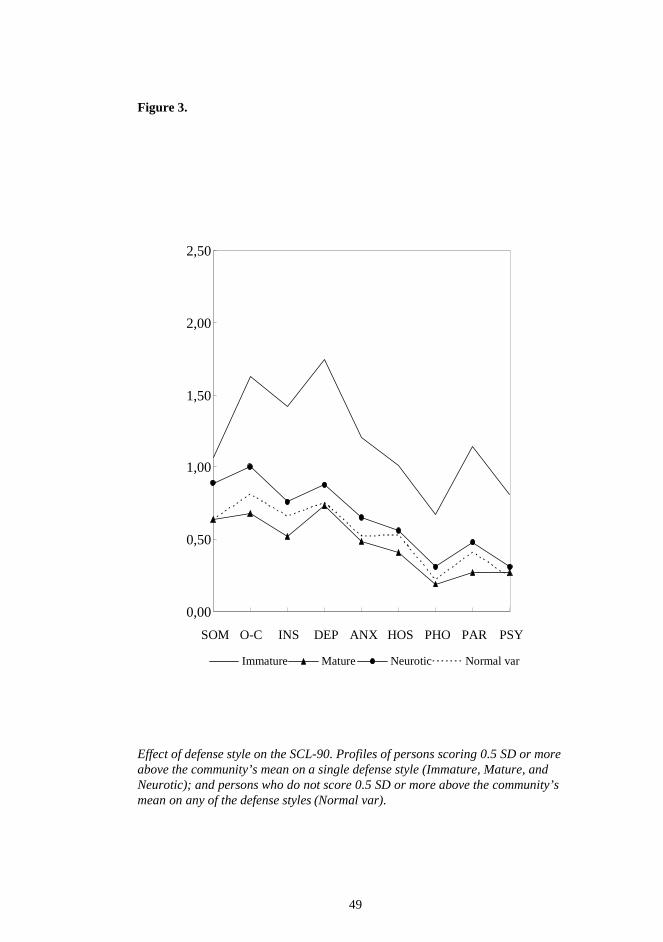
49
Figure 3. Effect of defense style on the SCL-90. Profiles of persons scoring 0.5 SD or more above the community’s mean on a single defense style (Immature, Mature, and Neurotic); and persons who do not score 0.5 SD or more above the community’s mean on any of the defense styles (Normal var).
0,00
0,50
1,00
1,50
2,00
2,50
SOM O-C INS DEP ANX HOS PHO PAR PSY
Immature Mature Neurotic Normal var
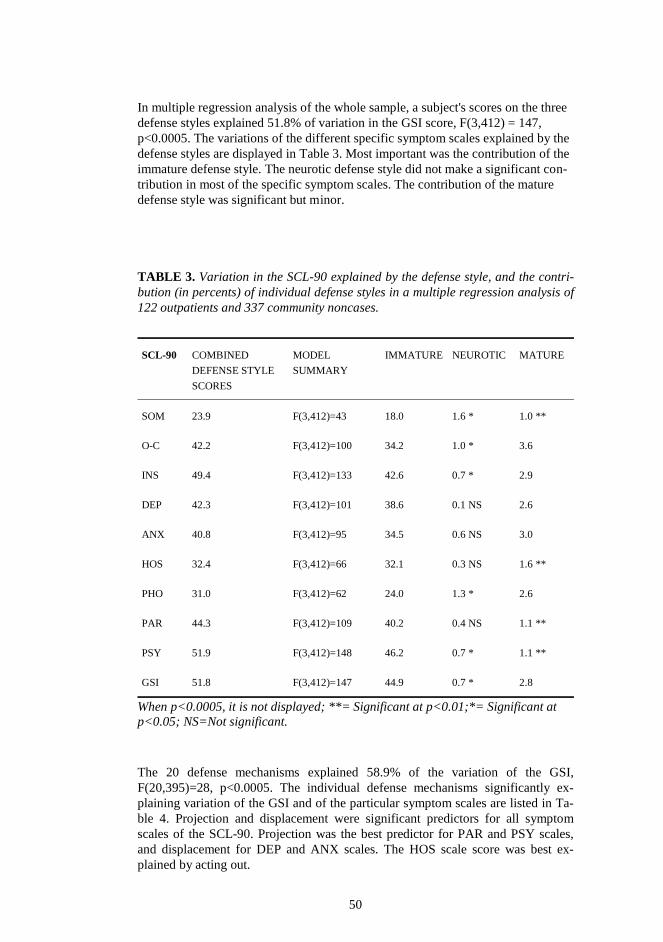
50
In multiple regression analysis of the whole sample, a subject's scores on the three defense styles explained 51.8% of variation in the GSI score, F(3,412) = 147, p<0.0005. The variations of the different specific symptom scales explained by the defense styles are displayed in Table 3. Most important was the contribution of the immature defense style. The neurotic defense style did not make a significant con-tribution in most of the specific symptom scales. The contribution of the mature defense style was significant but minor. TABLE 3. Variation in the SCL-90 explained by the defense style, and the contri-bution (in percents) of individual defense styles in a multiple regression analysis of 122 outpatients and 337 community noncases.
SCL-90 COMBINED
DEFENSE STYLE
SCORES
MODEL
SUMMARY
IMMATURE NEUROTIC MATURE
SOM 23.9 F(3,412)=43 18.0 1.6 * 1.0 **
O-C 42.2 F(3,412)=100 34.2 1.0 * 3.6
INS 49.4 F(3,412)=133 42.6 0.7 * 2.9
DEP 42.3 F(3,412)=101 38.6 0.1 NS 2.6
ANX 40.8 F(3,412)=95 34.5 0.6 NS 3.0
HOS 32.4 F(3,412)=66 32.1 0.3 NS 1.6 **
PHO 31.0 F(3,412)=62 24.0 1.3 * 2.6
PAR 44.3 F(3,412)=109 40.2 0.4 NS 1.1 **
PSY 51.9 F(3,412)=148 46.2 0.7 * 1.1 **
GSI 51.8 F(3,412)=147 44.9 0.7 * 2.8
When p<0.0005, it is not displayed; **= Significant at p<0.01;*= Significant at p<0.05; NS=Not significant. The 20 defense mechanisms explained 58.9% of the variation of the GSI, F(20,395)=28, p<0.0005. The individual defense mechanisms significantly ex-plaining variation of the GSI and of the particular symptom scales are listed in Ta-ble 4. Projection and displacement were significant predictors for all symptom scales of the SCL-90. Projection was the best predictor for PAR and PSY scales, and displacement for DEP and ANX scales. The HOS scale score was best ex-plained by acting out.
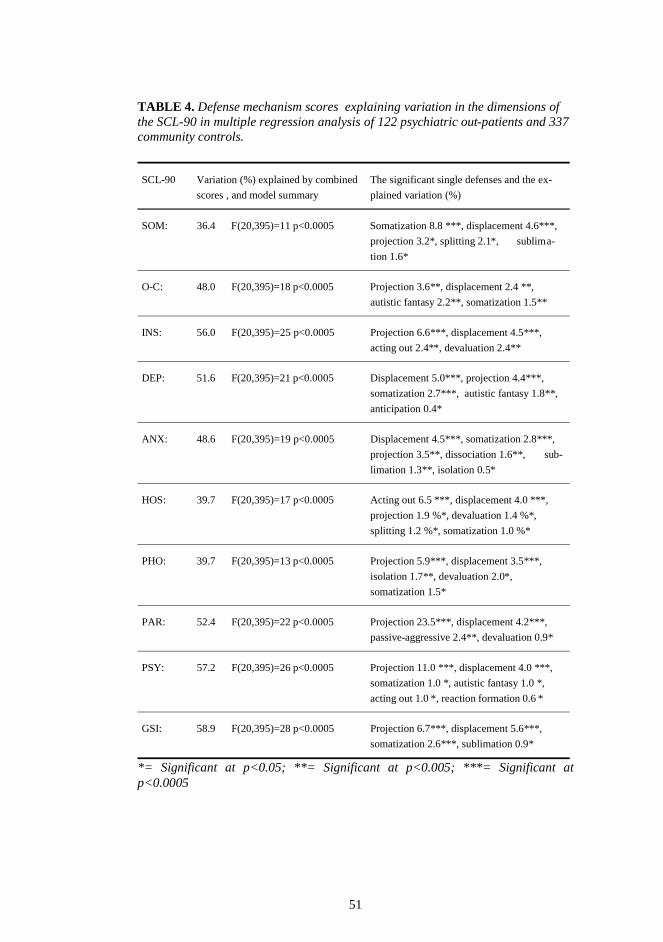
51
TABLE 4. Defense mechanism scores explaining variation in the dimensions of the SCL-90 in multiple regression analysis of 122 psychiatric out-patients and 337 community controls.
SCL-90 Variation (%) explained by combined
scores , and model summary
The significant single defenses and the ex-
plained variation (%)
SOM: 36.4 F(20,395)=11 p<0.0005 Somatization 8.8 ***, displacement 4.6***,
projection 3.2*, splitting 2.1*, sublima-
tion 1.6*
O-C: 48.0 F(20,395)=18 p<0.0005 Projection 3.6**, displacement 2.4 **,
autistic fantasy 2.2**, somatization 1.5**
INS: 56.0 F(20,395)=25 p<0.0005 Projection 6.6***, displacement 4.5***,
acting out 2.4**, devaluation 2.4**
DEP: 51.6 F(20,395)=21 p<0.0005 Displacement 5.0***, projection 4.4***,
somatization 2.7***, autistic fantasy 1.8**,
anticipation 0.4*
ANX: 48.6 F(20,395)=19 p<0.0005 Displacement 4.5***, somatization 2.8***,
projection 3.5**, dissociation 1.6**, sub-
limation 1.3**, isolation 0.5*
HOS: 39.7 F(20,395)=17 p<0.0005 Acting out 6.5 ***, displacement 4.0 ***,
projection 1.9 %*, devaluation 1.4 %*,
splitting 1.2 %*, somatization 1.0 %*
PHO: 39.7 F(20,395)=13 p<0.0005 Projection 5.9***, displacement 3.5***,
isolation 1.7**, devaluation 2.0*,
somatization 1.5*
PAR: 52.4 F(20,395)=22 p<0.0005 Projection 23.5***, displacement 4.2***,
passive-aggressive 2.4**, devaluation 0.9*
PSY: 57.2 F(20,395)=26 p<0.0005 Projection 11.0 ***, displacement 4.0 ***,
somatization 1.0 *, autistic fantasy 1.0 *,
acting out 1.0 *, reaction formation 0.6 *
GSI: 58.9 F(20,395)=28 p<0.0005 Projection 6.7***, displacement 5.6***,
somatization 2.6***, sublimation 0.9*
*= Significant at p<0.05; **= Significant at p<0.005; ***= Significant at p<0.0005

52
In a regression analysis of the community sample alone, the three defense styles explained 32.4% of the variation in the GSI score, F(3,303)= 49.9, p<0.0005. In the patient sample alone, these three defense styles explained 61.6% of the variation in the GSI score, F(3,105)= 58.7, p<0.0005.
In the community sample, the 20 defense mechanisms explained 40.5% of the variation in the GSI score, F (20,286)= 11.4, p<0.0005, and in the patient sample 64.8%, F(20,88)= 10.9, p<0.0005.
There were 35 subjects in the community sample and 34 in the patient sample
with GSI scores between one and two SDs above the mean of the community sam-ple. No significant differences were present in the defense styles between the two groups in the t-test. Four defense mechanisms differed significantly between the groups. Altruism and idealization scores of the 35 subjects from the community sample were significantly higher than the respective scores of the 34 patients (p<0.05). The 34 patients scored significantly higher (p<0.05) on devaluation and splitting than did the 35 community subjects.
7.4 SCL-90 as an outcome measure: 1. Psycho-therapy trial (Study IV)
The mean GSI score at the baseline was 1.50 and the mean DEP and ANX scores were 2.43 and 1.46, respectively (Table 5). Reduction in symptom severity (GSI) was found in 74.7% of the sample. Mean reduction in the GSI score, which was 14.7%, was statistically significant (p<0.001) (Table 5). Similar reduction was found in patients with either depression (16.8%) or anxiety disorder (17.4%), whereas it was considerably lower in comorbid patients (9.9%). A clinical response (reduction of 50% or more in the GSI) was found in 7.2% of the subjects. The cor-responding value in the three diagnostic groups were 8.7%, 7.7% and 3.9%.
Of the sociodemographic variables studied, only education was significantly as-sociated with the reduction in GSI (Table 6). The reduction in patients with an aca-demic degree was more considerable and the odds ratio for recovery was 2.34 (CI = 1.04-5.26, P value for heterogeneity = 0.04). Diagnosis, queuing time or earlier therapy were not significantly associated with the GSI reduction. Although the mean GSI reduction was statistically significantly higher at higher baseline GSI levels, the clinical response was significantly inversely associated with baseline GSI level. The odds ratio between the highest and lowest quartiles of GSI was 0.28 (CI = 0.07-1.08, P value for trend = 0.04). The strength of association between baseline GSI and clinical response was reduced after including education, Axis I and Axis II diagnoses and queuing time in the same model. The odds ratio was 0.35 (CI = 0.09-1.41, P for trend = 0.14).
Although no association was found between reduction of the SCL-90 scores and queuing time as a continuous variable, a more detailed investigation with dichoto-mized queuing time showed a stronger reduction in all three SCL-90 scores for queuing times over 2 months (Table 7).
Among patients with depressive disorder the mean reduction in DEP score was 0.44, which is 17.9% (p<0.001). A higher baseline DEP score level was associated with more improvement in these patients; the mean DEP score reductions at base-
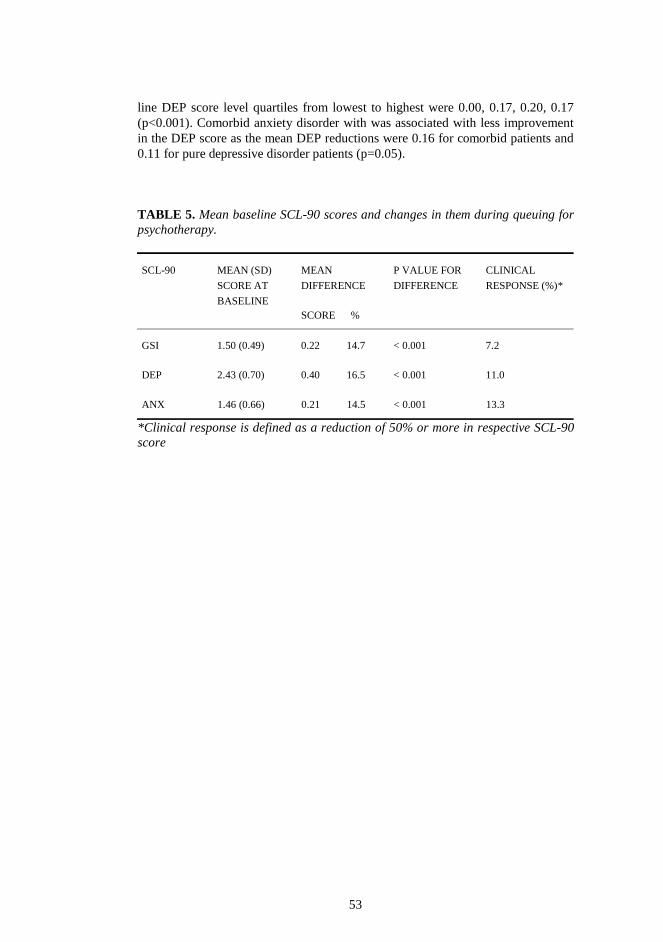
53
line DEP score level quartiles from lowest to highest were 0.00, 0.17, 0.20, 0.17 (p<0.001). Comorbid anxiety disorder with was associated with less improvement in the DEP score as the mean DEP reductions were 0.16 for comorbid patients and 0.11 for pure depressive disorder patients (p=0.05).
TABLE 5. Mean baseline SCL-90 scores and changes in them during queuing for psychotherapy.
SCL-90 MEAN (SD)
SCORE AT
BASELINE
MEAN
DIFFERENCE
SCORE %
P VALUE FOR
DIFFERENCE
CLINICAL
RESPONSE (%)*
GSI 1.50 (0.49) 0.22 14.7 < 0.001 7.2
DEP 2.43 (0.70) 0.40 16.5 < 0.001 11.0
ANX 1.46 (0.66) 0.21 14.5 < 0.001 13.3
*Clinical response is defined as a reduction of 50% or more in respective SCL-90 score
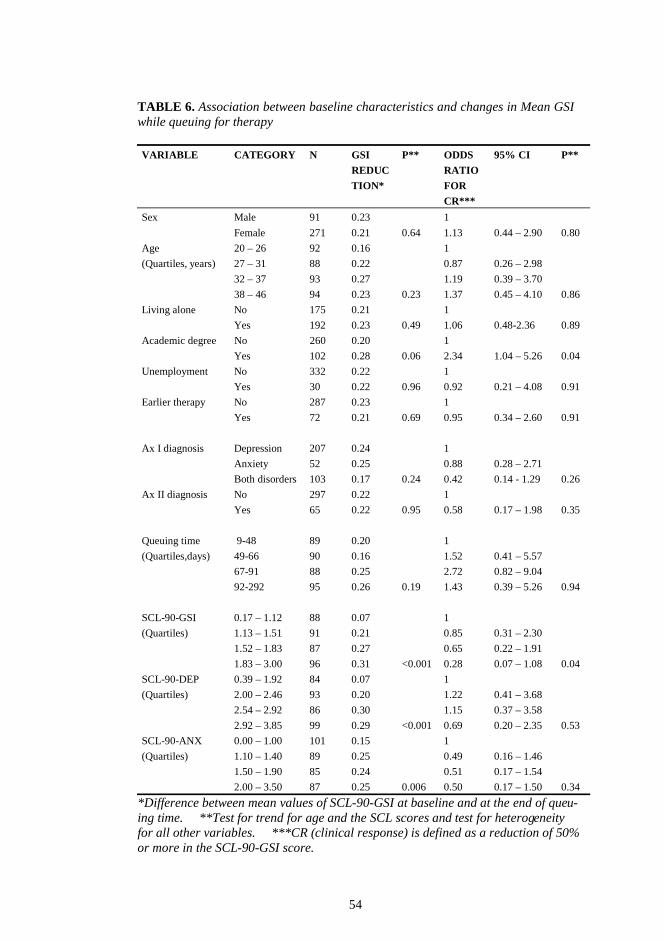
54
TABLE 6. Association between baseline characteristics and changes in Mean GSI while queuing for therapy VARIABLE CATEGORY N GSI
REDUC
TION*
P** ODDS
RATIO
FOR
CR***
95% CI P**
Sex Male 91 0.23 1
Female 271 0.21 0.64 1.13 0.44 – 2.90 0.80
Age 20 – 26 92 0.16 1
(Quartiles, years) 27 – 31 88 0.22 0.87 0.26 – 2.98
32 – 37 93 0.27 1.19 0.39 – 3.70
38 – 46 94 0.23 0.23 1.37 0.45 – 4.10 0.86
Living alone No 175 0.21 1
Yes 192 0.23 0.49 1.06 0.48-2.36 0.89
Academic degree No 260 0.20 1
Yes 102 0.28 0.06 2.34 1.04 – 5.26 0.04
Unemployment No 332 0.22 1
Yes 30 0.22 0.96 0.92 0.21 – 4.08 0.91
Earlier therapy No 287 0.23 1
Yes 72 0.21 0.69 0.95 0.34 – 2.60 0.91
Ax I diagnosis Depression 207 0.24 1
Anxiety 52 0.25 0.88 0.28 – 2.71
Both disorders 103 0.17 0.24 0.42 0.14 - 1.29 0.26
Ax II diagnosis No 297 0.22 1
Yes 65 0.22 0.95 0.58 0.17 – 1.98 0.35
Queuing time 9-48 89 0.20 1
(Quartiles,days) 49-66 90 0.16 1.52 0.41 – 5.57
67-91 88 0.25 2.72 0.82 – 9.04
92-292 95 0.26 0.19 1.43 0.39 – 5.26 0.94
SCL-90-GSI 0.17 – 1.12 88 0.07 1
(Quartiles) 1.13 – 1.51 91 0.21 0.85 0.31 – 2.30
1.52 – 1.83 87 0.27 0.65 0.22 – 1.91
1.83 – 3.00 96 0.31 <0.001 0.28 0.07 – 1.08 0.04
SCL-90-DEP 0.39 – 1.92 84 0.07 1
(Quartiles) 2.00 – 2.46 93 0.20 1.22 0.41 – 3.68
2.54 – 2.92 86 0.30 1.15 0.37 – 3.58
2.92 – 3.85 99 0.29 <0.001 0.69 0.20 – 2.35 0.53
SCL-90-ANX 0.00 – 1.00 101 0.15 1
(Quartiles) 1.10 – 1.40 89 0.25 0.49 0.16 – 1.46
1.50 – 1.90 85 0.24 0.51 0.17 – 1.54
2.00 – 3.50 87 0.25 0.006 0.50 0.17 – 1.50 0.34
*Difference between mean values of SCL-90-GSI at baseline and at the end of queu-ing time. **Test for trend for age and the SCL scores and test for heterogeneity for all other variables. ***CR (clinical response) is defined as a reduction of 50% or more in the SCL-90-GSI score.
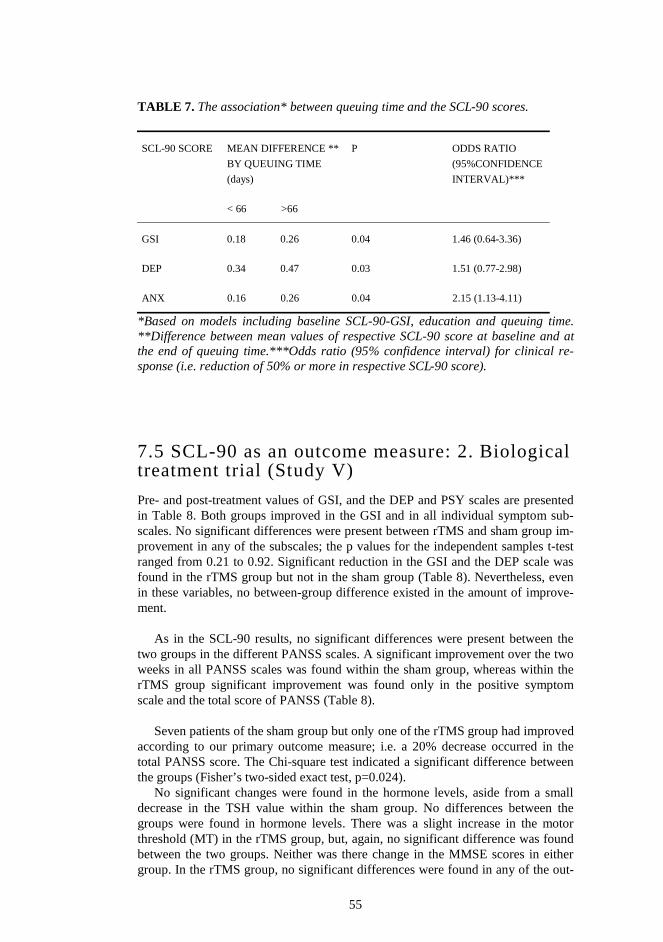
55
TABLE 7. The association* between queuing time and the SCL-90 scores.
SCL-90 SCORE MEAN DIFFERENCE **
BY QUEUING TIME
(days)
< 66 >66
P
ODDS RATIO
(95%CONFIDENCE
INTERVAL)***
GSI 0.18 0.26 0.04 1.46 (0.64-3.36)
DEP 0.34 0.47 0.03 1.51 (0.77-2.98)
ANX 0.16 0.26 0.04 2.15 (1.13-4.11)
*Based on models including baseline SCL-90-GSI, education and queuing time. **Difference between mean values of respective SCL-90 score at baseline and at the end of queuing time.***Odds ratio (95% confidence interval) for clinical re-sponse (i.e. reduction of 50% or more in respective SCL-90 score).
7.5 SCL-90 as an outcome measure: 2. Biological treatment trial (Study V)
Pre- and post-treatment values of GSI, and the DEP and PSY scales are presented in Table 8. Both groups improved in the GSI and in all individual symptom sub-scales. No significant differences were present between rTMS and sham group im-provement in any of the subscales; the p values for the independent samples t-test ranged from 0.21 to 0.92. Significant reduction in the GSI and the DEP scale was found in the rTMS group but not in the sham group (Table 8). Nevertheless, even in these variables, no between-group difference existed in the amount of improve-ment.
As in the SCL-90 results, no significant differences were present between the two groups in the different PANSS scales. A significant improvement over the two weeks in all PANSS scales was found within the sham group, whereas within the rTMS group significant improvement was found only in the positive symptom scale and the total score of PANSS (Table 8).
Seven patients of the sham group but only one of the rTMS group had improved
according to our primary outcome measure; i.e. a 20% decrease occurred in the total PANSS score. The Chi-square test indicated a significant difference between the groups (Fisher’s two-sided exact test, p=0.024).
No significant changes were found in the hormone levels, aside from a small decrease in the TSH value within the sham group. No differences between the groups were found in hormone levels. There was a slight increase in the motor threshold (MT) in the rTMS group, but, again, no significant difference was found between the two groups. Neither was there change in the MMSE scores in either group. In the rTMS group, no significant differences were found in any of the out-

56
come measures between those who were on anticonvulsant drugs and those who were not. No differences were found in the outcome measures between those using benzodiazepines and those not, apart from the PANSS general symptoms scale, where those using benzodiazepines improved significantly better (two-tailed inde-pendent samples t-test, p=0.036) than nonusers. One patient in both groups dropped out due to paranoid thoughts about the treatment. The sham group dropout had received five days of treatment and could be rated at the end of the two-week period, whereas the rTMS dropout left the trial during the first session and refused further ratings. No seizures or other side-effects, besides a mild headache in three patients of the rTMS group, occurred during the trial. Most of the patients in the rTMS group (8/11) but none in the sham group considered the stimulation painful.

Table 8. E
ffect of 2 weeks of real or sham
left DL
PF
C high-frequency rT
MS in schizophrenia, and the statistical significance of change w
ithin and betw
een groups.
TM
S
change within group*
SHA
M
change w
ithin group*
CO
MP
AR
ISON
**
ME
ASU
RE
SC
OR
E
ME
AN
(SD
)
ME
AN
(SD
)
PA
NN
S positive
Pre
23.6 (10.7)
27.0
(5.6)
P
ost 20.0
(9.1)
19.1 (7.4)
C
hange -3.6
(4.7) 2.40
9 0.040
-7.9 (7.1)
3.68 10
0.004
-1.61 19
0.123
PA
NN
S negative
Pre
28.9 (11.5)
31.0
(7.7
P
ost 27.5
(10.9)
25.2 (5.8)
C
hange -1.4
(3.4) 1.30
9 0.226
-5.8 (7.1)
2.71 10
0.022
-1.79 19
0.090
PA
NN
S general
Pre
52.1 (23.4)
52.3
(10.9)
P
ost 48.0
(17.8)
44.6 (12.6)
C
hange -4.1
(7.7) 1.68
9 0.127
-7.6 (8.9)
2.8 10
0.018
-0.97 19
0.346
PA
NN
S T
OT
AL
P
re 105.2
(41.2)
110.3 (20.2)
P
ost 92.3
(34.3)
85.6 (23.9)
C
hange -12.3
(13.9) 2.86
9 0.019
-24.6 (20.2)
4.04 10
0.002
-1.62 19
0.121
SC
L-90: G
SI
Pre
0.99 (0.57)
1.06
(1.04)
P
ost 0.73
(0.56)
0.78 (0.86)
C
hange -0.26
(0.34) 2.43
9 0.038
-0.28 (0.53)
1.76 10
0.110
-0.08 19
0.936
SC
L-90: D
EP
P
re 1.34
(0.77)
1.37 (1.25)
P
ost 0.83
(0.69)
0.82 (0.79)
C
hange -0.46
(0.54) 2.87
9 0.019
-0.34 (0.52)
2.16 10
0.056
0.56 19
0.580
SC
L-90: P
SY
P
re 0.83
(0.75)
0.94 (1.14)
P
ost 0.50
(0.60)
0.51 (0.53)
C
hange -0.26
(0.47) 1.80
9 0.090
-0.21 (0.78)
0.89 10
0.397
0.18 19
0.860
PA
NSS- positive and negative sym
ptoms scale; P
re- pretreatment value; P
ost- posttreatment value; SC
L-90- sym
ptom checklist 90, M
T-
motor threshold. *- paired sam
ples two-tailed t-test; **- independent sam
ples two-tailed t-test.
57
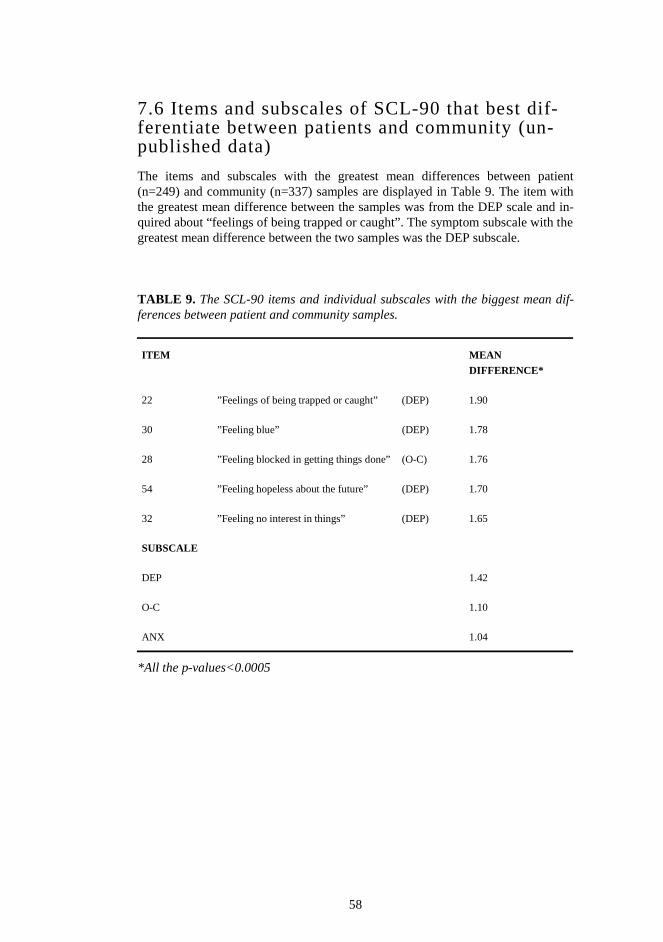
58
7.6 Items and subscales of SCL-90 that best dif-ferentiate between patients and community (un-published data)
The items and subscales with the greatest mean differences between patient (n=249) and community (n=337) samples are displayed in Table 9. The item with the greatest mean difference between the samples was from the DEP scale and in-quired about “feelings of being trapped or caught”. The symptom subscale with the greatest mean difference between the two samples was the DEP subscale. TABLE 9. The SCL-90 items and individual subscales with the biggest mean dif-ferences between patient and community samples.
ITEM MEAN
DIFFERENCE*
22 ”Feelings of being trapped or caught” (DEP) 1.90
30 ”Feeling blue” (DEP) 1.78
28 ”Feeling blocked in getting things done” (O-C) 1.76
54 ”Feeling hopeless about the future” (DEP) 1.70
32 ”Feeling no interest in things” (DEP) 1.65
SUBSCALE
DEP 1.42
O-C 1.10
ANX 1.04
*All the p-values<0.0005
59
8 Discussion
8.1 Utility of SCL-90
The first two studies were methodological psychometric studies on the utility of the Finnish version of the SCL-90 in a Finnish population. Study I evaluated the in-strument’s reliability and validity, and Study II its ability to screen psychiatric pa-tients from community controls. The results were consistent with previous re-search.
8.1.1 Reliability and validity
The Finnish version of the SCL-90 was found to be quite acceptable, as it was reli-able and capable of discriminating between patients and community controls. In addition, the average profiles of both samples resembled profiles of American samples (Derogatis 1983). Our results do not support the dimensionality of the SCL-90 in the sense that the nine subscales would represent separate symptom di-mensions. As in several previous studies on the questionnaire, the average intercor-relation between the original nine subscales was high (Clark & Friedman 1983, Hofmann & Overal 1978). The strong interdependence of the original subscales and the principal component analysis yielding a very strong first unrotated factor and several weak ones in both samples suggest that a general factor may be pre-sent. Thus, the instrument seems to measure a single global distress factor rather than nine independent symptom scales, rendering its construct validity as a multi-dimensional instrument inadequate.
8.1.2 Utility in screening
The GSI value of the SCL-90 performed comparably with the GHQ-36 and GHQ-12 total values in screening psychiatric patients.
Study II was the first study on the screening performance of the SCL-90, GHQ-36, and GHQ-12 in a Finnish population. The utility of the three scales for screen-ing mental illness was good. The values reported here are better than those reported in a recent Finnish methodological study on the screening performance of the HSCL-25 (Veijola et al. in press). In that study, the sensitivity was 0.48 and the specificity was 0.87 for all psychiatric disorders. The similar shape of the ROC curves here suggests good concurrent validity for the total scores of the three measures. The sensitivity and specificity levels of the optimal cut-off points were good in the three scales. The screening properties of the three scales, measured by the area under the ROC curve, were close to the international mean of 0.88 re-ported for the GHQ-12 across 15 centers around the world (Goldberg et al. 1997).
AS far as the author is aware, the SCL-90 has not yet been used as a screening instrument in Finland, and thus the cut-off points published here could be useful for future clinical work and epidemiological studies.
60
8.1.3 Potential for measuring change
The mean GSI values of the patient and the community sample were sufficiently different for measuring change, as the figure for the patient sample was 2.5 times higher than that of the community sample in Study I. This difference should be adequate for detection of clinically significant change in treatment trials, which is determined by effect sizes (ES). ES is defined as the mean change found in a vari-able divided by the standard deviation of that variable (Kazis et al. 1989). ESs are used, for example, to translate "the before and after changes" in a sample into a standard unit of measurement that provides a clearer understanding of the clinical significance of results. The high internal consistency of the SCL-90 itself increases the ES, which in turn leads to greater power for a trial without the need to increase sample size (Leon et al. 1995).
In Study I, ES for GSI is 1.4 according to the following formula: Mean GSI (patients) – Mean GSI (community) / SD (pooled)
In study IV, ES for GSI reduction is 0.45 according to the following formula: Mean GSI (before) – Mean GSI (after) / SD The sensitivity of the SCL-90 to symptom change is discussed in greater detail
in section 8.3.3 .
8.1.4 Optimal items and subscales for differentia-tion
The subscale with the greatest difference between patient and community samples was depression, which is not surprising as the majority of the subjects in the outpa-tient sample suffered from depression. Most of the items that differentiated effec-tively belonged to this subscale. The single item that best differentiated between the two samples was the description of feeling trapped or caught, which likely por-trays the situation of mental patients when they finally decide to seek help.
8.2 Association between symptoms and defenses
The SCL-90 was used here as an indicator of psychiatric symptom status at a se-lected time point with the aim of determining whether particular personality char-acteristics (defense styles) are connected with typical symptom clusters.
Connection between defense style and symptoms:
The variation in psychiatric symptoms (SCL-90) could be largely explained by subjects’ defense styles (DSQ). The main finding was that immaturity of defense style is a powerful predictor of general symptomatic distress (GSI). This result is
61
consistent with most previous studies (Bond et al. 1983, Andrews et al. 1989, Spinhoven & Kooiman 1997). In Andrews et al. study (1989), correlations among defense style and GSI ranged from 0.41 (immature) to 0.33 (neurotic) and further to –0.24 (mature).
Regression analysis revealed that defense style was a good predictor of the variation in the general symptomatology (GSI) as well as in the particular symptom dimensions. The particular defense style that explained most of the variance in all SCL-90 symptom dimensions was immature style. In most of the dimensions, the contribution of the mature defense style was minor and that of the neurotic defense style was insignificant. Of the SCL-90 symptom scales, the PSY and the PAR scales were best (46.2% and 40.2%, respectively), as the PHO and the SOM scales least (24% and 18%, respectively) explained by the immature defense style.
Connection between particular defenses and symptoms: This study found little evidence for specific associations between particular de-
fenses and symptoms, with the exception of projection, which was closely associ-ated with paranoid ideation (PAR scale). The defenses that best predicted symptom level were projection and displacement irrespective of the predominant symptom. Hostility (HOS scale) was the only symptom dimension that showed a different pattern, with acting out being the most powerful predictor. The items comprising projection reflect a general attitude of perceiving oneself as a victim. Items such as “I'm always treated unfairly”, “Everyone is against me” and “I cannot be blamed for what I do wrong” may be interpreted to reflect an attempt to explain one's trou-bles without unendurable guilt and loss of self-esteem by shifting the locus of con-trol from oneself to others. A high score on displacement indicates that the person eases his anxiety by eating, drinking, using drugs and alcohol, and seeks solace in daydreams. Spinhoven & Kooiman (1997) suggested that dysthymic patients use more projection, somatization, isolation, and devaluation than controls. In our study, depressive symptoms were related likewise to projection, and somatization, but also to displacement. Spinhoven & Kooiman found that displacement and somatization best explained anxiety (the ANX scale), a result supported by this thesis.
8.3 SCL-90 as an outcome measure
In Studies IV and V, the SCL-90 was used successfully as an outcome measure to assess the change that occurs between two time points: in Study IV as a result of waiting for psychotherapy and in Study V as a result of biological treatment.
8.3.1 Change in symptom distress during queuing to psychological treatment
In Study IV, subjects waiting for psychotherapy were the focus of interest. The study examined the change in symptoms and the factors affecting the change. To the authors’ knowledge, this was the first empirical study to target the change in
62
symptoms while queuing to psychotherapy. In earlier studies assessing change in symptoms while waiting for therapy, the subjects were merely used as a control group and were not the focus of interest. The number of subjects in the present study was larger than in an earlier meta-analysis on a similar topic (Posternak & Miller 2001). Symptom reduction during waiting A significant improvement in psychiatric symptoms during queuing to psychother-apy was found. The size of the improvement in the SCL-90-GSI score was 15% and in the SCL-90-DEP and SCL-90-ANX scores, 17% and 15%, respectively. In patients suffering from depression in the present study, the SCL-90-DEP score im-proved 18% and was thus higher than the 10-15% improvement obtained in a meta-analysis on 19 waiting-list studies among depressed patients (Posternak & Miller, 2001). Since no SCL-90 generally accepted cut-off for recovery exists we defined a 50% reduction during the queuing time as “clinical response”. A total of 7.2% of the patients satisfied that criterion. Explainers of symptom reduction: 1. Initial symptom level The main determinant of symptom change during queuing time was the baseline self reported symptom severity. The more severe the symptoms were at the begin-ning of queuing, the bigger the improvement. This finding differs somewhat from the finding in Posternak & Miller’s meta-analysis (2001), where studies of patients with mild depressive symptoms reported similar improvement rates with studies of patients with more severe symptoms. The methodological issue of regression to the mean (a statistical phenomenon whereby outliers at one assessment time tend to drift closer to the mean at the next assessment) is complicated in this study. Had the inclusion criteria been based on a defined minimal initial symptom levels measured by the SCL-90, this phenomenon might have been an important ex-plainer of the result. Although the decision of inclusion in this study was mainly based on a clinical evaluation with minor information from the SCL-90, the possi-bility of regression to the mean cannot be excluded.
Contrary to the changes in the absolute GSI levels during the queuing time, an inverse association was observed between baseline GSI level and clinical response. This finding may be due to the fact that a 50 % GSI reduction in patients at the lower end of the baseline GSI score range deserves a smaller absolute GSI reduc-tion than in the higher end. Explainers of symptom reduction: 2. Diagnosis The overall effect of diagnosis on the symptom change was not strong, as the change in GSI score seemed to be independent of the axis-I diagnosis (anxiety or depressive disorder) or comorbid personality disorder diagnosis. In the subgroup of patients with depressive disorder, however, the presence of comorbid anxiety re-duced significantly the size of improvement in depressive symptoms. Similar effect of comorbid depressive and anxiety disorder could be seen in the whole population as well, as the ratio of clinical responders was lower (3.9%) in the comorbid group (vs. 7.2% in the whole population).
63
Explainers of symptom reduction: 3. Queuing time The connection between reduction in symptoms and the length of the queuing time was more complicated than expected in the light of the clear evidence that depres-sion spontaneously remits over time (Coryell et al. 1994). The effect of time seemed not to be linear as the waiting time (as a continuous variable or a four-class variable) did not affect the change. However, as a dichotomized variable the effect of time was statistically significant; the symptom reduction seemed to be stronger at queuing times over 2 months. This complicity may be connected to the different phases of illness of the subjects (improving vs. worsening), and in some extent to the different diagnoses (depressive, anxiety or combined disorder). We suggest that the effect of the natural course of the disorder may not play a dominant role in the symptom change during waiting to psychotherapy. Furthermore, a central part in the improvement may be for issues that could not be specifically measured here; e.g. the feeling of relief when waiting to psychotherapy, the treatment-seeking it-self (Kellner et al. 1971), obtaining an evaluation (Sox et al. 1981), and using in-formal problem-solving activities (Piper et al. 1990), which may cause therapeutic benefits. These pretreatment effects are different from the issue of placebo effect, where a subject believes he is being treated. Conclusions In summary, part of the patients with depression or anxiety disorders seems to im-prove clinically significantly during queuing for psychotherapy. Clinical implica-tions of this finding would be that a waiting period of variable length may not be harmful before starting psychotherapy in an outpatient setting. Some of the patients may benefit from it as their symptoms become less severe, and some may even im-prove clinically significantly. Research implications might be, that after screening patients to a clinical trial, a second measurement, just before the start of the treat-ment, is warranted to control for pretreatment effects.
8.3.2 Change in symptom distress during biological treatment
Baseline Somewhat surprisingly, the inpatient sample of Study V scored lower than the out-patient sample of Studies I-III (GSI and all subscales). Although the psychiatrist-rated symptoms (PANSS scores) were high, the subjectively reported symptom distress was lower than in the much less severely ill outpatient sample (Studies I-III). This discrepancy between observer-rated and self-reported symptom severity may be caused by actual lower subjective symptom distress or by lack of insight in these chronic psychotic patients.
64
Change No significant differences were present in improvement between the rTMS and sham groups in any of the SCL-90 subscales. Interestingly, the GSI value and the DEP scale were the only measures where the rTMS group, but not the sham group, improved significantly (0.5 SD improvement). However, as in the other measures, no statistical difference existed between the two treatment groups. The amount of change measured by the SCL-90 and the PANSS was similar.
The results of Study V suggest that high-frequency rTMS of the left DLPFC with the parameters used does not have significant therapeutic effects in severe schizophrenia, contrary to preliminary findings of symptom improvement (Nahas et al. 2000, Rollnick et al. 2000).
8.3.3 Sensitivity of SCL-90 in measuring change
In both trials (Studies IV and V), the SCL-90 detected change well. In the rTMS treatment trial (Study V), changes in the SCL-90 were consistent with those in the PANSS, indicating good sensitivity in measuring change in this patient population. In Study IV the changes in symptoms detected by the SCL-90 were consistent with earlier findings, and the changes made sense theoretically. The mean GSI change of 0.22 in this psychotherapy patient population was about 50% of the change sug-gested to be clinically and statistically significant in a German population (Schauenburg & Strack 1999). The GSI effect size for the queuing time in this study was 0.45. This change, although statistically significant, still did not bring the symptom level close to the symptom level of the Finnish community sample. The SCL-90 appears to be sensitive to even minor changes in symptom level.
8.4 Methodological issues
8.4.1 Samples and setting in Studies I-III
Overlap between the samples and lack of a golden standard? This study did not use a structured diagnostic interview as an external criterion. Instead the external criterion was belonging to one of the two samples. The com-munity sample consisted of employees of a Finnish city. Some subjects in this sample may have suffered from a mental disorder, as their psychiatric status was not assessed. Some may have even been receiving psychiatric treatment. However, all of them were working normally at the time of filling out the questionnaire. The patient sample consisted of tertiary care patients, patients of a psychiatric outpa-tient clinic of a university hospital. It is very improbable that individuals without a clear psychiatric disorder would reach this clinic. Nevertheless, many of these pa-tients were able to work. While the external criterion of this study can be consid-
65
ered to be clinically relevant, there is the possibility of overlap between the two samples. Schmitz et al. (2000) have used similar external criteria. They use the term “functional sample” for the community sample and “moderately disturbed sample” for the outpatient sample (Schmitz et al. 2000).
However, due to the strong external criterion, it is probable that the patient sample was more severely disordered than the primary care patients in some previ-ous studies, which may explain the good screening values found here: both the GHQ and the SCL-90 performed better than in an earlier comparative study, which used structured diagnostic interviews as an external criterion (Schmitz et al. 1999). This explanation applies to a recent Finnish methodological study on the screening performance of the HSCL-25, which also used structured diagnostic interviews as an external criterion (Veijola et al. in press). On the other hand, the possible pres-ence of mental problems in the community sample may have weakened the exter-nal criterion of the present study. Community sample: Different symptomatic levels in the American and Finnish populations
One reason for the different symptomatic levels between American (Derogatis 1983) and Finnish (Study I) community samples may be the latter’s reference time of one year. The accumulative incidence of symptoms was measured over a one-year period, rather than the current, point-in-time psychological symptom status which is the case with the most common reference time of one week to one month (Derogatis 1983). Obviously, the longer the time period, the greater the probability of a person having a period of psychiatric symptoms. A healthy person, as most of the subjects of our community sample are, may even remember a distant period of symptoms and report it in the questionnaire. However it has been shown that peo-ple tend to forget distant events (Loftus 1979). Because subjects of the outpatient sample came to the clinic to find help for a current psychiatric problem, most of their reported symptoms are probably part of their current, point-in-time psycho-logical symptom status. Administration The SCL-90 was mailed to the community sample, and thus, the instructions were in written form. However, the more common way of administering the scale is with brief oral instruction. The outpatient sample received the scale in this way. The difference in the administration may have had some unknown impact on the re-sults.
8.4.2 Specific issues of Study III
Causality As the design was cross-sectional, clarifying causal relationships between defenses and symptoms was not possible. The results may be interpreted to indicate that the use of particular defenses may predispose to particular symptoms, or that what is thought to be a defense mechanism is actually a reflection of an aspect of phe-nomenological psychopathology. Defense somatization may, for example, be a re-
66
flection of somatic depression equivalents, and therefore, not an antecedent but a consequence of the mental condition involved.
Correlations between questionnaires A. Method variance: Both instruments of Study III were self-report inventories,
and thus, the high association between them may be due partly to method vari-ance; the respondents may have a typical way of answering questions that is connected to their personal characteristics and the response setting.
B. Part of the correlation can be explained by content overlap; for example both the DSQ and SCL-90 have a measure of somatization.
C. The significant relationships may to some degree reflect a common underlying dimension of general well-being.
Dimensionality of SCL-90 The problems with the dimensionality of the SCL-90 that were found in Study I could partly explain, why no symptom-specific defense patterns were found. De-spite the result of Study I, the SCL-90 was used here in the way that it has often been used in earlier research (Derogatis 2000), with the presumption of dimension-ality.
8.4.3 Study IV
The number of subjects was large compared to earlier studies and a meta-analysis combining the results from several previous studies (Posternak & MIller 2001). However, since the study population consisted of patients with either depression or anxiety disorder, it may not have had enough power to reveal small but real effects or effects in subgroups of the population.
The fact, that the study population of the present study was naturalistic, repre-senting the population receiving psychotherapy in Finland, improved the gener-alizability of the results. The presence of subjects with anxiety disorder in the population, however, made it more difficult to draw conclusions on depression, or compare the finding with earlier depression studies. The spontaneous time courses of the different disorders included may be different, which may blur the effect of queuing time. On the other hand, the presence of patients with both anxiety disor-ders and depression, however, made it possible to compare the symptom change in the different diagnostic groups.
The effect of time on improvement in a waiting-list condition has not been spe-cifically studied before. In single studies that have used waiting-lists, the waiting time has been of similar length for all the subjects. The large variability in the length of queuing in the present study was an advantage since it enabled reliable assessment of effect of time on symptom change during queuing to psychotherapy.
The use of SCL-90 instead of the more usual depression rating scales in the pre-sent study made the comparison to earlier depression studies difficult. The few ear-lier studies that used SCL-90 unfortunately did not report results on the anxiety scale.
67
8.4.4 Study V
Limitations of self-report in a psychotic inpatient sample The patients in this study were chronic, severely ill (PANSS > 100), and heavily medicated schizophrenia patients. The use of the SCL-90, a self-report, as an out-come measure with psychotic patients is atypical, with only a few such studies available (Rauter et al. 1995). Derogatis writes in his SCL-90-R manual in 1983, that floridly psychotic patients are not a target sample for this instrument. This lim-its the value of self-report data as the primary or only source of outcome data. However, this study revealed that although the initial “objective” (PANSS) and subjective (SCL-90) symptom levels were different, both changed similarly as a result of treatment. Thus, the severely ill patients’ perceptions of their symptoms changed in a similar manner to raters’ perceptions. Technical limitations and limitations of study design The present study sample was small, leaving room for the possibility of a type two error. However, the control group seemed to improve more than the rTMS group, albeit not statistically, reducing the possibility of not detecting an existing rTMS effect. The patients in this study were chronic, severely ill (PANSS > 100), and heavily medicated schizophrenia patients, which may partly explain the lack of effect for this short treatment period. The patients in Rollnick’s study (2000) were less severely ill and were not reported to use anticonvulsant drugs. In Hoffman’s study (2000), anticonvulsant drugs reduced the rTMS effect, which is not probable in this study, as there was no difference in the outcome of users and nonusers of these drugs. The use of benzodiazepines could also theoretically reduce the rTMS effect, since they have been reported to reduce cortical excitability (Zieman et al. 1996). In our study, the only difference between users and nonusers of benzodi-azepines was found in the PANSS general symptoms scale, and surprisingly, it fa-vored the users.
8.5 Conclusions
The Finnish translation of the SCL-90 seems to perform in Finland as well as the SCL-90 performs elsewhere in the world.
It has a good utility, as evidenced by going through the list suggested by Stew-art for adequacy of rating scales (1990): 1) It had a good variability, as its results were widely and normally distributed in
each of the patient samples. 2) It is a reliable instrument, as its internal consistency is good (Study I). 3) It is a valid measure of general symptom severity but not of different symptom
dimensions (Study I). It is a valid psychiatric screening instrument, although a
68
similar screening performance could be achieved by the 12-item GHQ ques-tionnaire (Study II).
4) In the two outcome studies, it was sensitive to change (Studies IV and V). The community norms were sufficiently different from patient means (Study I) to enable its use as an outcome measure.
5) It is practical, and easy to fill out, and can be administered successfully via mail (Studies I-III) and in outpatient (Study IV) and inpatient (Study V) set-ting.
6) As the meaning of the items and their ratings are obvious, the interpretability of single items is good. The interpretability of sum scores (e.g. GSI) for a whole population is more problematic, as is the clinical meaning of change (e.g. 15% change in GSI value).
8.5.1 Implications for research
Symptom change over time The SCL-90 can be used reliably in Finland as a measure of symptom level and the change in it, for example, in treatment trials (Studies I,IV,V). The GSI value of the SCL-90 can be safely used as a measure of general symptom level since it success-fully differentiates patients from the community and is sensitive to change. Based on earlier data (Bech et al. 1992, Koeter 1992, Derogatis 2000), and data from this thesis (Study IV), the DEP and the ANX from the SCL-90 subscales seem reliable and valid, as they show some convergence to appropriate diagnoses. They may be used safely as indicators of specific symptomatology. Screening and epidemiological studies
The SCL-90 can be used reliably in Finland as a screening instrument (Study II). The community norms (Study I) and the screening thresholds (Study II) provided here should be helpful in epidemiological research for describing psychiatric symp-tom levels in different populations and for psychiatric case finding. Pretreatment effect Research implications of Study IV are that after screening a patient for a clinical trial, a second measurement, just before the start of treatment, is recommended to control for pretreatment effects.
8.5.2 Clinical implications
As far as the author is aware, literature describing the use of the SCL-90 in clinical practice, does not exist. However, according to the company that sells the copy-right version of the SCL-90, clinical psychologists, psychiatrists, and counseling
69
professionals in mental health, medical, and educational settings use the SCL-90 extensively (Pearson Assessments).
Based on this thesis, the SCL-90 may be useful in a clinical setting, as it per-
forms well as a screening instrument and is sensitive to change over time. It could, for instance, be used to screen psychiatric symptoms in primary care patients and to follow the development of the symptoms over time. This would provide baseline self-report data on psychiatric symptoms of patients sent to mental health centres for the first time. This would be especially useful in situations where there is a lack of psychiatrists in mental health centres.
Diagnostics and interpretations based on symptom profile (scores on different subscales) should be avoided, as inadequate evidence exists for the dimensionality of the SCL-90. Still, the subscale scores could be used as a basis for discussions about a patient’s symptoms.
Clinical implications of Study IV are that a short waiting period could be al-
lowed before starting psychotherapy in an outpatient setting. Patients do not seem to be harmed by it; in fact symptoms tend to become less severe and some patients may even remit.
Clinical implications of previously unpublished data are that at the time of ini-tial evaluation of a psychiatric patient the written or oral question of whether one feels trapped or caught might be useful in defining the clinical significance of pre-sented symptoms.

70
9 Acknowledgements
This thesis has taken a long time. I began attending educational meetings of the Helsinki Psychotherapy Study Group in 1992 as a medical student, at the sugges-tion of Professor Ranan Rimon. When I had mentioned an interest in psychother-apy research, he told me that Veikko Aalberg ”one of the leading psychoanalysts in Finland” might have something to offer me. He had indeed. I dived into the fasci-nating world of psychotherapy, psychotherapy research, and research in general. I also found myself at the heart of a massive evolving research project. I got to know many interesting personalities with much clinical experience in psychotherapy. Those meetings, and the additional psychodynamic reading suggested by Veikko, motivated me to continue with my medical studies, which at that stage seemed to be far removed from my main interests.
There are many people to whom I owe thanks for this thesis. My first supervi-sor, Docent Veikko Aalberg, deserves first and special mention. His extraordinarily clear vision on dynamic therapies provided the foundation for my ideas on psycho-therapy. His encouraging guidance and relaxed style made it possible for me to keep my dissertation project alive through my scientifically silent years. My sec-ond supervisor, Docent Mauri Marttunen, is thanked for pushing me to put things together and finally get rid of the project. His professional, structured yet liberal way of dealing with the last three publications of my thesis probably prevented my project from taking an additional ten years. It has been enjoyable to work with him. I owe much to my fellow researcher (I would like to call her my third, secret, ground-level supervisor), Pirkko Sammallahti, whose bright brains I envy. My first two publications were done in close collaboration with her.
My gratitude is due to Markku Eronen, whose incredibly straightforward style made it possible to carry out Study V at an enormous pace. Thank you also Hannu, Päivi, and Kari for your efforts in this study.
Many thanks to the Helsinki Psychotherapy Study Group (both historical and current) and its funders, for having patience with my efforts and providing me with the facilities and expertise without which this study would have been impossible. Thank you Jorma, Markku, Olavi, Anna, Camilla, Paul, Liisa, Päivi, and Harri. The heads of the Department of Psychiatry are also gratefully acknowledged for their patience with the Helsinki Psychotherapy Study. Thank you Ranan and Matti!
The two referees of this dissertation, Professor Pirkko Räsänen and Docent Timo Partonen, deserve my warmest thanks for their constructive, insightful and fast work. It’s a pleasure to receive comments from such dynamic and intelligent researchers.
My dissertation would not be possible without the privileged social and psycho-
logical environment I have had. With emphasis on the earlier stages of my life my parents, sisters and brothers are thanked for creating such an environment. Thank you Pentti, Raija, Tomi, Markus, Ruut, Anna and Helli. In my later life there have been some important friends. Thank you Shmuel, David, another David, Michael, Dafna, Osmo, Mika, Joonas, Heikki, Maarit, another Maarit and Kaarlo. My sweet older daughter Rebekka, and my second daughter Mai, whom I am just getting to

71
know, have contributed greatly to the quality of the currently limited life outside work. And nowadays, my most important “environmental factor” has been Kat-inka, to whom I owe much both in the personal and scientific dimensions of my life. Thank you!
72
10 References
Aalto-Setälä T, Poikolainen K, Tuulio-Henriksson A, Marttunen M, Lönnqvist J. Predictors of mental
distress in early adulthood: a five-year follow-up of 709 high-school students. Nord J Psychiatry
2002;56(2):121-125.
Andrews G, Pollock C, Stewart G. The determination of defense style by questionnaire. Arch Gen
Psychiatry 1989;146:455-460.
Antikainen R, Hänninen T, Honkalampi K, Hintikka J, Koivumaa-Honkanen H, Tanskanen A,
Viinamäki H. Mood improvement reduces memory complaints in depressed patients Eur Arch
Psychiatry Clin Neurosci 2001;251(1):6-11.
Antonowsky A. The structure and properties of the sense of coherence scale. Soc Sci Med
1993;36:725-733.
Ayd FJ: Lexicon of Psychiatry, Neurology, and the Neurosciences. Williams & Wilkins, Baltimore,
1995.
Babor TF, Brown J, Del Boca FK. Validity of self-reports in applied research on addictive behaviors:
fact or fiction? Behav Assess 1990;12:5-31.
Bagby RM, Taylor GJ, Ryan D. Toronto Alexithymia Scale: relationship with personality and
psychopathology measures. Psychother & Psychosom 1986;45(4):207-215.
Barlow J, Blouin J, Blouin A, Perez E. Treatment of bulimia with desipramine: a double-blind
crossover study. Can J Psychiatry - Revue Canadienne de Psychiatrie 1988;33:129-133.
Bech P, Allerup P, Maier W, Albus M, Lavori P, Ayuso JL. The Hamilton scales and the Hopkins
Symptom Checklist (SCL-90). A cross-national validity study in patients with panic disorders. Br J
Psychiatry 1992;160:206-211.
Bech P, Malt UF, Dencker SJ, Ahlfors UG, Elgen K, Lewander T, Lundell A, Simpson GM,
Lingjaerde O. Scales for assessment of diagnosis and severity of mental disorders. Acta Psychiatr
Scand 1993; suppl 372 vol. 87.
Beck AT, Steer RA. Beck Anxiety Inventory: manual. San Antonio: Psychological Corporation,
Harcourt Brace Jovanovich, 1987.
Beck AT, Ward CH, Mendelson M, Mock JE, Erbaugh JK. An inventory for measuring depression.
Arch Gen Psychiatry 1961;4:561-571.
Blacker D, Endicott J. Psychometric Properties: Concepts of Reliability and Validity. In: Handbook
of psychiatric measures. American Psychiatric Association 2000:pp.7-14
Blay SL, Vel Fucks JS, Barruzi M, Di Pietro MC, Gastal FL, Neto AM, De Souza MP, Glausiusz LR,
Dewey M. Effectiveness of time-limited psychotherapy for minor psychiatric disorders:
randomised controlled trial evaluating immediate v. long-term effects. Br J Psychiatry
2002;180:416-422.
73
Blazer DG, Kessler RC, McGonagle KA, Swartz MS. The prevalence and distribution of major
depression in a national community sample: The National Comorbidity Survey. Am J Psychiatry
1994;151:979-986.
Del Boca FK, Noll JA. Truth or consequences: the validity of self-report data in health services
research on addictions. Addiction 2000;95(Suppl 3):347-360.
Bond M, Gardner ST, Christian J, Sigal JJ. Empirical study of self-rated defense styles. Arch Gen
Psychiatry 1983;40:333-338.
Bonynge ER. Unidimensionality of SCL-90-R scales in adult and adolescent crisis samples. J Clin
Psychol 1993;49:212-215.
Boudrez H, De Backer G. Psychological status and the role of coping style after coronary artery
bypass graft surgery. Results of a prospective study. Quality of Life Res 2001;10(1):37-47.
Brodaty H, Andrews G. Brief psychotherapy in family practice. A controlled prospective intervention
trial. Br J Psychiatry 1983;143:11-19.
Cattel RB. The scree test for the number of factors. Multivariate Behav Res 1966;1:245-276.
Clark A, Friedman MJ. Factor Structure and Discriminant Validity of the SCL-90 in a Veteran
Psychiatric Population. J Pers Assess 1983:47:396-404.
Cloninger CR, Svrakic DM, Przybeck TR. A psychobiological model of temperament and character.
Arch Gen Psychiatry 1993;50:975–990.
Cohen E, Bernardo M, Masana J, Arrufat FJ, Navarro V, Valls-Sole, Boget T, Barrantes N, Catarineu
S, Font M, Lomena FJ. Repetitive transcranial magnetic stimulation in the treatment of chronic
negative schizophrenia: a pilot study. J Neurol Neurosurg Psychiatry 1999;67:129-130.
Cohen J. A coefficient of agreement for nominal scales. Educational and Psychological Measurement
1960;20:37-46.
Corcoran K, Fischer J. Measures for Clinical Practice: A Sourcebook, 3rd ed, Vol I. New York, Free
Press, 2000:pp.3–62.
Coryell W, Akiskal HS, Leon AC, Winokur G, Maser JD, Mueller TI, Keller MB. The time course of
non-chronic major depressive disorder. Arch Gen Psychiatry 1994;51:405-410.
Cox D, Lewis G, Stuart G, Murphy K. A cross-sectional study of the prevalence of psychopathology
in adults with congenital heart disease. J Psychosom Res 2002;52(2):65-68.
Cronbach LJ: Coefficient alpha and the internal structure of tests. Psychometrika 1951;16:297–334.
Cyr JJ, McKenna-Foley JM, Peacock E. Factor structure of the SCL-90-R: is there one? J Pers Assess
1985;49(6):571–578.
Davidson JR, McLeod MN, Turnbull CD, Miller RD. A comparison of phenelzine and imipramine in
depressed inpatients. J Clin Psychiatry 1981;42:395-397.
Davidson J, McLeod MN, White HL. Inhibition of platelet monoamine oxidase in depressed subjects
treated with phenelzine. Am J Psychiatry 1978;135:470-472.
74
Davidson J, Miller R, Van Wyck Fleet J, Strickland R, Manberg P, Allen S, Parrott R. A double-blind
comparison of bupropion and amitriptyline in depressed inpatients. J Clin Psychiatry 1983;44:115-
117.
Derecho CN, Wetzler S, McGinn LK, Sanderson WC, Asnis GM. Atypical depression among
psychiatric inpatients: clinical features and personality traits. J Affect Disord 1996;39(1):55-59.
Derogatis LR. SCL-90-R Administration, Scoring & Procedures Manual-II. Towson, MD: Clinical
Psychometric Research 1983:14–15.
Derogatis LR. Symptom Checklist-90-Revised. in Handbook of psychiatric measures. American
Psychiatric Association 2000:pp.81-84.
Derogatis LR, Lipman RS, Covi L. SCL-90: an outpatient psychiatric rating scale - preliminary
report. Psychopharmacol Bull 1973;9:13–28.
Derogatis LR, Lipman RS, Rickels K, Uhlenhuth EH, Covi L. The Hopkins Symptom Checklist
(HSCL) : A measure of Primary Symptom Dimensions. In: Pichot P, ed. Psychological
Measurements in Psychopharmachology. Basel, Karger, 1974.
Derogatis LR, Rickels K, Roch AF. The SCL-90 and the MMPI: a step in the validation of a new self-
report scale. Br J Psychiatry 1976;129:280-289.
Diagnostic and statistical manual of mental disorders, fourth edition, text revision. Washington, DC,
American Psychiatric Association 2000.
Dinning WD, Evans RG. Discriminant and Convergent Validity of the SCL-90 in Psychiatric
Inpatients. J Pers Assess 1977;41:304-310.
Dohrenwend BP, Yager TJ, Egri G, Mendelsohn FS. The psychiatric status schedule (PSS) as a
measure of dimensions of psychopathology in the general population. Arch Gen Psychiatry
1978;35:731-739.
Durham RC, Allan T. Psychological treatment of generalized anxiety disorder: a review of the
clinical significance of results in outcome studies since 1980. Br J Psychiatry 1993;163:19-26.
Eaton WW, Neufeld K, Chen L, Cai G. A comparison of self-report and clinical diagnostic interviews
for depression: Diagnostic Interview Schedule and Schedules for Clinical assessment in
Neuropsychiatry in the Baltimore Epidemiologic Catchment area follow-up. Arch Gen Psychiatry
2000;57(3):217-222.
Eaton WW, Romanoski A, Anthony JC, Nestadt G. Screening for psychosis in the general population
with a self-report interview. J Nerv Ment Dis 1991;179:689-693.
Elkin I, Parloff MB, Hadley SW, Autry JH. NIMH Treatment of Depression Collaborative Research
Program. Background and research plan. Arch Gen Psychiatry 1985;42:305-316.
Erdreich LS, Lee ET. Use of Relative Operating Characteristic analysis in epidemiology. Am J
Epidemiol 1981;114:649-662.
Evenson RC, Holland RA, Mehta S, Yasin F. Factor analysis of the symptom checklist-90. Psychol
Rep 1980;46:695-699.

75
Feighner JP, Robins E, Guze SB, Woodruff RA Jr, Winokur G, Munoz R. Diagnostic criteria for use
in psychiatric research. Arch Gen Psychiatry 1972;26(1):57-63.
Feinsod M, Kreinin B, Chistyakov A, Klein E. Preliminary evidence for a beneficial effect of low-
frequency, repetitive transcranial magnetic stimulation in patients with major depression and
schizophrenia. Depress Anxiety 1998;7:65-68.
First MB, Frances A, Pincus HA. DSM-IV handbook of differential diagnosis. American psychiatric
press, Washington DC,1995:p 13
First MB, Spitzer RL, Gibbon M, Williams JBW. Structured Clinical Interview for DSM-IV Axis I
Disorders (SCID). New York, New York State Psychiatric Institute, Biometrics Research, 1995.
Fitch MI, Osoba D, Iscoe N, Szalai JP. Predicting psychological distress in patients with cancer:
Conceptual basis and reliability evaluation of a self-report questionnaire. Anticancer Res
1995;15:1533-1542.
Fleiss JL. Statistical Methods for Rates and Proportions (2:nd edition). John Wiley & Sons. New
York, 1981:p.218.
Florkowski CM, Stevens I, Joyce P, Espiner EA, Donald RA. Growth hormone replacement does not
improve psychological well-being in adult hypopituitarism: a randomized crossover trial.
Psychoneuroendocrinol 1998;23:57-63.
Folstein MF, Folstein S, McHugh PR. Mini-Mental State: a practical method for grading the cognitive
state of patients with a clinician. J Psychiatric Res 1975;12:189-198.
Frances A, Mack AH, First MB, Widiger TA, Ross R, Forman L, Davis WW. DMS-IV meets
philosophy. J Med & Philosophy 1994;19:207-218.
Freud A. Ego and the mechanisms of defense. Hogarth Press, London, 1937.
Freud S. Inhibition, symptom and anxiety. In: The standard edition of the complete psychological
works of Sigmund Freud. Hogarth Press, London, 1926: Vol 20, pp 85-117.
Fulford KW. Values in psychiatric diagnosis: executive summary of a report to the chair of the ICD-
12/DSM-VI Coordination Task Force (Dateline 2010). Psychopathol 2002; 35(2-3):132-138.
Gardner W. On the reliability of sequential data: measurement, meaning, and correction. In: Gottman
JM(Ed.), The analysis of change. Mahwah, Erlbaum, N.J,1995:p.159
Geller V, Grisaru N, Abarbanel JM, Lemberg T, Belmaker RH. Slow magnetic stimulation of
prefrontal cortex in depression and schizophrenia. Prog Neuropsychopharmacol Biol Psychiatry
1997;21:105-110.
George MS, Wassermann EM, Williams WA, Callahan A, Ketter TA, Basser P, Hallett M, Post RM.
Daily repetetive transcranial magnetic stimulation (rTMS) improves mood in depression. NeuroRep
1995;6:1853-1856
George MS, Wassermann EM, Williams WE, Kimbrell TA, Little JT, Hallet M, Post RM. Mood
improvements following daily left prefrontal repetitive transcranial magnetic stimulation in patients
with depression: a placebo-controlled crossover trial. Am J Psychiatry 1997;154:1752-1756.
76
Goldberg C. Cognitive-behavioral therapy for panic: Effectiveness and limitations. Psychiatric
Quarterly 1998;69:23-44.
Goldberg D. The detection of psychiatric illness by questionnaire. Maudsley Monographs 21, New
York, 1972.
Goldberg DP, Gater R, Sartorius N, Ustun TB, Piccinelli M, Guraje O, et al. The validity of two
versions of the GHQ in the WHO study of mental illness in general health care. Psychol Med
1997;27:191-197.
Goldberg DP, Oldehinkel T, Ormel J. Why GHQ threshold varies from one place to another? Psychol
Med 1998;28(4):915-921.
Goldberg DP, Williams P. A User’s Guide to the General Health Questionnaire. NFER: Windsor;
1988.
Goldman RS, Robinson D, Grube BS, Hanks RA, Putnam K, Walder DJ, Kane JM. General
psychiatric symptoms measures. In: Handbook of psychiatric measures. American Psychiatric
Association 2000.
McGough J, Curry JF. Utility of the SCL-90-R with depressed and conduct-disordered adolescent
inpatients. J Pers Assess 1992;59(3):552-563.
Grisaru N, Chudakov B, Yaroslavsky Y, Belmaker RH. Catatonia treated with transcranial magnetic
stimulation. Am J Psychiatry 1998;155:1630.
Gurin G, Veroff J, Feld S. Americans view their mental health. Basic Books, New York, 1960.
Hauff E, Vaglum P. Organised violence and the stress of exile. Predictors of mental health in a
community cohort of Vietnamese refugees three years after resettlement. Br J Psychiatry
1995;166(3):360-367.
Van Hemert AM, Den Heijer M, Vorstenboch M, Bolk JH. Detecting psychiatric disorders in medical
practice using the General Health Questionnaire: why do cut-off scores vary? Psychol Med
1995;25:165-170.
Hofmann NG, Overall PB. Factor structure of the SCL-90 in a psychiatric population. J Cons Clin
Psychol 1978;46:1187–1191.
Hoffman RE, Boutros NN, Hu S, Berman RM, Krystal JH, Charney DS. Transcranial magnetic
stimulation and auditory hallucinations in schizophrenia. Lancet 2000;355:1073-1075.
Holi MM. Transcranial magnetic stimulation in psychiatry. Psychiatria Fennica 1999;30:173-184.
Holland JC, Morrow GR, Schmale A, Derogatis L, Stefanek M, Berenson S, Carpenter PJ, Breitbart
W, Feldstein M. A randomized clinical trial of alprazolam versus progressive muscle relaxation in
cancer patients with anxiety and depressive symptoms. J Clin Oncology 1991;9:1004-1011.
Honkalampi K, Saarinen P, Hintikka J, Virtanen V, Viinamaki H. Factors associated with alexithymia
in patients suffering from depression. Psychother & Psychosom 1999;68(5):270-275.
The ICD-10 classification of mental and behavioral disorders: clinical descriptions and guidelines.
WHO, 1992.
77
Jesness CF. The Jesness Inventory: Manual. North Tonawanda, NY, 1996.
Johnstone A, Goldberg D. Psychiatric screening in general practice. A controlled trial. Lancet
1976;1:605-608.
de Jonghe F, Kool S, van Aalst G, Dekker J, Peen J. Combining psychotherapy and antidepressants in
the treatment of depression. J Affect Disord 2001;64:217-229.
Joukamaa M, Karlsson H, Sholman B, Lehtinen V. Alexithymia and psychological distress among
frequent attendance patients in health care. Psychother & Psychosom 1996;65(4):199-202.
Joukamaa M, Lehtinen V, Karlsson H. The ability of general practitioners to detect mental disorders
in primary health care. Acta Psychiatr Scand 1995;91:52-56.
Joukamaa M, Lehtinen V, Karlsson H, Rouhe E. SCL-25 and recognition of mental disorders reported
by primary health care physicians. Acta Psychiatr Scand 1994;89(5):320-323.
Kahn RS, Westenberg HG, Verhoeven WM, Gispen-de Wied CC, Kamerbeek WD. Effect of a
serotonin precursor and uptake inhibitor in anxiety disorders; a double-blind comparison of 5-
hydroxytryptophan, clomipramine and placebo. Int Clin Psychopharmacol 1987;2:33-45.
Kansanterveyslaitos. Terveys 2000 -tutkimuksen perustulokset. 7.4 Psyykkinen oireilu ja
mielenterveyden häiriöt 2002. (http://www.ktl.fi/terveys2000/perusraportti/7.4.html)
Kaplan HI, Sadock BJ, Grebb JA. Kaplan and Sadock’s synopsis of psychiatry, 7.th edition. Williams
& Wilkins, Baltimore, Maryland, 1994:pp.300-335
Karlsson H, Joukamaa M, Lehtinen V. Differences between patients with identified and not identified
psychiatric disorders in primary care. Acta Psychiatr Scan 2000;102(5):354-358.
Kaustio O, Partanen J, Valkonen-Korhonen M, Viinamaki H, Lehtonen J. Affective and psychotic
symptoms relate to different types of P300 alteration in depressive disorder. J Affect Disord
2002;71(1-3):43-50.
Kay SR, Fiszbein A, Opler LA. The positive and negative syndrome scale (PANSS) for
schizophrenia. Schizophr Bull 1987;13(2):261-276.
Kay SR, Opler LA, Lindenmayer JP. Reliability and validity of the positive and negative syndrome
scale for schizophrenics. Psychiatry Res 1988; 23(1):99-110.
Kazis LE, Anderson JJ, Meenan RF. Effect sizes for interpreting changes in health status. Med Care
1989;27:S178-189.
Kellner R, Sheffield BF. The relief of distress following attendance at a clinic. Br J Psychiatry
1971;118:195¯ 198.
Kerlinger FN, Lee HN. Foundations of behavioural research, fourth edition. Wadsworth, USA, 2000.
Kessler RC, Wittchen H-A, Abelson J, Shanyang Z. Methodological issues in assessing psychiatric
disorders with self-reports. In: The science of self-report: implications for research and practice.
Lawrence Erlbaum Associates, NJ, 2000:pp.229-255
Kim JO, Mueller CW. Introduction to Factor Analysis: What It Is and How to Do It. Newbury Park,
CA, Sage, 1978.

78
Kim SW, Dysken MW, Kuskowski M. The Symptom Checklist-90: Obsessive-Compulsive Subscale:
A reliability and validity study. Psychiatry Res 1992;41(1):37-44.
Klein E, Kolsky Y, Puyerovsky M, Koren D, Chistyakov A, Feinsod M. Right prefrontal slow
repetitive transcranial magnetic stimulation in schizophrenia: a double-blind sham-controlled pilot
study. Biol Psychiatry 1999;46:1451-1454.
Koeter MW. Validity of the GHQ and SCL anxiety and depression scales: A comparative study. J
Affect Disord 1992;24:271–279.
Koh KB, Kim CH, Park JK. Predominance of anger in depressive disorders compared with anxiety
disorders and somatoform disorders. J Clin Psychiatry 2002;63(6):486-492.
Kovacs M. The Children's Depression Inventory (CDI). Psychopharmacol Bull 1985;21(4):995-998.
Kneepkens RG, Oakley LD. Rapid improvement in the defense style of depressed women and men. J
Nerv Ment Dis 1996;184:358-361.
Knekt P, Lindfors O, Kaipainen M et al. The Helsinki Psychotherapy Study: Design, Methods and
Participant Characteristics. Submitted.
Kuder GF, Richardson MW: The theory of the estimation of test reliability. Psychometrika
1937;2:151–160.
Lehtinen V, Kuusela V, Lahtela K, et al. The execution of the Mini-Finland health survey. Part 4
Survey methods for mental disorders. Kansaneläkelaitoksen julkaisuja ML:51: Helsinki, Turku,
1985.
Leighton AH. My name is Legion. Vol. I of the Stirling County Study. Basic Books, New York,1959.
Leon AC, Marzuk PM, Portera L. More reliable outcome measures can reduce sample size
requirements. Arch Gen Psychiatry 1995;52(10):867-871.
Loftus EF. Eyewitness Testimony. Cambridge, MA, Harward University press, 1979.
Morgan CD, Wiederman MW, Magnus RD. Discriminant validity of the SCL-90 dimensions of
anxiety and depression. Assessment 1998;5(2):197-201.
Morgan GA, Harmon RJ. Data collection techniques. J Am Acad Child Adolesc Psychiatry
2001;40(8):973-976.
Munro BH, Page EB Statistical methods for health care research. J.B. Lippincott company.
Philadelphia, 1993:pp. 203-204.
Murphy JM, Berwick DM, Weinstein MC, et al: Performance of screening and diagnostic tests:
application of receiver operating characteristic analysis. Arch Gen Psychiatry 1987;44:550–555.
Myers K, Winters NC. Ten-year review of rating scales. I: Overview of scale functioning,
psychometric properties, and selection. J Am Acad Child Adolesc Psychiatry 2002:41(2):114-122.
Nahas Z, McConne K, Collins S, Molley M, Christie S, Horner M, Labate L, Hamner M, Arana G,
Risch C, George MS. Non-invasive direct brain stimulation suggests that the lateral prefrontal
cortex modulates the negative symptoms of schizophrenia. International Society of Transcranial
Stimulation (ISTS), Annual Meeting, Chicago, IL, May 10, 2000, abstract.
79
National Institute of Health (NIH) Guide: Methodology and measurement in the behavioral sciences
(PA-98-031) 1998. (http://grants.nih.gov/grants/guide/pa-files/PA-98-031.html)
Noh S, Avison WR. Assessing Psychopathology in Korean Immigrants: Some Preliminary Results on
the SCL-90. Can J Psychiatry 1992;37:640–645.
Osterberg K, Karlson B, Orbaek P. Personality, mental distress, and risk perception in subjects with
multiple chemical sensitivity and toxic encephalopathy. Scand J Psychol 2002;43(2):169-175.
Pani PP, Maremmani I, Pirastu R, Tagliamonte A, Gessa GL. Buprenorphine: a controlled clinical
trial in the treatment of opioid dependence. Drug & Alcohol Dependence 2000;60:39-50.
Parloff MB. Placebo controls in psychotherapy research: a sine qua non or a placebo for research
problems? J Consult Clin Psychol 1986;54:79-87.
Parloff MB, Kelman HC, Frank JD. Comfort, effectiveness and self-awareness as criteria of
improvement in psychotherapy. Am J Psychiatry 1954;5:343-351.
Pascual-Leone A, Rubio B, Pallard F, Catala MD. Rapid-rate transcranial magnetic stimulation of left
dorsolateral prefrontal cortex in drug-resistant depression. Lancet 1996;348:233-238.
Patton D, Barnes GE, Murray RP. The reliability and construct validity of two measures of addictive
personality. Internat J Addictions 1994;29(8):999-1014.
Pearson Assessments (http://assessments.ncspearson.com/assessments/tests/scl90r.htm)
Perry JC. Problems and considerations in the valid assessment of personality disorders. Am J
Psychiatry 1992;149:1645-1653.
Peveler RC, Fairburn CG. Measurement of neurotic symptoms by self-report questionnaire: validity
of the SCL-90R. Psychol Med 1990;20(4):873-879.
Pincus HA, Rush AJ, First MB, McQueen LE. Handbook of psychiatric measures. American
Psychiatric Association 2000:p. xxiii.
Piper WE, Azim HF, McCallum M, Joyce AS. Patient suitability and outcome in short-term
individual psychotherapy. J Cons Clin Psychol 1990;58(4):475-481.
Posternak MA, Miller I. Untreated short-term course of major depression: a meta-analysis of
outcomes from studies using wait-list control groups. J Affect Disord 2001;66(2-3):139-146.
Preston NJ, Orr KG, Date R, Nolan L, Castle DJ. Gender differences in premorbid adjustment of
patients with first episode psychosis. Schizophr Res 2002;55(3):285-290.
Primeau F, Fontaine R, Beauclair L. Valproic acid and panic disorder. Can J Psychiatry - Revue
Canadienne de Psychiatrie 1990;35:248-250.
Radloff LS. The CES-D Scale: A self-report depression scale for research in the general population.
Applied Psychol Meas 1977;1:385-401.
Rauter UK, Leonard CE, Swett CP. SCL-90-R factor structure in an acute, involuntary, adult
psychiatric inpatient sample. J Clin Psychol 1996;52(6):625-629.
80
Regier DA, Burke JA. Epidemiological method in psychiatry. In: Kaplan & Sadock’s Comprehensive
Textbook of Psychiatry, 7.the edition. Lippincott Williams & Wilkins, Philadelphia, 2000.
Rief W, Fichter M. The Symptom Check List SCL-90-R and its Ability to Discriminate between
Dysthymia, Anxiety Disorders, and Anorexia nervosa. Psychopathol 1992;25:128-138.
Rollnick JD, Huber TJ, Mogk H, Siggelkow S, Kropp S, Dengler R, Emrich HM, Schneider U. High
frequency repetitive transcranial magnetic stimulation (rTMS) of the dorsolateral prefrontal cortex
in schizophrenic patients. NeuroRep 2000;11:4023-4015.
Sadock BJ, Sadock VA. Kaplan & Sadock’s Comprehensive Textbook of Psychiatry, 7.the edition.
Lippincott Williams & Wilkins, Philadelphia, 2000.
Sammallahti P, Aalberg V. Defense style in personality disorders: An empirical study. J Nerv Ment
Dis 1995;183:516-521.
Sammallahti PR, Aalberg VA, Pentinsaari J-P. Does defense style vary with severity of mental
disorder? An empirical assessment. Acta Psychiatr Scand 1994;90:290-294.
van der Sande R, van Rooijen L, Buskens E, Allart E, Hawton K, van der Graaf Y, van Engeland H.
Intensive in-patient and community intervention versus routine care after attempted suicide. A
randomised controlled intervention study. Br J Psychiatry 1997;171:35-41.
Sandoval AM, Hancock D, Poythress N, Edens JF, Lilienfeld S. Construct validity of the
Psychopathic Personality Inventory in a correctional sample. J Pers Assess 2000;74(2):262-281.
Sartorius N. In: The ICD-10 classification of mental and behavioral disorders: clinical descriptions
and guidelines. WHO, 1992: pp.v-vi
SAS Institute Inc.: SAS Online Doc. SAS/STAT User's Guide, Version 8. Cary, NC, SAS Institute
Inc, 1999
Schauenburg H, Strack M. Measuring psychotherapeutic change with the symptom checklist SCL 90
R. Psychother & Psychosom 1999;68(4):199-206.
Schmitz N, Hartkamp N, Franz M, Buse S, Karig R, Tress W. Properties of the Symptom Check List
(SCL-90-R) in a psychosomatic consultation-liaison setting. Psychol Rep 2002;90:1201-1207.
Schmitz N, Hartkamp N, Franke GH. Assessing clinically significant change: application to the SCL-
90-R. Psychol Rep 2000;86:263-274.
Schmitz N, Kruse J, Heckrath C, Alberti L, Tress W. Diagnosing mental health disorders in primary
care: the General Health Questionnaire (GHQ) and the Symptom Check List (SCL-90-R) as
screening instruments. Soc Psychiatr Epidemiol 1999;34:360-366.
Schmitz N, Kruse J, Tress W. Improving screening for mental disorders in the primary care setting by
combining the GHQ-12 and SCL-90-R Subscales. Compr Psychiatry 2001;42:166-173.
Schwarz N. Self-report; how the questions shape the answers, American Psychologist 1999;54:93-
105.
Selmi PM, Klein MH, Greist JH, Sorrell SP, Erdman HP. Computer-administered cognitive-
behavioral therapy for depression. Am J Psychiatry 1990;147:51-56.
81
Shapiro DA, Firth J. Prescriptive v. exploratory psychotherapy. Outcomes of the Sheffield
Psychotherapy Project. Br J Psychiatry 1987;151:790-799.
Shapiro DA, Firth-Cozens J. Two-year follow-up of the Sheffield Psychotherapy Project. Br J
Psychiatry 1990; 157:389-391.
Sipila K, Veijola J, Jokelainen J, Jarvelin MR, Oikarinen KS, Raustia AM, Joukamaa M. Association
between symptoms of temporomandibular disorders and depression: an epidemiological study of
the Northern Finland 1966 Birth Cohort. Cranio 2001;19(3):183-187.
Skydsbjerg M, Lunn S, Hutchings B. Psychosocial aspects of human immunodeficiency virus (HIV)
infection in a pre-HAART sample. Scand J Psychol 2001;42(4):327-333.
Sox HC Jr, Margulies I, Sox CH. Psychologically mediated effects of diagnostic tests. Ann Intern
Med 1981;95:680¯685.
Spinhoven P, Kooiman CG. Defense Style in Depressed and Anxious Psychiatric Outpatients: An
Explorative Study. J Nerv Ment Dis 1997;185:87-94.
Spitzer RL, Endicott J, Robins E. Research diagnostic criteria: rationale and reliability. Arch Gen
Psychiatry 1978;35(6):773-782.
Spitzer RL, Williams JB, Gibbon M, First MB. The Structured Clinical Interview for DSM-III-R
(SCID). I:History, rationale and description. Arch Gen Psychiatry 1992;49:624-629.
SPSS Inc. 2003, Chicago, Illinois, USA.
Stewart AL. Psychometric considerations in functional status instruments. In: WONCA classification
committee (ed). Springer-Verlag, New York, 1990.
Strayer DR, Carter WA, Brodsky I, Cheney P, Peterson D, Salvato P, Thompson C, Loveless M,
Shapiro DE, Elsasser W. A controlled clinical trial with a specifically configured RNA drug,
poly(I).poly(C12U), in chronic fatigue syndrome. Clin Inf Dis 1994;18 Suppl 1:S88-95.
Turner CF, Ku L, Rogers SM, Lindberg LD, Pleck JH, Sonenstein FL. Adolescent sexual behavior,
drug use, and violence: increased reporting with computer survey technology, Science
1998;280:867-873.
Vaillant GE, Bond M, Vaillant CO. An empirically validated hierarchy of defense mechanisms. Arch
Gen Psychiatry 1986;43:786-794.
Valkamo M, Hintikka J, Honkalampi K, Niskanen L, Koivumaa-Honkanen H, Viinamäki H.
Alexithymia in patients with coronary heart disease. J Psychosom Res 2001;50:125-130.
Vassend O, Skrondal A. The problem of structural indeterminancy in multidimensional symptom
report instruments. The case of SCL-90-R. Behav Res Ther 1998;37:685-701.
Veijola J, Jokelainen J, Läksy K, Kantojärvi L, Kokkonen, Järvelin M-R et al. The Hopkins Symptom
Checklist-25 in screening DSM-III-R Axis-I Disorders. Nord J Psychiatry; in press.
Viinamäki H, Hintikka J, Honkalampi K, Koivumaa-Honkanen H, Kuisma S, Antikainen R,
Tanskanen A, Lehtonen J. Cluster C personality disorder impedes alleviation of symptoms in major
depression. J Affect Disord 2002;71:35-41.
82
Ward E, King M, Lloyd M, Bower P, Sibbald B, Farrelly S, Gabbay M, Tarrier N, Addington-Hall J.
Randomised controlled trial of non-directive counselling, cognitive-behaviour therapy, and usual
general practitioner care for patients with depression. I: clinical effectiveness. Br Med J
2000;321(7273):1383-1388.
Wider A. The Cornell Medical Index and manual. Psychological Corporation, New York, 1948.
Widiger TA, Frances AJ, Pincus HA, First MB, Ross R, Davis W. Preface. In: DSM-IV sourcebook
Vol. 1. American Psychiatric Association, Washington, 1994.
Widiger TA, Clark LA. Toward DSM-V and the classification of psychopathology. Psychol Bull
2000;126(6):946-63.
Williams JBW. Psychiatric classification. In: The American psychiatric press textbook of psychiatry.
American psychiatric press, Inc. 1988.
Winston A, Laikin M, Pollack J, Samstag LW, McCullough L, Muran JC. Short-term psychotherapy
of personality disorders. Am J Psychiatry 1994;151(2):190-194.
Winston A, Pollack J, McCullough L, Flegenheimer W, Kestenbaum R, Trujillo M. Brief
psychotherapy of personality disorders. J Nerv Ment Dis 1991; 179(4):188-193.
Wiznitzer M, Verhulst FC, van den Brink W, Koeter M, van der Ende J, Giel R, et al. Detecting
psychopathology in young adults: the Young Adult Self Report, the General Health Questionnaire
and the Symptom Checklist as screening instruments. Acta Psychiatr Scand 1992;86:32-37.
Woodworth RS. Personal Data Sheet. Stoelting.1, Chicago, 1918.
Woody SR, Steketee G, Chambless DL. The usefulness of the Obsessive Compulsive Scale of the
Symptom Checklist-90-Revised. Behav Res & Ther 1995;33(5):607-611.
World Health Organization: Lexicon of Psychiatric and Mental Health Terms, ed 2. World Health
Organization, Geneva, 1994.
Yang CK. Sociopsychiatric characteristics of adolescents who use computers to excess. Acta
Psychiatr Scand 2001;104(3):217-222.
Youden WJ. Index for rating diagnostic tests. Cancer 1950;3:32–5.
Zack M, Toneatto T, Streiner DL. The SCL-90 factor structure in comorbid substance abusers. J
Subst Abuse1998;10(1):85-101.
Zarin DA. Considerations in choosing, Using and interpreting a measure for a particular clinical
context. In: Handbook of psychiatric measures. American Psychiatric Association 2000:p. 15.
Ziemann U, Lonnecker S, Steinhoff BJ, Paulus W. The effect of lorazepam on the motor cortical
excitability in man. Experiment Brain Res 1996;109:127-135.