assessment of rv size, function, and pulmonary hypertension · assessment of rv size, function, and...
TRANSCRIPT

Assessment of RV size, function, and pulmonary hypertension
Sung-Ai Kim, MD
Division of Cardiology, Hallym Sacred Heart Hospital,
Hallym University College of Medicine, Korea

Anatomy of Right ventricle
• Crescent-like shape and a thin wall
• Wrapped around the LV
• Complex RV geometry in contrast to the symmetrical shape of LV
Kukulski T, et al. Echocardiography 2000McLure L, et al. Eur Respir J 2009

Anatomy of Right ventricle
“3 distinct portions”
• Smooth muscular Inflow (body)
• Trabecular apex
• Outflow (infundibulum)

Work of Right ventricle
“RV” vs LV • 1/6 of the muscle mass
• 1/10 of the vascular resistance
• Same stroke volume
• ¼ of the stroke work d/t low
resistance of pulmonary vasculature

Work of Right ventricle
• Inner longitudinal fiber (base-to-apex
shortening) >> superficial circumferential fiber
(inward movement)
• Longitudinal shortening accounts for 80% of RV
function in normal physiologic states
Curr Opin Cardiol 2015, 30:292–300

“RV” linked to the LV
• By a shared septum
• By attachment of the RV free wall to the anterior & posterior septum
• By encircling epicardial fibers
• By sharing the pericardial space

Assessment of RV size & function
• Because of the
- complex geometry
- poor RV endocardial definition
- operator and acoustic window differences
→ volumetric quantification is challenging
→ limited data regarding the normal size
→ rely on visual estimation

Comprehensive evaluation of the RV


F/ 42 Idiopathic pulmonary HTN
Bef
ore
A
fte
r

Assessment of RV size and Function
1. RV dimension
2. 2D assessment of RV
- RV area and FAC
- 2D volume and EF
3. 3D assessment of RV
- 3D volume and EF
4. Non-volumetric assessment of RV function

RV dimension
• RV dilated in response to chronic volume and/or pressure overload
Idiopathic pulmonary HTNNormal

RV dimension
JASE 2002;15-633-9

Circulation. 2004;109:2401-2404

RV dimension
< 42mm
< 27mm< 33mm
“the RV focused view”

RV dimension

RV dimension
RV dimensions are highly dependent on probe rotation by the user → underestimation of RV width

2D assessment of RV
RV FAC (fractional area change) :
(end-diastolic area – end-systolic area) x 100 / end-diastolic area
Lower reference value < 35%
ESED
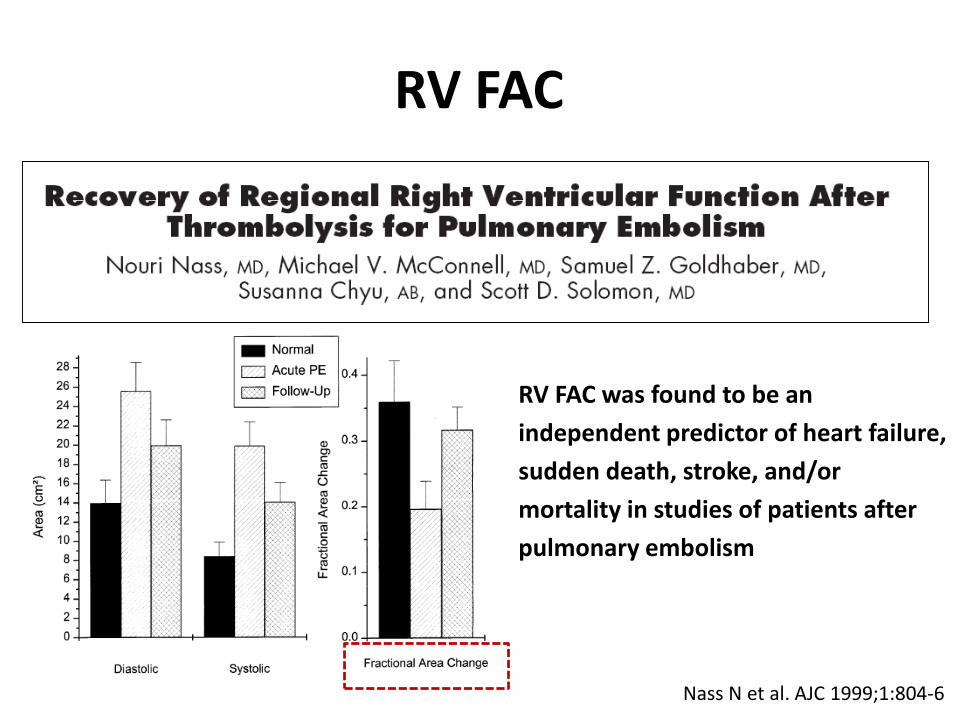
RV FAC
Nass N et al. AJC 1999;1:804-6
RV FAC was found to be an
independent predictor of heart failure,
sudden death, stroke, and/or
mortality in studies of patients after
pulmonary embolism

2D RV volume and EF
1. Area-length method
→ approximation of RV geometry, pyramidal or ellipsoidal models
→ underestimate RV volume and inferior to 3D
2. Disk summation method
→ determine a RV “body ”volume
→ underestimate d/t exclusion of the RVOT
2D estimation of RV EF is not recommended, because of the numerous geometric assumptions and heterogeneity of methods

3D RV volume and EF
3D RV volume correlate well with MRI-derived RV volumes

J Am Coll Cardiol 2007;50:1668–76

Lower reference limit of 3D RV EF = 44%

3D RV volume and EF
Limited normative data (difference method, small numbers)
Underestimate MRI-derived RV volumes
Time consuming (disk summation method )
Fewer data in dilated or dysfunctional RV

Non-volumetric assessment of RV function
Global assessment
- RV dp/dt
Regional assessment
- TAPSE
- TDI (S’, MPI)
- Doppler strain
- 2D strain

RV dp/dt (mmHg)
dp/dt is calculated by measuring the time required for the
TR jet to increase in velocity from 1 to 2 m/s
4 (2)2- 4(1)2 = 12mmHg
△time (s)
RV dp/dt < 400mmHg/s is abnormal

RV dp/dt (mmHg)
TR dp/dt = 359 mmHg/s

Simple technique with physiologic basis
Limited data in both normal and pathologic conditions
Load dependent
Less accurate in severe TR (RA pressure ↑)
RV dp/dt (mmHg)

TAPSE (tricuspid annular plane systolic excursion)
L = 16 mm

TAPSE
Represents longitudinal function
Less dependent on image quality
Rapid and reproducible
Angle dependent
Not valid in regional RV WMA
No large scale validation
Load dependent

MPI (myocardial performation index)
MPI = IVRT + IVCT / ET

Feasible in a majority of subjects w/o TR
Reproducible
Avoid geometric assumptions
Unreliable in differing R-R intervals (A-fib)
Load dependent
Unreliable in RA pressure ↑
MPI
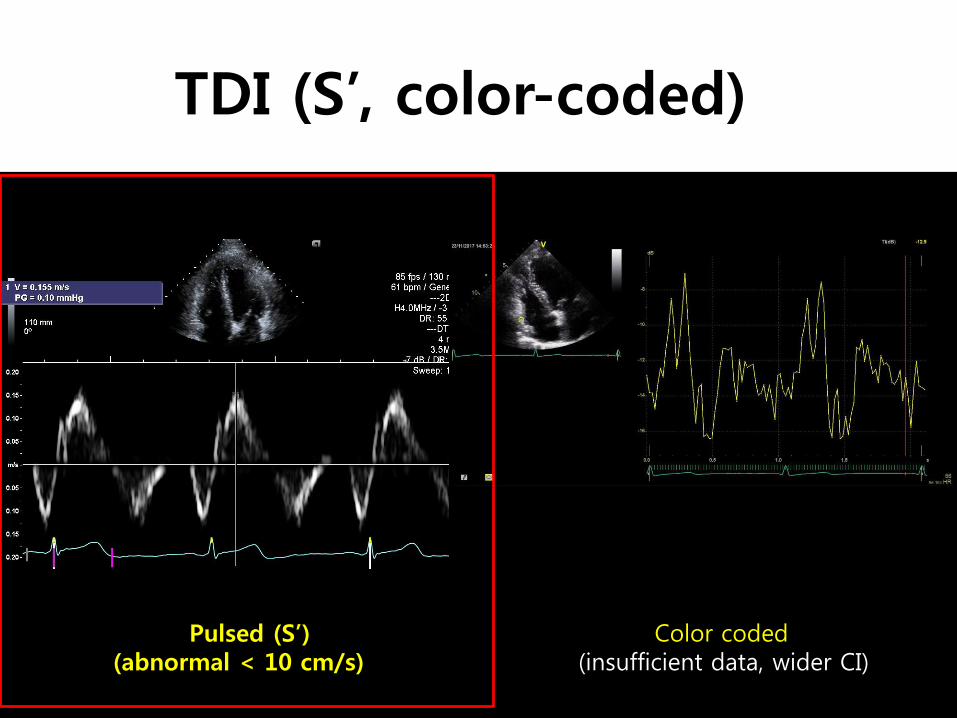
TDI (S’, color-coded)
Pulsed (S’)(abnormal < 10 cm/s)
Color coded (insufficient data, wider CI)

2D strain

2D strain
Relatively angle dependent
Provide regional function as well as global function
A lack of normative data
Different algorithm in different platforms
→ different normal ranges

Summary of RV systolic function estimates
*Lower/upper reference limit
FAC < 35%
TAPSE < 16 mm
S’ < 10 cm/s
Tissue MPI > 0.55
3D RV EF < 44%

Hemodynamic Assessment of RV and pulmonary circulation
1. Systolic pulmonary artery pressure
2. PA diastolic pressure
3. Mean PA pressure
4. Pulmonary vascular resistance

Pulmonary artery pressure
Determined by the
Amount of blood flow of the pulmonary circulation
(cardiac output)
Intrinsic properties of the vasculature
(resistance, compliance, and impedance)
LA pressure downstream of the pulmonary circuit

Normal >>>>>>> pulmonary vascular remodeling >> RV failure

Pressure-volume loop

Assessment of Systolic PAP
SPAP = eRVSP = 4 (V)2 + RA pressure
(w/o obstruction at the level of the RVOT or PV)
Normal estimated SPAP < 35mmHg

• RA pressure estimation
Systolic PAP

SPAP with aging
Circulation. 2009;119:2663-2670
The increased PAP was coupled with increases in pulse pressure and LV E/E’ → age associated vascular stiffening and diastolic dysfunction contribute to changes in PAP

Pitfall in severe TR
Early equalization of RV and RA pressures → underestimate the RV-RA gradient

PA diastolic pressure (PADP)
PADP = 4 x (end-diastolic PR velocity)2 + RAP
+

Mean PA pressure
= 1/3 (SPAP) + 2/3 (PADP)
= 4 x (early-diastolic PR velocity)2 + RAP

PVR (pulmonary vascular resistance)
• PVR = (TR Vmax / RVOT VTI) x 10 + 0.16
J Am Soc Echocardiogr 2009;22:814-9
TR RVOT
Significant PH is defined as a PVR > 3 WU

PVR (pulmonary vascular resistance)
Δ pressure = flow x resistance
• Non-invasive PVR - not recommended for routine use
• In subjects with exaggerated
↑ SPAP by high SV
↓ SPAP by reduced SV (despite ↑ PVR)

Summary (1)
For assessment of RV systolic function,
FAC, TAPSE, S’ and MPI is recommended
Combining more than one of the above measures more reliably distinguish normal from abnormal function, especially in patients with suspected RV dysfunction

Summary (2)
Improvements in 3D echo will result in increased use and have the potential to help in the clinical assessment of RV size and function
Hemodynamic assessment of pulmonary circulation (PAP, PVR) is crucial for better understanding of RV adaptation to PAH

경청해 주셔서 감사합니다